-
Defect recombination origin of low energy excess in semiconductor detectors
Abstract
When the detection threshold in semiconductor detectors is pushed to increasingly low energies, an “excess” signal of apparent energy release events below a few hundred eV is observed in several different kinds of detectors, hindering their sensitivity for rare event signals in this energy range. Using atomistic simulations with classical thermostat and quantum thermal bath, we show that this kind of signal is consistent with energy release from long-term recombination events of complex defects that can be formed by any kind of nuclear recoil radiation events. The recombination events are shown to have a very similar exponential dependence of energy as that observed in experiments. By detailed analysis of recombination events, we show that crossing a low energy barrier ( 0.1 eV) can trigger larger energy releases in an avalanche-like effect. This explains why large energy release events can occur even down to cryogenic temperatures.
I Introduction
One possible approach to detect light particle dark matter is by looking for low-energy recoil events in materials that cannot be attributed to conventional matter radiation events [1, 2, 3]. Similar methods are also used in coherent neutrino nucleus scattering experiments [4, 5]. This has motivated development of new detector technologies with lower and lower detection threshold.
When the detection threshold in semiconductor detectors has been pushed to increasingly low energies, an “excess” signal of apparent energy release events below a few hundred eV is observed in several different kinds of detectors [6, 7, 8, 9, 10, 11, 12, 13, 14, 15, 16, 17]. This excess will mask any potential dark matter signal, and therefore understanding its origin and possible ways to mitigate it are questions of utmost importance. Several different explanations have been offered to this excess, for instance electronic noise [18], stress effects/crack relaxation [19, 20] or solid state effects [21]. However, some recent experiments disfavor an explanation due to external stress or radiation [22]. It seems plausible that there are several components and several different causes of the excess events.
Although there are thus many uncertainties regarding the origin of the effect, on a general level we note that the excess signal is observed in detectors consisting of different materials, manufacturing techniques and different electronics with a very similar exponential energy dependence , where is aconstant. This suggests that there may be an inherent mechanism for the observed excess signal (consistent with the evidence for a solid state effects [21]).
In this Article, we analyze the possibility that the excess signal could originate from recombination of nanometer-size range defect clusters. It is well established from both experiments [23, 24, 25, 26] and simulations [27, 28, 29, 30, 31] that keV recoils in semiconductor materials such as Si produce small disordered zones in the material. Even if the material is not irradiated explicitly, cosmic rays or decay of radioactive impurities that are always present at some concentration in a material and its immediate surrounding environment will produce similar damage pockets. Even if the initial kinetic energy of a radioactive decay event may be in the MeV range, the final damage will be produced by keV recoils, since collision cascades at much higher energies split up into subcascades [32, 28, 33].
The nanometric damage regimes produced in such events are higher in potential energy than the pristine crystal structure, and hence are expected to thermally recombine towards the ground state at a time scale depending on temperature. Any recombination event will thus be associated with an energy release. While there have been previous works analyzing the recombination of radiation-induced disordered regions [27, 29, 34, 35], these have not systematically analyzed the energy distribution of the potential energy release events at cryogenic temperatures. In this article, we analyze this energy release systematically, and show that it leads to recombination events with an exponential energy dependence, very similar to that found in experiments.
II Methods
To examine the production of disordered damage zones and their possible energy release on extended time scales, we used a five-stage simulation and analysis procedure: (i) simulation of typical radiation damage creation, (ii) simulation of thermal annealing of this damage on long time scales, (iii) quenching of configurations to 0 K to obtain potential energy release without effects from kinetic energy fluctuations, (iv) obtaining the energy release in recombination events from the time dependence of the potential energy in stage (iii), and (v) analysis of the time scale of annealing. These results are presented in section III. Since at cryogenic temperatures quantum mechanical zero point vibrations can affect atom dynamics, we also employed a quantum thermal bath (QTB) [36, 37] to assess how quantum effects affect the annealing. Results of these simulations are included along with the fully classical ones in the results, and discussed in section II.2. Finally, to understand why annealing is observed even at cryogenic temperatures, we also analyzed what kind of atomic movements in individual recombination events lead to energy release (section IV).
II.1 Simulation and analysis stages
In all simulation stages (i-v), we used classical molecular dynamics [38]. Simulations were carried out mainly with the code PARCAS [39]. This code has been extensively used to examine radiation effects in a wide range of materials, and the results have been shown to agree well with experiments in many different measurable quantities [28, 40, 41, 42, 43, 44]. Some classical cases were also modelled with the widely used LAMMPS molecular dynamics code [45] and gave the same behaviour as the PARCAS results. The simulations with quantum thermal bath were all done with the LAMMPS codes; details on the specific quantum aspects of the modelling are given in subsection II.2. The analysis of annealing mechanisms in section IV were done with the LAMMPS code since this code has a built-in nudged elastic band (NEB) [46] feature that could be used in analyzing the energy barriers.
The interatomic interactions were described with the Stillinger-Weber potential [47], that has been found to describe well a wide range of properties in Si when compared to experiments [48, 49], DFT calculations [31] and modern machine-learned potentials [49]. We also tested the Tersoff III potential [50], which gave very similar results regarding the energy release. In the following parts of the paper, unless otherwise mentioned the results shown are obtained with the Stillinger-Weber potential.
In stage (i), we simulated the production of damage by recoil events in Si by simulating 5 keV cascades induced by self-recoils in bulk silicon. The energy of 5 keV is above the energy at which cascades break into subcascade in Si, i.e. the specific damage pockets produced by higher energy recoils are similar to those produced by 5 keV ones [28, 51]. The cascades were modelled following standard approaches [28, 52]. Briefly, the cascades were initiated in random directions in 3 dimensions with equal weighting of different directions by solid angle and the development of the cascade was simulated until the system cooled down back to the ambient temperature (0 K in the cascade phase). No temperature or pressure scaling was used in the collisional regions, and heat was removed at the system boundaries. Since in the current work, the emphasis is energy release from damage rather than the production process itself, we did not include the electronic stopping power [53] in the simulations. The simulation cell consisted of a cube with 16 unit cells in each dimension (i.e, a total of 32768 atoms) and periodic boundaries were used in all dimensions. This cell size was slightly smaller than what was normally used in cascade simulation, due to the necessity to be able to simulate annealing over long time scales. To ensure that no thermally induced annealing occurs in these damage generation events, the ambient temperature of the system was 0 K.
In stage (ii), the damage produced in 5 keV cascades was annealed in thermal equilibrium runs over long time scales. In most cases we used 3 ns as the annealing time, but we tested annealing time up to 30 ns. The annealing runs were done for temperatures in the range of 0.05 - 800 K. To enable analysis of damage recombination events that can occur quite rapidly, the atom coordinates of all atoms were output every 2 ps throughout the entire simulation. In the annealing runs, Berendsen temperature control was used on all atoms with a time constant fs and pressure control to 0 pressure with a time constant of fs.
In stage (iii), the atom coordinates output from the annealing run were extracted every 2 ps, each one separately, as input coordinates for quenching. The quenching simulations were performed efficiently using Berendsen temperature control [54] towards 0 K while zeroing the velocity of any atom on which the force vector was in opposite direction to the velocity vector , i.e. if . Using this efficient approach, a quenching time of 1 ps was enough to get the system temperature down below 0.01 K. The quenching was done every time when the atom coordinates were output in the 3 ns (or longer) annealing runs, and the final potential energy was recorded after quenching.
In stage (iv), the potential energy vs. time in stage (iii) was analyzed with respect to energy release. After quenching to 0 K, the energy release events were found to be clearly distinct from minor random fluctuations in potential energy that was eV. To get the total energy release from one recombination event, when energy release eV occurred on subsequent 2 ps time intervals, the energy was summed up as the total release in the same event. Subsequently a statistics of the magnitude of energy release was made. This can be compared with the experimental observations of energy release.
In stage (v), the annealing time scale was analyzed by fitting a stochastic time scale law to the data on the time dependence of annealing obtained from molecular dynamics. This allowed us to quantitatively show that annealing of amorphous pockets can occur even at extremely low temperatures relevant for superconducting transition detectors.
For defect analysis, the number of defects in the simulation cells was quantified with the Wigner-Seitz (WS) method [28], which is a geometric method completely independent of the potential energy analysis. This measure is used to quantify the number of defects because its definition has no adjustable parameters, and it gives defect numbers roughly consistent with the simple Kinchin-Pease damage prediction in Si [28, 52]. However, considering the complex nature of the damage pockets in Fig. 2, it is clear that in Si “the number of WS defects” does not correspond to any geometrically simple point defect type such as an isolated vacancy or interstitial. Hence we use the term “the number of WS defect pairs” as the notation of this defect measure.
II.2 Quantum thermal bath simulations
To assess how significant quantum mechanical zero point vibrations [55] are on the annealing time scale and mechanisms, we employed the quantum thermal bath (QTB) approach [37, 36] as implemented in LAMMPS. This QTB thermostat is a Langevin-style thermostat with a specially tuned noise term that agrees with the energy spectrum of quantized vibrations in crystals. This thermostat does not cause significant extra computational cost compared with standard molecular dynamics, which is a great advantage compared with other methods, for instance, path integral molecular dynamics[56].
The equation of motion is a Langevin style formula, where is interatomic force, is the damping constant and is the noise term:
| (1) |
The power spectral density of the noise term is:
| (2) |
In the implementation we use [37], the quantum thermal bath has five input parameters, namely, target quantum temperature, damping parameter, a random seed, upper cutoff frequency and the number of frequency bins. To make the results comparable with the classical molecular dynamics simulations, we set the damping parameter to be 0.3 ps (300 fs), the same one used in the purely classical simulations. The upper cutoff frequency was set to be three times the Debye frequency of silicon. The number of frequency bins was 100 in all QTB simulations. When using the thermostat, a Berendsen barostat with the settings in section II.1 was also applied to the system.
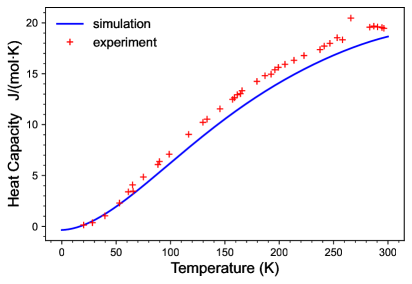
To check whether these settings enable the compensation of low temperature quantum effect, the heat capacity of pure silicon crystal was calculated by differentiating the mean total energy with respect to temperature, and the result was compared with experiment [57]. The heat capacity curve shown in Fig. 1 demonstrates that QTB thermostat can reproduce the temperature dependence of heat capacity at low temperatures.
With the help of quantum thermal bath, the annealing behavior of the system at very low temperatures can be investigated directly. The five-stage simulation and analysis procedure in section II.1 was followed, and quantum thermal bath was used in stage(ii) for the annealing simulations.
III Results and discussion
III.1 Stage (i) Damage production in cascade simulations
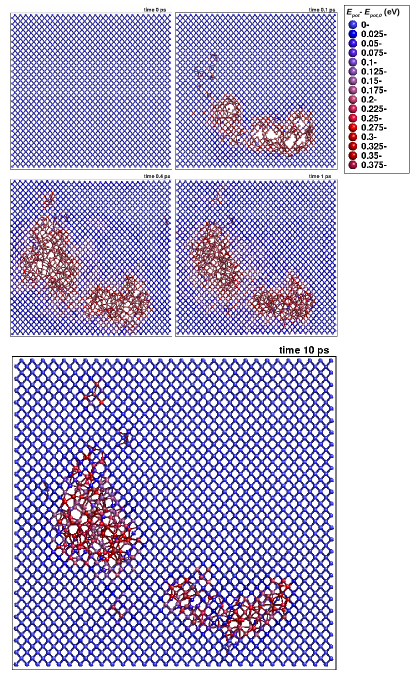
An example of a cascade event and the damage produced is shown in a cross-sectional plot in Fig.2. The cross-section shows a very typical damage production event, analyzed in detail in many previous works [58, 28, 52]. As noted above, 5 keV is above the subcascade threshold breakdown, so the damage is split into separate damage production regions. 1000 different 5 keV cascades were simulated, and the final atom coordinates from these were used for annealing runs, quenching and energy release analysis.
III.2 Stage (ii) Annealing simulations
For the classical molecular dynamics simulations, annealing simulations were performed at several temperatures in the range 20 - 800 K for some of the cells, and at 200 K for all the cells. For the Tersoff potential, annealing was done at 300 K for all the cells (since the Tersoff potential has a higher melting point than the Stillinger-Weber and experimental one, 300 K corresponds to roughly the same homologous temperature as 200 K for the Stillinger-Weber potential). For simulations with QTB thermostat, the annealing simulations of 10 ns were conducted at 0.05 K, 10 K, 25 K, 50 K, 100 K, 150 K, 200 K and 300 K. At each temperature, at least 200 annealing simulations with different initial damage were carried out.
Results for the number of defects in the cell as a function of time are shown in Fig. 3 a) for a test 600 K annealing run via classical molecular dynamics. The potential energy has huge fluctuations because a thermodynamic system with a small number of atoms has natural fluctuations of the kinetic energy around the average of the order of [59]. Since the total energy remains the same on short time scales, the fluctuations in kinetic energy are also reflected in the potential energy. The fluctations make it very difficult to obtain a quantitative analysis of the potential energy release in a single recombination event. This was the reason why we took into use the quenching scheme to get rid of thermal fluctuations.
a) 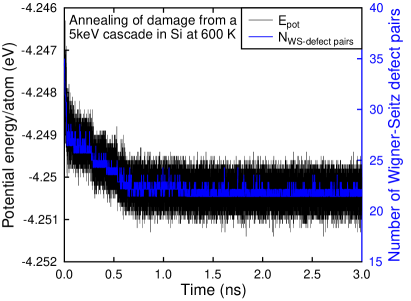 b)
b) 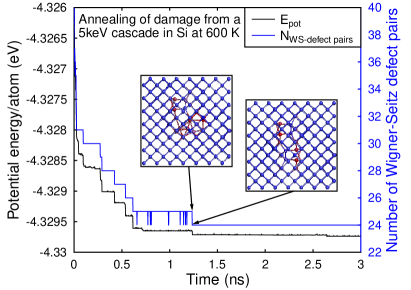 c)
c) 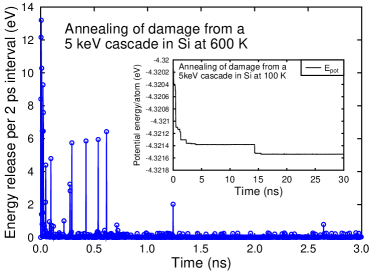
III.3 Stage (iii) Quenching runs
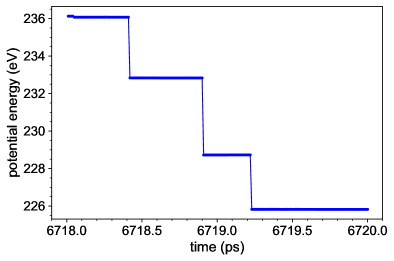
Results of the potential energy and number of WS defect pairs after the quenching scheme (see section II) are shown in Fig. 3 b), for the exact same annealing run as shown in part 3 a). This graph shows much clearer that after the first about 10 ps, the annealing proceeds stepwise, with clear energy release events occuring every now and then, separated by (on the atomic scale) long times when essentially nothing else than thermal vibrations of atoms around their stable or metastable local equilibrium positions happen in the system. The energy releases also correlate very well with decreases of the number of Wigner-Seitz defects, confirming that the potential energy release is indeed associated with partial annealing of damage in the amorphous pockets.
From the potential energy release, one can also obtain the magnitude of the energy released in each annealing event by comparing the total potential energy of the system (after quenching) before and after each 2 ps annealing interval. This is shown in Fig. 3 c) for the same annealing run as in parts a) and b). The graph shows that the energy release varies from an annealing event to another.
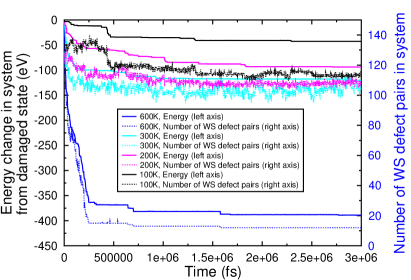
We ran similar annealing runs for a few cascades in the temperature range 20 – 800 K. Results for an exemplary case in Fig. 4 show that, as expected, at the highest temperatures efficient annealing of the damage is observed. This is in agreement with the experimental observations that Si cannot be amorphized above about 600 K [60].
However, we also observe that even at the much lower temperatures, down to 100 K, damage recombination is observed throughout the 3 ns simulations. Also in the test 30 ns simulations, recombination events kept occurring throughout the entire simulation time: an example of recombination occurring around 15 ns after the cascade event at 100 K is seen in the inset of Fig. 3 c). We note that Beland and Mousseau have earlier, at 300 K with a hybrid molecular dynamics/barrier search approach, observed annealing events on macrosopic, up to 1 s, time scales [35]. Occasional recombination events are observed in the 50 and 20 K simulations even in the classical simulations with no quantum thermal vibrations. An explanation to this surprising observation is given in section IV.
III.4 Stage (iv) Statistics of energy release
To enable a comparison with the experimental observations of the energy dependence of the low-energy excess, we made a statistics of the annealing data similar to that shown in Fig. 4 but summing up all events over at least 50 independent cases (separate cascades) to obtain a statistically better picture of the annealing.
Since the main aim of the current work is to compare the results with the experimentally observed exponential low-energy excess signal, we plot the results with a logarithmic axis vs. linear axis for the energy.
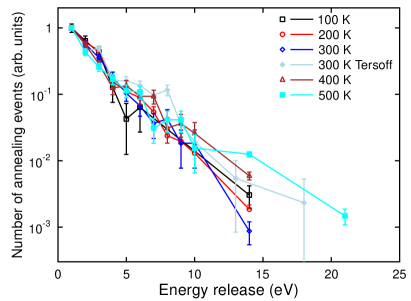
For classical molecular dynamics simulations the results for the temperatures 100 - 500 K are shown in Fig. 5 (a). Also included in this plot are results obtained with the Tersoff interatomic potential at 300 K. The results show that, remarkably, the energy release statistics is independent of temperature in the range 100 - 500 K within the statistical uncertainty. This gives high confidence that also lower temperatures would show a similar dependence with energy. Moreover, the Tersoff interatomic potential gives results practically identical to those of the Stillinger-Weber potential. Since the Tersoff and Stillinger-Weber potential are developed completely independent of each other, have different functional forms, and are fitted to different properties [50, 47], this gives high confidence that the obtained results are not an interatomic potential artifact.
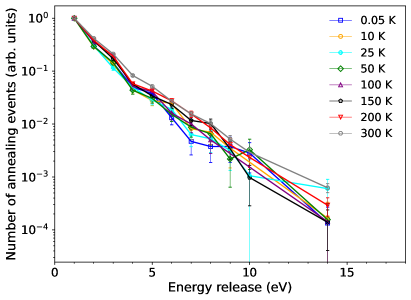
For simulations with QTB themostat, the results at various temperatures are shown in Fig. 5 (b). It is very clear that the energy release statistics is independent of temperature.
In both Fig. 5 (a) and Fig. 5 (b), the data are clearly close to linear on the log-lin plot, showing that the energy release statistics follows an exponential dependence with energy, in agreement with the experimental observations [6, 7, 8, 9, 10, 11, 12, 13, 14, 15]. As expected from the linear dependence of the plots, the data can be fit very well with the functional form
| (3) |
where is the energy release and and are fitting constants. The fits were done with the Levenberg-Marquardt approach for least square fitting of arbitrary functional forms [61, 62]. The same functional form has been used earlier to fit the low-energy tail of the experimentally observed energy releases [18, 63]. Results for the fits of the slope coefficient are given in table 1. Considering the statistical uncertainties, one can conclude that the slope of the energy release depends either very weakly or not at all on temperature.
a)
 b)
b)
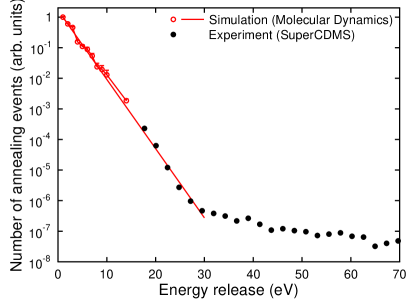
The simulated and experimental data from a silicon detector are compared to each other in Fig. 6. The axis scale is in arbitrary units, since in experiments the absolute values of the signal depends on factors such as detector size, detection efficiency, concentration of radioactive impurities creating the initial damage, and damage recoil spectrum, all of which are not fully well known. However, the functional dependence of the signal on energy can be used for a direct comparison between simulation and experiments. The figure shows a very good agreement: both the simulation and low-energy tail of the experimental data clearly follows an exponential trend with a very similar slope. The slope obtained from a fit to the simulation data at 0.05 K (QTB thermostat) was 1/eV, which is in perfect agreement with a fit of the same exponential law to the low-energy tail of the experimental data citeHei22 1/eV (to enable direct comparison, this value was obtained by fitting the experimental data with the same software as used to fit the simulated ones). We emphasize that no fitting of the simulations to the experiments has been used for obtaining this outstanding agreement.
| T (K) | Type | (1/eV) | |
|---|---|---|---|
| Simulation | 500 | Class. | 0.49 0.03 |
| (current work) | 400 | Class. | 0.49 0.03 |
| 300 | Class. | 0.53 0.03 | |
| 300 | Qtb. | 0.52 0.01 | |
| 200 | Class. | 0.52 0.02 | |
| 200 | Qtb. | 0.51 0.02 | |
| 100 | Class. | 0.60 0.05 | |
| 100 | Qtb. | 0.58 0.07 | |
| 50 | Qtb. | 0.52 0.06 | |
| 25 | Qtb. | 0.49 0.04 | |
| 10 | Qtb. | 0.50 0.06 | |
| 0.05 | Qtb. | 0.58 0.05 | |
| Experiment | 0.04 | – | 0.57 0.01 |
III.5 Stage (v) Analysis of annealing time scales
We finally analyze the time dependence of the annealing events such as those shown in Fig. 3 and 4. To be able to roughly estimate the annealing time scales as a function of temperature and extrapolate to even lower temperatures, we analyzed the time dependence of the annealing curves.
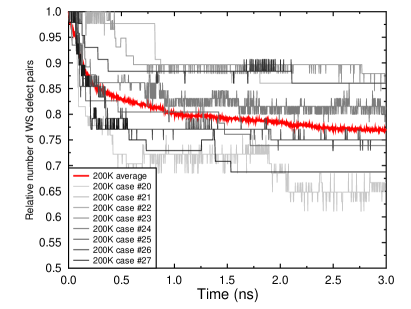
Since the number of disordered pockets in a single event is small, the annealing curves of single events have huge statistical fluctuations. This is illustrated in Fig. 7. To obtain a statistically reliable analysis, we carried out an analysis of at least 200 different cascade events in the temperature range 0.05 – 300 K. To be able to compare cases with different numbers of initial defects and stored energy in them, the analysis was done for the average relative fraction of potential energy remaining at time compared to the initial potential energy at . The fraction was calculated for each cascade event separately before averaging. The results of the averaged fraction analysis are shown in Fig. 8. As expected, time evolution of the fraction of remaining Wigner-Seitz defects showed a similar behaviour.
The averaged annealing curves show that the annealing behaviour can be divided in two stages: a rapid annealing occurring roughly during the first 0.5 ns after the damage event, and a subsequent much slower annealing after this. The first stage clearly is due to recombination of the most metastable defects, whereas the later recombination is an average over occasional well-separated recombination events (corresponding to the late energy release events shown in Fig. 3).
By comparing the individual cases shown in Fig. 7, an additional important point is illustrated: the damage in some events (those with large damage pockets) can anneal much slower than the average release. On long time scales, annealing from such cases would dominate the residual recovery signal.

| T (K) | Type | (ns) | |
|---|---|---|---|
| 300 | Class. | 66.38 0.29 | |
| 300 | Qtb. | 56.19 0.20 | |
| 200 | Class. | 140.86 0.47 | |
| 200 | Qtb. | 109.33 0.41 | |
| 150 | Class. | 348.8 1.4 | |
| 150 | Qtb. | 172.53 0.46 | |
| 125 | Class. | 451.5 1.8 | |
| 100 | Class. | 1037.8 3.1 | |
| 100 | Qtb. | 388.0 1.3 | |
| 50 | Qtb. | 769.8 2.5 | |
| 25 | Qtb. | 1070.9 2.4 | |
| 10 | Qtb. | 1234.0 3.3 | |
| 0.05 | Qtb. | 1326.1 3.7 |
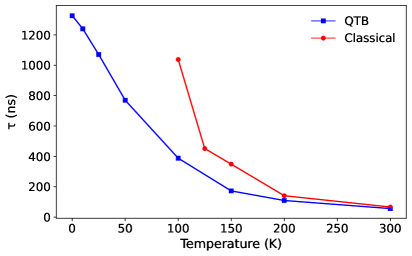
The curves in Fig. 8 were fitted against the exponential function . In the fitting practice, the initial 1 ns in the potential energy curves was truncated, and the rest of the curves were fitted. The fitting results and the comparison with the results from purely classical annealing are shown in Fig. 9 and table 2.
From these results, it is very clear that the low temperature quantum effect can facilitate annealing significantly. The simulation at 0.05 K with QTB thermostat shows that the annealing time parameter has a magnitude of microseconds at the operation temperature of the detectors. The fact that at 10 K and 0.05 K time constants are almost the same indicates that at temperatures K, the triggering of annealing effects is dominated by the quantum effect.
The exponential decay of annealing effects could be detectable if the time resolution of the experiments is shorter than the time constants . Conversely, in case the time resolution is much longer than this, the energy release events would seem to appear at random times with average constant rate (that would be determined by the concentration of radioactive impurities that produce the initial damage).
IV Avalanche mechanism of low-temperature annealing
The observation described in subsection III.3 of annealing occuring at cryogenic temperatures may seem surprising, as the temperature of 100 K corresponds to only roughly 0.01 eV/atom, much lower than the chemical bond energy of roughly 2 eV/bond. It is also not consistent with the traditional picture of radiation damage annealing being described to be caused by point defect migration with well-defined migration barriers.
However, the result can qualitatively be understood as follows. The complex disordered damage pockets (cf. Fig. 2) will inadvertently have metastable bonds with a much lower energy barrier to recombination. Furthermore, once a metastable bond recombines towards the ground state energy, it can induce a localized recombination “chain reaction”: one bond starts annealing, then the released energy heats up the sample locally which can induce additional bond recombination. To illustrate this argument with a rough calculation, even a low energy release of 2 eV of one recombining bond corresponds to a transient heating of the nearest ten atoms by about 1000 K. To quantify this deduction, we now analyze in atomic-level detail what kind of mechanisms can lead to the energy releases of several eV’s even when the temperature is so low that thermal activation cannot possibly lead to crossing an energy barrier in the eV range.
To do the analysis, some of the the 2 ps intervals where energy release events took place were picked out. Annealing simulations were restarted at the beginning of these intervals, and atomic information was recorded every 10 fs. The atomic configuration extracted every 10 fs became the input for quenching. Quenching was performed in the same way as before (Section II) to find out energy minima along the reaction path. Finally, transition state search by NEB method was carried out between neighboring energy minima to find out the energy barriers.
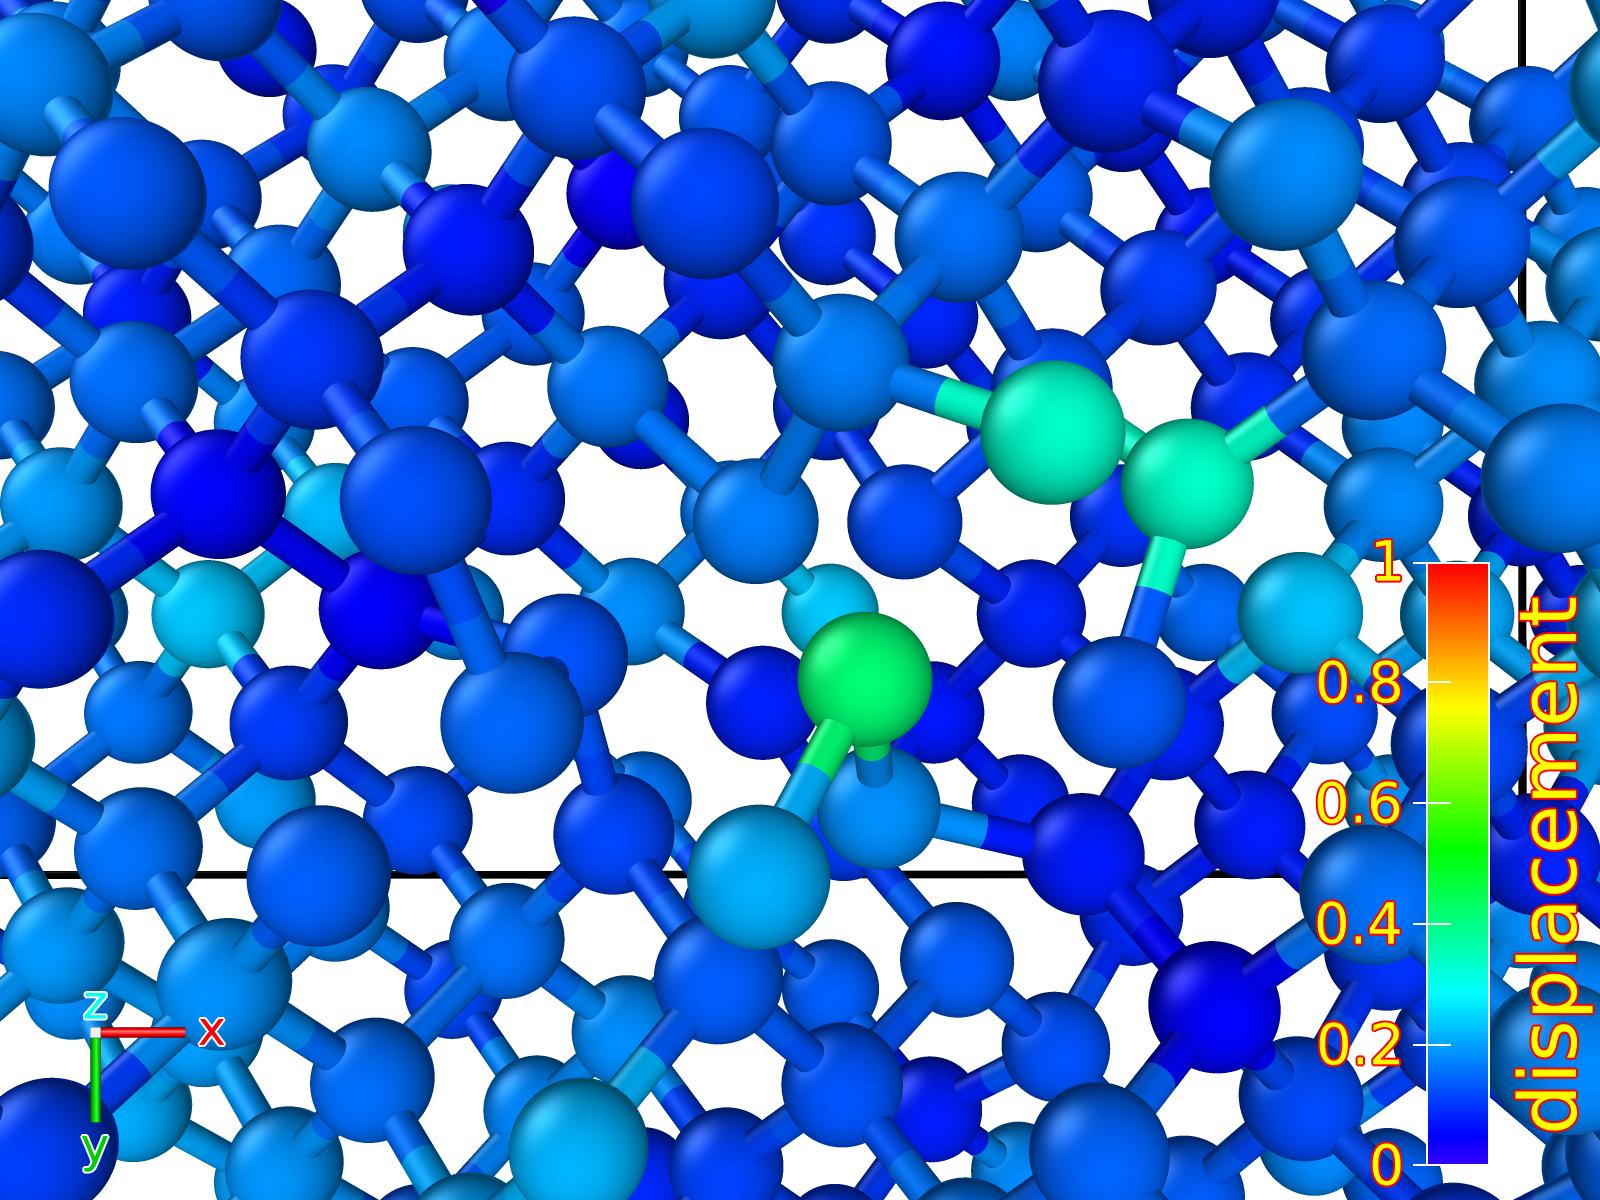
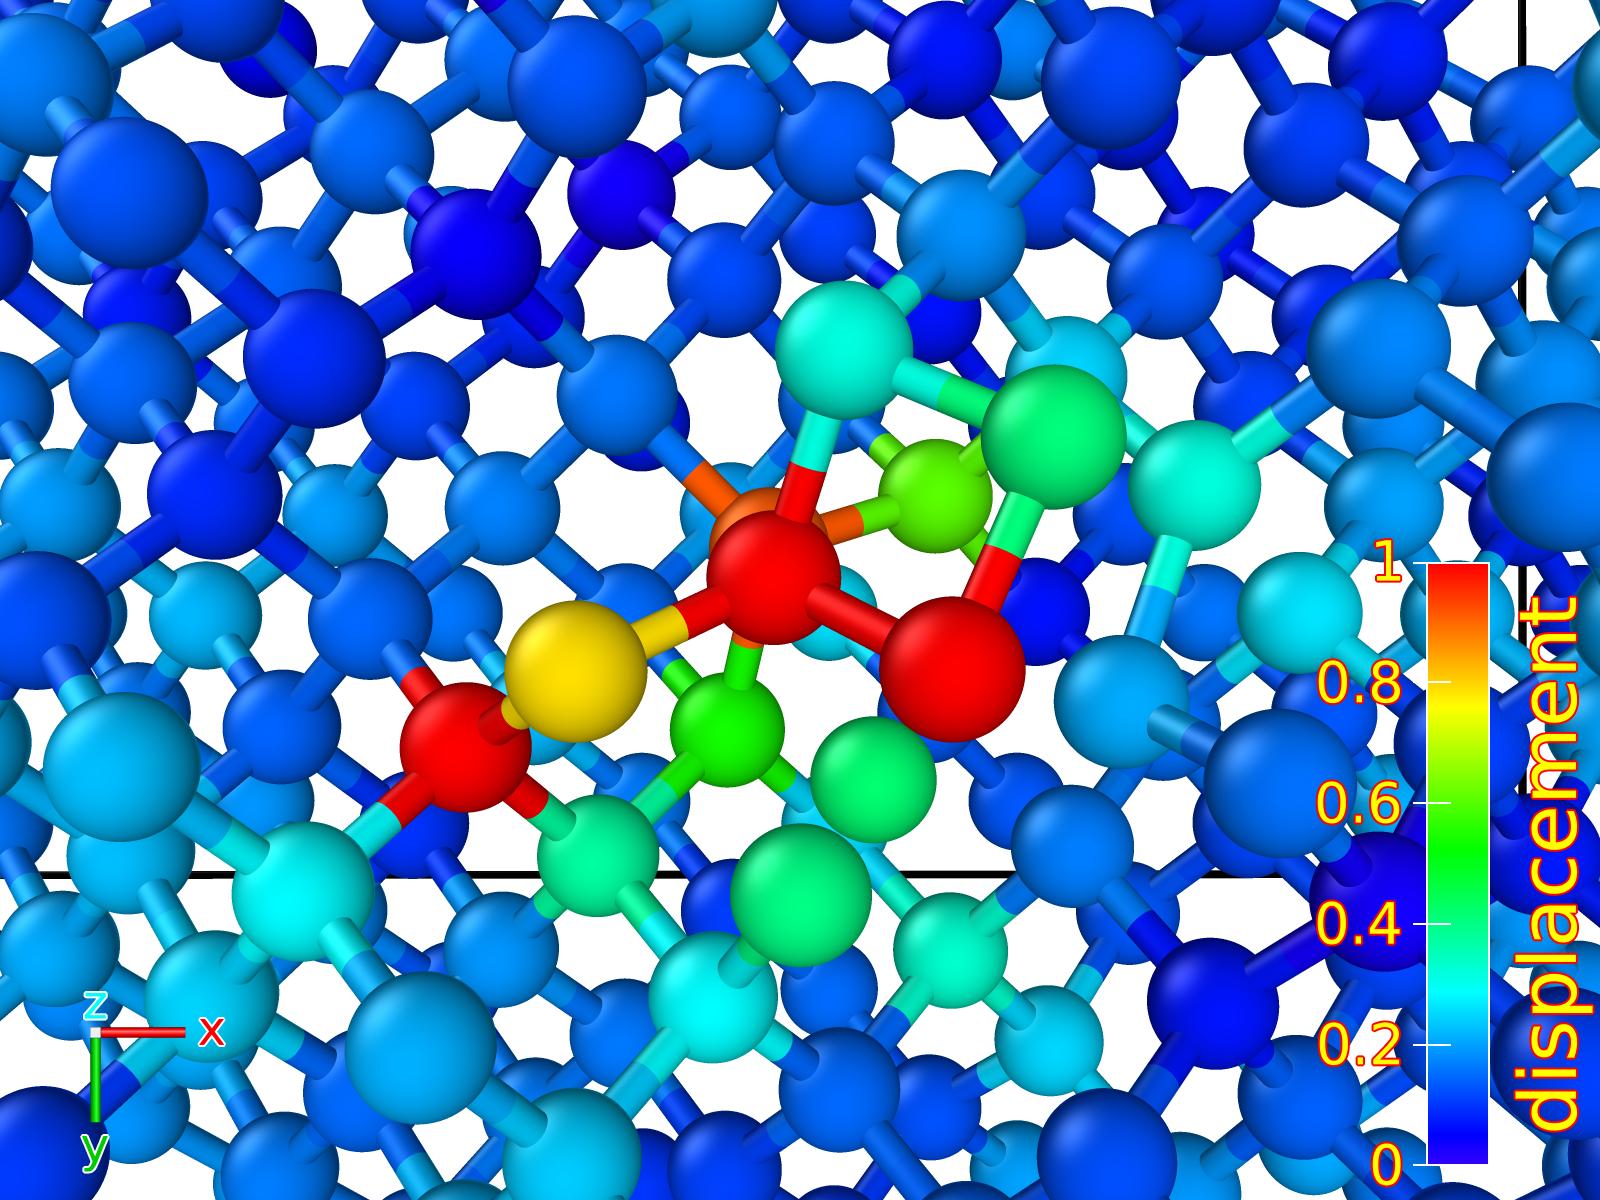
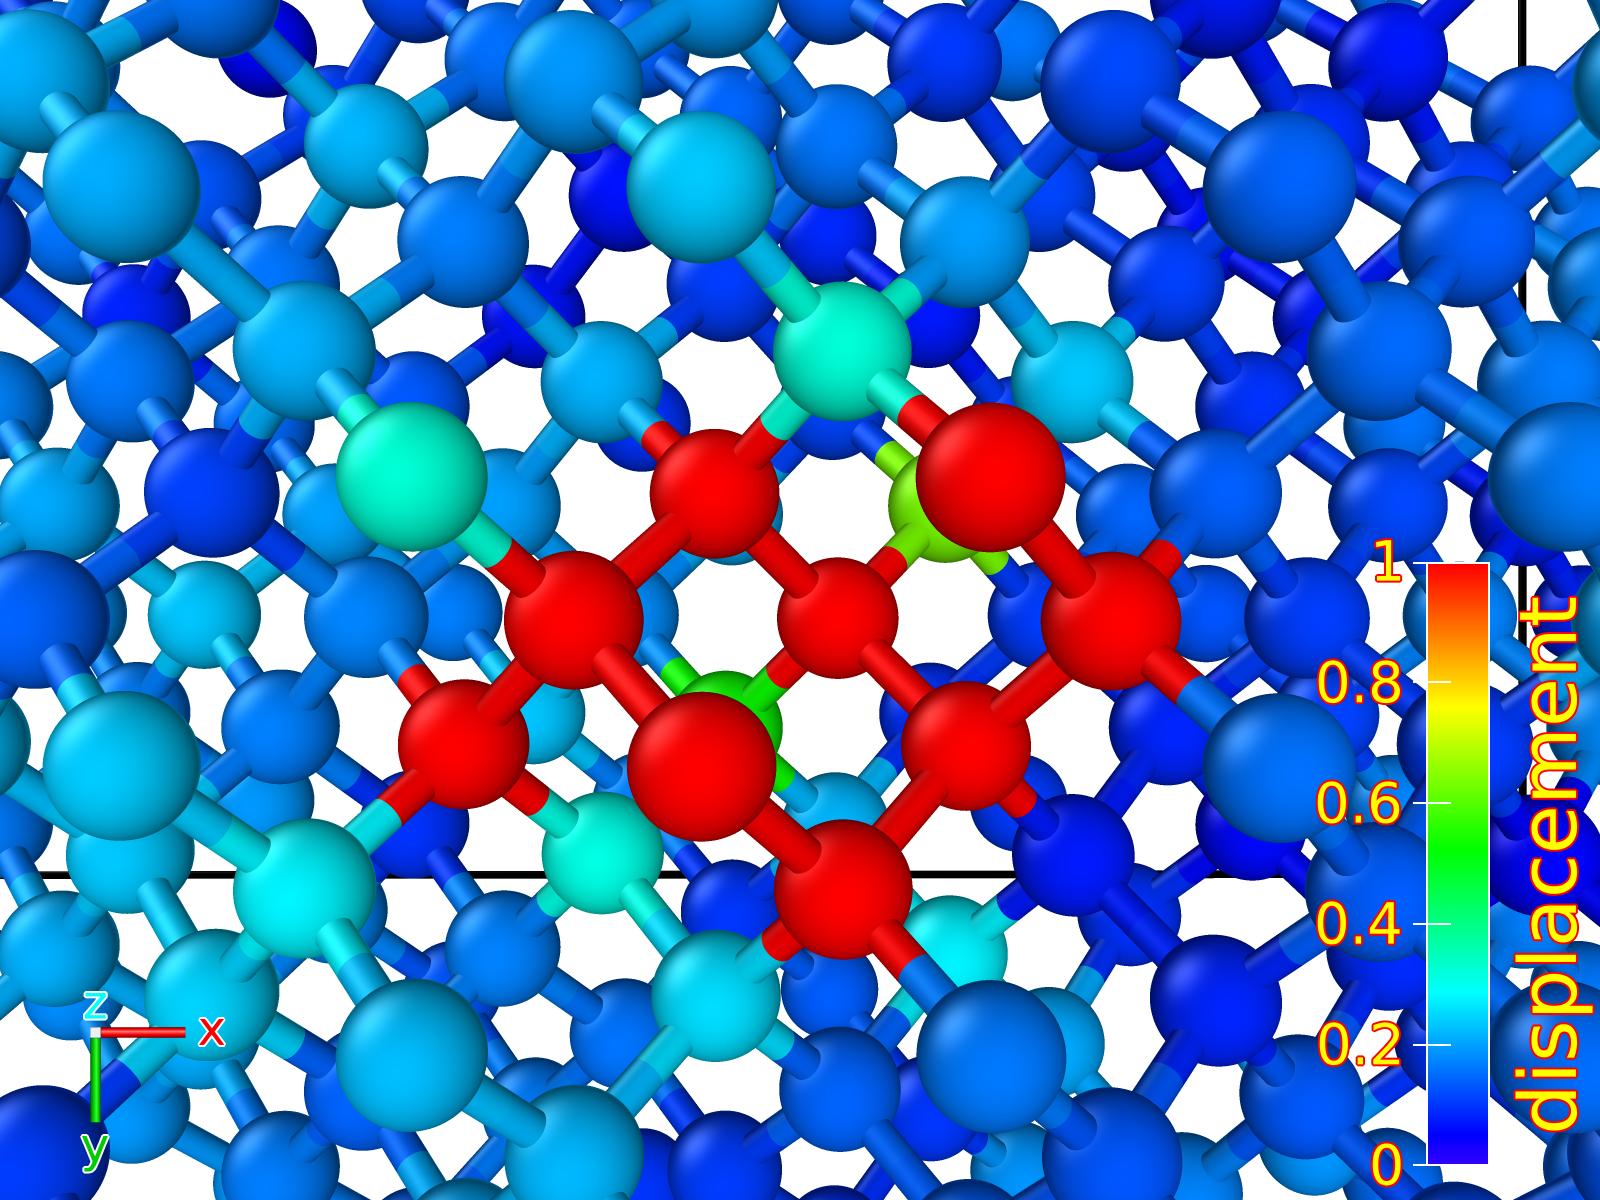
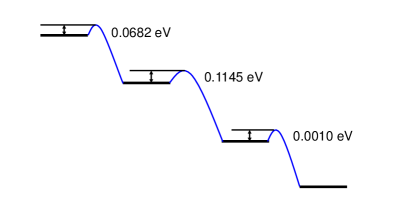
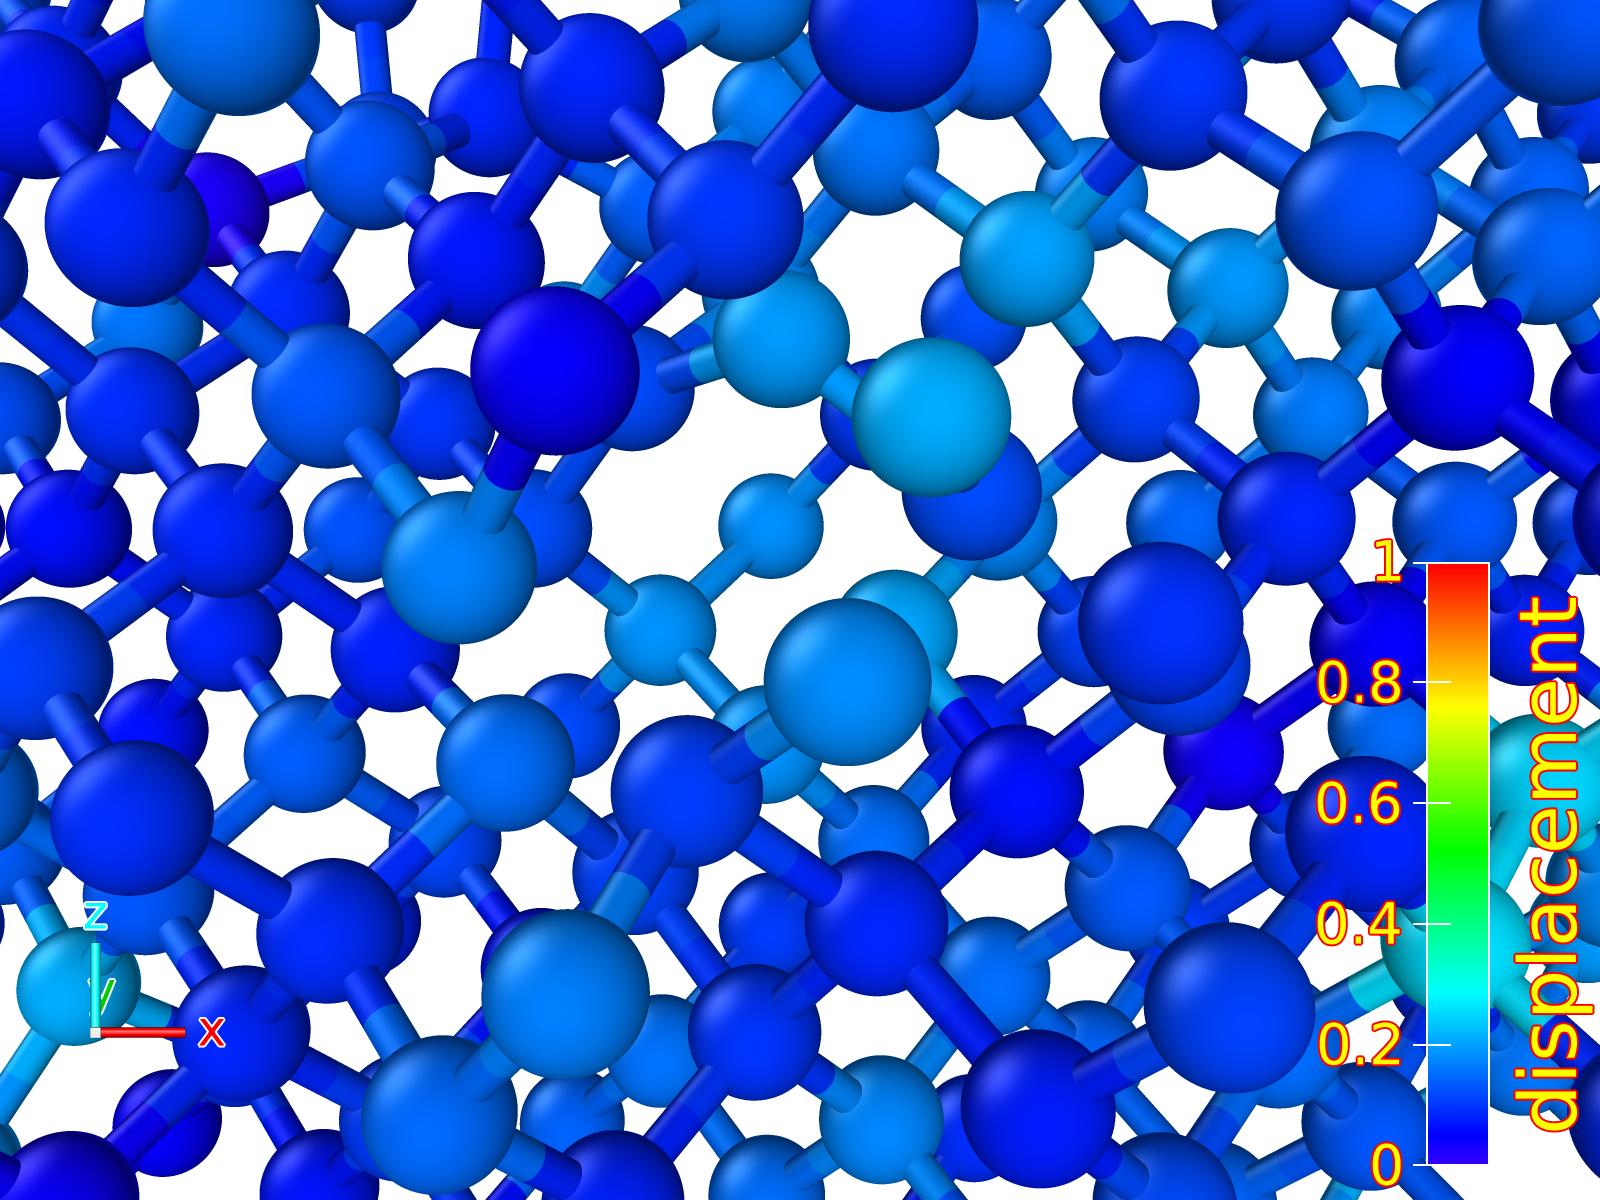
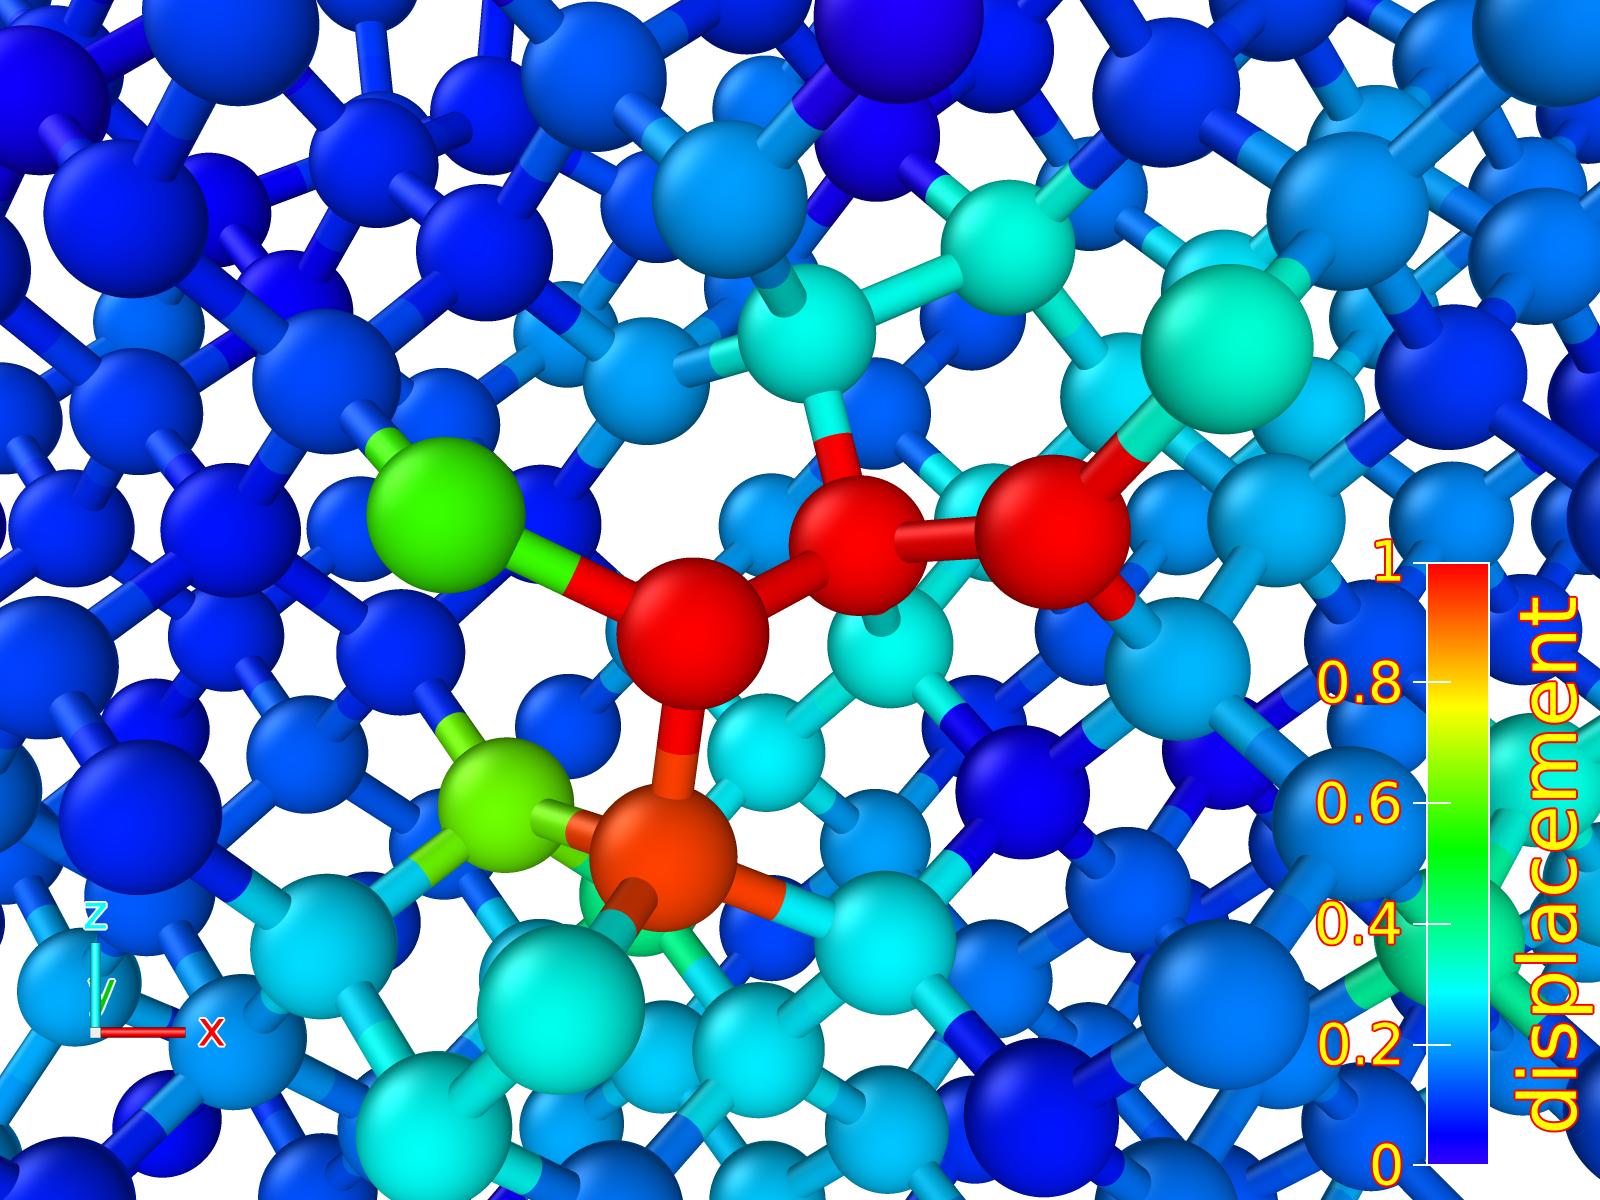
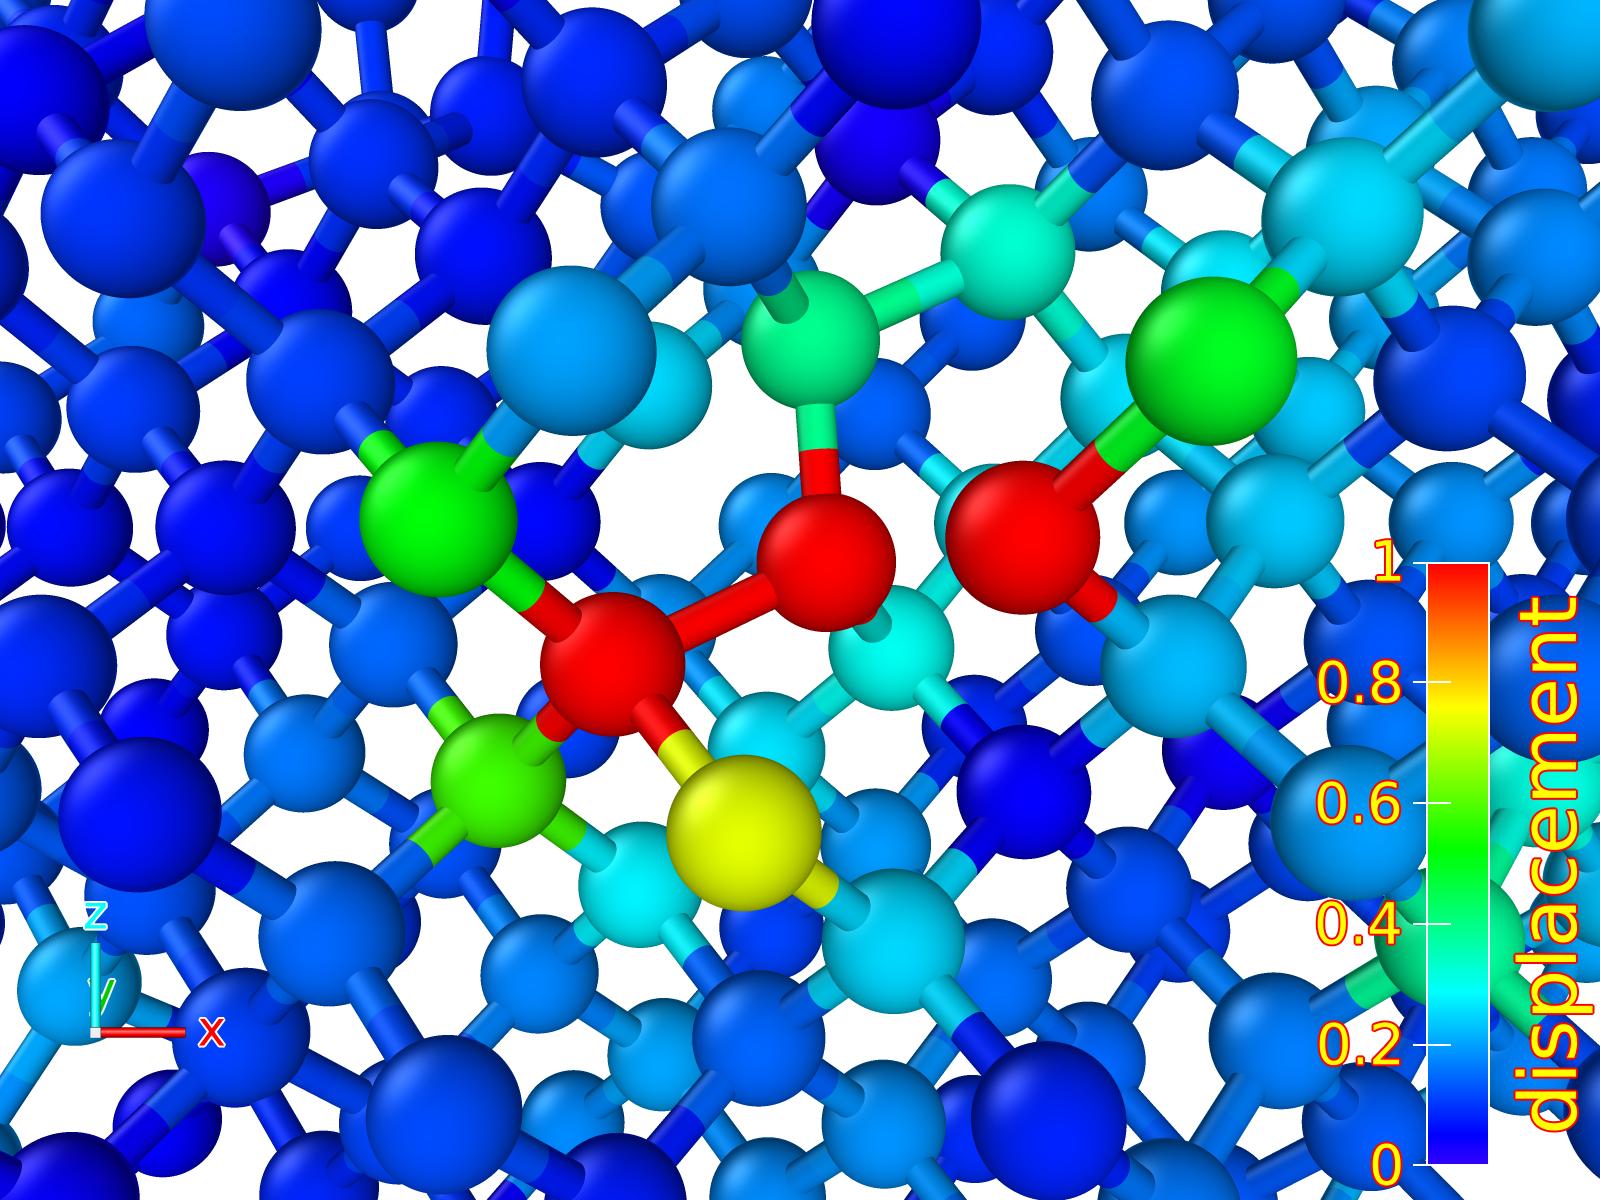
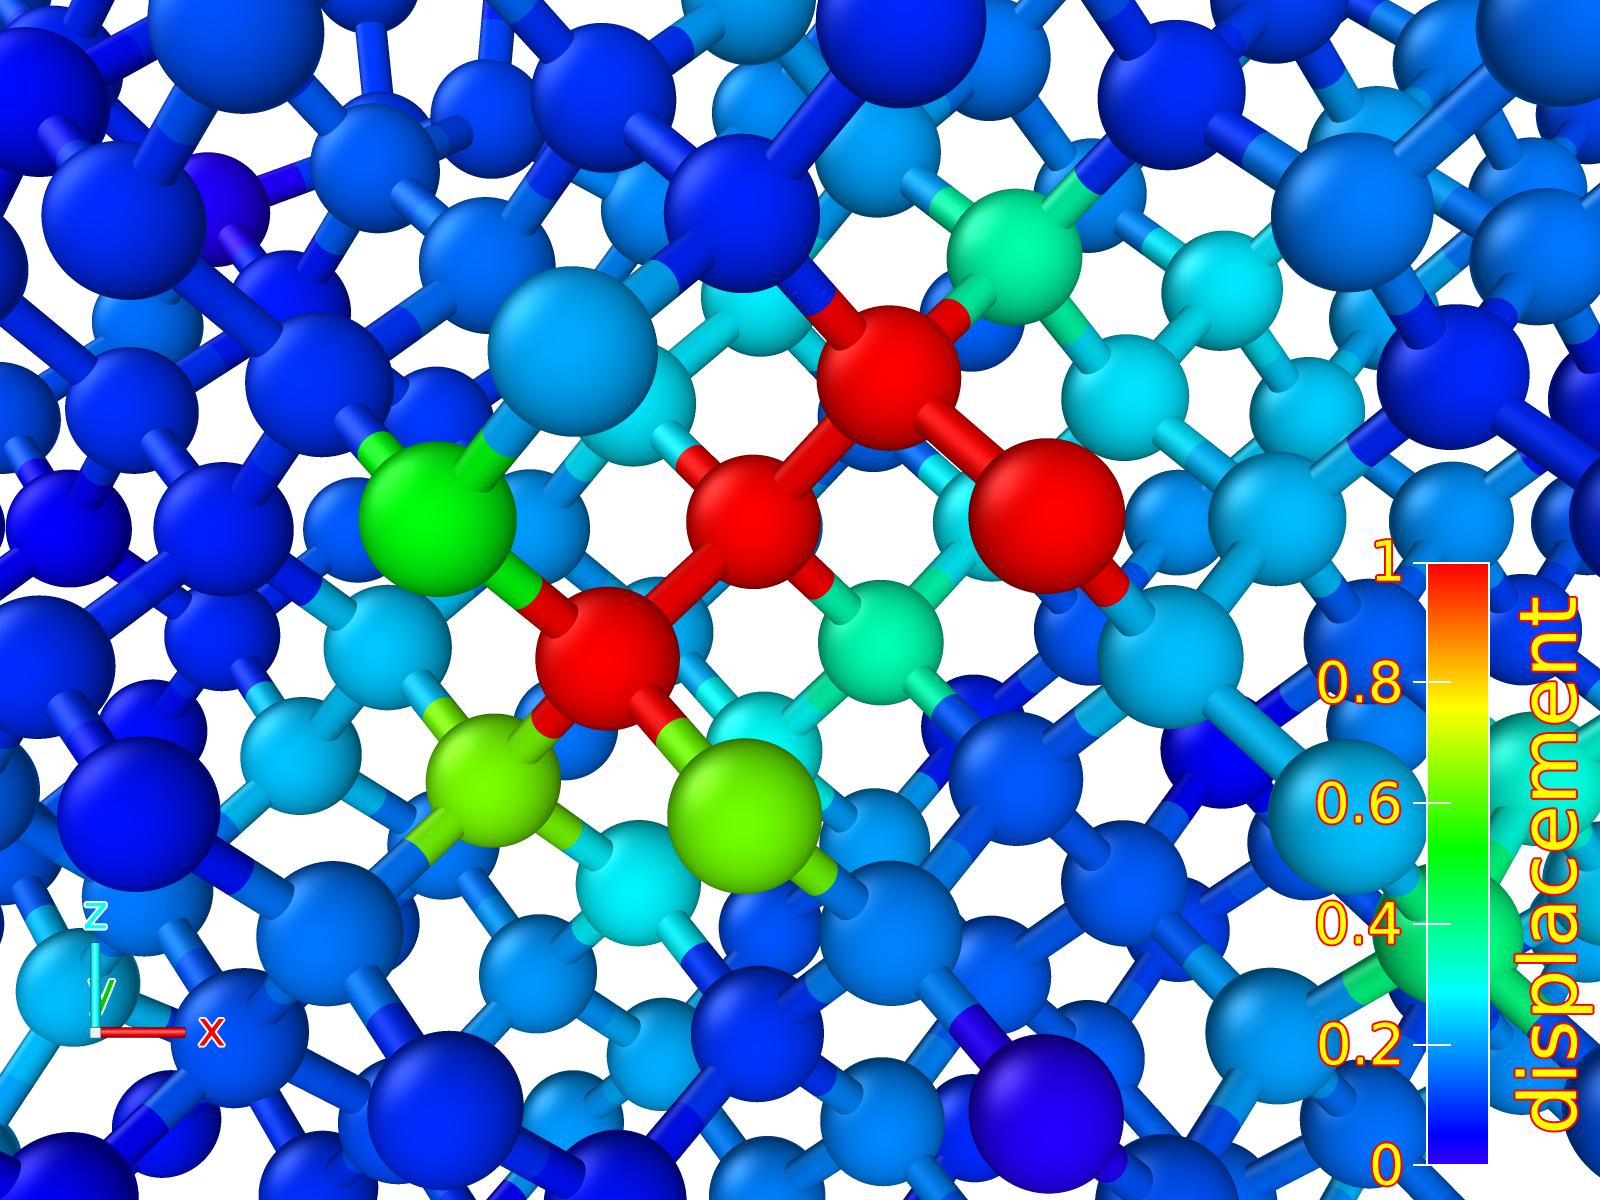
Fig. 10 and Fig. 11 shows two energy release events whose energy release are larger than 8 eV, taking place at 0.05 K (QTB thermostat). In Fig. 10 and Fig. 11, (c)(d)(e)(f) shows the atomic motion. Both of the events go through multiple steps of energy drops, instead of releasing all energy at once. From Fig. 10 (b) and Fig. 11 (b) we see that the energy barriers of the fundamental steps are lower than 0.1 eV, making it possible for the energy releases to take place at very low temperatures. Moreover, both events involve the migration of several atoms, not just one or two of them.
a)
|
b)

|
c)
|
d)
|
e)

|
f)
|
a)

|
b)
|
c)
|
d)
|
e)
|
f)
|
The results show that at cryogenic temperature, all energy barriers for annealing are very small, and most, if not all of them, are below 0.1 eV. If a metastable configuration overcomes a small energy barrier at first, additional atom rearrangement nearby can be triggered, and much more energy can be released, which can be viewed as an “avalanche” effect. In other words, the effect is a variety of self-organized critical phenomena, well known e.g to explain dynamics in sandpiles [65, 66].
Since the primary radiation damage event will lead to a multitude of complex damage configurations, there is no minimum temperature at which annealing can occur, as there will be barriers of all height present. Therefore, energy release avalanches can be triggered at any temperature.
V Discussion and conclusion
The main result of this paper is that recombination of damage produced by radioactive events can cause energy release on very long time scales after the damage production, even at cryogenic temperatures. The simulations in this work were done on silicon, but considering that it is known that other covalently bonded semiconductor materials such as Ge and GaAs produce damage in very similar (and even larger) damage pockets as Si [23, 24, 67, 68], it is very likely that very similar behavior would occur in also other covalently bonded semiconductors.
Many ionic materials also undergo amorphization [69, 70, 71], and hence a similar mechanisms might be active in at least some of them. Elemental metals do not amorphize [72], however, metastable damage pockets can be formed in them in the form of ordered damage clusters (e.g. C15 structure) and dislocation loops [73, 74, 75, 76]. However, separate simulation work with appropriate interatomic interaction models for ionic and metallic materials would be needed to deduce whether energy release from such structures would have a similar energy dependence.
The effect described in this paper has a time dependence on the ns to tens of nanoseconds time scale. Most experiments observing the low-energy excess have not reported such time dependence. This is most likely because their time resolution is large (of the order of ms). Hence if there is sufficient amounts of radioactive impurities or any other damage sources in the sample that numerous decays occur in the detector within the time resolution, the average signal on the long time scales would appear constant, as the detector effectively sums up multiple events. On the other hand, we do note that the predicted exponential time dependence of the energy release events on time scales of tens of nanoseconds at room temperature might be experimentally testable with time-resolved pulsed ion beam experiments [77, 78] and sufficiently fast detectors.
Moreover, as we have shown earlier, a dark matter signal could have a distinct daily variation [3, 79, 80], which the excess signals from radioactive decays would not have.
In conclusion, using molecular dynamics simulations of radiation events and their annealing in silicon, we have shown that even at cryogenic temperatures, energy release events of up to 10’s of electron volts can be caused by random annealing of complex disordered atom pockets. We show that the recombination can occur by avalanche-like events, where a metastable defect configuration first crosses an energy barrier of about 0.1 eV. Crossing this kind of small barrier can then trigger a rapid additional bond recombinations, that lead to partial recrystallization and energy releases exceeding 10 eV. This explains why large energy release events can occur even down to cryogenic temperatures. These events occur randomly up to macrosopic time scales after the initial picosecond time scale radiation event. Hence, in a sensitive detector they could be caused by annealing of damage produced e.g. by decay of radioactive impurities either in the detector itself or in materials surrounding it. These energy release events have an exponential energy dependence that agrees very well with the experimentally observed low-energy excess energy release in semiconductor detectors.
Ackowledgements
Grants of computer time from the Finnish IT Center for Science in Espoo, Finland, and the financial support from the Research Council of Finland (grant# 342777) are gratefully acknowledged.
References
- Arcadi et al. [2018] G. Arcadi, M. Dutra, P. Ghosh, M. Lindner, Y. Mambrini, M. Pierre, S. Profumo, and F. S. Queiroz, The waning of the WIMP? A review of models, searches, and constraints, Eur. Phys. J. C 78, 203 (2018), arXiv:1703.07364 [hep-ph] .
- Roszkowski et al. [2018] L. Roszkowski, E. M. Sessolo, and S. Trojanowski, WIMP dark matter candidates and searches—current status and future prospects, Rept. Prog. Phys. 81, 066201 (2018), arXiv:1707.06277 [hep-ph] .
- Kadribasic et al. [2018] F. Kadribasic, N. Mirabolfathi, K. Nordlund, A. E. Sand, E. Holmström, and F. Djurabekova, Directional Sensitivity In Light-Mass Dark Matter Searches With Single-Electron Resolution Ionization Detectors, Phys. Rev. Lett 120, 111301 (2018).
- Adamski et al. [2024] S. Adamski et al., First detection of coherent elastic neutrino-nucleus scattering on germanium, (2024), arXiv:2406.13806 [hep-ex] .
- Angloher et al. [2019] G. Angloher et al. (NUCLEUS), Exploring with NUCLEUS at the Chooz nuclear power plant, Eur. Phys. J. C 79, 1018 (2019), arXiv:1905.10258 [physics.ins-det] .
- Abdelhameed et al. [2019a] A. H. Abdelhameed et al. (CRESST), Description of CRESST-III Data, (2019a), arXiv:1905.07335 [astro-ph.CO] .
- Abdelhameed et al. [2019b] A. H. Abdelhameed et al. (CRESST), First results from the CRESST-III low-mass dark matter program, Phys. Rev. D 100, 102002 (2019b), arXiv:1904.00498 [astro-ph.CO] .
- Aguilar-Arevalo et al. [2020] A. Aguilar-Arevalo et al. (DAMIC), Results on low-mass weakly interacting massive particles from a 11 kg-day target exposure of DAMIC at SNOLAB, Phys. Rev. Lett. 125, 241803 (2020), arXiv:2007.15622 [astro-ph.CO] .
- Armengaud et al. [2019] E. Armengaud et al. (EDELWEISS), Searching for low-mass dark matter particles with a massive Ge bolometer operated above-ground, Phys. Rev. D 99, 082003 (2019), arXiv:1901.03588 [astro-ph.GA] .
- Arnaud et al. [2020] Q. Arnaud et al. (EDELWEISS), First germanium-based constraints on sub-MeV Dark Matter with the EDELWEISS experiment, Phys. Rev. Lett. 125, 141301 (2020), arXiv:2003.01046 [astro-ph.GA] .
- Angloher et al. [2017] G. Angloher et al. (CRESST), Results on MeV-scale dark matter from a gram-scale cryogenic calorimeter operated above ground, Eur. Phys. J. C 77, 637 (2017), arXiv:1707.06749 [astro-ph.CO] .
- Rothe et al. [2019] J. Rothe et al. (NUCLEUS), NUCLEUS: Exploring Coherent Neutrino-Nucleus Scattering with Cryogenic Detectors, J. Low Temp. Phys. 199, 433 (2019).
- Barak et al. [2020] L. Barak et al. (SENSEI), SENSEI: Direct-Detection Results on sub-GeV Dark Matter from a New Skipper-CCD, Phys. Rev. Lett. 125, 171802 (2020), arXiv:2004.11378 [astro-ph.CO] .
- Agnese et al. [2018] R. Agnese et al. (SuperCDMS), First Dark Matter Constraints from a SuperCDMS Single-Charge Sensitive Detector, Phys. Rev. Lett. 121, 051301 (2018), [Erratum: Phys.Rev.Lett. 122, 069901 (2019)], arXiv:1804.10697 [hep-ex] .
- Amaral et al. [2020] D. W. Amaral et al. (SuperCDMS), Constraints on low-mass, relic dark matter candidates from a surface-operated SuperCDMS single-charge sensitive detector, Phys. Rev. D 102, 091101 (2020), arXiv:2005.14067 [hep-ex] .
- Adari et al. [2022] P. Adari et al., EXCESS workshop: Descriptions of rising low-energy spectra, SciPost Phys. Proc. 9, 001 (2022), arXiv:2202.05097 [astro-ph.IM] .
- Angloher et al. [2023] G. Angloher et al., Latest observations on the low energy excess in CRESST-III, SciPost Phys. Proc. 12, 013 (2023), arXiv:2207.09375 [astro-ph.CO] .
- Abbamonte et al. [2022] P. Abbamonte, D. Baxter, Y. Kahn, G. Krnjaic, N. Kurinsky, B. Mandava, and L. K. Wagner, Revisiting the Dark Matter Interpretation of Excess Rates in Semiconductors, (2022), arXiv:2202.03436 [hep-ph] .
- Anthony-Petersen et al. [2022] R. Anthony-Petersen et al., A Stress Induced Source of Phonon Bursts and Quasiparticle Poisoning, (2022), arXiv:2208.02790 [physics.ins-det] .
- Romani [2024] R. K. Romani, Aluminium Relaxation as the Source of Excess Low Energy Events in Low Threshold Calorimeters, (2024), arXiv:2406.15425 [physics.ins-det] .
- [21] M. Kaznacheeva, public presentation at EXCESS 2024 workshop (Rome, Italy) 2024. https://agenda.infn.it/event/39007/contributions/235288/.
- [22] M. Mancuso, public presentation at EXCESS 2024 workshop (Rome, Italy) 2024. https://agenda.infn.it/event/39007/contributions/235287/.
- Ruault et al. [1984] M. O. Ruault, J. Chaumont, J. M. Penisson, and A. Bourret, High resolution and in situ investigation of defects in Bi-irradiated Si, Phil. Mag. A 50, 667 (1984).
- Jencic et al. [1995] I. Jencic, M. W. Bench, I. M. Robertson, and M. A. Kirk, Electron-beam-induced crystallization of isolated amorphous regions in Si, Ge, GaP, and GaAs., J. Appl. Phys. 78, 974 (1995).
- Kyuno et al. [1999] K. Kyuno, D. C. Cahill, R. S. Averback, J. Tarus, and K. Nordlund, Surface defects and bulk defect migration produced by ion bombardment of Si(001), Phys. Rev. Lett. 83, 4788 (1999).
- Partyka et al. [2002] P. Partyka, Y. Zhong, K. Nordlund, R. S. Averback, I. K. Robinson, and P. Ehrhart, Grazing incidence diffuse x-ray scattering investigation of the properties of irradiation-induced point defects in silicon, Phys. Rev. B 64, 235207 (2002).
- Caturla et al. [1996] M.-J. Caturla, L. A. M. T. Diaz de la Rubia, and G. H. Gilmer, Ion-beam processing of silicon at keV energies: A molecular-dynamics study, Phys. Rev. B 54, 16683 (1996).
- Nordlund et al. [1998a] K. Nordlund, M. Ghaly, R. S. Averback, M. Caturla, T. Diaz de la Rubia, and J. Tarus, Defect production in collision cascades in elemental semiconductors and FCC metals, Phys. Rev. B 57, 7556 (1998a).
- Hensel and Urbassek [1997] H. Hensel and H. M. Urbassek, Implantation and damage under low energy Si self-bombardment, Phys. Rev. B 57, 4756 (1997).
- Santos et al. [2007] I. Santos, L. A. Marqués, L. Pelaz, and P. López, Molecular dynamics study of amorphous pocket formation in Si at low energies and its application to improve binary collision models , Nuclear Instruments and Methods in Physics Research Section B: Beam Interactions with Materials and Atoms 255, 110 (2007).
- Holmström et al. [2008] E. Holmström, A. Kuronen, and K. Nordlund, Threshold defect production in silicon determined by density functional theory molecular dynamics simulations, Phys. Rev. B 78, 045202 (2008).
- Averback and Diaz de la Rubia [1998] R. S. Averback and T. Diaz de la Rubia, Displacement damage in irradiated metals and semiconductors, in Solid State Physics, Vol. 51, edited by H. Ehrenfest and F. Spaepen (Academic Press, New York, 1998) pp. 281–402.
- Backer et al. [2016] A. D. Backer, A. E. Sand, K. Nordlund, L. Luneville, D. Simeone, and S. L. Dudarev, Subcascade formation and defect cluster size scaling in high-energy collision events in metals, EPL 115, 26001 (2016).
- Weber et al. [1999] B. Weber, D. M. Stock, and K. Gärtner, MD simulations of ion beam induced crystallization at a-Si/c-Si interfaces: interface structure and elementary process of crystallization, Nucl. Instr. Meth. Phys. Res. B 148, 375 (1999).
- L. K. Beland and N. Mousseau [2013] L. K. Beland and N. Mousseau, Long-time relaxation of ion-bombarded silicon studied with the kinetic activation-relaxation technique: Microscopic description of slow aging in a disordered system, Phys. Rev. B 88, 214201 (2013).
- Dammak et al. [2009] H. Dammak, Y. Chalopin, M. Laroche, M. Hayoun, and J.-J. Greffet, Quantum thermal bath for molecular dynamics simulation, Physical Review Letters 103, 190601 (2009).
- J.-L. Barrat and D. Rodney [2011] J.-L. Barrat and D. Rodney, Portable Implementation of a Quantum Thermal Bath for Molecular Dynamics Simulations, J. Stat. Phys. 144, 679 (2011).
- Allen and Tildesley [1989] M. P. Allen and D. J. Tildesley, Computer Simulation of Liquids (Oxford University Press, Oxford, England, 1989).
- [39] PARCAS Computer code, available open source at https://gitlab.com/acclab/parcas/, year = 2024.
- Nordlund et al. [1998b] K. Nordlund, L. Wei, Y. Zhong, and R. S. Averback, Role of electron-phonon coupling on collision cascade development in Ni, Pd and Pt, Phys. Rev. B (Rapid Comm.) 57, 13965 (1998b).
- Nordlund et al. [2005] K. Nordlund, J. Wallenius, and L. Malerba, Molecular dynamics simulations of threshold energies in Fe, Nucl. Instr. Meth. Phys. Res. B 246, 322 (2005).
- Holmström et al. [2010] E. Holmström, K. Nordlund, and A. Kuronen, Threshold defect production in germanium determined by density functional theory molecular dynamics simulations, Physica Scripta 81, 035601 (2010).
- Norris et al. [2011] S. A. Norris, J. Samela, C. S. Madi, M. P. Brenner, L. Bukonte, M. Backman, F. Djurabekova, K. Nordlund, and M. J. Aziz, MD-Predicted Phase diagrams for Pattern Formation, Nature communications 2, 276 (2011).
- Schlueter et al. [2020] K. Schlueter, K. Nordlund, G. Hobler, M. Balden, F. Granberg, O. Flinck, T. F. da Silva, and R. Neu, Absence of a crystal direction regime where sputtering corresponds to amorphous material, Phys. Rev. Lett. 125, 225502 (2020).
- Plimpton [1995] S. Plimpton, Fast parallel algorithms for short-range molecular dynamics, J. Comput. Phys. 117, 1 (1995).
- Villarba and Jonsson [1994] M. Villarba and H. Jonsson, Diffusion mechanisms relevant to metal crystal growth: Pt/Pt(111), Surf. Sci. 317, 15 (1994), ; G. Mills, H. Jonsson and G. K. Schenter, Surf. Sci. 324 (1995) 305.
- Stillinger and Weber [1985] F. H. Stillinger and T. A. Weber, Computer simulation of local order in condensed phases of silicon, Phys. Rev. B 31, 5262 (1985).
- Samela et al. [2007] J. Samela, K. Nordlund, J. Keinonen, and V. N. Popok, Comparison of silicon potentials for cluster bombardment simulations, Nucl. Instr. Meth. Phys. Res. B 255, 253 (2007).
- Hamedani et al. [2020] A. Hamedani, J. Byggmaästar, F. Djurabekova, G. Alahyarizadeh, R. Ghaderi, A. Minuchehr, and K. Nordlund, Insights into the primary radiation damage in silicon by machine learning interatomic potential, Mater. Res. Lett. 8, 364 (2020).
- Tersoff [1988] J. Tersoff, Empirical interatomic potential for silicon with improved elastic properties, Phys. Rev. B 38, 9902 (1988).
- Backer et al. [2018] A. D. Backer, C. Domain, C. Becquart, , L. Luneville, D. Simeone, , A. E. Sand, and K. Nordlund, A model of defect cluster creation in fragmented cascades in metals based on morphological analysis, J. Phys.: Cond. Matter 30, 405701 (2018).
- Nordlund et al. [2018] K. Nordlund, S. J. Zinkle, A. E. Sand, F. Granberg, R. S. Averback, R. Stoller, T. Suzudo, L. Malerba, F. Banhart, W. J. Weber, F. Willaime, S. Dudarev, and D. Simeone, Primary radiation damage: a review of current understanding and models, J. Nucl. Mater. 512, 450 (2018).
- Nordlund [1995] K. Nordlund, Molecular dynamics simulation of ion ranges in the 1 – 100 keV energy range, Comput. Mater. Sci. 3, 448 (1995).
- Berendsen et al. [1984] H. J. C. Berendsen, J. P. M. Postma, W. F. van Gunsteren, A. DiNola, and J. R. Haak, Molecular dynamics with coupling to external bath, J. Chem. Phys. 81, 3684 (1984).
- Ashcroft and Mermin [1976] N. W. Ashcroft and N. D. Mermin, Solid State Physics (Saunders College, Philadelphia, 1976).
- Brieuc et al. [2016] F. Brieuc, Y. Bronstein, H. Dammak, P. Depondt, F. Finocchi, and M. Hayoun, Zero-point energy leakage in quantum thermal bath molecular dynamics simulations, Journal of chemical theory and computation 12, 5688 (2016).
- Anderson [1930] C. T. Anderson, The heat capacity of silicon at low temperatures, Journal of the American Chemical Society 52, 2301 (1930).
- Diaz de la Rubia and Gilmer [1995] T. Diaz de la Rubia and G. H. Gilmer, Structural Transformations and Defect Production in Ion Implanted Silicon: A Molecular Dynamics Simulation Study, Phys. Rev. Lett. 74, 2507 (1995).
- Mandl [1988] F. Mandl, Statistical Physics, 2nd ed. (Wiley, Chichester, UK, 1988).
- T. Henkel and V. Heera and R. Kogler and W. Skorupa and M. Seibt [1996] T. Henkel and V. Heera and R. Kogler and W. Skorupa and M. Seibt, The temperature dependence of the ion beam induced interfacial amorphization in silicon, Appl. Phys. Lett. 68, 3425 (1996).
- Bevington [1992] P. R. Bevington, Data reduction and error analysis for the physical sciences (McGraw-Hill, New York, 1992).
- Press et al. [1995] W. H. Press, S. A. Teukolsky, W. T. Vetterling, and B. P. Flannery, Numerical Recipes in C; The Art of Scientific Computing, 2nd ed. (Cambridge University Press, New York, 1995).
- Heikinheimo et al. [2022] M. Heikinheimo, S. Sassi, K. Nordlund, K. Tuominen, and N. Mirabolfathi, Identification of the low energy excess in dark matter searches with crystal defects, Phys. Rev. D 106, 083009 (2022).
- Alkhatib et al. [2021] I. Alkhatib et al. (SuperCDMS), Light Dark Matter Search with a High-Resolution Athermal Phonon Detector Operated Above Ground, Phys. Rev. Lett. 127, 061801 (2021), arXiv:2007.14289 [hep-ex] .
- Bak et al. [1987] P. Bak, C. Tang, and K. Wiesenfeld, Self-organized criticality: An explanation of the 1/f noise, Phys. Rev. Lett. 59, 381 (1987).
- Carlson et al. [1990] J. M. Carlson, J. T. Chayes, E. R. Grannan, and G. H. Swindle, Self-organized criticality in sandpiles: Nature of the critical phenomenon, Phys. Rev. A 42, 2467 (1990).
- Jencic and Robertson [1996] I. Jencic and I. M. Robertson, Low-energy electron beam induced regrowth of isolated amorphous zones in Si and Ge, J. Mater. Res. 11, 2152 (1996).
- Bench et al. [2000] M. W. Bench, I. M. Robertson, M. A. Kirk, and I. Jenčič, Production of amorphous zones in GaAs by the direct impact of energetic heavy ions, J. Appl. Phys. 87, 49 (2000).
- Weber [2000] W. J. Weber, Models and mechanisms of irradiation-induced amorphization in ceramics, Nucl. Instr. Meth. Phys. Res. B 166-167, 98 (2000).
- Trachenko et al. [2006] K. Trachenko, M. T. Dove, E. Artacho, I. T. Todorov, and W. Smith, Atomistic simulations of resistance to amorphization by radiation damage, Phys. Rev. B 73, 174207 (2006).
- Chappell et al. [2013] H. F. Chappell, M. T. Dove, K. Trachenko, R. E. A. McKnight, M. A. Carpenter, and S. A. T. Redfern, Structural changes in zirconolite under -decay, J. Phys.: Condens. Matter 25, 055401 (2013).
- Bulow and Buckel [1956] H. Bulow and W. Buckel, , Z. Phys. 145, 141 (1956).
- Silcox and Hirsch [1959] J. Silcox and P. B. Hirsch, Dislocation Loops in Neutron-irradiated Copper, Phil. Mag. 4, 1356 (1959).
- Bacon and Diaz de la Rubia [1994] D. J. Bacon and T. Diaz de la Rubia, Molecular dynamics computer simulations of displacement cascades in metals, J. Nucl. Mat. 216, 275 (1994).
- Kirk et al. [1987] M. A. Kirk, I. M. Robertson, M. L. Jenkins, C. A. English, T. J. Black, and J. S. Vetrano, The collapse of defect cascades to dislocation loops, J. Nucl. Mater. 149, 21 (1987).
- A. Esfandiyarpour and J. Byggmästar and J. P. Balbuena and M. J. Caturla and K. Nordlund and F. Granberg [2022] A. Esfandiyarpour and J. Byggmästar and J. P. Balbuena and M. J. Caturla and K. Nordlund and F. Granberg, Effect of cascade overlap and C15 clusters on the damage evolution in Fe: An OKMC study, Materialia 21, 101344 (2022).
- J. B. Wallace and L. B. Aji Bayu and L. Shao and S. Kucheyev [2017] J. B. Wallace and L. B. Aji Bayu and L. Shao and S. Kucheyev, Radiation defect dynamics studied by pulsed ion beams, Nucl. Instr. Meth. Phys. Res. B 409, 347 (2017).
- Barnard and Schenkel [2017] J. J. Barnard and T. Schenkel, Modeling of intense pulsed ion beam heated masked targets for extreme materials characterization, J. Appl. Phys. 122, 195901 (2017).
- M. Heikinheimo and K. Nordlund and K. Tuominen and N. Mirabolfathi [2019] M. Heikinheimo and K. Nordlund and K. Tuominen and N. Mirabolfathi, Velocity Dependent Dark Matter Interactions in Single-Electron Resolution Semiconductor Detectors with Directional Sensitivity, Phys. Rev. D 99, 103018 (2019).
- Sassi et al. [2023] S. Sassi, M. Heikinheimo, K. Tuominen, K. Nordlund, and N. Mirabolfathi, Energy loss in low energy nuclear recoils in dark matter detector materials, Phys. Rev. D 106, 063102 (2023).