Star-formation Properties of Galaxy Clusters and Groups from Horizon Run 5
Abstract
Quiescent galaxies are predominantly observed in local galaxy clusters. However, the fraction of quiescent galaxies in high-redshift clusters significantly varies among different clusters. In this study, we present the results of an analysis of the star formation properties of clusters and groups from a cosmological hydrodynamical simulation Horizon Run 5. We investigate the correlation between the quiescent galaxy fraction (QF) of these model clusters/groups and their various internal or external properties. We find that halo mass is one of the most important characteristics as higher-mass clusters and groups have higher QFs. We also find that other properties such as stellar-mass ratio and FoF fraction, measures the proportion of the area around a cluster occupied by dense structures, may mildly affect the QFs of clusters and groups. This may indicate that the evolutionary history as well as the large-scale environment of clusters and groups also play a certain role in determining the star formation status of high-redshift galaxy clusters and groups.
keywords:
galaxies: clusters: general – large-scale structure of Universe – methods: numerical – galaxies: evolution1 Introduction
Galaxy clusters provide interesting laboratory to study the evolution of galaxies. There are many interesting issues regarding the evolution of galaxies and galaxy clusters in these dense structures. One of these issues is that how the star formation of galaxies would evolve in dense environment, such as galaxy clusters or groups.
As it has usually been understood, the regulation of star-formation (SF) activities of galaxies has two competing origins: nature (e.g. Kauffmann et al., 2003; Jimenez et al., 2005; Baldry et al., 2006) versus nurture (e.g. Lewis et al., 2002; Kauffmann et al., 2004; Baldry et al., 2006) (or, in other words, internal versus external effects). Therefore, it would be important to quantitatively study the correlation of the SF activities of cluster galaxies with their mass and environments.
Lots of observational results indicate that, at high redshift (), the stellar-mass dependence on the SF activities is generally greater than the environmental effects(e.g. Peng et al., 2010; Lee et al., 2015; Chartab et al., 2020; Gu et al., 2021). At , more massive galaxies stopped their star-formation earlier on average, and therefore the fraction of quenched galaxies shows strong dependence on stellar mass (e.g. Peng et al., 2010; Lee et al., 2015). As time goes by, the environmental effects such as the ram-pressure stripping (Gunn & Gott, 1972; Abadi et al., 1999), strangulation (Larson et al., 1980; Balogh et al., 2000; Peng et al., 2015), and galaxy harassment (Moore et al., 1996) becomes dominant suppressing the SF activities and changing the related physical properties of cluster galaxies.
However, during this transition era (or at the cosmic noon), the SF quenching does not occur at the same pace among galaxy clusters. In other words, there exists a cluster-to-cluster variation in the status of SF quenching (or quantitatively the quiescent galaxy fraction) among clusters at similar redshift (Lee et al., 2015; Alberts et al., 2016; Hayashi et al., 2019; Lee et al., 2019).
Therefore, an interesting question may be raised on the possible origin of the variation of the quiescent galaxy fraction. Already, Lee et al. (2019) have shown that the observed fraction of quiescent galaxies in a cluster is dependent of the large-scale environments of galaxy clusters having a lower value for a denser cluster environments. As a possible explanation for this observed results, they proposed a ‘Web-feeding model’ (Lee et al., 2019) which supposes that star-forming galaxies infalling into the cluster through the local cosmic web structures keep low the quiescent galaxy fraction for some period of time. (e.g. Ellingson et al., 2001; Tran et al., 2005; Lubin et al., 2009).
Halo mass can also be a crucial factor determining the star formation characteristics of galaxy clusters. Previous studies on this matter are still under debate. Some suggests that the star formation characteristics of galaxy clusters vary with the halo-mass of the clusters (e.g. Blanton & Berlind, 2007; Kimm et al., 2009; Wetzel et al., 2012; Woo et al., 2013), while other studies yield results indicating that there is no correlation between the star formation properties of galaxy clusters and the halo-mass of the clusters (e.g. Finn et al., 2008; van den Bosch et al., 2008; Pasquali et al., 2009). And certain environmental dependence of star formation properties at the cluster scale may be interpreted in terms of halo-mass dependence (e.g. Haas et al., 2012).
Also, there would be other properties or parameters of galaxy clusters which may have some correlations with the quiescent galaxy fraction of clusters and this is the main focus in this study. For this purpose, we use model galaxies and galaxy clusters from Horizon Run 5 (HR5) simulation. Several studies have investigated the evolution of star formation in cluster environments through various simulations. Bahé et al. (2017) explored the influence of the cluster environment on galaxy formation through the use of the Hydrangea simulations, which comprise a set of cosmological hydrodynamical zoom-in simulations. Rhee et al. (2020) investigated the quenching history of galaxies, exploring both its environmental and mass dependence through the use of the Yonsei Zoom-in Cluster Simulation (YZiCS). Jeon et al. (2022) examined the star-formation history of galaxies through the Horizon-AGN simulation, discovering the dependence of the star-formation decay time-scale on both the stellar mass and environments of galaxies. Our study can be viewed as an extension of these and other previous studies in this line of research. However, our analysis goes beyond, encompassing the influence of cosmic large-scale structures on the star formation characteristics of galaxies within clusters, operating on a larger scale than the individual sizes of each galaxy cluster.
2 Simulation and Sample
2.1 Horizon Run 5 Simulation: Zoom-in Simulation
HR5 is a cosmological hydrodynamical zoom-in simulation aiming at covering a wide range of cosmic structures in a (1048.6 cMpc)3 volume, with a spatial resolution down to pkpc. HR5 is conducted using an adaptive mesh refinement code RAMSES (Teyssier, 2002) that is optimized for the OpenMP plus MPI parallelism (Lee et al., 2021). HR5 is based on the cosmological parameters of , , , , and that are compatible with the Planck data (Planck Collaboration et al., 2016). The initial condition of HR5 is generated using the MUSIC package (Hahn & Abel, 2011), with a second-order Lagrangian scheme (2LPT; Scoccimarro, 1998; L’Huillier et al., 2014). The volume of HR5 is configured to have a high-resolution region of the cuboid geometry with a dimension of . The cosmological box has 256 coarse grids (level 8, cMpc) on a side and the zoomed region has 8192 grids (level 13, cMpc) along the major axis in the initial condition. The high-resolution region initially contains grids and dark matter particles, and is surrounded by the padding grids of levels from 9 to 12. The dark matter particles have a mass of in the high-resolution region (level 13), and their mass increases by a factor of 8 with a decreasing grid level. The grids are adaptively refined down to kpc when their density exceeds eight times the dark matter particle mass at level 13. HR5 completes at .
HR5 is conducted by utilizing the physical processes governing the evolution of baryonic components that are equipped in subgrid forms in RAMSES. Gas cooling rates are computed using the cooling functions of Sutherland & Dopita (1993) in a temperature range of K and fine-structure line cooling is computed down to K using the cooling rates of Dalgarno & McCray (1972). Cosmic reionization is approximated by assuming a uniform UV background (Haardt & Madau, 1996). A star formation rate is computed by utilizing the statistical approach of Rasera & Teyssier (2006). A stellar particle has a minimum mass of and its mass evolves over time based on a Chabrier initial mass function (Chabrier, 2003). Supernova feedback operates in thermal and kinetic modes (Dubois & Teyssier, 2008) and AGN feedback operates in radio-jet and quasar modes which is switched by the Eddington ratio (Dubois et al., 2012). Massive black holes (MHBs) are initially seeded with a mass of M⊙ in the grids that have gas densities higher than the threshold of star formation and no other neighboring MBHs within 50 kpc (Dubois et al., 2014b). MBHs increase their mass via accretion and MBH coalescence, and their angular momentum obtained from the mass growing processes are traced (Dubois et al., 2014a). Metal enrichment is computed using the method proposed by Few et al. (2012) based on a Chabrier initial mass function. The abundance of H, O, and Fe are traced individually. Further details of HR5 are given in Lee et al. (2021).
The bound objects in HR5 are identified using the Physically Self-Bound (PSB)-based galaxy finder (PGalF, see Appendix A of Kim et al., 2023, for details). First, PGalF finds Friends-of-Friends (FoF) objects from all the mass components of dark matter, gas, stars, and massive black holes by utilizing the adaptive linking length scheme of PGalF Self-bound sub-objects are sorted out from the FoF objects by measuring total energy and tidal radius from the local density peaks found in the coordinate-free stellar or dark matter density fields of FoF objects. A sub-object is defined as a galaxy when it contains sufficient stellar particles for constructing a stellar mass density field. We classify the mass components that are not gravitationally bound to any sub-objects as unbound components in a FoF object. The evolution of galaxies in HR5 is traced using the merger trees constructed based on the stellar particle membership of galaxies (see Park et al., 2022; Lee et al., 2023, for details).
2.2 Halo Sample
From the HR5 simulation data, we select a snapshot data at redshift . This redshift epoch was selected for the comparison with the observational results of Lee et al. (2019). The snapshot catalog contains clusters and groups of halos which have member galaxies. In this snapshot data, we sampled galaxy groups or clusters with the mass condition of log () where is the (total) halo mass within the radius within which mean matter density is 200 times the critical density at a given redshift.
From these halos, we first exclude overlapping binary halos when the distance between two halos is closer than the sum of their virial radius () of each halo. This is because when two groups or clusters are located close enough, the star formation (SF) properties of a halo can be affected by the gravitational influence of a nearby halo. Then, with the similar reason, we further exclude from the sample the seriously asymmetric halos which might be in the course of halo merging. A projected two-dimensional asymmetry parameter (on the plane) is defined as
| (1) |
where and are the mass densities of a pixel () before and after 180 degree rotation around the center of the halo on the plane, respectively. We apply the asymmetry cut of to reduce a possible contamination to exclude the unvirialized cases of clusters and groups. Here, a is the maximum value among , , and . We also exclude galaxy groups with fewer than 10 member galaxies from the sample.
After the trimming-down procedure, we finally have 224 groups and clusters, which will be used for our analysis in this study.
3 Results
3.1 Star Formation Properties of Halos
The main aim of this work is to investigate the star formation properties of high-redshift galaxy groups and clusters. We use the quiescent galaxy fraction (QF) as a proxy for the SF activities of a cluster and group. Here, the QF is defined as the number fraction of quiescent galaxies among total member galaxies with a stellar mass of log ( in each group or cluster. The stellar-mass cut is chosen following Lee et al. (2019), ensuring a fair comparison with the results of Lee et al. (2019). We classify a galaxy as quiescent if the specific star-formation rate (sSFR) is smaller than the one third of , where is the age of the Universe at target redshift , following Damen et al. (2009) and Lee et al. (2015). At , when t(z)=6.43 Gyr, the sSFR cut is yr-1. The upper panel of Figure 1 shows the distribution of quiescent galaxy fractions of our sample halos and the bottom panel shows the QF distribution of observed galaxy clusters in the redshift range of found in the Ultra Deep Survey (UDS) by Lee et al. (2015). This two distributions are consistent with each other, while the number of groups/clusters in the UDS is much smaller mainly due to its small volume. We conducted a Kolmogorov-Smirnov (K-S) test on two QF distributions, resulting in a -value of 0.713. This indicates that the likelihood of HR5 following a QF distribution different from the observed one is considered to be low.
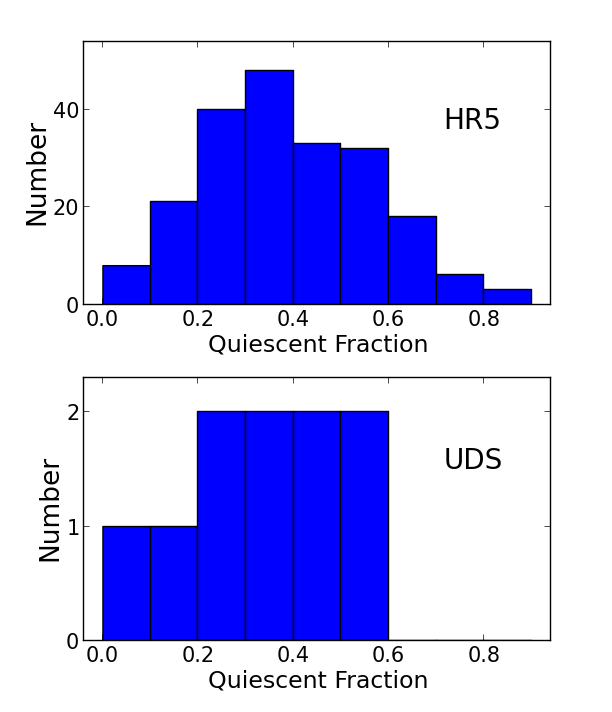
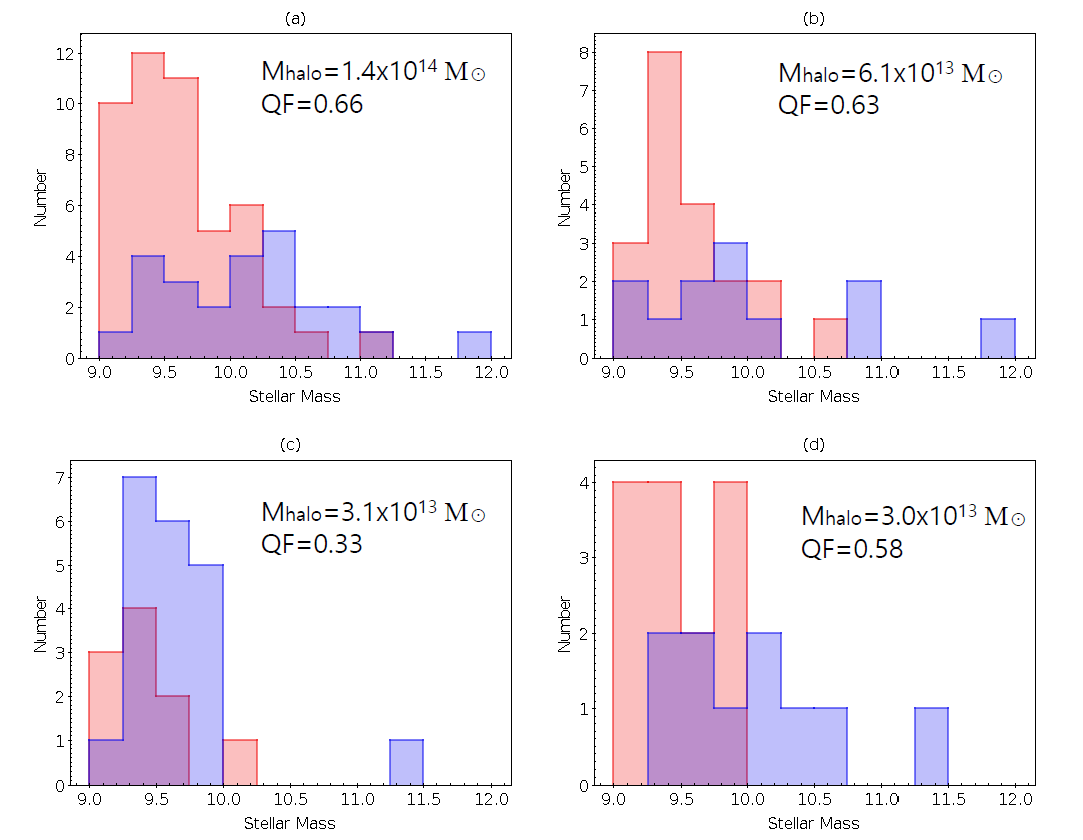
Figure 2 shows the stellar mass distribution of member galaxies for several examplary halos with various halo masses and QFs. In this figure, the blue and red histograms show the distributions of star-forming and quiescent member galaxies of each halo, respectively. As seen in this figure (e.g., comparing panels (c) and (d)), the variation in QF among halos with similar halo masses seems to be mainly caused by the low-mass galaxies. On the other hand, as can be seen by comparing panels (a), (b), and (d), halos with high QF () show similar stellar-mass distirbutions for star-forming and quiescent galaxies, regardless of their halo mass. And, after we investigate the star-formation properties of member galaxies of our sample halos, we found that massive halos tend to have high QFs, while low-mass halos span a wider range of QF.
3.2 Quiescent Galaxy Fraction and Halo Mass
In this section, we investigate the correlation between this QF and the halo mass. It has been known that several cluster properties show the halo-mass dependency to some degree. And we confirm the strong dependence of QF on the halo mass as shown below.
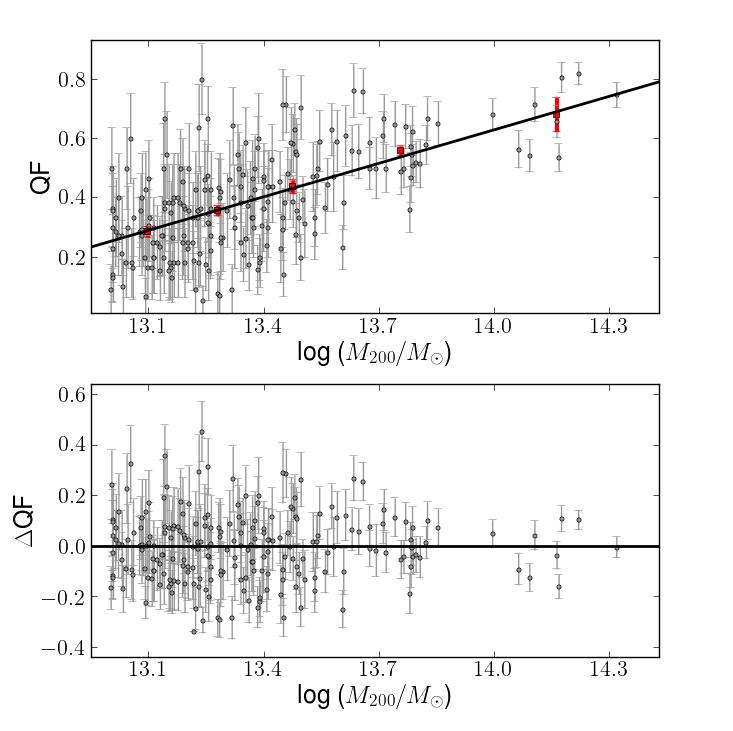
The upper panel of Figure 3 shows that there is a positive correlation between halo mass and QF of our sample clusters and groups: more massive halos have a higher QF. In this figure, the median values and their corresponding scaled MAD (Median Absolute Deviation) are depicted as red squares and error bars for each halo-mass bin. The halo-mass range of each mass bin is given as (1) , (2) , (3) , (4) , (5) .
As for the correlation between halo-mass and QF, we have found the best-fit as follows:
| (2) |
This linear correlation, represented by the black line in the upper panel of Figure 3, depicts the ‘halo star-formation main-sequence (HSFMS)’.
In figure 3, it is clear that there is a lower envelope of distributions, i.e. the minimum QF for given halo mass, with a slope of . The existence of this lower envelope and the HSFMS indicate that the QF of high-redshift clusters largely depend on halo mass: star-formation quenching of cluster member galaxies first occurs for massive halos, and proceed toward lower-mass halos with time. This halo-mass dependence of star-formation quenching is consistent with observational results (e.g. Kimm et al., 2009; Woo et al., 2013).
3.3 Quiescent Galaxy Fraction and Stellar Mass Ratio
Even with a positive correlation between the QF and the halo mass, a large scatter can be seen for a given halo-mass bin, especially for small-mass halos, which may mean that there is other hidden parametric dimensions on the QF distribution. In addition to halo mass, halo assembly history or evolutionary stage can be another parameter which may affect halo properties. Therefore, in this section, we study the effect of evolutionary stage of halos on the star-formation properties of halos.
Observationally, the magnitude gap between the most and second most bright member galaxies has widely been adopted as an indicator for the evolutionary status of the cluster. In this study, we use the stellar-mass ratio between them instead of the magnitude gap.
Figure 4 depicts the correlation between QF and the stellar-mass ratio, . As shown in the upper panel of this figure, galaxy groups or clusters with a higher steller-mass ratio tend to have a higher QF. The best-fit line, represented by a red line, has a slope of 0.06, with a standard error of mean (SEM) of 0.012. This implies that there is a weak positive correlation between QF and the stellar-mass ratio in galaxy groups or clusters. The Spearman correlation coefficient, , between QF and the stellar-mass ratio is 0.13 (with -value of 0.068).
As seen in Section 3.2, there exists a correlation between QF and halo mass. We examine whether a correlation between the stellar-mass ratio and QF persisted even after removing the influence of halo mass on QF. To investigate this, we analyzed the relationship between the residual QF and the stellar-mass ratio, as depicted in the lower panel of the figure. Here, the residual QF is defined as follows:
| (3) |
where and are QF of individual halo and QF on the best-fit HSFMS (Equation 2) for each halo with a given halo mass, respectiviely. As shown in this figure, there is a positive correlation between residual QF and stellar-mass ratio. The slope of the best-fit line, shown as a red line, is 0.10, and the Spearman correlation coefficient is 0.25 (with -value of 0.000), confirming the existence of a correlation between QF and the stellar-mass ratio, even when the impact of halo mass on QF is factored out.
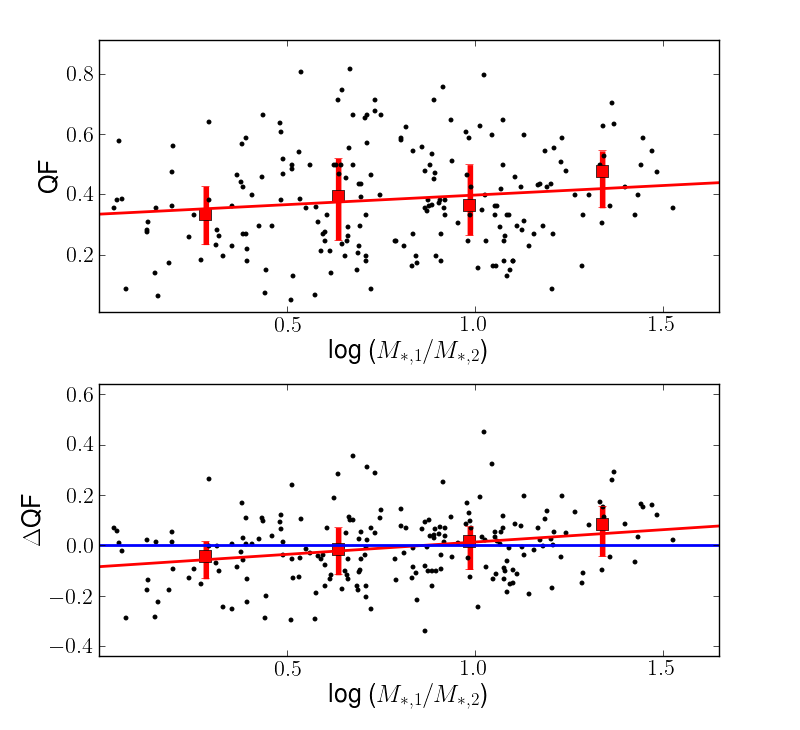
The stellar mass of central galaxy (or BCGs) will keep increasing by merging satellite galaxies. Therefore, the stellar-mass difference becomes increasing with time unless a new massive galaxy enters into the cluster (as a member of merging group or cluster) or the second most massive galaxy experiences the same amount of merging activities. The quiescent galaxy fraction also increases as time goes on, leading to the positive correlation between the quiescent fraction and the stellar-mass ratio as shown in Figure 4. In other words, the evolutionary stage of clusters, parametrized with the stellar-mass ratio, can also affect the star-formation properties of clusters.
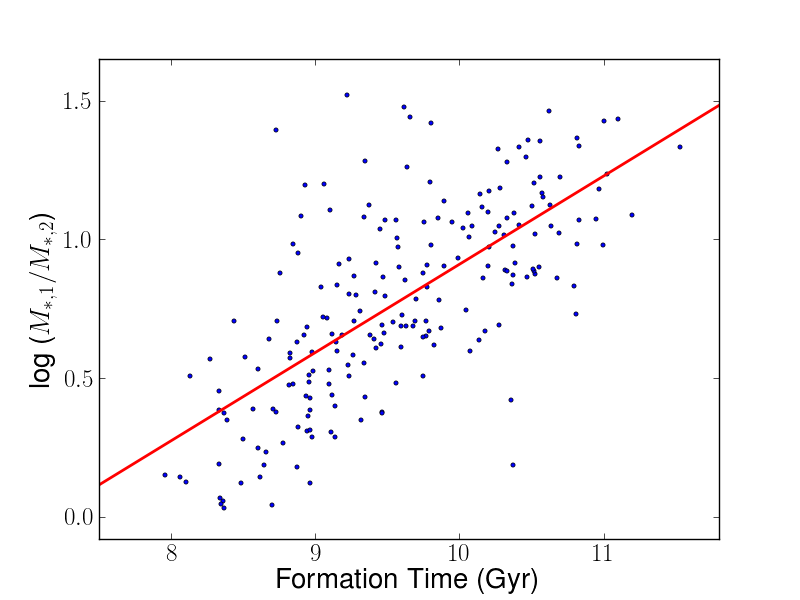
We examine the correlation between the stellar-mass ratio and formation time of galaxy clusters. The halo formation time is defined as the time at which half of the mass was assembled. As seen in Figure 5, there exists a positive correlation between these two quantities, indicating that the stellar-mass ratio can serve as a good proxy for the evolutionary stage of galaxy clusters.
This correlation between QF and stellar-mass ratio turns out to be clearer for intermediate halo-mass sample () as can be seen in Figure 6. In this halo-mass range, the quiescent galaxy fractions of halos with lower stellar mass ratio (bottom panel) are smaller than the ones with higher stellar mass ratios (middle of top panel), reflecting the difference in their average evolutionary stage. QFs for more massive halos () are large regardless of their stellar-mass ratio, because the halo mass plays a more dominant role in shaping the SF properties of clusters.
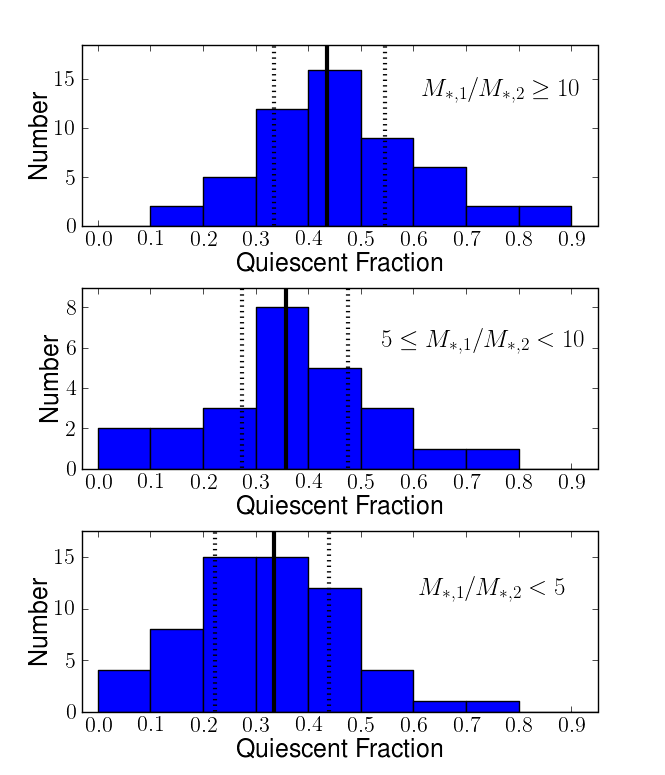
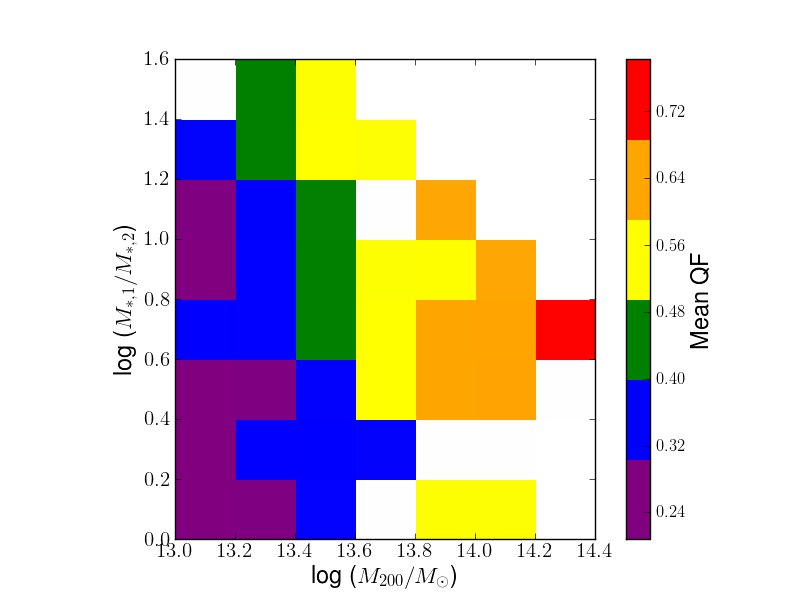
Figure 7 depicts the correlation between halo-mass, stellar-mass ratio, and QF. In the parameter space defined by halo-mass and stellar-mass ratio bins, we calculate the average values of QF of galaxy clusters within each bin and represent them using colors. Upon examination of this figure, we can observe the following: (1) We confirm the relationship between halo-mass and QF, as described in Section 3.2. As we move to the right in the figure, there is an increase in the prevalence of redder bins. (2) We validate the relationship between stellar-mass ratio and QF, as discussed in Figure 4. Moving downward in the figure, we see more blue and purple bins. This implies that galaxy groups or clusters with lower stellar-mass ratios within a given halo mass tend to exhibit lower QF values. (3) Galaxy clusters with greater halo mass exhibit a narrower range of stellar-mass ratios, with a noticeable decrease in the maximum value of the stellar-mass ratio associated with these clusters.
We perform a QF - halo mass - stellar-mass ratio multilinear fit to examine the extent to which the stellar-mass ratio contributes to the scatter in the QF - halo-mass correlation. The mean square error (MSE) value obtained from this multilinear fit is approximately 7 % smaller than the MSE from the QF - halo-mass linear fit, indicating that the stellar-mass ratio contributes to the scatter to some extent.

3.4 Quiescent Galaxy Fraction and Large-scale Environment
In the previous sections, we have found that the star-formation property of member galaxies is affected by the properties of their host halo, such as the halo mass and stellar mass ratio. Now, we turn our attention to the large-scale environment of halos.
Previously, we found that there exists a correlation between the QF of high-redshift galaxy clusters and their large-scale environment, in a sense that clusters which are more connected to dense environment have lower level of quiescent galaxy fraction (Lee et al., 2019).
According to Lee et al. (2019), the large-scale environment is parameterized as the ’FoF fraction’, which measures how much the fraction of the area surrounding the given cluster is occupied by dense structure with high galaxy number-density (above a given threshold). Therefore, when the cluster is embedded in a dense environment, the FoF fraction is higher. On the other hand, a relatively isolated cluster may have a lower FoF fraction.
Here, we use the similar definition of FoF fraction as in Lee et al. (2019), but we measure it in 3 dimensional space. It is shown in Lee et al. (2019) that FoF fraction calculated in projected two dimensional space well correlates with FoF fraction measured in three dimension.
The FoF fraction in this work is calculated as follows: First, we place a sphere at the center of a given cluster with the radius of 5 Mpc. And we construct the galaxy number-density field. Next, we find the overdense pixels by applying the density threshold of 1.4 higher than the mean number density. Then, we link those overdense pixels using FoF algorithm with a linking length of 2 Mpc. Finally, the FoF fraction is defined as the volume ratio of the entire linked pixels to the 5 Mpc sphere. Figure 8 illustrates this procedure with a typical halo.
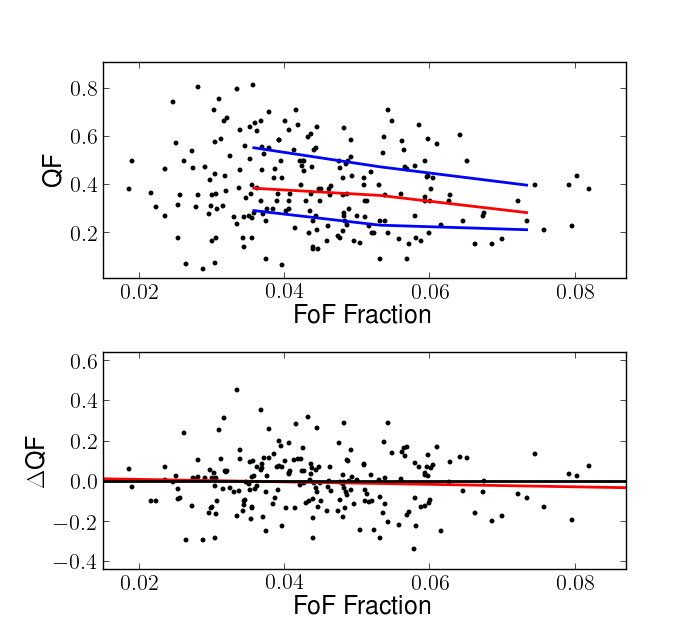
The upper panel of Figure 9 depicts the correlation between the QF and the FoF fraction. In this figure, we observe an anti-correlation between these two in line with our previous observational findings as reported in Lee et al. (2019). In detail, when the FoF fraction is high (indicating that a cluster is embedded in dense environment), the QF value tends to be low. Every cluster with the FoF fraction has the QF value smaller than 0.5. On the other hand, relatively isolated clusters with a low FoF fraction exhibit a broader range of QF values. This is because when a cluster is relatively isolated or well centrally concentrated (with low FoF fraction), other various factors (as seen in the previous sections) affect the QF values. On the other hand, if a cluster has an extended distribution of galaxies and with a higher probability, therefore, it is more connected with (or embedded within) dense environment, the QF values are kept low due to the infalling material.
It is worth noting that the strength of this correlation is somewhat weaker compared to what we observed in observation. The Spearman correlation coefficient is -0.16 (with -value of 0.018), indicating a weak anti-correlation. We speculate that this is because the SF quenching in HR5 galaxies may not be rapid enough (or delayed due to relatively weak AGN feedback) at this redshift.
The bottom panel of Figure 9 illustrates the relationship between the FoF fraction and QF (=). A anti-correlation is observed between these two variables, as indicated by the red solid line, which has a slope of -0.62 (with a SEM of 0.0093).
To summarize, we find the large-scale structure, measured as FoF fraction is another important factor affecting on the SF property of clusters, confirming our previous finding in Lee et al. (2019).
4 Discussion: Why do more massive halos show higher QF?
In Section 3.2, we demonstrate that QFs of more massive halos are higher — i.e., larger fraction of member galaxies are quiescent in more massive halos This aligns with previous observational results of Kimm et al. (2009); Woo et al. (2013). Then we can ask what makes this correlation between halo mass and QF. Satellite galaxies in more massive halos may experience stronger ram pressure stripping due to higher peculiar velocity (e.g. Bekki, 2009). Another possibility is that more massive halos may experienced more mergers with or accretion of groups or clusters. The satellite galaxies entered massive halos through this accretion of groups or clusters may be quenched in these groups or clusters (i.e., pre-processing Bianconi et al., 2018). Knowing which, among these, acts dominantly in shaping the correlation between QF and halo mass is out of scope of this paper. We plan to address this issue in our future work.
In the QF-halo mass diagram (Figure 3), perhaps more important than the correlation between QF and halo-mass is the existence of a lower envelope, indicating the presence of a minimum QF value that galaxy clusters have at a given halo mass. This suggests that in more massive halos, the quenching of member galaxies may occur more rapidly, or that these massive halos may impede the inflow of new star-forming galaxies. A more in-depth analysis of this phenomenon may be possible by studying how the QF-halo mass relationship evolves across a broader range of redshifts. We leave this as our future work.
5 Conclusion
Using model galaxies and halos at from Horizon Run 5 simulation, we investigate the star formation properties of galaxy clusters and groups and their dependence on various internal and external properties of these groups and clusters.
From this investigation, we found several interesting results, as follows:
-
1.
The quiescent galaxy fraction of clusters and groups show a positive correlation with their halo mass, , which we dub the ‘halo star-formation main sequence (HSFMS)’. We also find the halo-mass-dependent minimum values in quiescent galaxy fraction. Combined together, these results show that the halo mass is an important parameter to determine the quiescent galaxy fraction of clusters: majority of member galaxies in massive clusters are quiescent at already, while quiescent galaxy fraction spans broader range for less massive clusters or groups. The quiescent galaxy fraction of low mass halos is further affected by several other factors.
-
2.
We find that there exists a positive correlation between the quiescent galaxy fraction and the stellar mass ratio in a sense that halos with larger stellar mass ratio between the most and the second most member galaxies tend to have higher QF values. This trend is clearer for intermediate mass halos (). This stellar-mass dependence indicates that the evolutionary stage of a halo also affects the star-formation property of clusters or groups, especially the intermediate-mass halos. This stellar-mass ratio dependence of QF contributes to the scatter in QF for given halo mass, which is larger for intermediate mass halos.
-
3.
We investigate the dependence of the QF of halos on the large-scale environment, measured by FoF fraction. We find a weak correlation between these two properties, in a sense that clusters or groups which have more connected nearby overdense large-scale structure tend to have lower values of QF. This result confirms our previous, observational finding (Lee et al., 2019).
In this study, we delve into the SF characteristics of galaxy clusters and groups at a redshift of , with a specific focus on identifying the key factors that influence these properties. Intriguingly, our research reveals that multiple parameters, such as halo-mass, the evolutionary stage of the halo, and the large-scale environmental context, collaborate in shaping the SF status of clusters and groups at this specific redshift. Expanding our investigation to encompass a wider range of redshifts could provide a more comprehensive comprehension of the evolutionary trends governing these aspects of clusters and groups.
Acknowledgements
The authors thank the Korea Institute for Advanced Study for providing computing resources (KIAS Center for Advanced Computation Linux Cluster System) for this work. This work was supported by the National Research Foundation of Korea (NRF) grant funded by the Korean government (MSIT; Nos. 2020R1I1A1A01060310, 2020R1A2C3011091, 2021M3F7A1084525). JK was supported by a KIAS Individual Grant (KG039603) via the Center for Advanced Computation at Korea Institute for Advanced Study. This work benefited from the outstanding support provided by the KISTI National Supercomputing Center and its Nurion Supercomputer through the Grand Challenge Program (KSC-2018-CHA-0003 and KSC-2021-CHA-0012). Large data transfer was supported by KREONET, which is managed and operated by KISTI. JL is supported by the National Research Foundation of Korea (NRF-2021R1C1C2011626). BKG and CGF acknowledge the support of the European Union’s Horizon 2020 Research and Innovation Programme (ChETEC-INFRA - Project no. 101008324) and ongoing access to viper, the University of Hull’s High Performance Computing Facility. YK is supported by Korea Institute of Science and Technology Information (KISTI) under the institutional R&D project (K24L2M1C4). This work was also partly supported by the National Research Foundation of Korea(NRF) grant funded by the Korea government (MSIT, 2022M3K3A1093827).
Data Availability
HR5 data are not publically available, unless a researcher is in collaboration with HR5 team members. We encourage any researcher who is interested in using the HR5 to contact Prof. Changbom Park (cbp@kias.re.kr).
References
- Abadi et al. (1999) Abadi M. G., Moore B., Bower R. G., 1999, MNRAS, 308, 947
- Alberts et al. (2016) Alberts S., et al., 2016, ApJ, 825, 72
- Bahé et al. (2017) Bahé Y. M., et al., 2017, MNRAS, 470, 4186
- Baldry et al. (2006) Baldry I. K., Balogh M. L., Bower R. G., Glazebrook K., Nichol R. C., Bamford S. P., Budavari T., 2006, MNRAS, 373, 469
- Balogh et al. (2000) Balogh M. L., Navarro J. F., Morris S. L., 2000, ApJ, 540, 113
- Bekki (2009) Bekki K., 2009, MNRAS, 399, 2221
- Bianconi et al. (2018) Bianconi M., Smith G. P., Haines C. P., McGee S. L., Finoguenov A., Egami E., 2018, MNRAS, 473, L79
- Blanton & Berlind (2007) Blanton M. R., Berlind A. A., 2007, ApJ, 664, 791
- Chabrier (2003) Chabrier G., 2003, ApJ, 586, L133
- Chartab et al. (2020) Chartab N., et al., 2020, ApJ, 890, 7
- Dalgarno & McCray (1972) Dalgarno A., McCray R. A., 1972, ARA&A, 10, 375
- Damen et al. (2009) Damen M., Labbé I., Franx M., van Dokkum P. G., Taylor E. N., Gawiser E. J., 2009, ApJ, 690, 937
- Dubois & Teyssier (2008) Dubois Y., Teyssier R., 2008, A&A, 477, 79
- Dubois et al. (2012) Dubois Y., Devriendt J., Slyz A., Teyssier R., 2012, MNRAS, 420, 2662
- Dubois et al. (2014a) Dubois Y., Volonteri M., Silk J., 2014a, MNRAS, 440, 1590
- Dubois et al. (2014b) Dubois Y., et al., 2014b, MNRAS, 444, 1453
- Ellingson et al. (2001) Ellingson E., Lin H., Yee H. K. C., Carlberg R. G., 2001, ApJ, 547, 609
- Few et al. (2012) Few C. G., Courty S., Gibson B. K., Kawata D., Calura F., Teyssier R., 2012, MNRAS, 424, L11
- Finn et al. (2008) Finn R. A., Balogh M. L., Zaritsky D., Miller C. J., Nichol R. C., 2008, ApJ, 679, 279
- Gu et al. (2021) Gu Y., Fang G., Yuan Q., Lu S., Liu S., 2021, ApJ, 921, 60
- Gunn & Gott (1972) Gunn J. E., Gott J. Richard I., 1972, ApJ, 176, 1
- Haardt & Madau (1996) Haardt F., Madau P., 1996, ApJ, 461, 20
- Haas et al. (2012) Haas M. R., Schaye J., Jeeson-Daniel A., 2012, MNRAS, 419, 2133
- Hahn & Abel (2011) Hahn O., Abel T., 2011, MNRAS, 415, 2101
- Hayashi et al. (2019) Hayashi M., et al., 2019, PASJ, 71, 112
- Jeon et al. (2022) Jeon S., et al., 2022, ApJ, 941, 5
- Jimenez et al. (2005) Jimenez R., Panter B., Heavens A. F., Verde L., 2005, MNRAS, 356, 495
- Kauffmann et al. (2003) Kauffmann G., et al., 2003, MNRAS, 341, 54
- Kauffmann et al. (2004) Kauffmann G., White S. D. M., Heckman T. M., Ménard B., Brinchmann J., Charlot S., Tremonti C., Brinkmann J., 2004, MNRAS, 353, 713
- Kim et al. (2023) Kim J., et al., 2023, ApJ, 951, 137
- Kimm et al. (2009) Kimm T., et al., 2009, MNRAS, 394, 1131
- L’Huillier et al. (2014) L’Huillier B., Park C., Kim J., 2014, New Astron., 30, 79
- Larson et al. (1980) Larson R. B., Tinsley B. M., Caldwell C. N., 1980, ApJ, 237, 692
- Lee et al. (2015) Lee S.-K., Im M., Kim J.-W., Lotz J., McPartland C., Peth M., Koekemoer A., 2015, ApJ, 810, 90
- Lee et al. (2019) Lee S.-K., Im M., Hyun M., Park B., Kim J.-W., Kim D., Kim Y., 2019, MNRAS, 490, 135
- Lee et al. (2021) Lee J., et al., 2021, ApJ, 908, 11
- Lee et al. (2023) Lee J., et al., 2023, arXiv e-prints, p. arXiv:2308.00571
- Lewis et al. (2002) Lewis I., et al., 2002, MNRAS, 334, 673
- Lubin et al. (2009) Lubin L. M., Gal R. R., Lemaux B. C., Kocevski D. D., Squires G. K., 2009, AJ, 137, 4867
- Moore et al. (1996) Moore B., Katz N., Lake G., Dressler A., Oemler A., 1996, Nature, 379, 613
- Park et al. (2022) Park C., et al., 2022, ApJ, 937, 15
- Pasquali et al. (2009) Pasquali A., van den Bosch F. C., Mo H. J., Yang X., Somerville R., 2009, MNRAS, 394, 38
- Peng et al. (2010) Peng Y.-j., et al., 2010, ApJ, 721, 193
- Peng et al. (2015) Peng Y., Maiolino R., Cochrane R., 2015, Nature, 521, 192
- Planck Collaboration et al. (2016) Planck Collaboration et al., 2016, A&A, 594, A13
- Rasera & Teyssier (2006) Rasera Y., Teyssier R., 2006, A&A, 445, 1
- Rhee et al. (2020) Rhee J., Smith R., Choi H., Contini E., Jung S. L., Han S., Yi S. K., 2020, ApJS, 247, 45
- Scoccimarro (1998) Scoccimarro R., 1998, MNRAS, 299, 1097
- Sutherland & Dopita (1993) Sutherland R. S., Dopita M. A., 1993, ApJS, 88, 253
- Teyssier (2002) Teyssier R., 2002, A&A, 385, 337
- Tran et al. (2005) Tran K.-V. H., van Dokkum P., Illingworth G. D., Kelson D., Gonzalez A., Franx M., 2005, ApJ, 619, 134
- Wetzel et al. (2012) Wetzel A. R., Tinker J. L., Conroy C., 2012, MNRAS, 424, 232
- Woo et al. (2013) Woo J., et al., 2013, MNRAS, 428, 3306
- van den Bosch et al. (2008) van den Bosch F. C., Pasquali A., Yang X., Mo H. J., Weinmann S., McIntosh D. H., Aquino D., 2008, arXiv e-prints, p. arXiv:0805.0002