DriveStats: a Mobile Platform to Frame Effective Sustainable Driving Displays
Abstract.
Phone applications to track vehicle information have become more common place, providing insights into fuel consumption, vehicle status, and sustainable driving behaviors. However, to test what resonates with drivers without deep vehicle integration requires a proper research instrument. We built DriveStats: a reusable library (and encompassing an mobile app) to monitor driving trips and display related information. By providing estimated cost/emission reductions in a goal directed framework, we demonstrate how information utility can increase over the course of a 10 day diary study with a group of North American participants. Participants were initially interested in monetary savings reported increased utility for emissions-related information with increased app usage and resulted in self-reported sustainable behavior change. The DriveStats package can be used as a research probe for a plurality of mobility studies (driving, cycling, walking, etc.) for supporting mobile transportation research.
1. Introduction
Personal transportation is the largest contributor to people’s overall carbon footprint in many high-income countries (ActNow, [n. d.]). Significant opportunities exist to create mobile apps for everyday drivers to reduce emissions through sustainable driving practices, eco-driving, and post-purchase behaviors (Sivak and Schoettle, 2012). Active eco-driving—mindful management of acceleration, braking, and cornering—immediately improves energy efficiency and lowers greenhouse gas (GHG) emissions (Sivak and Schoettle, 2012). These behavioral interventions (i.e., coaching) can happen in cabin or in a mobile app (af Wåhlberg, 2007; Azzi et al., 2011). Mobile apps make it easier to track and display various driving performance data and metrics, providing drivers opportunities to adjust behavior for eco-driving and safety (Elvik, 2014; Ellison et al., 2015; Bergasa et al., 2014). However, disengagement can occur through pre-existing beliefs, unwelcome actions, and the information’s lack of personal relevance (Narayan et al., 2011; Sweeny et al., 2010; Golman et al., 2017). To understand how drivers perceive the personal utility of sustainability information, one needs a research probe to reflect daily driving habits and promote eco-behaviors.
In this study, we aim to test a goal-directed information framework (Sharot and Sunstein, 2020) focusing on major eco-driving incentives: fuel cost savings and CO2 emissions reduction. We developed a reusable library and iOS mobile app called DriveStats that we deployed in a 10-day diary study, where 27 drivers monitored potential fuel costs and CO2 savings based on their vehicle usage. The app featured personalized dashboards for both monetary and carbon information, and suggested saving goals over 3-day sliding windows. Drivers’ engagement with these displays were captured through online pre-and post-surveys and diary entries as well as in-app dwell time logs. Overall we find that although people tend to have more utility for information about costs, time with the app and goal-directed framings help increase utility towards emission information, making people more willing to adopt eco-friendly driving behaviors. Overall, we find that goal-directed framing amplifies information utility for eco-driving and promotes interest in CO2 savings. Further, we demonstrate and release the DriveStats iOS package as an open-source platform for creating in mobility-based research probes. We find in a goal-directed, eco-driving, and CO2 savings is amplified and information utility is increased. Further we assert one must test such information utility in real-world settings and we demonstrate a research probe as a proxy-application for doing so.
2. Related Work
While many commercial automakers make companion apps for their gas, hybrid, and electric vehicles. Without vehicle intergration, research in sustainable driving is accomplished in simulators (Van der Voort et al., 2001; Vaezipour et al., 2018; Colley et al., 2022) where the effects can be short lived (af Wåhlberg, 2007; Degraeuwe and Beusen, 2013). Personal mobile health apps have had their successes and failures as they are tied into personal habits and social networks (Murnane et al., 2015; Karolus et al., 2022; Freyne, 2014). To seek a similar embodiment for CO2 vehicular research, we aim to follow a similar pattern: a mobile app that accomponies individual drivers and reports money and sustainability information from personal driving.
2.1. Drivers’ Interest in Money versus Carbon Information
Research and public polls consistently find that drivers are motivated by the monetary and environmental benefits of eco-driving and electric vehicles (Lee et al., 2023; Peters et al., 2018; Reports, 2022; Dogan et al., 2014; Stillwater and Kurani, 2013; Kramer and Petzoldt, 2023a). Lee et al. (Lee et al., 2023) found that financial costs have a greater impact on decisions to purchase and charge plug-in hybrid vehicles, even for those identifying as environmentalists. However, although people express interest information about cost and CO2 savings, this information does not always influence behavior. Dogan et al. (Dogan et al., 2014) reported no significant difference between the impact of environmental and financial incentives on the intention to adopt eco-driving. Cost alone shows little to influence people’s driving behavior (Stillwater and Kurani, 2013; Kramer and Petzoldt, 2023b). One caveat in previous findings is the absence of a systematic approach to understand why different types of information receive varying levels of attention, often leading to inconsistent or weak intervention outcomes. For example, CO2 may not often enter daily considerations, resulting in less attention due to a lack of personal relevance.
2.2. Instrumental, Hedonic, and Cognitive Utilities of Information
Sharot, Sunstein, and colleagues (Sharot and Sunstein, 2020; Kelly and Sharot, 2021) developed an integrative framework to assess individuals’ motivations for seeking and avoiding information. This framework suggests that people are drawn to information they expect to provide positive “utility” across three key dimensions: (1) Instrumental utility: the practical usefulness of information in guiding actions toward external rewards or away from losses. (2) Hedonic utility: the emotional impact of information, sought after for positive emotions (e.g., joy from good news) and avoided when likely to induce negative feelings (e.g., distress from bad news). (3) Cognitive utility: how well information serves one’s mental models or important concepts. People are drawn to information related to topics they consider frequently. The overall utility of information is calculated as the weighted sum of these three utilities, with weights varying by individual (Sharot and Sunstein, 2020; Kelly and Sharot, 2021). Some individuals may prioritize information that offers practical benefits (instrumental utility), while others may value information that improves their emotional state (hedonic utility) or aligns with their interests (cognitive utility). People engage with personal information if its overall utility is positive, avoid it if negative, and remain indifferent if neutral.
2.3. Goal Framing May Enhance Information Utility
While Sharot and Sunstein’s framework (Sharot and Sunstein, 2020) offers deeper insight into the appeal of information, it does not provide strategies to enhance engagement with information perceived to have low utility—a significant challenge for sustainability initiatives. In the U.S., surveys indicate that environmental issues rank low in personal or national priorities and the public often views sustainability information (e.g., climate change, CO2 emissions) as having low utility (Tyson et al., 2023; Poushter et al., 2021). A promising strategy to boost information utility is goal-directed interventions, which concretize the potential outcomes of actions (Lindenberg and Steg, 2007; Noordzij et al., 2021). A goal consists of a clear objective (e.g., reducing carbon emissions by 10%) and can be framed positively or negatively (e.g., gaining health benefits or avoiding health risks (Tuk et al., 2021; Noordzij et al., 2021)). Goals are most effective for behavior change when they are deemed desirable, important, and feasible (Levin et al., 1998; Bergquist et al., 2023; Ploll et al., 2023; Lindenberg and Steg, 2013; Krishnamurthy et al., 2001; Haugtvedt et al., 2018; Bagozzi et al., 2003; Pinder et al., 2018; Locke and Latham, 2002), even among those who previously felt unconnected to the topic of the goal. As such, testing an information framework via a mobile application should include tests of goal-framing.
3. DriveStats Mobile Platform and Application
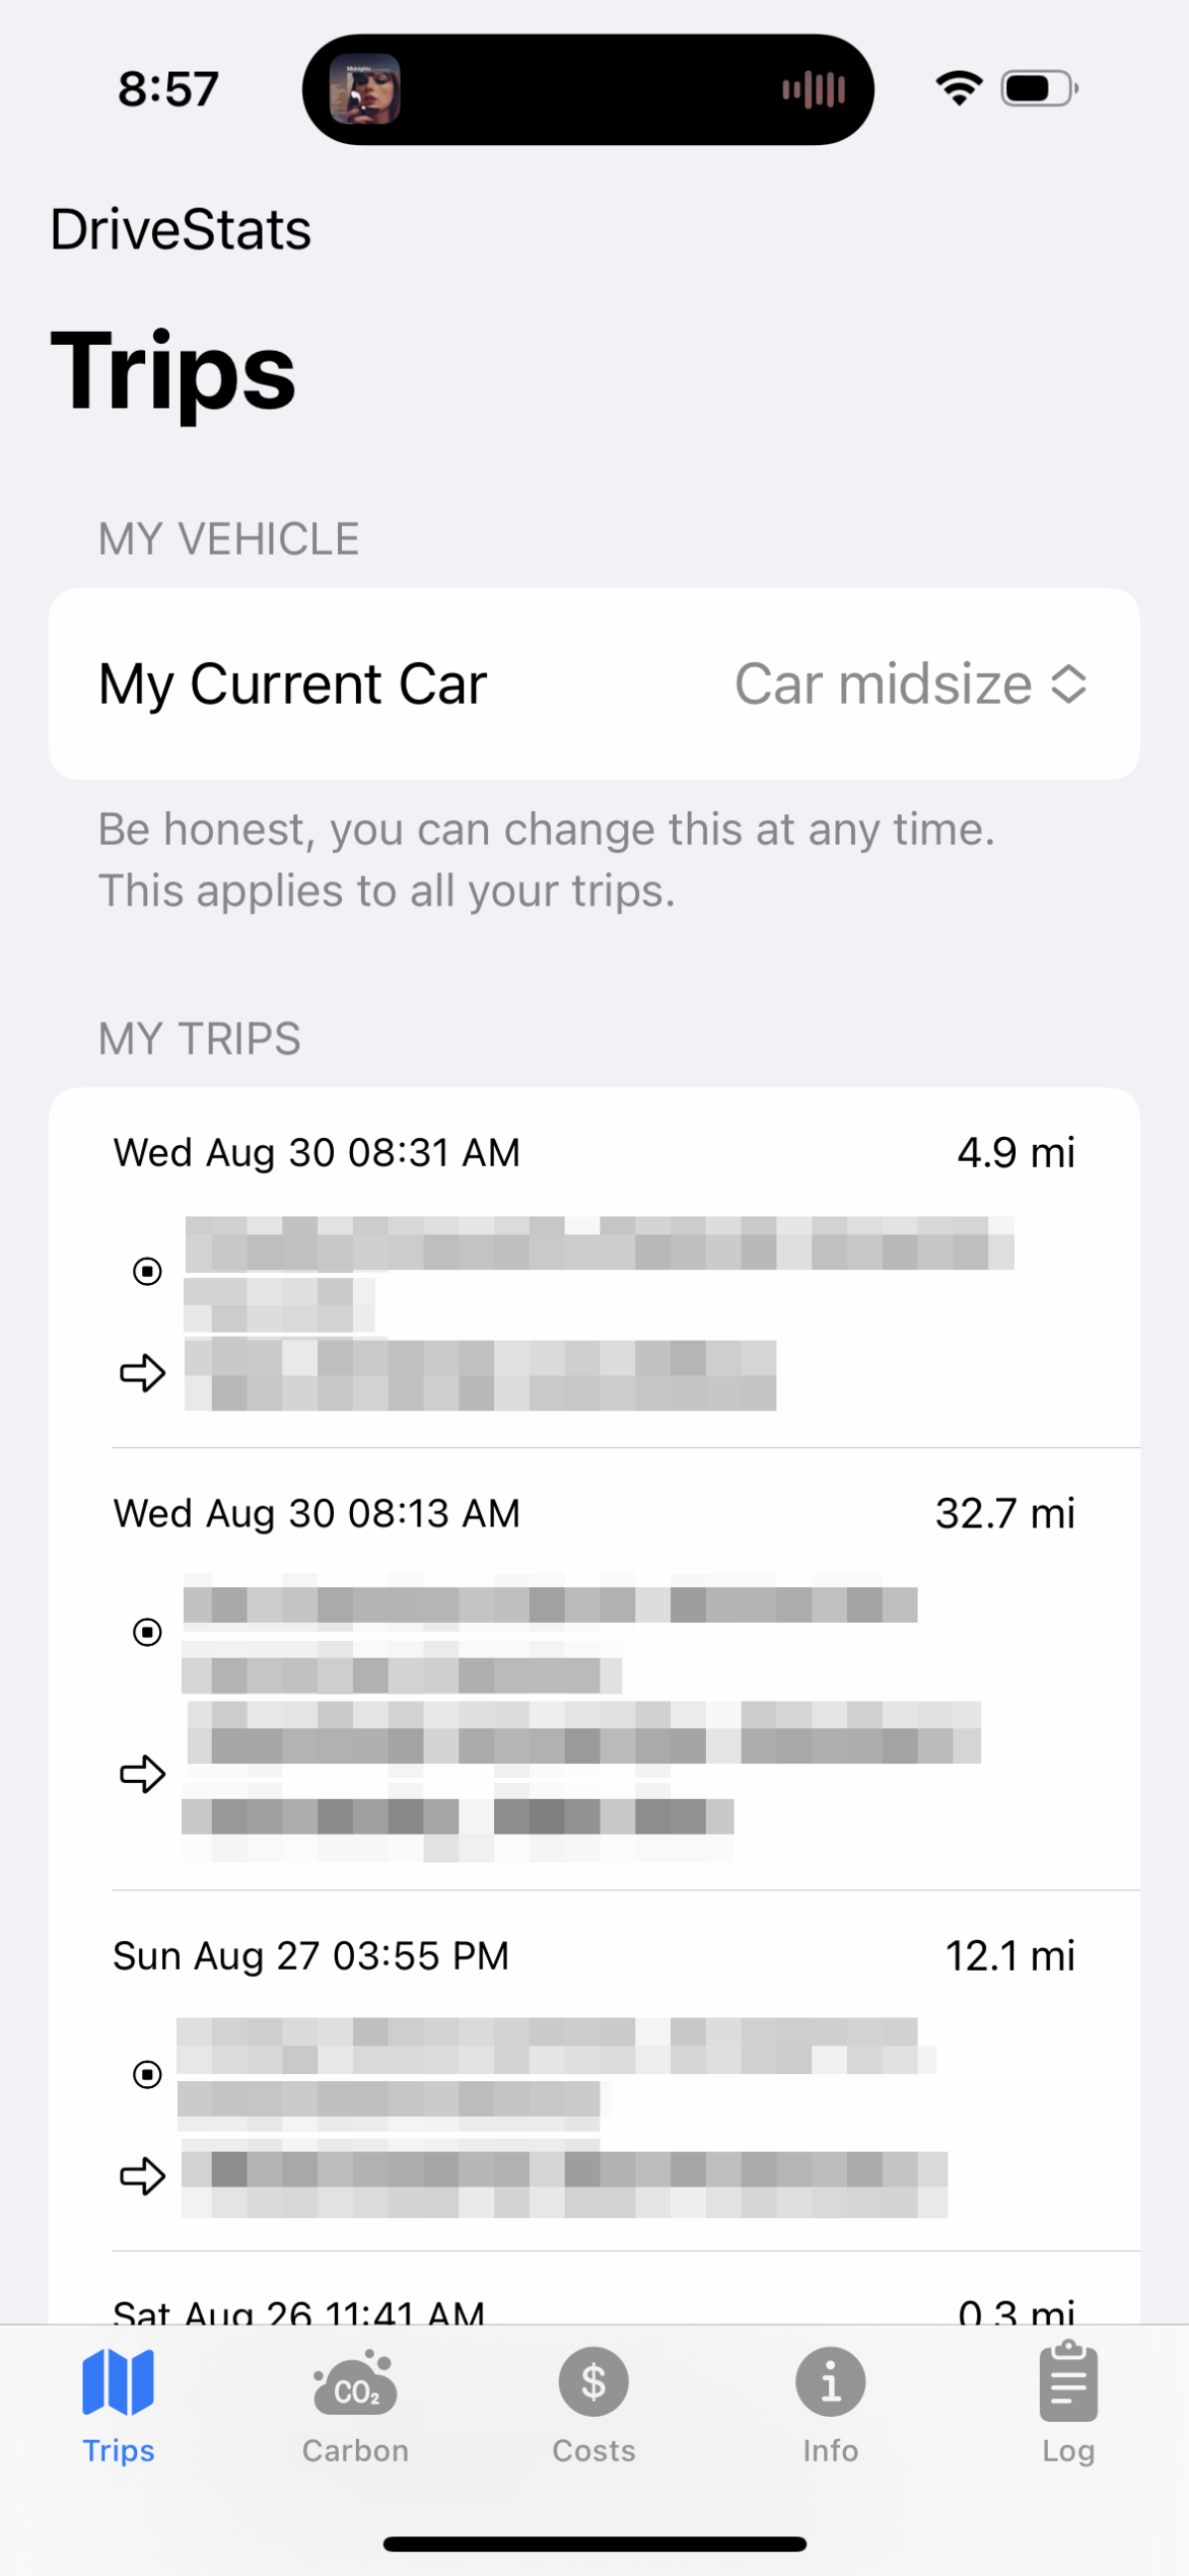
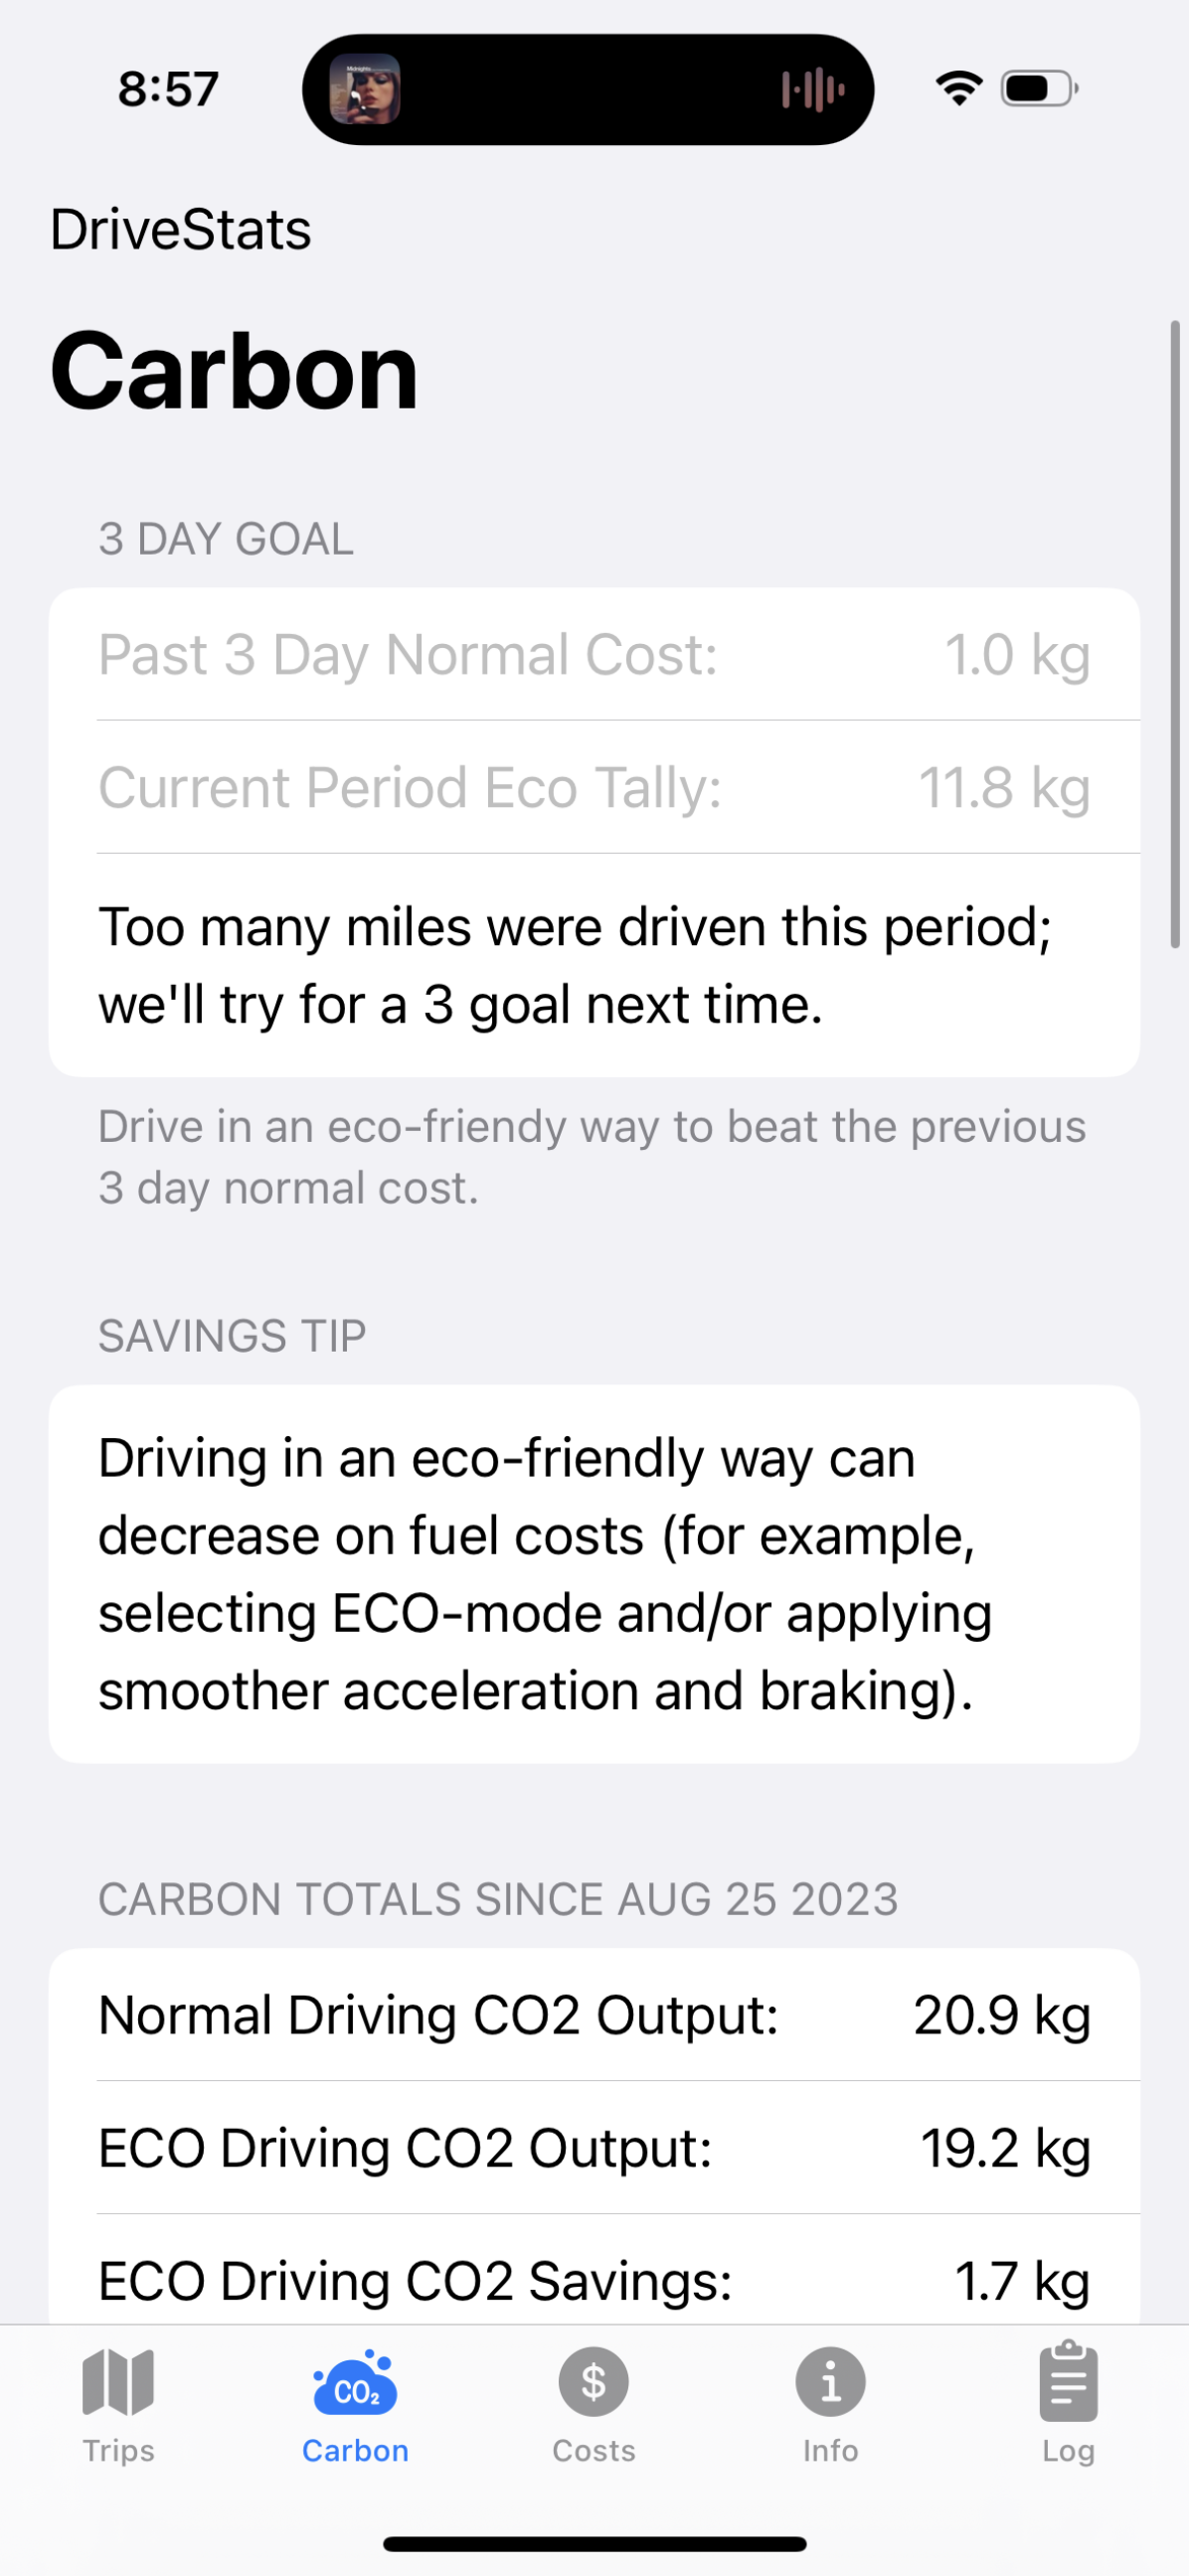
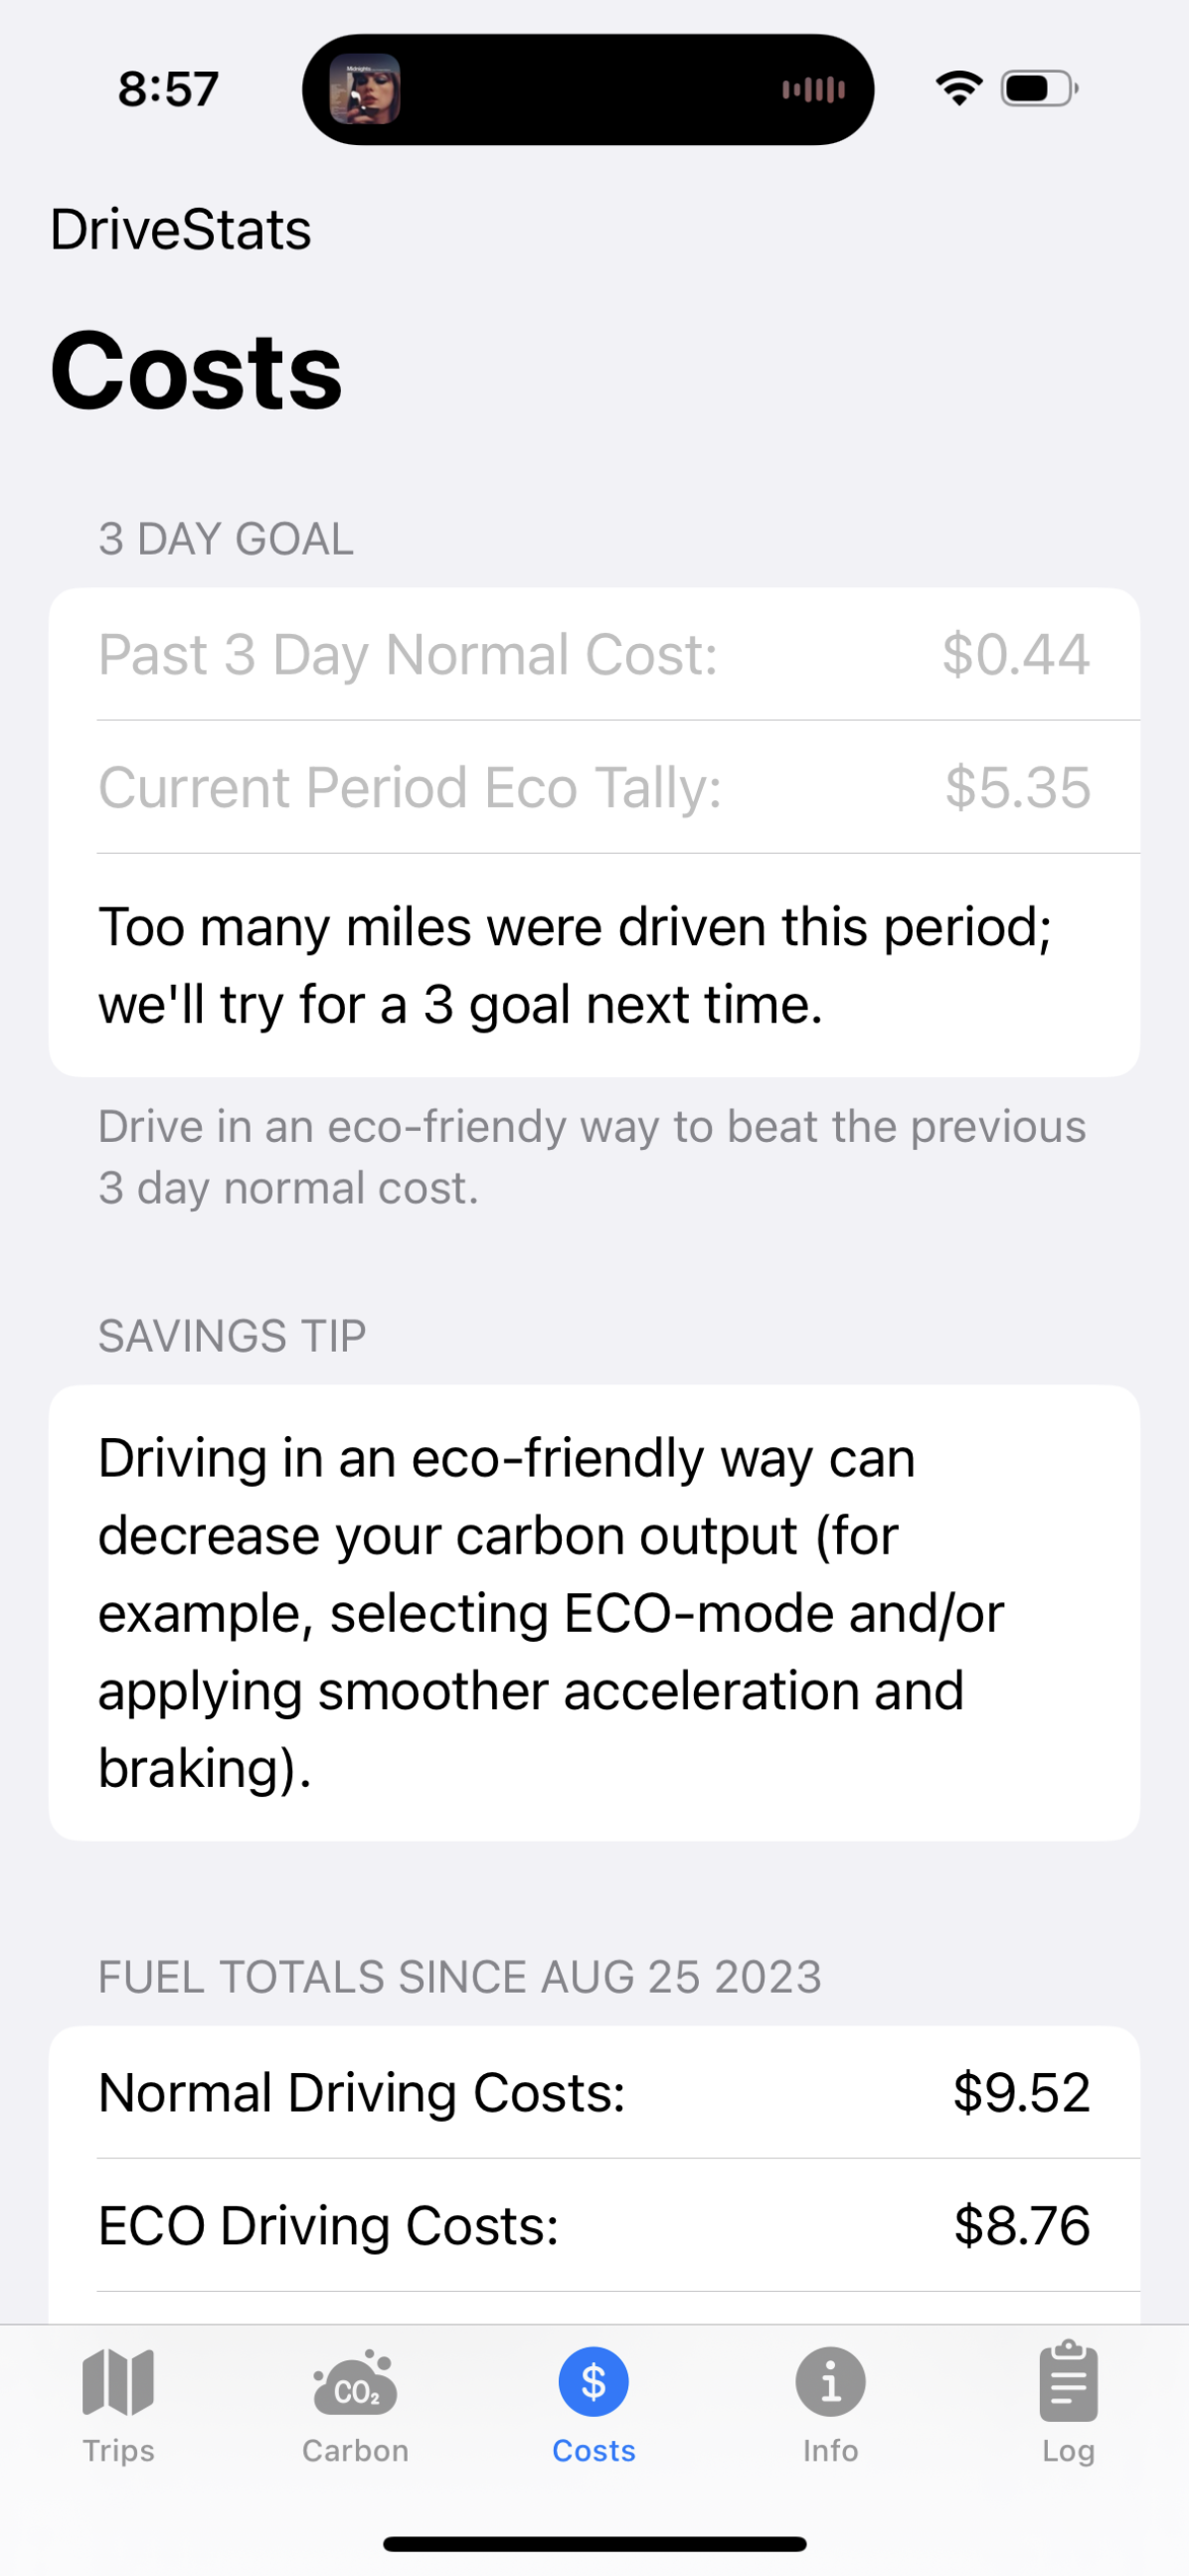
Three tabs from the app. The first showing trips (redacted for privacy). The second showing Carbon and the third showing Cost. The latter two show the 3-day goal at the top, a small driving tip for eco, and then the full counts below.
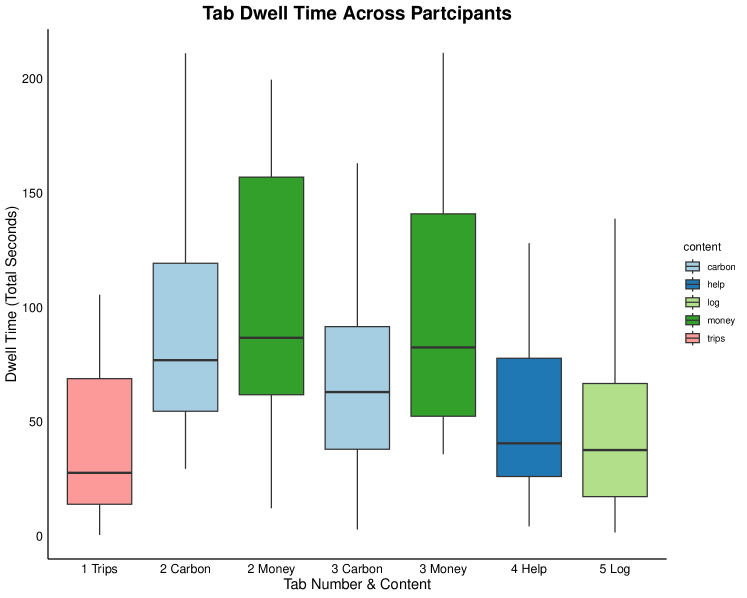
A box plot showing the dwell times on each tab. The IQR for money tabs exceeds the others.
In this study, we explore how drivers’ perceptions of utility regarding monetary and CO2 information evolve over time and assess how these perceptions influence their motivation for eco-driving within their personal driving contexts. Additionally, we evaluate whether integrating this information with specific goals enhances its impact. For this, we created an iOS package and app called DriveStats (Figure 1), which provides users with summaries of fuel costs and CO2 from their vehicle trips. DriveStats aims to promote more sustainable driving choices by offering personalized insights into fuel costs, emissions, and potential savings of these two. Modern smartphones facilitate automatic logging of trip data, which is essential for accurately calculating fuel consumption and emissions. While direct vehicle interfacing via APIs like SmartCar (smartcar, 2024) or Bluetooth OBD-II loggers (Agency, 2015) is possible, this approach can introduces complexities, such as the need for vehicle synchronization and privacy concerns. We applied our previous architecture of an application for vehicle interventions (Shamma et al., 2022) and created a custom front-end tailored to our study’s needs. This setup allowed us to focus on behavioral insights without technical complications associated with direct vehicle interfacing.
3.1. Identifying Car Trips
To identify car trips, we used Apple’s CoreLocation library to capture significant location changes using GPS coordinates and departure-arrival timestamps. We used the CoreMotion API to distinguish automotive activities from non-fuel-based motions such as walking and biking, and Mapkit to estimate the most probable routes taken between locations. We opted against live GPS tracking to avoid user privacy issues and excessive battery drain, ensuring the chosen APIs provided battery-efficient and sufficiently accurate data collection. Participants were consistently reminded that data shown in DriveStats are estimates based on probabilities and national averages, which might differ from actual metrics.
3.2. App Displays
The DriveStats app was built and distributed exclusively via TestFlight, Apple’s beta testing platform, for research purposes. The app was built using Apple’s basic SwiftUI framework, focusing on evaluating information needs rather than design aesthetics. The app was modeled from another research platform example (Shamma et al., 2022). DriveStats features five tabs. The first Trips tab (Figure 1(a)) lists all a user’s vehicle trips, with options to delete entries for privacy or irrelevance (e.g., taxi rides). In this tab, users can specify or change their vehicle type, which is used to calculate the fuel costs and carbon emissions of each trip. The next two tabs, randomly ordered at the first launch to prevent display order bias, summarize carbon output (Carbon tab, Figure 1(b)) and fuel costs (Costs tab, Figure 1(c)). Each tab displays a running total of estimated emissions and expenses, alongside potential reductions or savings if eco-mode was enabled or if the the driver self-reported eco-friendly by following tips in the app. These tabs also detail trip-by-trip data. After three days of logging, a snapshot of the previous three days’ fuel costs and carbon emissions is displayed at the top of each tab as a dynamic goal for users to achieve. If a user drives excessively, resulting in high emissions or costs, a notification suggests aiming for improvement in the next period. The fourth Info tab provides details about the app, eco-driving tips, and instructions on how to delete trips as needed. The final Research Log tab records CSV data, including Unix timestamps and tags indicating user interactions (e.g., tab clicks or changes in the app’s foreground/background status). At the study’s conclusion, participants submitted this log through the app. We analyzed these logs to measure dwell times, assessing how long participants engaged with different app tabs.
3.3. Computing Carbon and Fuel Costs
Fuel costs and carbon emissions are computed based on a list of generated trips. The process involves initial calculations of the cost and emissions for each trip, followed by computations of potential savings with eco-driving practices. The following methods ensure that our estimates of potential fuel and carbon savings are both realistic and tailored to the specific driving conditions and vehicle types of the participants. Fuel cost estimation: Fuel costs per mile are estimated using statistics from the U.S. Energy Information Administration (EPA, 2024), with a reference price of $3.85/gallon as the national average at the time of this study. Carbon Emission Calculation: We utilized CarGHG (carghg, 2023) to calculate fuel costs and CO2 emissions per mile for various vehicle types. CarGHG bases its calculations on an annual driving average of 13,500 miles, which was also adopted by our app. The calculations were expanded to include several vehicle types and powertrains using the EPA Green Vehicle Guide (of Energy, 2024), covering Internal Combustion Engine (ICE) and Hybrid Electric Vehicles (HEV). Battery Electric (BEV), Plug-in Hybrids (PHEV), and fuel cell vehicles were excluded from this study. Vehicle Selection in DriveStats: The app enables users to identify their current vehicle from various categories including small, midsized, and large cars, SUVs, and minivans, all available with ICE and HEV options, as well as trucks, station wagons, and sports cars. Computing Eco-Savings: We computed potential eco-savings based on previous research finding (Ivanov et al., 2019) that eco-driving modes can reduce fuel consumption by 7% to 17.5% in city driving, and 3.9% on highways We computed three savings tiers: trips under 5 miles were labeled as non-highway and displayed 17.5% in potential savings, trips over 15 miles were labeled as highway and given 3.9% savings, and trips 5–15 mile were given savings on a linear scale, ranging 17.5% to 3.9% as mileage increased.
3.4. Privacy Considerations
Any research application that stores trips as GPS data requires extra careful consideration due to privacy concerns. In this study, the primary focus was on diary recordings to understand how participants used the app and how the displayed information influenced their thoughts and feelings. Consequently, the app operated entirely client-side, storing no GPS data on remote servers. Participants could delete any trip or location directly within the app by swiping left on the entry, ensuring control over their data. They were informed about the app’s client-side nature and their ability to remove data before installation. The application maintained a local log of the following user interactions for analysis: (1) Application to foreground (2) Application to background (3) Tab focus: Trip, Carbon, Cost, Info, or Log. No other data was captured. At the study’s conclusion, participants manually copied and pasted this log to the researchers, reinforcing the transparency of the data handling process and ensuring that no GPS data was involuntarily extracted.
4. App Diary Study
We recruited 36 participants from the DScout usability testing platform (DScout, [n. d.]) for a 10-day diary study, offering a 200 USD incentive for completion. Participants varied across demographics, with 23 identifying as women, one as non-binary, and 12 as men, aged between 20 to 71 years. They were selected to represent a balanced mix of age, gender, and driving areas (urban, suburban, or rural); however all drivers resided in the USA which presents a limitation on the sample. All participants were daily drivers: 69.4% reported sometimes driving in urban areas, 72.2% in suburban areas, and 16.7% in rural areas. Each participant owned and regularly operated either an HEV or ICE vehicle, while drivers of PHEV and BEV were excluded from the study due to the different ways fuel costs apply to these vehicles. Educational backgrounds included 13 college graduates and 9 postgraduates, while income levels were mostly above $50,000 annually. All participants carried iPhones with iOS 16+ versions.
Out of the 36 individuals who agreed to participate in the study, three dropped out for unspecified reasons, and two were dismissed with partial compensation owing to technical issues with the app. Two other participants did not complete the final exit survey. Several others (P8, P19, P22, P27, P32) encountered glitches but were guided to complete the tasks to the best of their abilities. Ultimately, 27 participants successfully completed all required activities.
Participants were guided through the installation of the DriveStats app, setting necessary permissions, and learning usage guidelines, including not interacting with the app while driving. They were to use the app after taking a trip in their car and no data would update in the app until several minutes after driving was no longer detected. They engaged with DriveStats over 10 days in the summer of 2023, completing a series of activities as part of a diary study.
5. Results
5.1. Pre-Post Survey Analysis
To quantitatively evaluate the impact of the DriveStats app on perceived information utilities, we conducted paired t-tests comparing pre-launch and exit survey responses. The results revealed a significant increase in how often participants thought about fuel cost savings after using the app (post-pre mean = 0.58, p = 0.02, 95% CI = [0.10, 1.06]), indicating an increased cognitive utility of this information. Other types of utilities of monetary information, such as usefulness (instrumental) or emotions (hedonic) showed no significant changes. Notably, there was a significant increase in participants’ preference not to know about potential carbon emissions reductions after the intervention (post-pre mean = 0.94, p ¡ 0.001, 95% CI = [0.34, 1.53]), while other utilities of CO2 information did not change much. This may reflect growing discomfort associated with seeing carbon output data, possibly exacerbating feelings of obligation or pressure to improve, which contrasts with the anticipated desensitization through repeated exposure.
5.2. Dwell Time
In-app activity logs tracked events such as tab openings (with the Trips tab as the default) and instances of the app moving to the background or foreground. For this experiment, data was separated into tabs to encourage user engagement based on perceived utility and to facilitate dwell time analysis. Analysis revealed that participants spent more time on the Costs tab compared to the Carbon tab (Median-money: 86.7s; Median-carbon: 73.4s; Wilcox , ; Fig. 2). A slight display order effect was observed despite attempts to mitigate it by randomizing the order of the Money and Carbon tabs. The second tab displayed during a session consistently had a longer dwell time than the third (Median-second: 80.8s; Median-third: 73.4s; Wilcox , ), irrespective of its content.
5.3. Diary Entries
Qualitative feedback from diary entries uncovered nuances that were not highlighted as significant in the quantitative analyses. DriveStats tracks user trips and displays monetary and carbon data summarizing overall (from the start of the experiment), 3-day, and trip-by-trip totals. Beyond UI considerations, the app details costs and potential savings from eco-driving, providing tips for more the use of eco drive mode and active eco-driving practices.
5.3.1. Eco-Driving and Eco Mode.
By the midpoint check-in, most participants recalled, and reported practicing, at least one in-app eco-suggestion. However, participants noted a decline in actionable information as they continued using the app, attributing this to the static nature of the recommendations. They expressed a desire for more dynamic and detailed information about their driving habits. Enhancements such as tracking hard braking, providing personalized driving recommendations, and offering comparisons with other drivers were suggested to increase the app’s value. Some drivers, (P13 and P17), already considered themselves safe, conscious, and smooth drivers, before using the app. Of the 14 participants discussing eco mode, 11 viewed it favorably. P21 discovered their car had an eco mode and started using it, while P5 and P23 reported activating eco mode became a habit midway through the study. Conversely, P2 and P15 felt the minor savings didn’t justify its use. P24 preferred driving in “normal mode” for a more enjoyable driving experience and P7 felt eco-mode would damage their vehicle. These comments illustrate a range of perceptions and experiences with eco mode, from skepticism about its benefits to concerns over its impact on vehicle longevity.
5.3.2. Money
Participants showed a stronger interest in saving money over carbon. At the midpoint, 18 out of 27 drivers recalled cost savings with eco mode in the greatest detail without opening the app and monetary savings were brought up by P5, P7, P9, P20, P23, P26, P29, and P31. The app provided various perspectives on savings, emphasizing an accumulating effect (P9, P23, P26, P29, P31). Similarly, P26 and P29 started to reconsider their driving habits altogether, with P26 saying, “Understanding trip cost changes my decision, not just how I drive, but also if I would drive [at all].”
5.3.3. Carbon
Many participants found the CO2 tally increasingly interesting, though some found it confusing. Being curious about carbon emissions was one of the most frequently mentioned triggers for checking the app (12 mentions), along with “after a long drive or road trip” (15 mentions) and “before bed” (13 mentions). Also, 13 out of 27 vividly recalled estimated CO2 per trip without opening the app by the study’s midpoint; this recall was also highlighted in the diary study as participants stated CO2 was more on their mind (i.e. exhibited a higher cognitive information utility). P20 appreciated having a personal CO2 gauge. P14 stated CO2 savings were small but “significant,” further wondering about “a lot of cars’ incorporated savings.” P3 expressed a desire for accessible, relatable information that connects daily activities to global carbon reduction efforts. Not knowing what a kilogram of CO2 is led to further inquiries P1 stated “I don’t know. Did I save a tree?…Am I doing a good job?” Collectively, participants (like P1, P12, and P33) demonstrated a desire for more education on carbon impact (Mohanty et al., 2023). One participant (P28) stated CO2 was “not something I’m worried about.”
5.3.4. Goals
The app set goals by displaying a running total and a summary of the past three days, alongside overall totals. If a user exceeded their previous period’s sum, a message appeared: “You drove more than last period, try again when the current period resets.” The goal feature raised cognitive utility among some participants. P5 expressed interest in weekly goals, noting, “It was interesting to see the potential savings over that time frame.” This message was displayed at the top of the related Money or Carbon tab. P31 found the goal motivating, appreciating the breakdown of each trip’s costs and potential savings. P11 pointed out statistics are “kind of meaningless.” However, they found the goal feature: “one thing I actually found interesting…was the last three days, like, fuel cost.” P1 expressed dissatisfaction noting, “…I think, the app is telling me that I drove actually too much.”
6. Discussion
Modern connected cars carry in-cabin displays and mobile companion apps to let owners engage with information (and entertainment) beyond the traditional instrument cluster. There is an opportunity to further use these displays to improve sustainability. While surveys can show money as a primary factor (Lee et al., 2023), we find that carbon savings in a goal-directed framework may increase information utility when put in the context of one’s personal daily driving. However, one must frame this discussion under the deployed scope of a 10 day diary study in the USA.
6.1. Platform and Application
To test information displays in the context of daily driving, we built DriveStats as a reusable research platform. Utilizing native frameworks, the system determines vehicle trips without the need for deep car integration. Further, our design is anonymous and client-side, preserving privacy as there is no transmission of GPS coordinates back to the researchers and participants remain in control of their data. Several participants assumed the app was vehicle-connected; we assured them this was not the case. Currently, the platform is limited to iOS only but could be expanded further provided the API hooks required are present and engineering time can be spent. For the study, the app set goals based on a 3-day non-sliding window. A longer study would be required to establish history and a dynamic goal. Further, we built the platform to be open-source and to monitor all mobility and trips including cycling, walking, and other detectable modes of transportation to support various research questions and experiments. Additional development is also needed to incorporate other transportation types (commuter rails, water taxis, etc.) into the the framework via machine learning or applied heuristics, though during our diary study, these alternative transportation methods did not surface.
6.2. Money Attracts, But Amount Matters
Most participants were attracted to the fuel cost-saving aspect of eco-driving. Cost savings were deemed useful in guiding actions such as planning more efficient routes and budgeting for future trips. Cost savings also remained in users’ memory more frequently and often evoked positive emotions such as excitement, happiness, and pride. However, participants frequently attributed these feelings not just to saving money but also to the simultaneous reduction in carbon emissions. This dual benefit suggests the environmental savings were viewed as a valuable additional benefit, providing a moral buffer for those primarily concerned with costs. This finding may contrast with previous research (Schwartz et al., 2015; Kramer and Petzoldt, 2023b) that suggests monetary information undermines environmental concerns when it comes to sustainable behavior change. Beyond comparing prices at the pump, participants wanted personalized cost savings. Additionally, minor savings might be better reported as percentages (Shu et al., 2022; Filipowicz et al., 2023) to motivate positive driving habits.
6.3. Carbon’s Low Instrumental Utility, Promising Cognitive Utility, and Mixed Hedonic Utility
CO2 information utility was generally rated low as interpretation is arduous. Participants requested evaluative feedback such as “good” or “bad,” rather than raw numbers due to lack of reference. Moreover, despite reductions in CO2 emissions and fuel costs both deriving from reduced fuel consumption, participants often viewed them as separate issues, failing to see the correlation. Participants’ curiosity about carbon information increased through exposure to the app despite carbon’s initial irrelevance. Participants’ perception of hedonic utility in CO2 were particularly conflicting. Some expressed positive feelings after learning about potential carbon savings, while others experienced negative emotions such as guilt or frustration. While negative emotions can lead to information avoidance (Narayan et al., 2011; Sweeny et al., 2010; Golman et al., 2017), opportunities for effective interventions through better CO2 communication (Mohanty et al., 2023, 2022) and collective social interventions (Colley et al., 2022; Mohanty et al., 2023) could thrive when linked to personal daily habits.
7. Conclusions
To study interventions relating to people’s transportation behaviors, one must relate to their daily driving habits directly. To accomplish this, we present the DriveStats framework for rapid development of mobile applications relating to transportation, communing, or even physical activity (exercise or walking travel). Using this framework in an app-based diary study, we investigated drivers’ perceived value for information about driving-related fuel cost and emission reductions, examining how these perceptions influence user engagement with the information and, ultimately, eco-driving behaviors. We found that interest levels vary across different forms of information utility (instrumental, hedonic, and cognitive) depending on the type of information presented. Additionally, we observed that people’s perception of information utility perceptions can be increased with goal-framing. By unpacking what’s ‘interesting’ or ‘useful,’ future interventions can be better tailored to meet user information needs. Finally, we aim to iterate on DriveStats as an open-source platform to enable future research endeavors for automotive research.
Acknowledgements.
We would like to thank Fred Faust and Kalani Murakami for their help in developing the DriveStats platform. We also thank the anonymous reviewers for their constructive feedback.References
- (1)
- ActNow ([n. d.]) ActNow. [n. d.]. Facts and Figures. https://www.un.org/en/actnow/facts-and-figures. Accessed June 2024.
- af Wåhlberg (2007) A.E. af Wåhlberg. 2007. Long-term effects of training in economical driving: Fuel consumption, accidents, driver acceleration behavior and technical feedback. International Journal of Industrial Ergonomics 37, 4 (2007), 333–343. https://doi.org/10.1016/j.ergon.2006.12.003
- af Wåhlberg (2007) Anders E af Wåhlberg. 2007. Long-term effects of training in economical driving: Fuel consumption, accidents, driver acceleration behavior and technical feedback. International journal of industrial ergonomics 37, 4 (2007), 333–343.
- Agency (2015) United States Enviromental Protection Agency. 2015. Basic Information — On-Board Diagnostics (OBD). http://www.epa.gov/obd/basic.htm Accessed June 2015.. United States Enviromental Protection Agency.
- Azzi et al. (2011) S. Azzi, G. Reymond, F. Mérienne, and A. Kemeny. 2011. Eco-Driving Performance Assessment With in-Car Visual and Haptic Feedback Assistance. Journal of Computing and Information Science in Engineering 11, 4 (09 2011), 041005. https://doi.org/10.1115/1.3622753 arXiv:https://asmedigitalcollection.asme.org/computingengineering/article-pdf/11/4/041005/5585885/041005_1.pdf
- Bagozzi et al. (2003) Richard P Bagozzi, Utpal M Dholakia, and Suman Basuroy. 2003. How effortful decisions get enacted: The motivating role of decision processes, desires, and anticipated emotions. Journal of Behavioral Decision Making 16, 4 (2003), 273–295.
- Bergasa et al. (2014) Luis M Bergasa, Daniel Almería, Javier Almazán, J Javier Yebes, and Roberto Arroyo. 2014. Drivesafe: An app for alerting inattentive drivers and scoring driving behaviors. In 2014 IEEE Intelligent Vehicles symposium proceedings. IEEE, 240–245.
- Bergquist et al. (2023) Magnus Bergquist, Maximilian Thiel, Matthew H Goldberg, and Sander van der Linden. 2023. Field interventions for climate change mitigation behaviors: A second-order meta-analysis. Proceedings of the National Academy of Sciences 120, 13 (2023), e2214851120.
- carghg (2023) carghg 2023. CarGHG. https://carghg.org. Accessed June 2024.
- Colley et al. (2022) Mark Colley, Jan Ole Rixen, Italgo Walter Pellegrino, and Enrico Rukzio. 2022. (Eco-)Logical to Compare? - Utilizing Peer Comparison to Encourage Ecological Driving in Manual and Automated Driving. In Proceedings of the 14th International Conference on Automotive User Interfaces and Interactive Vehicular Applications (Seoul, Republic of Korea) (AutomotiveUI ’22). Association for Computing Machinery, New York, NY, USA, 24–33. https://doi.org/10.1145/3543174.3545256
- Degraeuwe and Beusen (2013) Bart Degraeuwe and Bart Beusen. 2013. Corrigendum on the paper “Using on-board data logging devices to study the longer-term impact of an eco-driving course”. Transportation research part D: transport and environment 19 (2013), 48–49.
- Dogan et al. (2014) Ebru Dogan, Jan Willem Bolderdijk, and Linda Steg. 2014. Making Small Numbers Count: Environmental and Financial Feedback in Promoting Eco-driving Behaviours. J. Consumer Policy 37, 3 (Sept. 2014), 413–422.
- DScout ([n. d.]) DScout [n. d.]. DScout. dscout.com. Accessed June 2024.
- Ellison et al. (2015) Adrian B Ellison, Stephen P Greaves, and Michiel CJ Bliemer. 2015. Driver behaviour profiles for road safety analysis. Accident Analysis & Prevention 76 (2015), 118–132.
- Elvik (2014) Rune Elvik. 2014. Rewarding safe and environmentally sustainable driving: systematic review of trials. Transportation Research Record 2465, 1 (2014), 1–7.
- EPA (2024) EPA. 2024. Gasoline and Diesel Fuel Update. https://www.eia.gov/petroleum/gasdiesel/. Accessed June 2024.
- Filipowicz et al. (2023) Alexandre L. S. Filipowicz, Nayeli Suseth Bravo, Rumen Iliev, Vikram Mohanty, Charlene C. Wu, and David A. Shamma. 2023. Promoting Sustainable Charging Through User Interface Interventions. In Proceedings of the 15th International Conference on Automotive User Interfaces and Interactive Vehicular Applications (Ingolstadt, Germany) (AutomotiveUI ’23). Association for Computing Machinery, New York, NY, USA, 267–279. https://doi.org/10.1145/3580585.3607176
- Freyne (2014) Jill Freyne. 2014. Mobile health: beyond consumer apps. In Proceedings of the 16th International Conference on Human-Computer Interaction with Mobile Devices & Services (Toronto, ON, Canada) (MobileHCI ’14). Association for Computing Machinery, New York, NY, USA, 565–566. https://doi.org/10.1145/2628363.2645670
- Gimpel et al. (2013) Henner Gimpel, Marcia Nißen, and Roland Görlitz. 2013. Quantifying the quantified self: A study on the motivations of patients to track their own health. (2013).
- Golman et al. (2017) Russell Golman, David Hagmann, and George Loewenstein. 2017. Information avoidance. Journal of economic literature 55, 1 (2017), 96–135.
- Haugtvedt et al. (2018) Curtis P Haugtvedt, Paul M Herr, and Frank R Kardes. 2018. Goal-Directed Consumer Behavior: Motivation, Volition, and Affect. In Handbook of consumer psychology. Routledge, 376–401.
- Ivanov et al. (2019) Yavor Ivanov, Rosen Ivanov, Georgi Kadikyanov, Gergana Staneva, and Igor Danilov. 2019. A study of the fuel consumption of hybrid car Toyota Yaris. Transport Problems 14 (2019).
- Karolus et al. (2022) Jakob Karolus, Eva Brass, Thomas Kosch, Albrecht Schmidt, and Pawel Wozniak. 2022. Mirror, Mirror on the Wall: Exploring Ubiquitous Artifacts for Health Tracking. In Proceedings of the 20th International Conference on Mobile and Ubiquitous Multimedia (Leuven, Belgium) (MUM ’21). Association for Computing Machinery, New York, NY, USA, 148–157. https://doi.org/10.1145/3490632.3490671
- Kelly and Sharot (2021) Christopher A Kelly and Tali Sharot. 2021. Individual differences in information-seeking. Nature communications 12, 1 (2021), 7062.
- Kramer and Petzoldt (2023a) Jule Kramer and Tibor Petzoldt. 2023a. Environmental, altruistic, or monetary benefits? A longitudinal online experiment on how framed behavioral consequences affect self-reported eco-driving of German vehicle owners. Transp. Res. Part F Traffic Psychol. Behav. 93 (Feb. 2023), 204–221.
- Kramer and Petzoldt (2023b) Jule Kramer and Tibor Petzoldt. 2023b. Environmental, altruistic, or monetary benefits? A longitudinal online experiment on how framed behavioral consequences affect self-reported eco-driving of German vehicle owners. Transportation research part F: traffic psychology and behaviour 93 (2023), 204–221.
- Krishnamurthy et al. (2001) Parthasarathy Krishnamurthy, Patrick Carter, and Edward Blair. 2001. Attribute Framing and Goal Framing Effects in Health Decisions. Organizational Behavior and Human Decision Processes 85, 2 (July 2001), 382–399.
- Lee et al. (2023) Matthew L Lee, Scott Carter, Rumen Iliev, Nayeli Suseth Bravo, Monica P Van, Laurent Denoue, Everlyne Kimani, Alexandre L. S. Filipowicz, David A. Shamma, Kate A Sieck, Candice Hogan, and Charlene C. Wu. 2023. Understanding People’s Perception and Usage of Plug-in Electric Hybrids. In Proceedings of the 2023 CHI Conference on Human Factors in Computing Systems (¡conf-loc¿, ¡city¿Hamburg¡/city¿, ¡country¿Germany¡/country¿, ¡/conf-loc¿) (CHI ’23). Association for Computing Machinery, New York, NY, USA, Article 201, 21 pages. https://doi.org/10.1145/3544548.3581301
- Levin et al. (1998) I P Levin, S L Schneider, and G J Gaeth. 1998. All Frames Are Not Created Equal: A Typology and Critical Analysis of Framing Effects. Organizational Behavior and Human Decision Processes 76, 2 (Nov. 1998), 149–188.
- Lindenberg and Steg (2007) Siegwart Lindenberg and Linda Steg. 2007. Normative, gain and hedonic goal frames guiding environmental behavior. Journal of Social issues 63, 1 (2007), 117–137.
- Lindenberg and Steg (2013) S Lindenberg and L Steg. 2013. Goal-framing theory and norm-guided environmental behavior. In Encouraging Sustainable Behavior, H van Trijp (Ed.). api.taylorfrancis.com, 37–54.
- Locke and Latham (2002) Edwin A Locke and Gary P Latham. 2002. Building a practically useful theory of goal setting and task motivation: A 35-year odyssey. American psychologist 57, 9 (2002), 705.
- Mohanty et al. (2023) Vikram Mohanty, Alexandre LS Filipowicz, Nayeli Suseth Bravo, Scott Carter, and David A Shamma. 2023. Save A Tree or 6 kg of CO2? Understanding Effective Carbon Footprint Interventions for Eco-Friendly Vehicular Choices. In Proceedings of the 2023 CHI Conference on Human Factors in Computing Systems. 1–24.
- Mohanty et al. (2022) Vikram Mohanty, Alexandre L. S. Filipowicz, Nayeli Suseth Bravo, Rumen Iliev, Scott Carter, and David A. Shamma. 2022. Pick Your CARbon: User Perceptions of Equivalencies for Carbon Emissions When Selecting Rideshares. In Adjunct Proceedings of the 14th International Conference on Automotive User Interfaces and Interactive Vehicular Applications (Seoul, Republic of Korea) (AutomotiveUI ’22). Association for Computing Machinery, New York, NY, USA, 48–52. https://doi.org/10.1145/3544999.3552530
- Murnane et al. (2015) Elizabeth L. Murnane, David Huffaker, and Gueorgi Kossinets. 2015. Mobile health apps: adoption, adherence, and abandonment. In Adjunct Proceedings of the 2015 ACM International Joint Conference on Pervasive and Ubiquitous Computing and Proceedings of the 2015 ACM International Symposium on Wearable Computers (Osaka, Japan) (UbiComp/ISWC’15 Adjunct). Association for Computing Machinery, New York, NY, USA, 261–264. https://doi.org/10.1145/2800835.2800943
- Narayan et al. (2011) Bhuva Narayan, Donald O Case, and Sylvia L Edwards. 2011. The role of information avoidance in everyday-life information behaviors. Proceedings of the American Society for Information Science and Technology 48, 1 (2011), 1–9.
- Noordzij et al. (2021) Gera Noordzij, Lisenne Giel, and Heleen van Mierlo. 2021. A meta-analysis of induced achievement goals: the moderating effects of goal standard and goal framing. Social Psychology of Education 24 (2021), 195–245.
- of Energy (2024) US Department of Energy. 2024. Fuel Economy Data. https://www.fueleconomy.gov/feg/download.shtml. Accessed June 2024.
- Pérez-Moreno et al. (2015) Elisa Pérez-Moreno, María José Hernández-Lloreda, Trinidad Ruiz Gallego-Largo, and Miguel Ángel Castellanos. 2015. Impulsive driving: Definition and measurement using the I-Driving Scale (IDS). The Spanish journal of psychology 18 (2015), E93.
- Peters et al. (2018) A M Peters, E van der Werff, and L Steg. 2018. Beyond purchasing: Electric vehicle adoption motivation and consistent sustainable energy behaviour in The Netherlands. Energy Research & Social Science 39 (May 2018), 234–247.
- Pinder et al. (2018) Charlie Pinder, Jo Vermeulen, Benjamin R Cowan, and Russell Beale. 2018. Digital behaviour change interventions to break and form habits. ACM Transactions on Computer-Human Interaction (TOCHI) 25, 3 (2018), 1–66.
- Ploll et al. (2023) Ursula Ploll, Nina Weingarten, and Monika Hartmann. 2023. Frame by frame, attitude by attitude – The effect of information framing in videos on consumers’ acceptance of sustainable food production innovations. J. Environ. Psychol. 92 (Dec. 2023), 102185.
- Poushter et al. (2021) Jacob Poushter, Moira Fagan, and Christine Huang. 2021. Americans are less concerned – but more divided – on climate change than people elsewhere. https://www.pewresearch.org/short-reads/2021/09/14/americans-are-less-concerned-but-more-divided-on-climate-change-than-people-elsewhere/. Accessed: 2024-3-14.
- Reports (2022) Consumer Reports. 2022. Consumer Reports Fuel Economy Survey, 2022 [Dataset]. Roper #31120589, Version 1. National Opinion Research Center (NORC) [producer]. Cornell University, Ithaca, NY: Roper Center for Public Opinion Research [distributor]. Access Date: Apr-16-2024.
- Schwartz et al. (2015) Daniel Schwartz, Wändi Bruine de Bruin, Baruch Fischhoff, and Lester Lave. 2015. Advertising energy saving programs: The potential environmental cost of emphasizing monetary savings. J. Exp. Psychol. Appl. 21, 2 (June 2015), 158–166.
- Shamma et al. (2022) David A. Shamma, Matthew L. Lee, Alexandre L. S. Filipowicz, Laurent Denoue, Kate Glazko, Kalani Murakami, and Kent Lyons. 2022. EV Life: A Counterfactual Dashboard Towards Reducing Carbon Emissions of Automotive Behaviors. In 27th International Conference on Intelligent User Interfaces (Helsinki, Finland) (IUI ’22 Companion). Association for Computing Machinery, New York, NY, USA, 46–49. https://doi.org/10.1145/3490100.3516451
- Sharot and Sunstein (2020) Tali Sharot and Cass R Sunstein. 2020. How people decide what they want to know. Nature Human Behaviour 4, 1 (2020), 14–19.
- Shu et al. (2022) Stephen Shu, Hal Hershfield, Richard Mason, and Shlomo Benartzi. 2022. Reducing Savings Gaps Through Pennies Versus Percent Framing. Available at SSRN 4042843 (2022).
- Sivak and Schoettle (2012) Michael Sivak and Brandon Schoettle. 2012. Eco-driving: Strategic, tactical, and operational decisions of the driver that influence vehicle fuel economy. Transport Policy 22 (2012), 96–99. https://doi.org/10.1016/j.tranpol.2012.05.010
- smartcar (2024) smartcar 2024. SmartCar. https://smartcar.com. Accessed June 2024.
- Stillwater and Kurani (2013) Tai Stillwater and Kenneth S. Kurani. 2013. Drivers discuss ecodriving feedback: Goal setting, framing, and anchoring motivate new behaviors. Transportation Research Part F: Traffic Psychology and Behaviour 19 (2013), 85–96. https://doi.org/10.1016/j.trf.2013.03.007
- Sweeny et al. (2010) Kate Sweeny, Darya Melnyk, Wendi Miller, and James A Shepperd. 2010. Information avoidance: Who, what, when, and why. Review of general psychology 14, 4 (2010), 340–353.
- Tuk et al. (2021) Mirjam A Tuk, Sonja Prokopec, and Bram Van den Bergh. 2021. Do versus Don’t: The Impact of Framing on Goal-Level Setting. Journal of Consumer Research 47, 6 (March 2021), 1003–1024.
- Tyson et al. (2023) Alec Tyson, Cary Funk, and Brian Kennedy. 2023. What the data says about Americans’ views of climate change. https://www.pewresearch.org/short-reads/2023/08/09/what-the-data-says-about-americans-views-of-climate-change/. Accessed: 2024-3-14.
- Vaezipour et al. (2018) Atiyeh Vaezipour, Andry Rakotonirainy, Narelle Haworth, and Patricia Delhomme. 2018. A simulator evaluation of in-vehicle human machine interfaces for eco-safe driving. Transportation Research Part A: Policy and Practice 118 (2018), 696–713.
- Van der Voort et al. (2001) Mascha Van der Voort, Mark S Dougherty, and Martin van Maarseveen. 2001. A prototype fuel-efficiency support tool. Transportation Research Part C: Emerging Technologies 9, 4 (2001), 279–296.