Chemical freeze-out curve in heavy-ion collisions and the QCD critical point
Abstract
The chemical freeze-out curve in heavy-ion collisions is investigated in the context of QCD critical point (CP) search at finite baryon densities. Taking the hadron resonance gas picture at face value, chemical freeze-out points at a given baryochemical potential provide a lower bound on the possible temperature of the QCD CP. We first verify that the freeze-out data in heavy-ion collisions are well described by a constant energy per particle curve, , under strangeness neutrality conditions (, ). We then evaluate the hypothetical freeze-out curve based on this criterion in the absence of strangeness neutrality (, ) and confront it with recent predictions on the CP location. We find that recent estimates based on Yang-Lee edge singularities from lattice QCD data on coarse lattices place the CP significantly below the freeze-out curve and are thus disfavored by the heavy-ion data. On the other hand, predictions based on functional methods and holography place the CP slightly above the freeze-out curve, indicating that the QCD CP may be located very close to the chemical freeze-out in A+A collisions at GeV.
I Introduction
Recently, quantum chromodynamics (QCD) turned 50 years old. Identifying the phases and structure of strongly interacting matter is one of the outstanding issues in modern nuclear physics. A chiral crossover transition at vanishing baryon density and a pseudocritical temperature MeV has been well established Aoki et al. (2006); Borsanyi et al. (2010); Bazavov et al. (2014). Whether the analytic crossover turns into a first-order phase transition at finite baryon density at a QCD critical point (CP) remains an open question studied both theoretically, and experimentally through heavy-ion collisions Stephanov et al. (1998, 1999); Adam et al. (2021); Adamczewski-Musch et al. (2020).
First-principle lattice QCD constraints on the QCD CP come to rely on extrapolations from vanishing and imaginary . The state-of-the-art results show no indications for the CP at small baryon densities and disfavor its existence at Borsanyi et al. (2020); Bazavov et al. (2019); Vovchenko et al. (2018a). Similar conclusion can be drawn from the measurements of proton number cumulants in heavy-ion collisions Acharya et al. (2020); Abdallah et al. (2021), which are consistent with non-critical effects at collision energies GeV Vovchenko et al. (2022), where is the collision energy per nucleon pair in center of mass frame.
Theoretical predictions for the QCD CP have also evolved from early days Stephanov (2004), now being increasingly constrained to lattice QCD data at . These are based either on the expected universal behavior of Yang-Lee edge singularities in the vicinity of the CP and the extrapolation of the lattice data to lower temperatures Basar (2024); Clarke et al. (2024), or on effective QCD approaches such as Dyson-Schwinger equations Gunkel and Fischer (2021), functional renormalization group Fu et al. (2020), or holography Hippert et al. (2023). These different predictions place the QCD CP in roughly the same ballpark of MeV and MeV.
These results indicate the possibility that the CP can be explored in heavy-ion collisions that probe baryon-rich matter. It remains an open question, however, how close these CP estimates are to the freeze-out curve in heavy-ion collisions. All the CP estimates have been obtained at vanishing charge and strangeness chemical potentials, , while in heavy-ion collisions, these are non-zero due to strangeness neutrality and the initial isospin asymmetry in colliding nuclei. Here we address this issue by reevaluating the chemical freeze-out curve and its hypothetical counterpart under conditions.
First, we show that a constant energy per particle line, GeV in the hadron resonance gas (HRG) model under strangeness neutrality and charge-to-baryon ratio describes well the available chemical freeze-out data in a broad collision energy range GeV. Next, we evaluate the same GeV line at vanishing charge and strangeness chemical potentials, , which would correspond to the hypothetical heavy-ion collisions with the corresponding electric charge and strangeness content. We then compare this line in the - plane with the recent CP estimates and discuss how close they are to the freeze-out curve and at which energies.
The paper is organized as follows. In Sec. II we briefly revisit the HRG model. In Sec. III we discuss the world data of chemical freeze-out points in the - and how these can be described by the constant energy per particle criterion. In Sec. IV, we examine the chemical freeze-out line in the context of QCD critical point search and reevaluate the line under conditions. Summary in Sec. V closes the article.
II Hadron resonance gas model
We use the hadron resonance gas (HRG) model Hagedorn (1965); Dashen et al. (1969); Venugopalan and Prakash (1992) in our calculations. The model describes the equilibrated hadronic system as a multi-component gas of hadrons and resonance. The essence of this model is described in detail in Refs. Cleymans and Satz (1993); Vovchenko et al. (2015a). We perform most of our calculations within the ideal HRG (Id-HRG) model but also consider its two extensions – the excluded volume hadron resonance gas (EV-HRG) Vovchenko et al. (2017a) and quantum van der Waals hadron resonance gas (QvdW-HRG) Vovchenko et al. (2017b). The calculations are performed in the grand-canonical ensemble.
In the case of the Id-HRG, the grand canonical pressure, energy density, and particle number densities are calculated as follows:
| (1) | ||||
| (2) | ||||
| (3) | ||||
| (4) | ||||
| (5) |
where and is the energy density, is the particle number density, is the number of internal degrees of freedom, is the chemical potential of th type of hadrons. Three fundamental chemical potentials , , and regulate the three conserved charges in strong interactions, and , , and are, respectively, the baryonic, electric, and strange charges of hadrons of the th type. In Eq. (2) ”-1” is chosen for bosons, and ”+1” - for fermions.
Resonances are also included in the HRG model. The resonance widths are taken into account as the integrals over their masses in Eq. (1). They are calculated according to the energy-dependent Breit-Wigner prescription Vovchenko et al. (2018b).
We also consider an extension of the Id-HRG model (see Appendix A) that takes into account the repulsive and attractive interactions among (anti)baryons. This is done within the QvdW-HRG model (Ref. Vovchenko et al. (2017b)). Calculations are performed using the Thermal-FIST (Ref. Vovchenko and Stoecker (2019)) software, which is freely available.
III Chemical freeze-out line and constant energy per particle
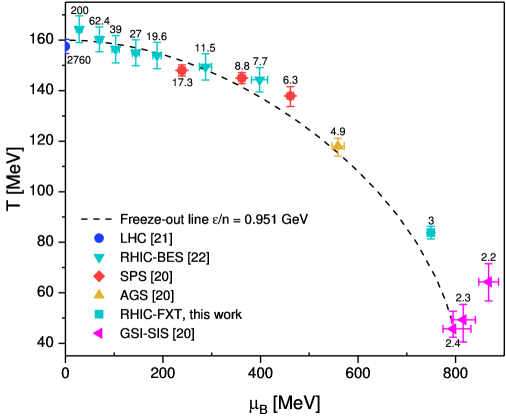
Chemical freeze-out (F-O) is a stage of nucleus-nucleus collisions where the chemical composition of (primordial) hadrons becomes fixed, with subsequent changes in hadron abundances occurring only through resonance decays. At each collision energy, chemical F-O corresponds to a pair of - values, with primordial hadron abundances computed in the framework of the HRG model. This simple model has proven to be very successful in describing the measured yields of many different hadron species in heavy-ion collisions across a broad collision energy range Cleymans and Redlich (1999); Becattini et al. (2001, 2004); Adamczyk et al. (2017); Andronic et al. (2018). Figure 1 depicts various F-O points from different experiments, including STAR-BES Adamczyk et al. (2017), NA49 Afanasiev et al. (2002); Alt et al. (2006, 2008); Vovchenko et al. (2016), E-802 Ahle et al. (1999a, b); Vovchenko et al. (2016), and GSI-SIS Averbeck et al. (2003). To fill the gap at high , we additionally performed fits to the recent data for central Au-Au collisions at GeV from the STAR Collaboration STA (2023, 2024) using Thermal-FIST and the Id-HRG model in the strangeness-canonical ensemble. Namely, we fitted the yields of primordial protons, light nuclei (), , and the yields of normalized by . This point is shown in Fig. 1 by the turquoise square.
By varying the collision energy, one obtains the so-called chemical F-O line in the - plane. There have been different chemical F-O criteria proposed in the literature to describe the F-O line Cleymans and Redlich (1998, 1999); Cleymans et al. (2006). Perhaps the most robust criterion corresponds to the constant energy per particle of – GeV Cleymans et al. (2006) at a F-O, where . One motivation for this criterion is that below a certain energy per particle, the inelastic reactions become too weak to maintain chemical equilibrium in a rapidly expanding system created in heavy-ion collisions. Figure 1 depicts the line
| (6) |
calculated in the Id-HRG model. This value corresponds to the chemical freeze-out temperature MeV at , which is in line with thermal fits at LHC energies performed within the same model using Thermal-FIST code from Ref. Vovchenko and Stoecker (2019) (blue point in Fig. 1).
The line is calculated taking into account conservation of strangeness and electric charge (the second condition corresponds to proton-to-nucleon ratio in heavy nuclei). By solving these two equations, one determines the values of the electric and strangeness chemical potentials and as a function of the baryochemical potential and the temperature . For this reason, and are not independent variables, and the construction of the F-O line reduces to solving a system of transcendental equations
| (7) | ||||
| (8) | ||||
| (9) |
with respect to , , and at each fixed value of . One can see from Fig. 1 that the line GeV describes fairly well the depicted F-O points, especially at MeV. At high it tends to provide a lower limit on the chemical F-O temperature. In the Appendix, we show the same calculation within EV-HRG and QvdW-HRG models which place the F-O line slightly higher at non-zero . We note that the F-O curve may be affected significantly by other choices of repulsive interactions, such as bag model scaling Vovchenko and Stöcker (2017); Vovchenko and Stoecker (2017), but these always tend to increase the F-O temperature. Therefore, the black line in Fig. 1 can indeed be regarded as the lower limit on the F-O curve in heavy-ion collisions.
As mentioned before, each value on the F-O line corresponds to a specific collision energy. The following expression parametrizes the collision energy of Vovchenko et al. (2016):
| (10) |
with parameter values of GeV and GeV-1.
IV Chemical freeze-out line and QCD critical point
The F-O line provides a lower bound in temperature at fixed for the possible location of the QCD CP. This is provided that the picture of an equilibrated hadron resonance gas at chemical F-O is taken at face value. Since decreasing the temperature at fixed leads to smaller hadron number densities, the effects of deconfinement and chiral symmetry restoration necessary for the CP can only kick in at higher temperatures.
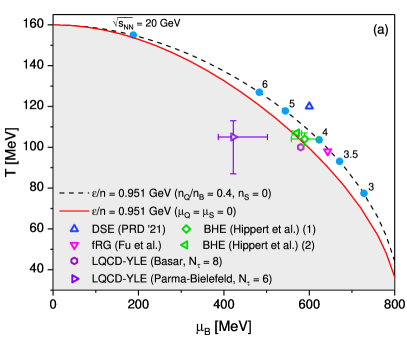
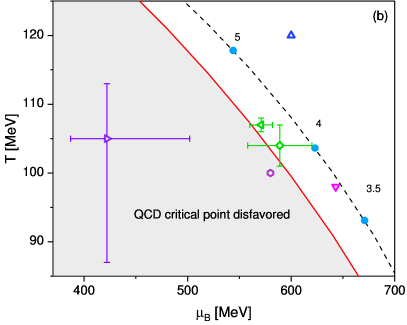
It is instructive to put the lower bound from the F-O curve in the context of recent estimates of the CP location. These estimates come from lattice QCD estimates of Yang-Lee edge singiularities Basar (2024); Clarke et al. (2024), and effective QCD approaches, including Dyson-Schwinger equations (DSE) Gunkel and Fischer (2021), functional renormalization group (fRG) Fu et al. (2020), and black-hole engineering (BHE) Hippert et al. (2023). The corresponding estimates are depicted by symbols in Fig. 2. One can observe a contradiction of sorts, where all the CP estimates except DSE lie below the F-O curve (dashed black line in Fig. 2), where the existence of the CP should be excluded. Of course, there is some uncertainty in the F-O curve at large , but, as discussed in the previous section and visible in Fig. 1, the black dashed curve generally corresponds to the lower end of the error bar in temperatures.
However, it is important to keep in mind that the F-O curve is obtained under conditions of strangeness neutrality and a charge-to-baryon ratio of , which corresponds to significantly non-zero values of and , roughly and . On the other hand, all theoretical estimates of the CP location in - plane are obtained for . Resolving this difference in strangeness and charge conservation conditions is necessary to make further conclusions, especially given that most of the CP estimates are only slightly below the chemical F-O curve. Either the CP estimates should be provided under , conditions, or modifications to the F-O curve corresponding to should be evaluated.
Here we pursue the former approach and calculate the hypothetical chemical F-O curve under conditions. We do this by calculating the same constant energy per particle line GeV in the Id-HRG model. The result is shown by the red line in Fig. 2. One can see that the red line lies systematically below the black curve at finite . Although this downward shift is not dramatic, it is significant for comparisons of CP estimates with the F-O curve. One can see that fRG and BHE estimates now lie slightly above the F-O curve. The LQCD-YLE estimate from Basar is slightly below the red line, but with large error bars reported in Ref. Basar (2024), it is consistent with the lower bound from chemical F-O. The LQCD-YLE estimate from the Parma-Bielefeld group, based on lattices, is significantly below the F-O curve and appears to be excluded by the F-O lower bound. This may indicate significant cut-off effects discussed in Ref. Clarke et al. (2024), or reflect large systematic uncertainties in the determination of YLE singularities and the extrapolation from high temperatures down to the CP.
One can see the estimates from fRG, BHE, LQCD-YLE from Basar, and, to some extent, DSE, lie very close to the F-O line. By utilizing Eq. (10) (see blue points in Fig. 2), one can estimate the collision energy range of GeV as most promising in the search for the CP, which can be explored with the measurements of proton cumulants within RHIC fixed target program and the future CBM experiment at FAIR Ablyazimov et al. (2017); Almaalol et al. (2022). The lower energies, GeV, on the other hand, can be utilizied to look for the signs of a first-order phase transition.
V Summary
In the present work we pointed out that the chemical freeze-out (F-O) line in heavy-ion collisions provides a lower bound in temperature on the possible location of the QCD critical point (CP). While the F-O line is subject to uncertainties at large baryochemical potential , we observe that a constant energy per particle line GeV evaluated within the ideal HRG model provides a reasonable estimate for the lower bound on the chemical F-O temperature and thus also sets the lower bound on QCD CP. We find that removing the strangeness neutrality condition leads to a downward shift of the F-O temperature at fixed . Comparing the F-O line under conditions to recent CP location estimates, we find that effective QCD approaches place the CP slightly above the F-O curve, suggesting that heavy-ion collisions at GeV may be most sensitive to the CP. On the other hand, the F-O line disfavors a CP estimate based on Yang-Lee edge singularities extracted from lattice QCD simulations, which lies significantly below the F-O line.
Acknowledgements. A.L. thanks Prof. S. Vilchinskii for his useful advice and assistance, which played a major role in writing this paper. M.I.G. is thankful for the support from the Simons Foundation.
Appendix A Freeze-out line in non-ideal HRG models
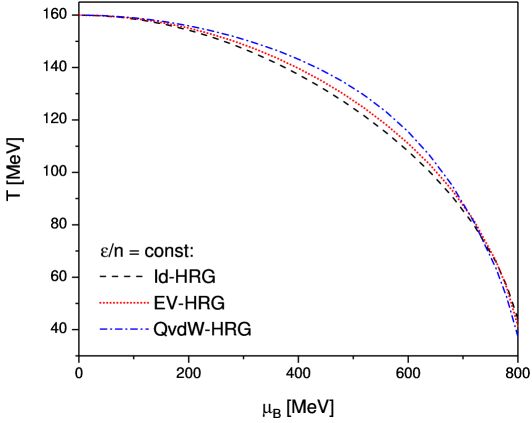
Here we analyze the possible influence of baryonic interactions on the chemical F-O line by evaluating the line in EV-HRG and QvdW-HRG models.
The pressure in the QvdW-HRG model reads
| (11) |
with
| (12) | ||||
| (13) | ||||
| (14) |
where , is the number density of baryons (antibaryons), which is determined from the following expression:
| (15) |
and , are the constants of the van der Waals quantum equation of state.
The total particle number density in the QvdW-HRG model is calculated as
| (16) |
where baryon and antibaryon densities are given by Eq. (15) and meson number density by the ideal gas expression:
| (17) |
The total energy density can be calculated as
| (18) | ||||
It can be seen from Eqs. (11)-(15) that at and , the system reduces to the Id-HRG. The special case where but remains non-zero is referred to as an excluded volume hadron resonance gas (EV-HRG). This scenario represents a system where only repulsive interactions between (anti)baryons are present.
In this work, we use the values , for calculations within QvdW-HRG model, and within EV-HRG model. The former parameter set corresponds to the ground state of nuclear matter at temperature Vovchenko et al. (2015b), while latter provides a good description of baryon number susceptibilities from lattice QCD at and MeV Vovchenko et al. (2018a).
The results of the calculations are presented in Fig. 3. The lines were plotted under the condition , with the value of the constant chosen differently for each model to ensure . Namely:
-
•
Id-HRG: 0.951 GeV
-
•
EV-HRG: 0.946 GeV
-
•
QvdW-HRG: 0.942 GeV
One observes that the three lines do not differ much. The inclusion of interactions generally shifts the temperature slightly upward (see also Ref. Poberezhnyuk et al. (2019)). Thus one can regard the Id-HRG model calculation as providing a lower bound on the F-O temperature at fixed .
References
- Aoki et al. (2006) Y. Aoki, G. Endrodi, Z. Fodor, S. D. Katz, and K. K. Szabo, Nature 443, 675 (2006), arXiv:hep-lat/0611014 .
- Borsanyi et al. (2010) S. Borsanyi, Z. Fodor, C. Hoelbling, S. D. Katz, S. Krieg, C. Ratti, and K. K. Szabo (Wuppertal-Budapest), JHEP 09, 073 (2010), arXiv:1005.3508 [hep-lat] .
- Bazavov et al. (2014) A. Bazavov et al. (HotQCD), Phys. Rev. D 90, 094503 (2014), arXiv:1407.6387 [hep-lat] .
- Stephanov et al. (1998) M. A. Stephanov, K. Rajagopal, and E. V. Shuryak, Phys. Rev. Lett. 81, 4816 (1998), arXiv:hep-ph/9806219 .
- Stephanov et al. (1999) M. A. Stephanov, K. Rajagopal, and E. V. Shuryak, Phys. Rev. D 60, 114028 (1999), arXiv:hep-ph/9903292 .
- Adam et al. (2021) J. Adam et al. (STAR), Phys. Rev. Lett. 126, 092301 (2021), arXiv:2001.02852 [nucl-ex] .
- Adamczewski-Musch et al. (2020) J. Adamczewski-Musch et al. (HADES), Phys. Rev. C 102, 024914 (2020), arXiv:2002.08701 [nucl-ex] .
- Borsanyi et al. (2020) S. Borsanyi, Z. Fodor, J. N. Guenther, R. Kara, S. D. Katz, P. Parotto, A. Pasztor, C. Ratti, and K. K. Szabo, Phys. Rev. Lett. 125, 052001 (2020), arXiv:2002.02821 [hep-lat] .
- Bazavov et al. (2019) A. Bazavov et al. (HotQCD), Phys. Lett. B 795, 15 (2019), arXiv:1812.08235 [hep-lat] .
- Vovchenko et al. (2018a) V. Vovchenko, J. Steinheimer, O. Philipsen, and H. Stoecker, Phys. Rev. D 97, 114030 (2018a), arXiv:1711.01261 [hep-ph] .
- Acharya et al. (2020) S. Acharya et al. (ALICE), Phys. Lett. B 807, 135564 (2020), arXiv:1910.14396 [nucl-ex] .
- Abdallah et al. (2021) M. Abdallah et al. (STAR), Phys. Rev. C 104, 024902 (2021), arXiv:2101.12413 [nucl-ex] .
- Vovchenko et al. (2022) V. Vovchenko, V. Koch, and C. Shen, Phys. Rev. C 105, 014904 (2022), arXiv:2107.00163 [hep-ph] .
- Stephanov (2004) M. A. Stephanov, Prog. Theor. Phys. Suppl. 153, 139 (2004), arXiv:hep-ph/0402115 .
- Basar (2024) G. Basar, Phys. Rev. C 110, 015203 (2024), arXiv:2312.06952 [hep-th] .
- Clarke et al. (2024) D. A. Clarke, P. Dimopoulos, F. Di Renzo, J. Goswami, C. Schmidt, S. Singh, and K. Zambello, (2024), arXiv:2405.10196 [hep-lat] .
- Gunkel and Fischer (2021) P. J. Gunkel and C. S. Fischer, Phys. Rev. D 104, 054022 (2021), arXiv:2106.08356 [hep-ph] .
- Fu et al. (2020) W.-j. Fu, J. M. Pawlowski, and F. Rennecke, Phys. Rev. D 101, 054032 (2020), arXiv:1909.02991 [hep-ph] .
- Hippert et al. (2023) M. Hippert, J. Grefa, T. A. Manning, J. Noronha, J. Noronha-Hostler, I. Portillo Vazquez, C. Ratti, R. Rougemont, and M. Trujillo, (2023), arXiv:2309.00579 [nucl-th] .
- Vovchenko et al. (2016) V. Vovchenko, V. V. Begun, and M. I. Gorenstein, Phys. Rev. C 93, 064906 (2016), arXiv:1512.08025 [nucl-th] .
- Vovchenko et al. (2018b) V. Vovchenko, M. I. Gorenstein, and H. Stoecker, Phys. Rev. C 98, 034906 (2018b), arXiv:1807.02079 [nucl-th] .
- Adamczyk et al. (2017) L. Adamczyk et al. (STAR), Phys. Rev. C 96, 044904 (2017), arXiv:1701.07065 [nucl-ex] .
- Hagedorn (1965) R. Hagedorn, Nuovo Cim. Suppl. 3, 147 (1965).
- Dashen et al. (1969) R. Dashen, S.-K. Ma, and H. J. Bernstein, Phys. Rev. 187, 345 (1969).
- Venugopalan and Prakash (1992) R. Venugopalan and M. Prakash, Nucl. Phys. A 546, 718 (1992).
- Cleymans and Satz (1993) J. Cleymans and H. Satz, Z. Phys. C 57, 135 (1993), arXiv:hep-ph/9207204 .
- Vovchenko et al. (2015a) V. Vovchenko, D. V. Anchishkin, and M. I. Gorenstein, Phys. Rev. C 91, 024905 (2015a), arXiv:1412.5478 [nucl-th] .
- Vovchenko et al. (2017a) V. Vovchenko, A. Pasztor, Z. Fodor, S. D. Katz, and H. Stoecker, Phys. Lett. B 775, 71 (2017a), arXiv:1708.02852 [hep-ph] .
- Vovchenko et al. (2017b) V. Vovchenko, M. I. Gorenstein, and H. Stoecker, Phys. Rev. Lett. 118, 182301 (2017b), arXiv:1609.03975 [hep-ph] .
- Vovchenko and Stoecker (2019) V. Vovchenko and H. Stoecker, Comput. Phys. Commun. 244, 295 (2019), arXiv:1901.05249 [nucl-th] .
- Cleymans and Redlich (1999) J. Cleymans and K. Redlich, Phys. Rev. C 60, 054908 (1999), arXiv:nucl-th/9903063 .
- Becattini et al. (2001) F. Becattini, J. Cleymans, A. Keranen, E. Suhonen, and K. Redlich, Phys. Rev. C 64, 024901 (2001), arXiv:hep-ph/0002267 .
- Becattini et al. (2004) F. Becattini, M. Gazdzicki, A. Keranen, J. Manninen, and R. Stock, Phys. Rev. C 69, 024905 (2004), arXiv:hep-ph/0310049 .
- Andronic et al. (2018) A. Andronic, P. Braun-Munzinger, K. Redlich, and J. Stachel, Nature 561, 321 (2018), arXiv:1710.09425 [nucl-th] .
- Afanasiev et al. (2002) S. V. Afanasiev et al. (NA49), Phys. Rev. C 66, 054902 (2002), arXiv:nucl-ex/0205002 .
- Alt et al. (2006) C. Alt et al. (NA49), Phys. Rev. C 73, 044910 (2006).
- Alt et al. (2008) C. Alt et al. (NA49), Phys. Rev. C 77, 024903 (2008), arXiv:0710.0118 [nucl-ex] .
- Ahle et al. (1999a) L. Ahle et al. (E802), Phys. Rev. C 60, 064901 (1999a).
- Ahle et al. (1999b) L. Ahle et al. (E-802, E-866), Phys. Rev. C 60, 044904 (1999b), arXiv:nucl-ex/9903009 .
- Averbeck et al. (2003) R. Averbeck, R. Holzmann, V. Metag, and R. S. Simon, Phys. Rev. C 67, 024903 (2003), arXiv:nucl-ex/0012007 .
- STA (2023) (2023), arXiv:2311.11020 [nucl-ex] .
- STA (2024) (2024), arXiv:2407.10110 [nucl-ex] .
- Cleymans and Redlich (1998) J. Cleymans and K. Redlich, Phys. Rev. Lett. 81, 5284 (1998), arXiv:nucl-th/9808030 .
- Cleymans et al. (2006) J. Cleymans, H. Oeschler, K. Redlich, and S. Wheaton, Phys. Rev. C 73, 034905 (2006), arXiv:hep-ph/0511094 .
- Vovchenko and Stöcker (2017) V. Vovchenko and H. Stöcker, J. Phys. G 44, 055103 (2017), arXiv:1512.08046 [hep-ph] .
- Vovchenko and Stoecker (2017) V. Vovchenko and H. Stoecker, Phys. Rev. C 95, 044904 (2017), arXiv:1606.06218 [hep-ph] .
- Ablyazimov et al. (2017) T. Ablyazimov et al. (CBM), Eur. Phys. J. A 53, 60 (2017), arXiv:1607.01487 [nucl-ex] .
- Almaalol et al. (2022) D. Almaalol et al., (2022), arXiv:2209.05009 [nucl-ex] .
- Vovchenko et al. (2015b) V. Vovchenko, D. V. Anchishkin, and M. I. Gorenstein, Phys. Rev. C 91, 064314 (2015b), arXiv:1504.01363 [nucl-th] .
- Poberezhnyuk et al. (2019) R. Poberezhnyuk, V. Vovchenko, A. Motornenko, M. I. Gorenstein, and H. Stoecker, Phys. Rev. C 100, 054904 (2019), arXiv:1906.01954 [hep-ph] .