A Methodological Report on Anomaly Detection on Dynamic Knowledge Graphs
Abstract
In this paper, we explore different approaches to anomaly detection on dynamic knowledge graphs, specifically in a microservices environment for Kubernetes applications. Our approach explores three dynamic knowledge graph representations: sequential data, one-hop graph structure, and two-hop graph structure, with each representation incorporating increasingly complex structural information. Each phase includes different machine learning and deep learning models. We empirically analyse their performance and propose an approach based on ensemble learning of these models. Our approach significantly outperforms the baseline on the ISWC 2024 Dynamic Knowledge Graph Anomaly Detection dataset, providing a robust solution for anomaly detection in dynamic complex data.
Keywords:
Dynamic Knowledge Graph Anomaly Detection.1 Introduction
With the development of graph machine learning and geometric deep learning [1], research on encoding and prediction has been applied to more domains than ever before. Graphs can simultaneously represent entities through nodes111Also referred to as ”vertices”. and relationships between entities through edges. As a result, graph representations are widely used in domains as diverse as transportation [2], chemistry [3], and social networks [24]. Two areas of relative difficulty in graph learning are heterogeneous graphs and dynamic graphs. Heterogeneous graphs allow for different types of nodes and/or edges in the graph [4]. They can therefore better model complex systems with different types of entities, such as a distributed information system with services, pods and nodes. Dynamic graphs allow the structure and/or attributes of a graph to change over time [5], allowing better modelling of data with both temporal and structural information.
Dynamic Knowledge Graphs (DKGs), as an intersection of heterogeneous and dynamic graphs, have attracted increasing attention due to their ability to represent the evolving nature of knowledge over time. By exploiting the ability to capture topological and attribute transformations, DKGs provide valuable insights into the evolution of knowledge in diverse domains such as social media [23], the Internet of Things (IoT) [22, 21], and e-commerce222https://eval.ai/web/challenges/challenge-page/2267/overview.
On the leading Microservices Architecture (MSA) platform, Kubernetes, there are different types of entities such as compute nodes, deployable units (pods), and services that work together to build applications such as e-commerce platforms. These data are typically stored in DKGs in the TTL format. Predictive analysis based on such data is critical to the operation and optimisation of these platforms, particularly for anomaly detection tasks aimed at accurately identifying various types of errors and anomalies.
Despite rapid progress in commercial applications, as a relatively young field, there is still a lack of academic datasets and methodologies. This scarcity can be attributed to several challenges: anomaly events are typically very rare, resulting in an unbalanced data distribution that makes it difficult for models to effectively learn anomaly features and affects their generalisation ability in detecting new anomalies. In addition, models need to capture temporal and structural information and handle heterogeneous nodes/edges, which makes common RNNs and homogeneous GNNs inadequate.
To tackle these challenges, this paper proposes a new approach to anomaly detection on dynamic knowledge graphs using graph structure and temporal dependencies. This approach combines neighbourhood feature extraction with support vector machines (SVMs), extreme gradient boosting (XGB), and self-attention mechanisms. Our approach significantly outperforms the baseline performance on the ’Dynamic Knowledge Graph Anomaly Detection’ challenge dataset at ISWC 2024, providing a robust solution for anomaly detection in dynamic, complex environments.
The structure of the paper is as follows. Section 2 gives the formulation of the problem and describes related work. Section 3 presents the methodology of the paper, while section 4 describes the experimental part of the work and discusses the results obtained. Section 5 concludes our contribution to the ADDKG challenge and discusses future work.
2 Related Work
Recent studies have shown that the dynamic knowledge graph representation is expressive for anomaly detection in temporally complex systems. In this section, we review the related work in this area. In subsection 2.1, we present the definition and notations of the Dynamic Knowledge Graph. Then, in subsection 2.2, we present common approaches to anomaly detection.
2.1 Dynamic Knowledge Graphs
In static graphs, common representations include edge lists and adjacency matrices. Among them, the edge list is widely used in software development as it requires less memory. An edge list is a collection of edges, each represented as a pair of nodes.
In the realm of dynamic graphs, existing research categorises them into Continuous-Time Dynamic Graphs (CTDG) and Discrete-Time Dynamic Graphs (DTDG). CTDGs represent dynamic graphs using timestamped events, such as , where and are nodes and is the timestamp of the interaction. In contrast, DTDGs represent dynamic graphs as a sequence of static graph snapshots at different time intervals.
Combined with the dynamic graph representations, the DKG is a heterogeneous dynamic graph represented by timestamped edge lists. Among the DKG representation formats, TTL (Turtle) is commonly used. A typical TTL allows for the serialisation of triples, which can include nodes, edges, and their attributes, along with timestamps, making TTL versatile for representing entities and relations in an MSA system. An example of a TTL-based DKG is given in Eq.1, where is the subject node, is the object node, is the predicate (or relationship), and is the timestamp.
| (1) |
In the problem studied in this paper, anomalous data is represented by its entity , the time interval during which the anomaly occurs , and the class of the anomaly .
2.2 Anomaly Detection
Anomaly detection is a crucial task in various fields, including network security, fraud detection, and financial systems [25, 26]. This task focuses on identifying anomalous patterns that deviate from the typical observation of the data [15].
Traditional anomaly detection methods typically rely on statistical techniques and distance-based measures. However, these methods often struggle with high-dimensional data and complex dependencies [27]. To overcome these problems, common machine learning approaches include support vector machines (SVM) [6], isolation forests (IF) [7], and extreme gradient boosting (XGB) [8]. SVM [6] identifies the optimal hyperplane that maximises the distance between normal data points and the decision boundary, effectively distinguishing outliers. Isolation Forest [7] is an unsupervised method and detects anomalies by constructing decision trees to isolate observations, with outliers requiring fewer splits to isolate due to their rarity and distinctiveness. XGB [8] is a gradient boosting decision tree algorithm that is able to evaluate the importance of each feature and find those that are most effective in distinguishing normal from abnormal data.
With the advancement of software algorithms and hardware devices, deep learning methods have been increasingly applied to anomaly detection due to their ability to extract complex features [16]. Common architectures for time series include recurrent neural networks (RNN) [9], temporal convolutional networks (TCN) [12], and the self-attention mechanism (SA) [13]. RNN (Recurrent Neural Network) is a type of neural network designed to process sequential data by capturing temporal dependencies. LSTM (Long Short-Term Memory) [10] and GRU (Gated Recurrent Unit) [11] are variants of RNNs designed to solve the vanishing and exploding gradient problems in long sequence training. TCN (Temporal Convolutional Network) [12] captures long-term temporal dependencies with causal convolutions. Self-attention mechanisms capture long-range dependencies by computing the relationships between all elements in a sequence, making them particularly effective for identifying complex patterns. For graph anomaly detection, Graph Neural Networks (GNNs) propagate information through graph structures to identify anomalous patterns [19, 18]. Despite the aforementioned studies proposing numerous algorithms for anomaly detection, significant challenges remain when applied to dynamic knowledge graphs.
2.3 Challenges of Anomaly Detection on Dynamic Knowledge Graph
Due to the complex temporal and structural dependencies in dynamic knowledge graphs, traditional machine learning methods struggle to capture the underlying features. However, deep learning models typically require large amounts of labelled data for effective training, and anomalous data is inherently scarce.
Although anomaly detection tasks on dynamic graphs without attributed edges can generate anomalous edges through methods such as negative sampling [19, 18, 20], this approach becomes infeasible in the case of dynamic knowledge graphs with attributed edges. Therefore, effectively capturing the temporal and structural dependencies of features on dynamic knowledge graphs is crucial to tackling this challenge.
3 Methodology
This section first introduces three representations for dynamic knowledge graphs studied in this task: sequential data, one-hop graph structure, and two-hop graph structure, with each representation incorporating increasingly complex structural information. We then describe the machine learning/deep learning methods applied to each representation. At the end of the section, we propose ensemble schemes for combining multiple methods.
3.1 DKG as Sequential Data
The time-evolving attributes of nodes can be obtained by extracting raw TTL data. For example, in MSA, common node categories could be representing "Cluster", representing "Pod", representing "Service", and representing "Node". For each given node category , the time-evolving attributes can be represented as a tensor , where indicated the number of instances of the category , indicates the number of snapshots, and indicates the number of features.
| (2) |
Therefore, the sequential data representation of a given category in the DKG can be expressed by a matrix as shown in Eq. 3, where is the aggregated attribute vector at timestamp .
| (3) |
Once the matrix representation of the attributes is obtained, additional information can be calculated. For example, the difference captures the trend of the time series, while the variance reflects the stability of the data fluctuations. Specific formulas for statistical properties are given in Eq. 4.
| (4) | |||||
Based on this data representation, the temporal information across multiple time steps is aggregated into a single vector. Consequently, machine learning algorithms such as SVM, XGB, and IF, as well as deep learning models like MLP, TCN, and RNN, can use this input to capture information across multiple time steps.
3.2 One-Hop Graph Structure
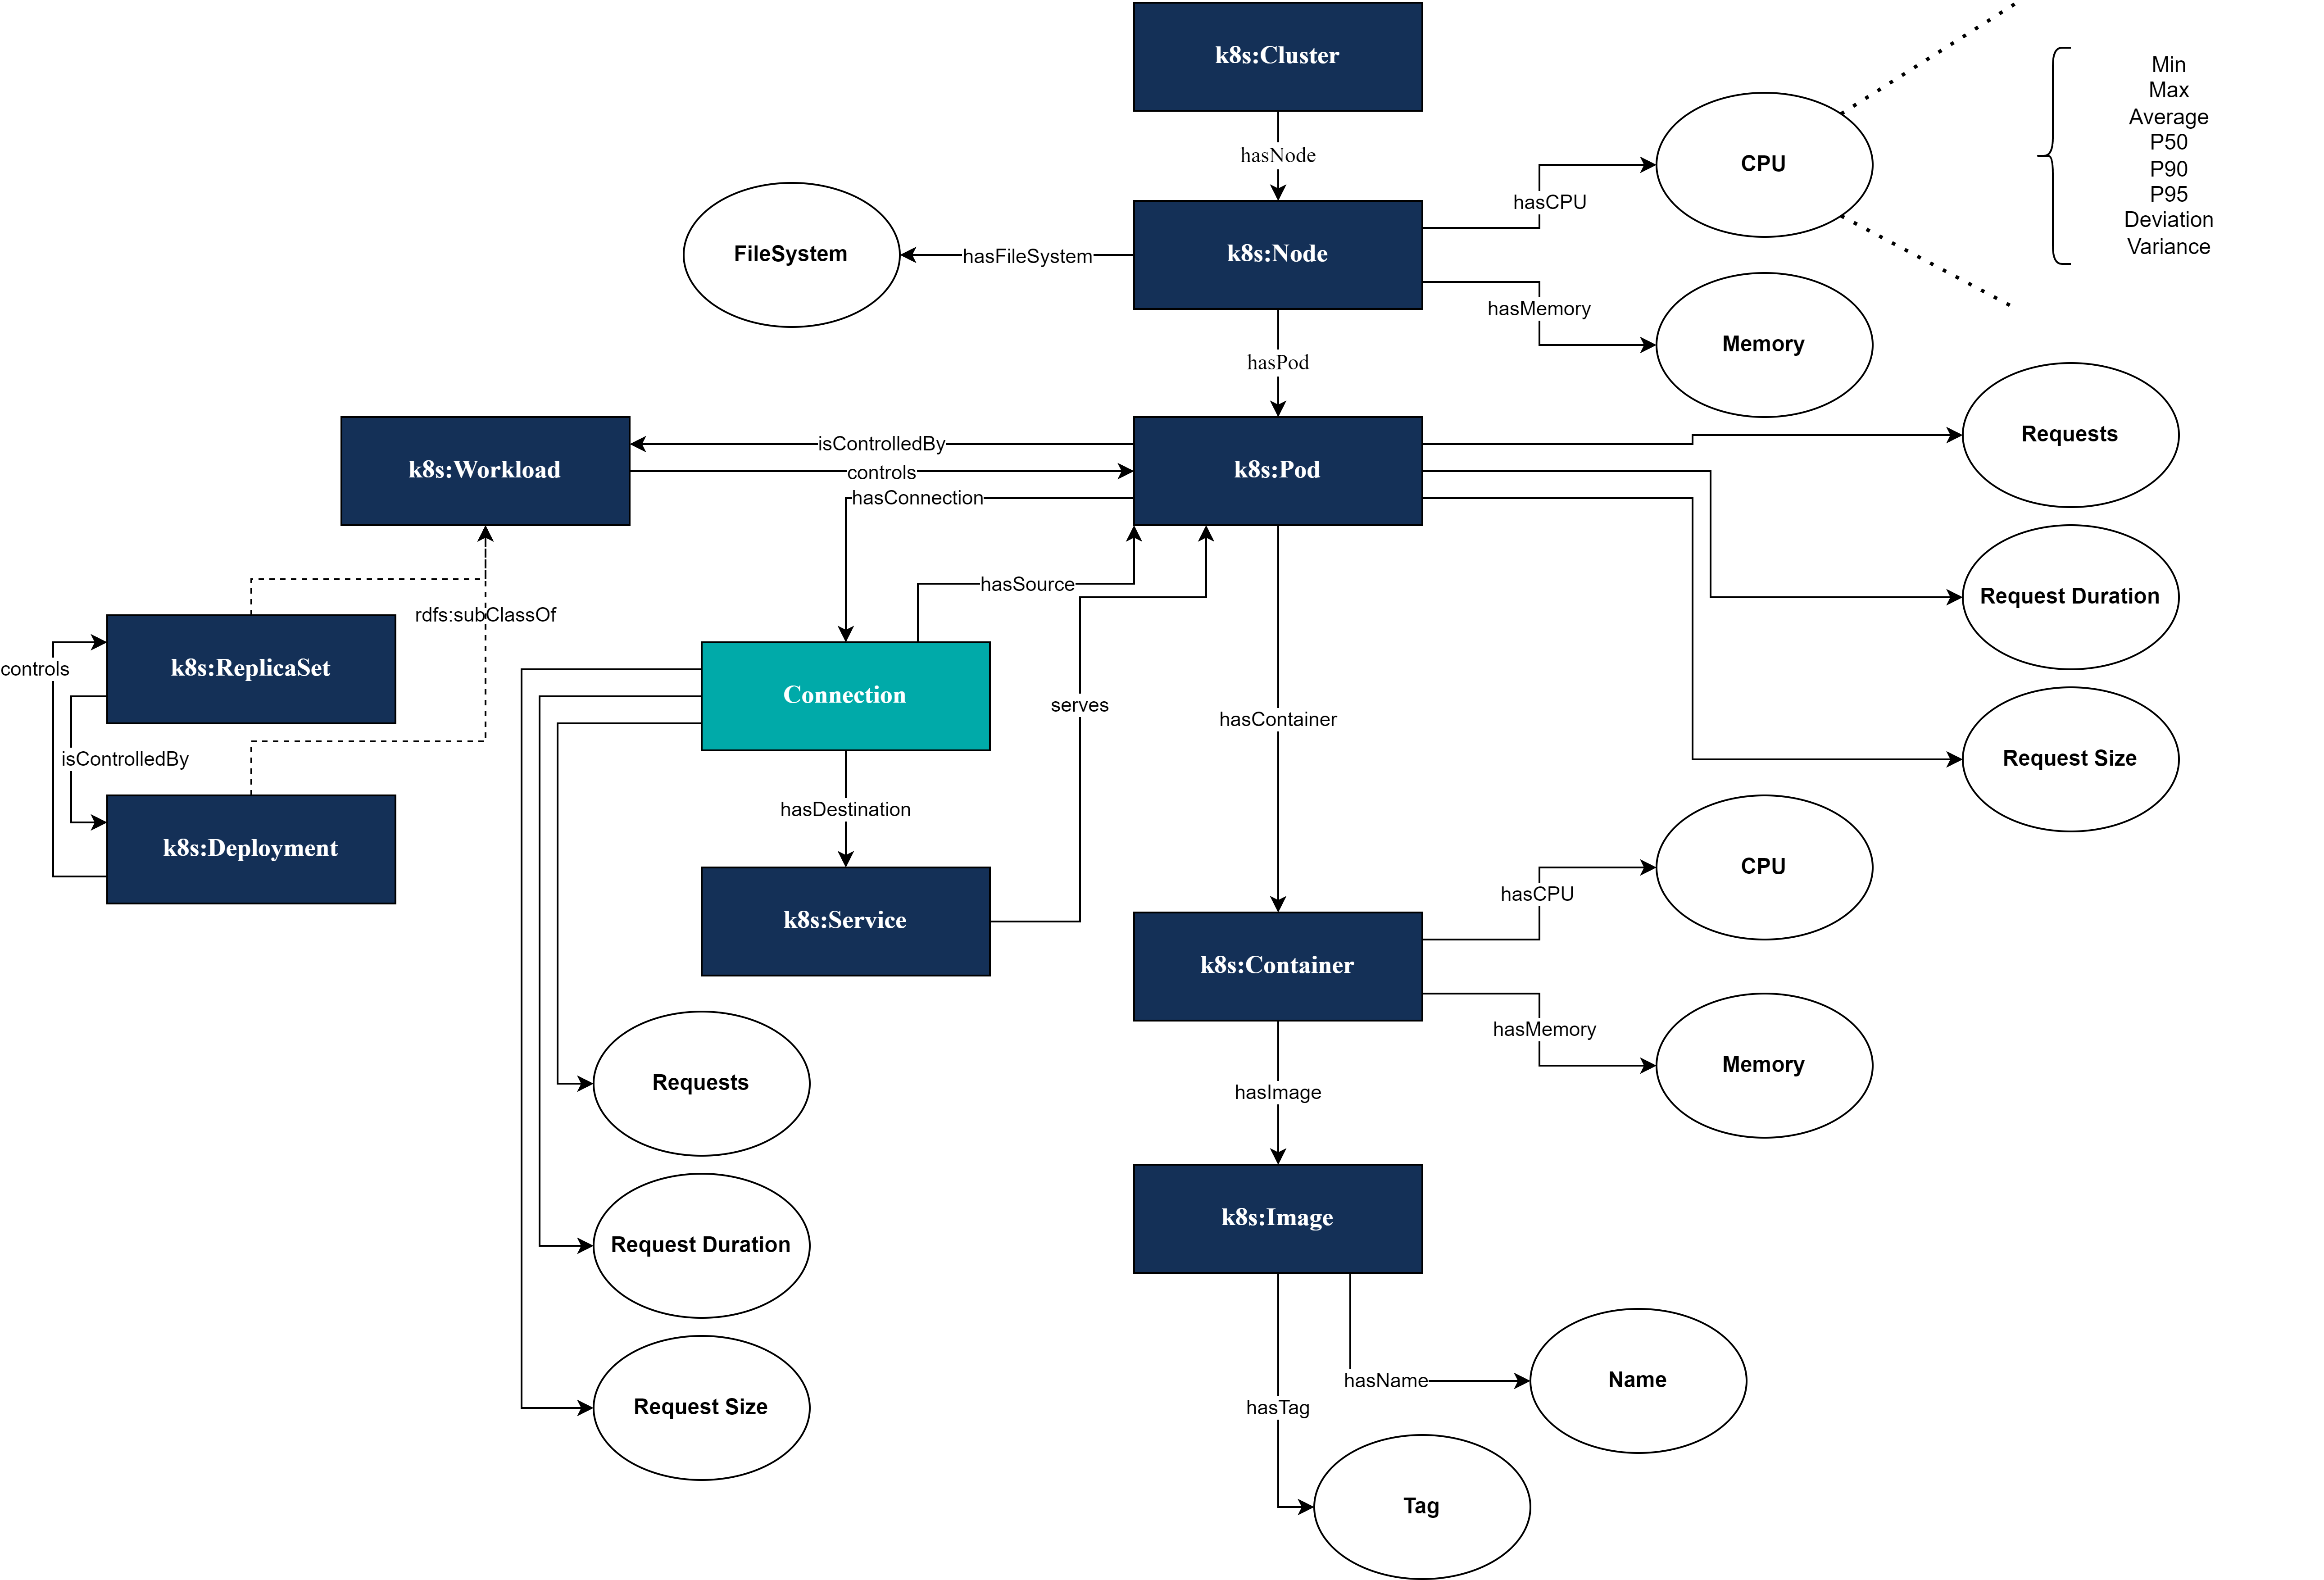
To explore the structural information of the knowledge graph, we propose to use one-hop neighbour aggregation to capture the relationships between different entities. Given that the relationships in the DKG of an MSA are mainly hierarchical, i.e., a cluster contains multiple nodes, a node contains multiple pods, and a pod is connected to services through multiple connections (see Fig.1), it is possible to aggregate information from leaf nodes to root nodes to obtain the structural-temporal features of each node at each timestamp based on the temporal information considered in the previous subsection.
| (5) |
For instance, to encode and predict data for the category Service, information related to the Service can be aggregated. Specifically, for all service instances at timestamp , the dynamic information from related Nodes, Pods, and Connections can be aggregated to form the attributes of the Service, as shown in Eq. 5 where represents the -th instance of the Service category, represents the set of Connection instances related to , represents the set of Pod instances related to , and represents the set of Node instances related to . In this manner, multiple one-hop graph structures are used for message propagation, and these structural-temporal features provide the model with a richer context.
3.3 Two-Hop Graph Structure
Some graph machine learning algorithms have pointed out that a larger convolutional field, or aggregation of multi-hop neighbours, can optimise the model. Inspired by this, we realised that aggregating second-hop neighbours could provide richer information. In the tree-like graph of the MSA problem, considering only the current level and its associated root level forms a bipartite graph. For nodes of category , the two-hop neighbours on this bipartite graph are still nodes of the same category.
Recognising that there may be interdependencies between Service instances at each timestamp, we propose to use two-hop neighbour aggregation. Intuitively, this aggregation can be achieved by concatenating vertex features, as shown in Eq. 6 where represents the number of Service instances and represents the data for the -th Service instance at timestamp .
| (6) |
Another method of capturing two-hop neighbours is using the self-attention mechanism to capture the correlations among vertices. The self-attention mechanism works by computing the relevance (or attention) between each pair of elements in a sequence, enabling the model to weigh the importance of each element relative to others. This allows the model to focus on relevant parts of the input sequence when making predictions, effectively capturing long-range dependencies and complex relationships within the data.
3.4 Ensemble Learning
Ensemble learning is a prevalent methodology in the domain of machine learning that mitigates variance through the consolidation of multiple models, thereby enhancing model robustness. The integration of diverse and superior-performing models is a prerequisite for the efficacy of ensemble learning [14]. Ensemble learning allows multiple models to make predictions on the same problem and thus vote on the final prediction. The voting principle can be hard voting or soft voting, while the voting mechanism usually consists of unanimous voting and majority voting, which will be introduced in this subsection.
In hard voting, each classifier votes for a class label, and the final prediction is determined by the majority of these classifiers. In soft voting, each classifier provides a probability for each class, and the final prediction is based on the highest average probability across all classifiers.
As two common voting mechanisms combined with hard voting, especially in anomaly detection, unanimous voting classifies an instance as an anomaly only if all the models agree. Majority voting, on the other hand, classifies an instance as an anomaly if the majority of models agree.
Intuitively, unanimous voting is more conservative and reduces false positives for anomaly detection, but may also miss some true anomalies. The majority voting method, in contrast, has some flexibility and can improve the detection of true anomalies, but it also preserves the false alarms. Both methods are tested on multiple sets of models and it are discussed in the next section.
4 Experiment
4.1 Experimental Setup
All experiments were conducted utilising the ISWC 2024 ADDKG dataset. The dataset contains five days of labelled data, with three days of data used for training and the remaining two days used for testing. The data was collected at approximately 15 second intervals and presents a challenge due to its imbalance, with anomalies representing only approximately 4% of the total data. To mitigate this imbalance, class weights were applied to the loss functions during model training to ensure that the models effectively learned to detect anomalies.
As outlined in the methodology section, our approach included three levels of representation. For the first representation, sequential modelling is employed. The original training set is randomly divided into two subsets: 80% for training, and the other 20% for validation. For the other two representations, a more sophisticated approach to data splitting is under consideration. For normal class, the 80-20 split mechanism remains applicable. However, in the case of the anomaly class, it is necessary to identify complete and continuous sequences of anomalous records as "anomalous events". The objective was to maintain the anomalous events in their entirety during the process of data splitting, the splitting of a single anomalous process between the training and validation sets. This approach ensures the contextual integrity of the anomalies, allowing the models to learn more effectively from complete anomalous events. To achieve this, for each anomaly type, one complete event was randomly selected for validation, while the remaining events were used for training.
In the paper, we focus on binary anomaly detection, aiming to distinguish between normal and anomalous data without delving into the specific types of anomalies. The predictions are evaluated by F1 score, precision, and recall.
4.2 Performance of Models
The experimental results of each representation are shown in tables 1 and 2. Table 1 focuses on the performance of individual models, while table 2 highlights the performance of different ensemble methods. D1, D2, and D3 represent sequential data representation, one-hop graph representation, and two-hop graph representation, respectively.
Table 1 shows how each model performs under different structural conditions of the dataset. The results show that the inclusion of graph structures and service interactions generally improves model performance, particularly in terms of recall and F1 score.
| Model | Dataset Phase | F1 Score | Precision | Recall |
| Baseline | - | 0.06759 | 0.03498 | 1.00000 |
| MLP | D1 | 0.09390 | 0.05102 | 0.58824 |
| XGB | D2 | 0.21622 | 0.20000 | 0.23529 |
| SVM | D2 | 0.16185 | 0.08974 | 0.82353 |
| TCN | D1 | 0.09816 | 0.05479 | 0.47059 |
| D2 | 0.07792 | 0.04206 | 0.52941 | |
| LSTM | D1 | 0.06759 | 0.03498 | 1.00000 |
| D2 | 0.10046 | 0.05446 | 0.64706 | |
| D3 | 0.16923 | 0.09735 | 0.64706 | |
| GRU | D1 | 0.06759 | 0.03498 | 1.00000 |
| D2 | 0.07362 | 0.04110 | 0.35294 | |
| D3 | 0.16250 | 0.09091 | 0.76471 | |
| Self-Attention | D1 | 0.07203 | 0.03736 | 1.00000 |
| D2 | 0.09028 | 0.04797 | 0.76471 | |
| D3 | 0.22018 | 0.13043 | 0.70588 |
In order to effectively combine multiple models, the second part of the experiments evaluates the performance of different ensemble methods, as shown in Table 2. Different ensemble strategies are tested, such as combining XGB, SVM, stacked layers of the Self Attention model, and Isolation Forest. In the evaluation of the ensemble methods, we have compared two different methods, soft voting, hard&unanimous voting and hard&majority voting. Table 2 shows the best performances obtained. Overall, the soft voting approach provided better results for our objectives.
| Ensemble Model | Method | Dataset Phase | F1 Score | Precision | Recall |
| Baseline | - | - | 0.06759 | 0.03498 | 1.00000 |
| XGB + IF | soft | D2 | 0.34286 | 0.33333 | 0.35294 |
| SVM + IF | hard,unanimous | D2 | 0.19802 | 0.11905 | 0.58824 |
| XGB + SVM + IF | soft | D2 | 0.38596 | 0.275 | 0.64706 |
| XGB + SVM + SA + IF | hard,unanimous | D2+D3 | 0.36364 | 0.2963 | 0.47059 |
| XGB + SVM + SA | soft | D2+D3 | 0.51429 | 0.5 | 0.52941 |
The individual models using the three representations mentioned in Section 3 and the results using ensemble learning both significantly outperforms the baseline result 333The baseline result is from https://eval.ai/web/challenges/challenge-page/2267/overview, demonstrating the potential of our approach.
5 Conclusion
In this paper, we investigated the effectiveness of different machine learning and deep learning models on the challenging task of anomaly detection on dynamic knowledge graphs, with a specific focus on a microservices environment. Using a structured experimental approach, we analysed the performance of the models in three different representations: sequential data modelling, one-hop graph structure, and two-hop graph structure.
Our results show that incorporating graph structures significantly improves the performance of anomaly detection models. In particular, the Two-Hop Graph Structure, which includes service interactions, produced the best results across most metrics, highlighting the importance of capturing complex interdependencies within the data. Deep learning models, particularly the Two-Stacked Self-Attention (2StackedSA) model, showed superior performance in leveraging these structures.
Furthermore, the ensemble methods provided a substantial boost in performance by combining the strengths of top-performing individual models. Among the ensemble strategies, the Unanimous Voting approach, which requires all models to agree on the prediction of an anomaly, outperformed the Majority Voting approach in terms of precision. This aligns well with the competition’s emphasis on precision, highlighting the effectiveness of this conservative yet accurate method.
Future work should address several areas for improvement. Firstly, improving the scalability of our models to handle larger and more complex datasets would be crucial. Secondly, exploring more advanced ensemble techniques, such as stacking or blending, could further improve detection accuracy. Thirdly, the integration of real-time anomaly detection capabilities would be highly beneficial for practical applications in dynamic environments. Finally, our study was limited to binary classification (normal/abnormal). Future research should focus on improving the accuracy of predicting different types of anomalies. Furthermore, although we used graph structure information, we did not apply Graph Neural Networks (GNNs), which could be a promising direction for future investigation and testing.
This study demonstrates the significant potential of combining graph-based data representations with advanced machine learning and deep learning techniques for anomaly detection on dynamic knowledge graphs. By refining these methods and exploring the future directions outlined, we can develop more robust, accurate and scalable solutions for complex anomaly detection tasks in various domains.
References
- [1] Bronstein, M., Bruna, J., LeCun, Y., Szlam, A. & Vandergheynst, P. Geometric deep learning: going beyond euclidean data. IEEE Signal Processing Magazine. 34, 18-42 (2017)
- [2] Yu, B., Yin, H. & Zhu, Z. Spatio-temporal graph convolutional networks: A deep learning framework for traffic forecasting. ArXiv Preprint ArXiv:1709.04875. (2017)
- [3] Gilmer, J., Schoenholz, S., Riley, P., Vinyals, O. & Dahl, G. Neural message passing for quantum chemistry. International Conference On Machine Learning. pp. 1263-1272 (2017)
- [4] Shi, C. Heterogeneous Graph Neural Networks. Graph Neural Networks: Foundations, Frontiers, And Applications. pp. 351-369 (2022)
- [5] Yang, L., Chatelain, C. & Adam, S. Dynamic Graph Representation Learning With Neural Networks: A Survey. IEEE Access. 12 pp. 43460-43484 (2024)
- [6] Schölkopf, B., Williamson, R., Smola, A., Shawe-Taylor, J. & Platt, J. Support vector method for novelty detection. Advances In Neural Information Processing Systems. 12 (1999)
- [7] Liu, F., Ting, K. & Zhou, Z. Isolation forest. 2008 Eighth Ieee International Conference On Data Mining. pp. 413-422 (2008)
- [8] Chen, T. & Guestrin, C. Xgboost: A scalable tree boosting system. Proceedings Of The 22nd Acm Sigkdd International Conference On Knowledge Discovery And Data Mining. pp. 785-794 (2016)
- [9] Servan-Schreiber, D., Cleeremans, A. & McClelland, J. Graded state machines: The representation of temporal contingencies in simple recurrent networks. Machine Learning. 7 pp. 161-193 (1991)
- [10] Hochreiter, S. & Schmidhuber, J. Long short-term memory. Neural Computation. 9, 1735-1780 (1997)
- [11] Cho, K., Van Merriënboer, B., Gulcehre, C., Bahdanau, D., Bougares, F., Schwenk, H. & Bengio, Y. Learning phrase representations using RNN encoder-decoder for statistical machine translation. ArXiv Preprint ArXiv:1406.1078. (2014)
- [12] Oord, A., Dieleman, S., Zen, H., Simonyan, K., Vinyals, O., Graves, A., Kalchbrenner, N., Senior, A. & Kavukcuoglu, K. Wavenet: A generative model for raw audio. ArXiv Preprint ArXiv:1609.03499. (2016)
- [13] Vaswani, A., Shazeer, N., Parmar, N., Uszkoreit, J., Jones, L., Gomez, A., Kaiser, L. & Polosukhin, I. Attention Is All You Need. ArXiv Preprint ArXiv:1706.03762. (2017,6), https://arxiv.org/abs/1706.03762
- [14] Dietterich, T. Ensemble methods in machine learning. International Workshop On Multiple Classifier Systems. pp. 1-15 (2000)
- [15] Kim, H., Lee, B., Shin, W. & Lim, S. Graph anomaly detection with graph neural networks: Current status and challenges. IEEE Access. 10 pp. 111820-111829 (2022)
- [16] Ma, X., Wu, J., Xue, S., Yang, J., Zhou, C., Sheng, Q., Xiong, H. & Akoglu, L. A comprehensive survey on graph anomaly detection with deep learning. IEEE Transactions On Knowledge And Data Engineering. 35, 12012-12038 (2021)
- [17] Chen, K., Feng, M. & Wirjanto, T. Multivariate Time Series Anomaly Detection via Dynamic Graph Forecasting. ArXiv Preprint ArXiv:2302.02051. (2023)
- [18] Cai, L., Chen, Z., Luo, C., Gui, J., Ni, J., Li, D. & Chen, H. Structural temporal graph neural networks for anomaly detection in dynamic graphs. Proceedings Of The 30th ACM International Conference On Information & Knowledge Management. pp. 3747-3756 (2021)
- [19] Zheng, L., Li, Z., Li, J., Li, Z. & Gao, J. AddGraph: Anomaly Detection in Dynamic Graph Using Attention-based Temporal GCN.. IJCAI. 3 pp. 7 (2019)
- [20] Liu, Y., Pan, S., Wang, Y., Xiong, F., Wang, L., Chen, Q. & Lee, V. Anomaly detection in dynamic graphs via transformer. IEEE Transactions On Knowledge And Data Engineering. (2021)
- [21] Steenwinckel, B., De Brouwer, M., Stojchevska, M., Van Der Donckt, J., Nelis, J., Ruyssinck, J., Herten, J., Casier, K., Van Ooteghem, J., Crombez, P. & Others Data analytics for health and connected care: Ontology, knowledge graph and applications. International Conference On Pervasive Computing Technologies For Healthcare. pp. 344-360 (2022)
- [22] Steenwinckel, B., De Paepe, D., Hautte, S., Heyvaert, P., Bentefrit, M., Moens, P., Dimou, A., Van Den Bossche, B., De Turck, F., Van Hoecke, S. & Others FLAGS: A methodology for adaptive anomaly detection and root cause analysis on sensor data streams by fusing expert knowledge with machine learning. Future Generation Computer Systems. 116 pp. 30-48 (2021)
- [23] Dörpinghaus, J., Klante, S., Christian, M., Meigen, C. & Düing, C. From social networks to knowledge graphs: A plea for interdisciplinary approaches. Social Sciences & Humanities Open. 6, 100337 (2022)
- [24] Rossi, E., Chamberlain, B., Frasca, F., Eynard, D., Monti, F. & Bronstein, M. Temporal graph networks for deep learning on dynamic graphs. ArXiv Preprint ArXiv:2006.10637. (2020)
- [25] Kumar, S., Spezzano, F., Subrahmanian, V. & Faloutsos, C. Edge weight prediction in weighted signed networks. Data Mining (ICDM), 2016 IEEE 16th International Conference On. pp. 221-230 (2016)
- [26] Kumar, S., Hooi, B., Makhija, D., Kumar, M., Faloutsos, C. & Subrahmanian, V. Rev2: Fraudulent user prediction in rating platforms. Proceedings Of The Eleventh ACM International Conference On Web Search And Data Mining. pp. 333-341 (2018)
- [27] Hodge, V. & Austin, J. A survey of outlier detection methodologies. Artificial Intelligence Review. 22 pp. 85-126 (2004)