Effects of colored disorder on the heat conductivity of SiGe alloys from first principles
Abstract
Semiconducting alloys, in particular SiGe, have been employed for several decades as high-temperature thermoelectric materials. Devising strategies to reduce their thermal conductivity may provide a substantial improvement in their thermoelectric performance also at lower temperatures. We have carried out an ab initio investigation of the thermal conductivity of SiGe alloys with random and spatially correlated mass disorder employing the Quasi-Harmonic Green-Kubo (QHGK) theory with force constants computed by density functional theory. Leveraging QHGK and the hydrodynamic extrapolation to achieve size convergence, we obtained a detailed understanding of lattice heat conduction in SiGe and demonstrated that colored disorder suppresses thermal transport across the acoustic vibrational spectrum, leading to up to a 4-fold enhancement in the intrinsic thermoelectric figure of merit.
I Introduction
Thermoelectric (TE) devices are instrumental in managing heat and converting otherwise wasted thermal energy into useful electrical power. The efficiency of TE materials is quantified by the dimensionless figure of merit:
where is the electrical conductivity, the Seebeck coefficient, the temperature, and encompasses the thermal conductivity, computed as the sum of electronic (el) and lattice (l) contributions. While maximizing the figure of merit by manipulating electronic properties is often complicated and limited by their interconnection, a successful strategy involves reducing the lattice thermal conductivity without significantly altering the other factors [1, 2, 3]. For silicon-based TE devices, a viable way to achieve this goal is through alloying with germanium [4, 5]. Indeed, through doping, silicon can become a TE device with a high power factor ( at room temperature [6]), and has a weak dependence on alloying with Ge [4, 7]. However, its performance is hindered by a high lattice thermal conductivity (- at room temperature[8]). Through alloying with a chemically similar element such as germanium, the lattice thermal conductivity of bulk pure silicon can be reduced by at least an order of magnitude [9, 10, 11, 12, 13] without altering significantly the electronic transport coefficients [14, 15, 7]. SiGe alloys have been used since the 1960s in the high-temperature regime for applications like powering space probes with typical at the operating temperature of K [16]. Further development in the field would allow alloys to compete, at room temperature, with the class of TE devices presently employed, often composed of rare and/or toxic materials [17]. Such a goal has been pursued through the years through alloying and structuring at the nano and mesoscale [16, 18, 19, 20, 21]. Both theoretical [22] and experimental [23] work have recently suggested the use of spatially correlated disorder to strongly damp acoustic vibrations.
The goal of this work is to study from first principles the lattice thermal conductivity of alloys, both for the standard uncorrelated (white) and spatially correlated (colored) compositional disorder. The theoretical foundation of our calculations is the recently developed Quasi-Harmonic Green-Kubo theory (QHGK) [24]. This theory, along with a different formulation based on the Wigner Boltzmann Transport Equation [25], offers a unified approach to the thermal conductivity of solid insulators in the weakly anharmonic limit, both for crystals and disordered systems like glasses or alloys. Therefore, both these theories fully account for the effects of disorder on the properties of alloys, beyond the standard perturbative approach [9, 11]. However, the computational cost of QHGK on disordered systems scales poorly with the system size, severely hindering our ability to reach the bulk infinite-size limit. This challenge can be overcome using the hydrodynamic extrapolation [26], which allows for a speedy and accurate evaluation of the low-frequency sound-wave contribution to the heat conductivity that is the culprit for poor size convergence [27]. The hydrodynamic extrapolation relies on the computation of the Vibrational Dynamical Structure Factor (VDSF) and its connection to hydrodynamic equations. Furthermore, the VDSF can be efficiently computed [27] on systems of more than a hundred thousand atoms, which exceeds by an order of magnitude the largest disordered systems directly treated using QHGK in existing literature [26, 27]. This aspect is fundamental for studying spatially correlated systems, particularly when the correlation length is significantly larger than the average interatomic distance.
The article is organized as follows: after a quick review of the QHGK theory and of the hydrodynamic extrapolation, we benchmark our method for uncorrelated alloys against experimental measurements on Raman spectroscopy and thermal conductivity. We then examine the effect of different instances of spatially correlated disorder on the harmonic scattering and consequently on the thermal conductivity. Finally, we present our conclusions.
II Theory
II.1 Quasi-Harmonic Green-Kubo approximation
The QHGK thermal conductivity is obtained solving the quantum GK formula [28, 29, 30] in the quasi-harmonic regime [24, 31, 25, 32]:
| (1) |
where are cartesian indices, and
| (2) | |||
| (3) |
are respectively the generalized two-mode heat capacity and two-mode lifetime; and are the normal-mode angular frequency and anharmonic linewidth; the Bose-Einstein distribution, and is a generalized two-mode velocity matrix [24]. For crystals, it is convenient to use the Bloch states as a basis for the eigenvectors and therefore to label phonons as , where and are the crystal momentum and band index, respectively. In this basis, the generalized velocity matrix is block-diagonal with respect to crystal momentum, , and its diagonal elements in the band indices are the usual group velocities, .
Labeling normal modes of disordered systems with the phonon crystal momentum would seem unnatural and to some extent misleading, due to the lack of periodicity. Notwithstanding, this practice is sometimes justified by the common use of periodic boundary conditions (PBCs) and adopted to enhance the sampling of vibrational modes. It has been shown that a full sampling of the (mini) Brillouin zone (BZ) corresponding to the simulation supercell of a glass model introduces an unphysical order at scales larger than the simulation cell, possibly leading to uncontrolled errors in the computed thermal conductivity [33, 26, 27]. Therefore, throughout this work the normal modes of disordered systems are always computed at the BZ center ( point) and labeled by the discrete “band” indices, .
The QHGK formula is derived under the single-mode relaxation time approximation (RTA). In a nutshell, this expression entails two different yet related approximations. Firstly, single-mode means that any vertex corrections to 4-point correlation functions, in the many-body parlance, is neglected [32, 31]. Secondly, the RTA consists in assuming the following ansatz for the single-body greater (and similarly for the lesser) Green’s function: , where / are the creation/annihilation operators, and . This corresponds to modeling the interaction of each individual mode out of equilibrium with a bath of phonons featuring equilibrium populations. For the sake of simplicity, we omit the Cartesian indices in the rest of the paper. Unless otherwise specified, we indicate as , the isotropic average of Eq. 1.
II.2 Electronic and vibrational Virtual Crystal Approximations for SiGe alloys
Lattice dynamical methods like QHGK require the knowledge of the Born-Oppenheimer (BO) potential energy surface close to mechanical equilibrium, which is entirely determined by the electronic ground state at fixed atomic positions and by the atomic masses. Indeed, the dynamical matrix element between two atoms and is defined as:
where is the BO potential energy, and and are the equilibrium position and mass of the th atom, respectively, and Cartesian indices have been omitted for notational simplicity.
For an alloy, both the BO potential and the distribution of masses contribute to the disorder, which we will refer to as chemical and mass disorder, respectively. However, for chemically similar atoms like Si and Ge, it is known [14, 15] that the BO potential can be accurately described by the (electronic) Virtual Crystal Approximation (eVCA). In essence, for any given concentration of , we consider the electronic properties of a “virtual” crystal where both atomic species are replaced by a fictitious one whose (pseudo)potential is the linear interpolation of the actual species’ potential. Under this assumption, the dynamical matrix becomes:
where and is the (-dependent) BO potential energy, while the masses are still distributed at random (for details, see Appendix D). We refer to this case as the mass-disordered alloy, where mass disorder is fully accounted for, while chemical disorder is neglected. If we also disregard the mass disorder, we obtain the vibrational Virtual Crystal Approximation (vVCA). In this case,
where . While being a much cruder approximation[14], the vVCA can still provide valuable insights into the vibrational properties of the system in the acoustic region, where neighboring Si and Ge atoms vibrate in phase, and it is often the starting point for perturbative treatments of mass disorder [9, 11, 7].
The eVCA is assumed to be valid throughout this paper and it plays a fundamental role in enabling the computation of second- and third-order Interatomic Force Constants (IFCs) using ab initio methods such as Density Functional Perturbation Theory (DFPT) [34, *Giannozzi1991a, *baroni2001phonons]. By neglecting chemical disorder, the IFCs can be computed efficiently for the virtual crystal, fully leveraging the benefits of periodicity.
II.3 Scattering by mass disorder
For any concentration ranging from 0 to 1, the alloy in the eVCA must be modeled as a disordered medium with respect to lattice vibrations, due to the disruptive impact of mass disorder on the periodicity of the dynamical matrix. As in the case of other disordered solids, such as amorphous ones, the lack of periodicity poses a significant challenge in achieving size convergence through a direct approach. One major computational bottleneck is the diagonalization of the dynamical matrix, which scales poorly (cubically) with the number of atoms. The finite size particularly impacts low frequencies, since the minimum nonzero frequency scales as , where is the edge length of a cubic simulation cell, and the speed of sound. While treating hundreds of thousands of atoms in reciprocal space is routine for crystals, by exploiting periodicity through the Bloch theorem, it is computationally unfeasible to treat the same number of atoms in disordered media, despite this being sometimes required to achieve convergence [26].
To address this challenge, various techniques have been explored [9, 37, 26]. For the uncorrelated case, we employ and compare two distinct approaches: the standard perturbative solution [9] and the recently developed hydrodynamic extrapolation [26] which fully accounts for the harmonic disorder. For the spatially correlated case, we rely only on hydrodynamic extrapolation, since a perturbative treatment in the presence of spatial correlations would require further theoretical and numerical effort.
The standard approach for an uncorrelated alloy involves a perturbative treatment of disorder [9]. The phonon frequencies and velocities of the virtual crystal are used in the Boltzmann Transport Equation within the single-mode Relaxation Time Approximation (BTE-RTA):
| (4) |
where the effect of disorder scattering is accounted for in the lifetimes through Matthiessen’s rule [38]: . The mass disorder linewidth can be computed perturbatively with Fermi’s Golden Rule (FGR), yielding to Tamura’s formula for perturbative isotopic scattering [39], which for a crystal with only one chemical element reads:
| (5) | ||||
| (6) |
Here, is the vibrational density of states normalized to unity, and is a measure of mass variance, given by:
involving mass () and concentration () of the th among species, and their average mass, .
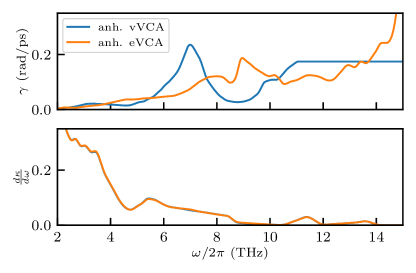
While the perturbative approach using the vVCA normal modes is effective for acoustic bands, it fails in the optical frequency range when alloying effects are sufficiently large.
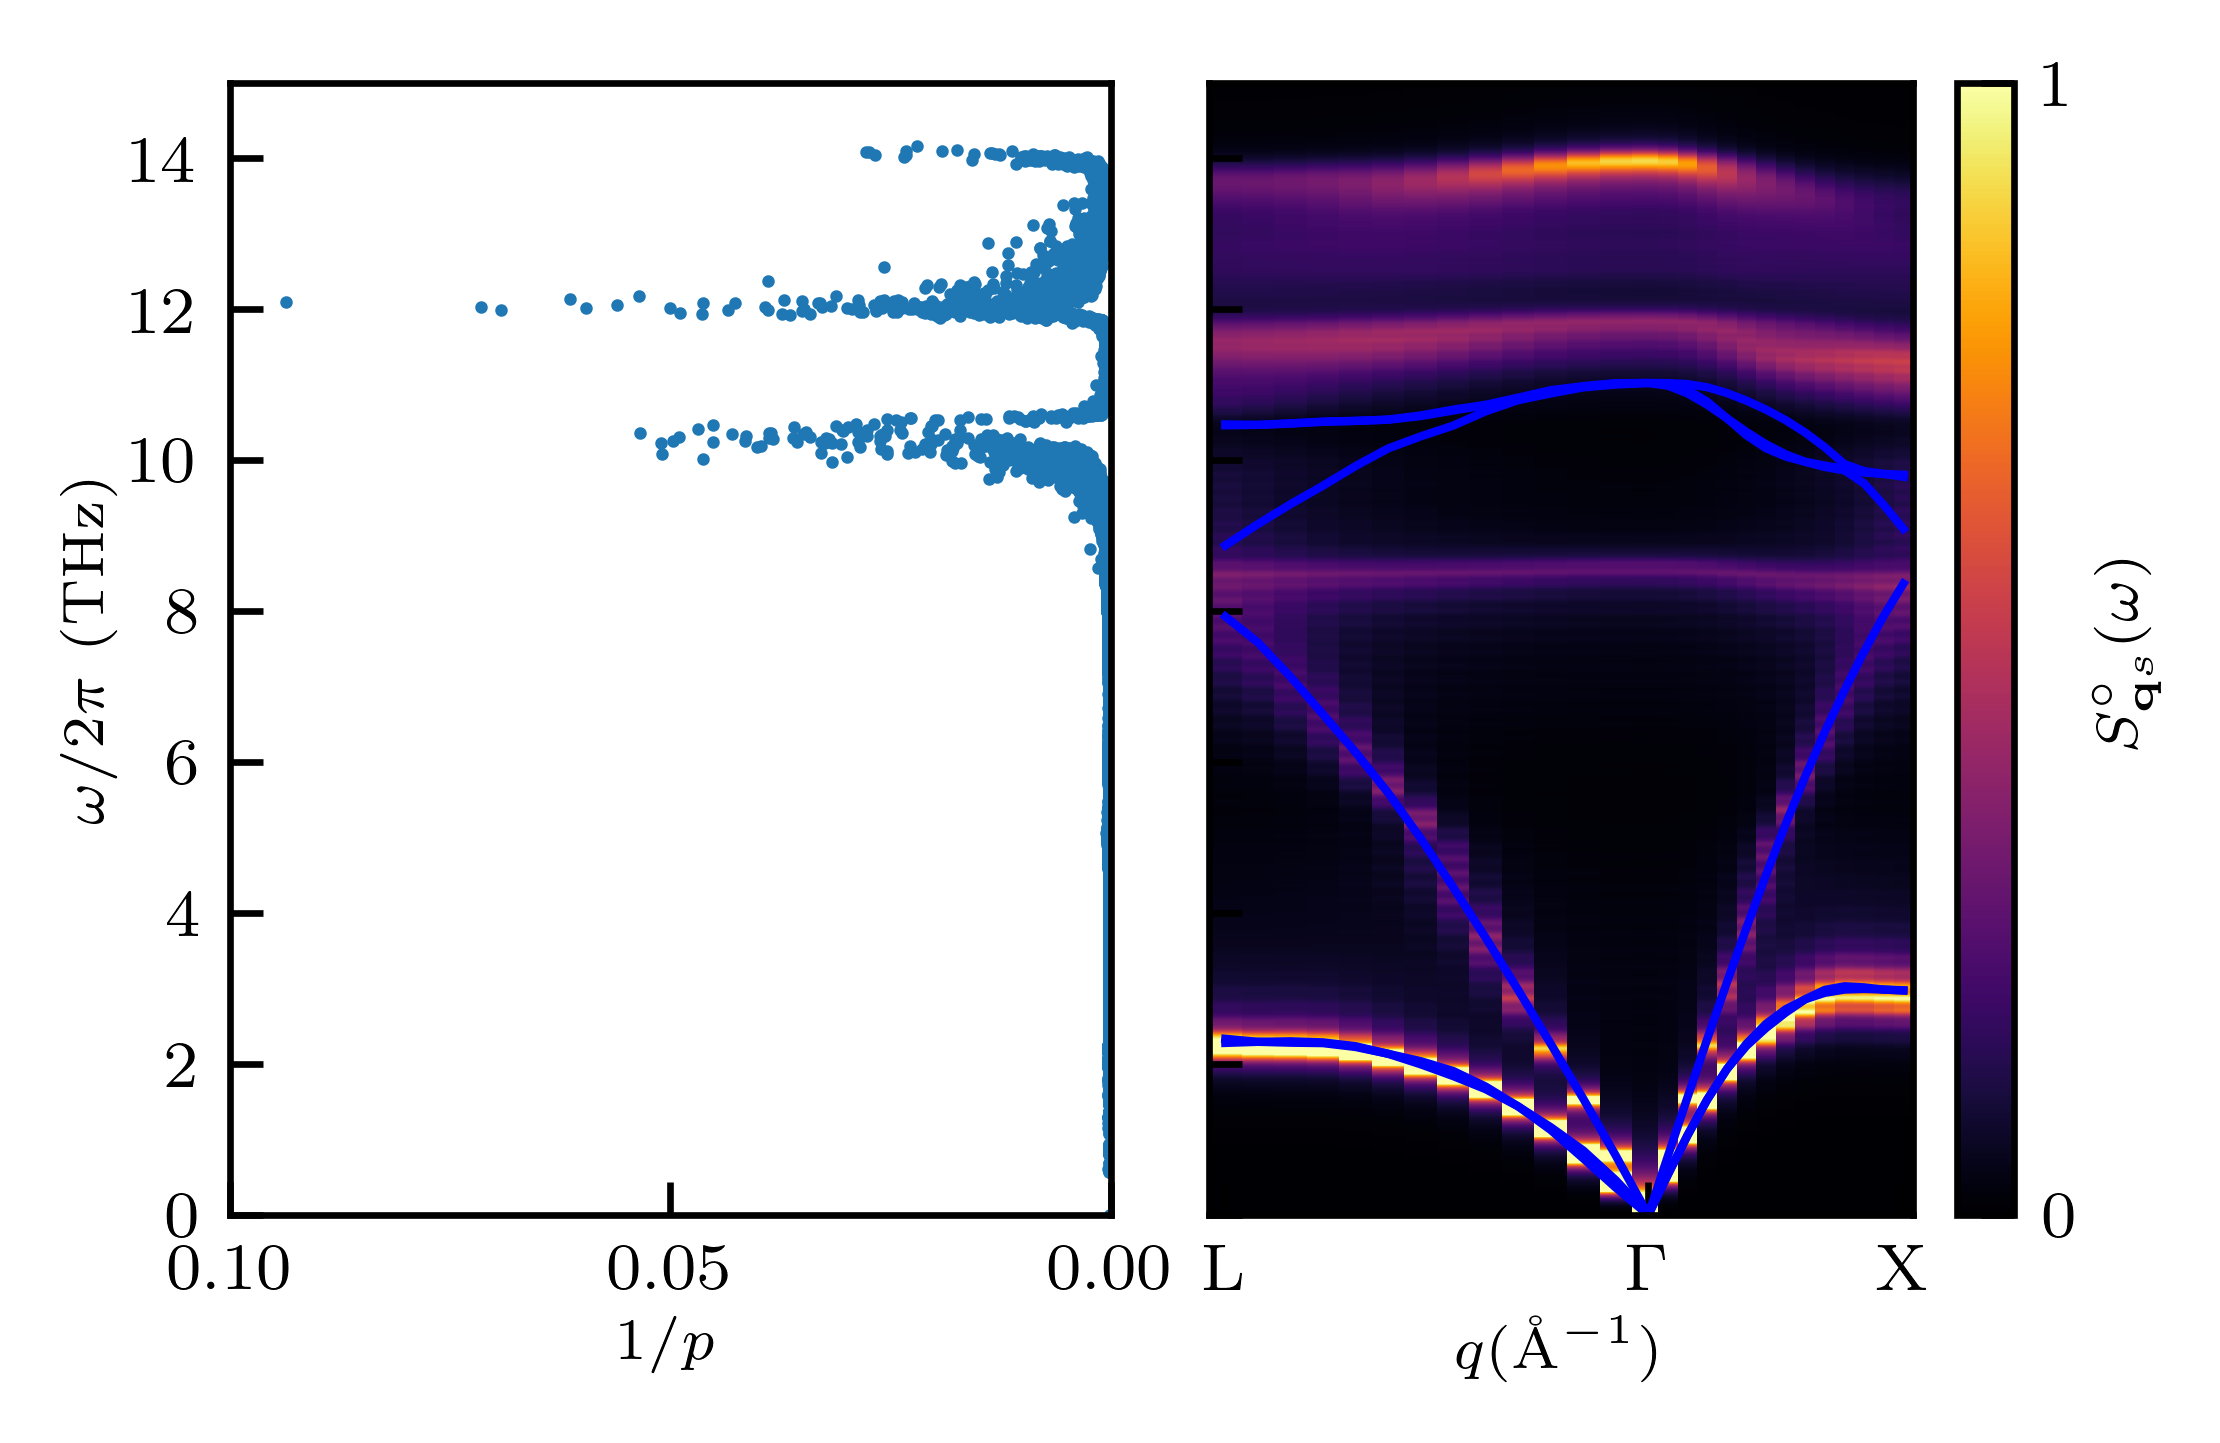
This breakdown is demonstrated in Fig. 1 using the spectral function of the virtual crystal eigenvectors in the harmonic approximation
| (7) |
where is the scalar product between the vVCA eigenvector and the eVCA one, and the Inverse Participation Ratio (IPR) [40],
| (8) |
where is the component of the -th vibrational eigenvector on the -th atom in Cartesian direction . As observed in the spectral function, the vVCA cannot predict the splitting of the optical bands into Si-Si, Si-Ge, and Ge-Ge-related modes[41]. Moreover, a significative difference between eVCA and vVCA is indicated by the IPR, which is a measure of localization and ranges from (fully delocalized modes) to (fully localized). The IPR shows that optical modes undergo substantial localization that cannot be captured in the vVCA approach, in which the normal modes are crystalline, hence fully delocalized.
The failure of the crystal picture at higher frequencies has been observed in various alloys [41, 37, 42], resembling the behavior of vibrational modes in amorphous solids. In glasses, low frequencies are populated with acoustic-like propagating modes, known as propagons. As the energy increases, vibrations lose their propagating character and cannot be assigned a group velocity. These modes may be delocalized, called diffusons, or localized, locons, and contribute to the diffusive component of the thermal conductivity in glasses [43].
Driven by the analogy with the theory of heat transport in glasses, we employ the hydrodynamic extrapolation technique to significantly accelerate size convergence [26]. Essentially, this method involves separating the low-energy propagons’ contribution from the diffusive one and using an acoustic wave-like basis to compute the former. Leveraging arguments from the hydrodynamics of solids, the propagons’ contribution can be extrapolated to the bulk system [44, 26]. For isotropic thermal conductivity, the hydrodynamic extrapolation is expressed as [26]:
| (9) | |||
| (10) | |||
| (11) |
Here, the index indicates the transverse or longitudinal polarization of the acoustic branches, and is the Heaviside function that separates the propagonic and non-propagonic contributions [26, 27]. The propagon contribution is then computed on a dense grid of wavevectors, commonly referred to as a -mesh, and it can be easily extrapolated to the bulk limit, resulting in the inclusion of a Debye-like term in the thermal conductivity [26, 27].
The diffusive thermal conductivity, , which is to a large extent size-insensitive, is computed using the normal modes of a disordered finite cell, while the propagon one, , involves the acoustic branches below a certain frequency of the size-converged virtual crystal. The transition between the two regimes is not sharp, allowing some freedom in the choice of . However, as discussed in Ref. 26 and in Appendix E, as long as is in a region where the acoustic branches are well-defined and distinct by polarization, then the thermal conductivity depends only very weakly on . The propagons linewidth, , accounts for both harmonic mass-disorder (non-perturbatively, as detailed below) and perturbative third-order anharmonic scattering affecting the vVCA vibrations, unlike the purely anharmonic linewidths of the normal modes, .
Estimating involves computing the VDSF of acoustic phonons, whose straightforward generalization to include perturbative anharmonic effects is [26]:
Then, the linewidths are evaluated by a Lorentzian fit [45, 26]:
| (12) |
where is a normalization factor. Analogously, the linewidth due to harmonic mass-disorder alone is obtained by a Lorentzian fit of .
As shown in Ref. 27, the VDSF and, more generally, the diagonal elements of the vibrational Green’s functions can be efficiently computed using the Haydock recursion method [46, 47], leveraging the iterative Lanczos technique. This procedure avoids diagonalization and scales as , being the number of non-vanishing elements of the dynamical matrix: for a dense dynamical matrix, if the dynamical matrix is sparse, as in the case of short-range interactions. It is worth mentioning that in the eVCA long-range effects could also be treated efficiently by using a different basis for the Haydock method. As shown in Ref. 47, nearly linear scaling can be achieved by working simultaneously in reciprocal and real space, rather than relying exclusively on a real-space implementation as done in this work. This speed-up enables the study of the VDSF of disordered systems with hundreds of thousands of atoms [27].
To summarize, the diffusive contribution to thermal conductivity is obtained from disordered samples of manageable size, while is efficiently computed using the acoustic dispersion of the virtual crystal and the linewidths extracted from the VDSF, whose calculation is accelerated by the Haydock method [46]. Although (Eq. 11) and Eq. 4 seem similar when restricted to the acoustic branches, it is crucial to note that the VDSF, and therefore , fully account for mass disorder, beyond the perturbative level of Eq. 5.
We finally mention that Ref. 42 recently proposed a method to solve the Green-Kubo equation at the quasi-harmonic level, as in QHGK, which substitutes the hurdle of diagonalizing massive dynamical matrices with the repeated use of stochastic traces. While this method cannot substantially change the performance of computing with the VDSF, it could further reduce the computational cost of the diffusive part.
III Results
The virtual crystal diamond structures are simulated, including the calculation of second- and third-order interatomic force constants, using the Density Functional Theory codes in the Quantum ESPRESSO™ [48, *giannozzi2017advanced, *giannozzi2020quantum] (QE) distribution, and D3Q [51], which implements third-order DFPT. Lattice dynamics calculations are performed with ALD [52]. Computational details are given in Appendix A.
III.1 Raman spectroscopy
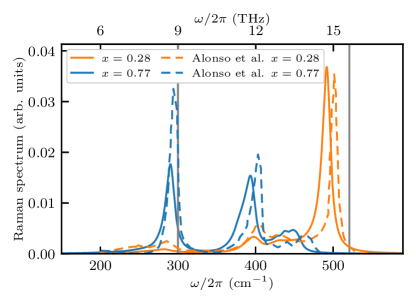
We test the reliability of our predictions by computing the unpolarized nonresonant Stokes Raman spectrum of alloys using the Placzek approximation [54]. Following Ref. 47, the computation of the polarized Raman spectrum closely resembles that of the VDSF, as explained in detail in Appendix C. To compare the experimental and numerical results, the spectrum is computed with a smearing width of , matching the experimental resolution [53]. The vVCA anharmonic linewidths at room temperature are neglected as they are an order of magnitude smaller than the experimental resolution in the selected frequency range, and the line broadening is dominated by mass disorder, which is explicitly accounted for in the VDSF calculation.
The experimental phenomenology of alloys has been extensively studied [53, 55, 56]. The Raman spectra of pure and systems exhibit peaks at the degenerate optical frequencies at the point of the BZ, located at and , respectively. At intermediate concentrations, , /, and peaks are observed near their characteristic frequencies, with broadening primarily due to harmonic disorder. Additionally, minor peaks between and are commonly observed in experiments. Our calculations accurately predict the observed positions of both the major and minor peaks. However, the experimental peak appears sharper than the simulated one. This discrepancy could be attributed to several factors, including possible frequency-dependent variations in experimental resolution[57] and the chemical bonding differences between and sites, which are not accounted for under the eVCA assumptions. It is worth mentioning that the vVCA approach would predict only one peak as the pure systems, with a concentration-dependent position, again proving a qualitative difference between the vVCA and eVCA in describing vibrations in the optical frequency range [41].
III.2 Thermal conductivity of alloys
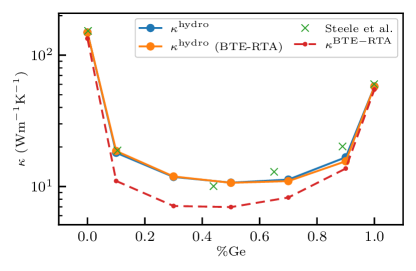
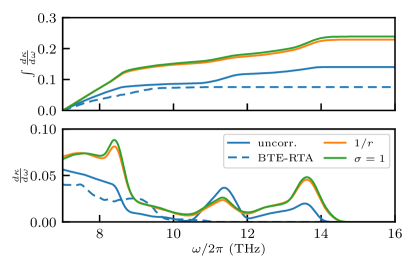
We compute the thermal conductivity of uncorrelated alloys, comparing our method to the BTE-RTA, which has successfully reproduced experimental measurements [9, 11, 7]. As observed in Ref. 11 and Fig. 3, even with a typically dense -mesh with a spacing between BZ points of 0.07 Å-1, i.e. a mesh, finite-size effects can reduce the bulk thermal conductivity at room temperature by up to . We cope with finite-size effects through the hydrodynamic extrapolation, as explained in Ref. 26. In the BTE-RTA method, the hydrodynamic extrapolation simply consists of including the Debye contribution on top of the results obtained with a dense -mesh. To perform the extrapolation, we fit the scattering for vanishing frequencies as [26, 58], where the temperature-dependent quadratic term is due to the anharmonic linewidths and the quartic term is due to disorder. In addition to the mass disorder due to alloying, we include isotopic scattering computed with Eq. 5 for both methods. Unsurprisingly, isotopic effects are impactful only for the pure systems, as the scattering due to alloying is on average two to three orders of magnitudes larger for the intermediate concentrations.
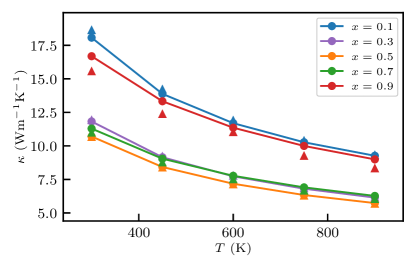
The bulk thermal conductivity is shown in Fig. 3 as a function of the concentration of Ge (upper panel) and of the temperature (lower panel). At fixed temperature, both methods exhibit a distinctive U-shape, typical of both crystalline [59, 9] and amorphous [60, 61] alloys, with a minimum around . Notably, the results from both methods are nearly equivalent, with a relative difference within . Both methods reproduce well the experimental data at room temperature [4]. However, there is significant variance in experimental results, e.g., for K and , can vary between and [4, 59, 5]. This variance suggests some caution in the comparison with experiments and underscores the importance of accurately characterizing the disorder. In fact, according to Ref. 4, the process employed to grow the alloy and the resulting disorder is the most likely cause of such variance.
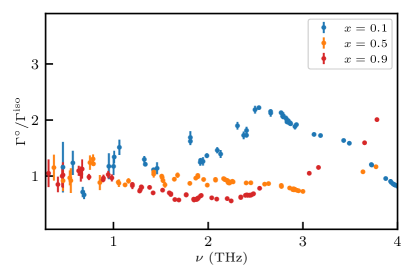
The success of the perturbative approach in reproducing the QHGK result, despite overlooking the diffusive contribution and misrepresenting the optical phonons dispersion, is attributed to the dominant role of acoustic phonons, for which a perturbative treatment is reasonable. Indeed, according to Ref. 9, at room temperature and , phonons with a frequency below contribute of the total thermal conductivity. The lack of a diffusive interband contribution in the BTE-RTA would seem to imply that this method poses a lower bound to the QHGK results if harmonic scattering were exactly accounted for (see the lower panel of Fig. 7). Instead, at low concentrations, highlighting the importance of a non-perturbative account of mass-disorder scattering. As shown in Fig. 4, and in agreement with the molecular dynamics results of Ref. 62, even for acoustic modes below , linewidths from exact mass-disorder scattering can significantly differ, both positively and negatively, from the perturbative treatment of Eq. 5 [39]. However, it is somewhat surprising that such corrections to Tamura’s formula are more pronounced for dilute concentrations () than for . A rationale can be found in the prefactor in the third order correction to Eq. 5 [39], where for , the values for are approximately , respectively, which agree with the observations in Fig. 4.
III.3 Colored disorder
In the pursuit of reducing the predominant contribution of acoustic modes and lowering in SiGe thermoelectrics, several approaches have been proposed based on the principle of enhancing acoustic phonon scattering. From concentration graded superlattices [21, 20] to nanopores [63] and nanograins [16, 64, 16, 65, 66, 67, 18], the overall qualitative idea is to produce a disorder-induced scattering of large-wavelength acoustic vibrations, which would otherwise propagate virtually like in a homogeneous medium. Quantitatively, the main limitation in reducing the acoustic contribution through harmonic disorder is represented by Rayleigh’s scattering, which vanishes so quickly for vanishing frequencies that it cannot even guarantee a finite bulk thermal conductivity in a purely harmonic glass [68, 27]. Under very general assumptions, any harmonic scattering follows Rayleigh’s scaling in the hydrodynamic limit [69]. However, nontrivial behavior is determined by the spatial correlations of elastic deformations. Essentially, as long as their correlation length is finite, acoustic vibrations with a wavelength larger than some characteristic length are scattered like the vibrational modes of a chain of equally spaced atoms connected by springs with uncorrelated random spring constants yielding [70]. At higher frequencies, random media theory predicts a crossover of the harmonic scattering linewidths [71, 72] which is observed both experimentally [73, 74] and numerically [27] in amorphous materials such as -SiO2. If the correlation length increases, the crossover shifts to lower frequencies, thus enhancing the overall scattering strength due to harmonic disorder (see Refs. 22, 23 and Appendix G).
We investigate two cases of correlated mass distributions,
| (13) |
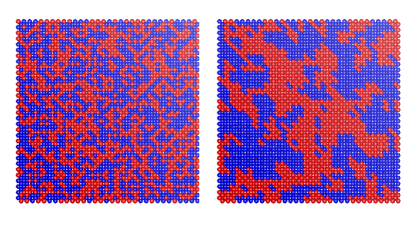
where . One is an infinite-length power-law , and the other a finite-length Gaussian correlation , where is a dimensionless parameter and is the cubic root of the volume . First, we generate different mass configurations at for each correlation function using the algorithm described in Appendix D, exemplified in Fig. 5 where a clustering effect can be observed as the result of correlations. Our procedure slightly differs from the commonly used algorithm for generating spatially correlated disorder [22] to reduce noise due to the discreteness of mass values.
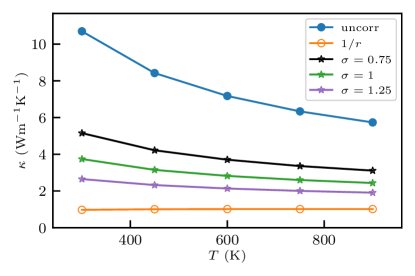
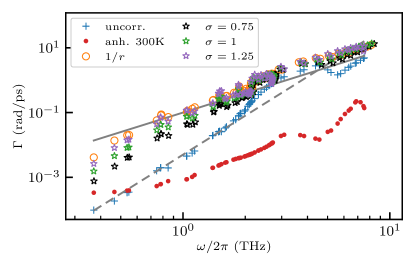
Colored disorder significantly reduces the lattice thermal conductivity, as shown in the upper panel of Fig. 6. The longer the correlation length the more effective the thermal conductivity reduction. This reduction relies on the enhanced dampening of the acoustic modes, lower panel Fig. 6, which is not compensated by the slight increase of the diffusive contribution shown in Fig. 7. Apart from being overall stronger, the colored scattering presents qualitative differences from the uncorrelated case. Indeed, for frequencies below approximately , a crossover from to for the harmonic scattering is observed in the Gaussian case, with the turning-point frequency increasing monotonically with . To quantitatively capture the crossover it is essential to compute the Debye-like contribution correctly. Therefore we use the empirical function proposed in Ref. 73:
| (14) |
where the fitting parameters and are a prefactor and the crossover angular frequency, respectively. The fixed parameter determines the sharpness of the transition. Although the correlation theoretically should maintain an scaling in the vanishing-frequency limit [22], it also appears to exhibit a crossover: this is justified by the implicit cutoff due to the imposed PBCs, which prevents the range of correlations to exceed the system’s size (see Appendix G). Therefore the harmonic scattering has been extrapolated as , ignoring the crossover which in this case is a finite-size effect.
III.4 Thermoelectric Figure of Merit
While the lowest value of thermal conductivity is reached for the correlation, we focus the rest of our analysis on the Gaussian case, whose scattering can be captured without finite-size effects and whose technological implementation would require control only at the nanoscale, rather than at all the scales. Notably, a Gaussian correlation with already reduces the thermal conductivity to approximately at room temperature, which is about times smaller than the corresponding value for an uncorrelated alloy.
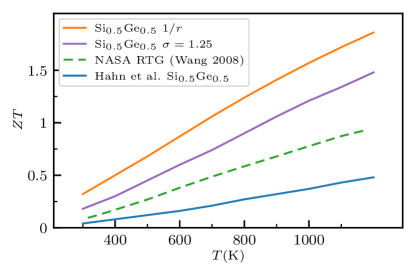
The large thermal conductivity reduction from correlated mass disorder may improve the SiGe TE figure of merit, extending the operational range of SiGe-based TE devices, so far limited to high temperatures, K, mostly in radioisotope thermoelectric generators (RTGs) powering NASA space probes. RTGs consist of both p- and n-doped polycrystalline SiGe with carriers concentration and thermal conductivity lower than bulk crystalline SiGe - [16]. The of state-of-the-art n-doped RTG is shown in Fig. 8. The intrinsic electronic transport coefficients of SiGe were computed by DFT-eVCA and the semiclassical Boltzmann transport equation in Ref. 7 as a function of alloy composition, temperature, and carrier concentration. We calculated for Si0.5Ge0.5 with correlated disorder , using and for n-doped SiGe with from [7]. To obtain we use Wiedemann-Franz law with an experimentally determined Lorenz number of . Fig. 8 shows an enhancement of the intrinsic of single-crystal SiGe with uncorrelated disorder from 4-fold at low temperature to 3-fold at high temperature, and a 1.5-fold improvement over the n-doped NASA RTG at all temperatures. Repeating the same calculation for the correlated mass disorder yields a theoretical maximum of 1.9 at . reaches the technologically critical value of 1 at K, thus making SiGe a potentially efficient TE material at moderate temperatures.
IV Conclusions
In summary, we have computed the thermal conductivity of SiGex alloy as a function of concentration and temperature using a non-perturbative approach to treat mass disorder. Whereas our predictions for the thermal conductivity in the uncorrelated case are similar to the standard perturbative BTE method [9], our approach based on QHGK [24] and hydrodynamic long-wavelength extrapolation [26] is more general and allows us to treat systems with correlated disorder. Our calculations predict that the lattice thermal conductivity of SiGex () may be reduced by a factor at room temperature by engineering correlated disorder. The resulting thermal conductivity is similar to that obtained by hot-pressing alloyed nanopowders, and lower than that of state-of-the-art NASA radio-isotope thermoelectric generators (RTGs) made of polycrystalline SiGe. We have demonstrated that the lattice thermal conductivity reduction from correlated mass disorder leads to a factor 1.5 enhancement over the RTGs across the 300-1100 K temperature range and a 4-fold enhancement over the of single crystalline Si0.5Ge0.5 with uncorrelated disorder.
Whereas manufacturing alloys with correlated compositional disorder may be challenging, SiGe alloy thin films with controlled concentration profiles in the growth direction can be grown epitaxially [20] and exhibit substantial thermal conductivity reduction [21], indicating that long-range correlations are effective at suppressing heat transport.
The codes that support the relevant results within this paper are publicly available from the respective developers’ repositories. Analysis scripts to compute VDSF and perform the hydrodynamic extrapolation are available on GitHub [75] and on the Materials Cloud platform [76]. See DOI:[to be included when available].
Acknowledgements.
The authors are grateful to Enrico Drigo, Florian Pabst, and Giacomo Tenti for fruitful discussions. We are also grateful to Luciano Colombo and Claudio Melis for providing raw data on first-principles calculations of the transport coefficients of SiGe. This work was partially supported by the European Commission through the MaX Centre of Excellence for supercomputing applications (grant number 101093374), by the Italian MUR, through the PRIN project ARES (grant number 2022W2BPCK), and by the Italian National Centre for HPC, Big Data, and Quantum Computing (grant number CN00000013), funded through the Next generation EU initiative. DD acknowledges support from the DARPA Thermonat program (Agreement No. HR00112390126).Appendix A Computational details
Second- and third-order interatomic force constants (IFC) are obtained from standard [34, *Giannozzi1991a, *baroni2001phonons] and third-order [77, *Debernardi1994, *Debernardi1995] DFPT, using the pw.x/ph.x code in the QE distribution [48, *giannozzi2017advanced, *giannozzi2020quantum] and D3Q [51], respectively. Starting with norm-conserving pseudopotentials based on the approach of von Barth and Car [80] for both silicon and germanium, the virtual crystal pseudopotentials for intermediate concentrations are generated using a dedicated tool within the QE distribution [48]. For all concentrations, the self-consistent calculations on the relaxed virtual diamond crystals are performed on a Monkhorst-Pack [81] mesh, with an energy cutoff of for the plane-wave expansion and a convergence threshold of . The second- and third-order IFCs are then computed with a threshold of , using a and supercell, respectively. The ab initio calculations are conducted for the following set of concentrations: , while the lattice parameters and IFCs for any other concentration are obtained by linear interpolation of the two nearest ab-initio concentrations.
We use these IFCs for the vVCA calculations of anharmonic linewidths and thermal conductivity, as well as for the generation of disordered alloys in real space. The thermal conductivity calculations, both in k-space and real space, are performed using the ALD program [52], while the VDSF is computed through the ”hydro-glass” code available on GitHub [75]. For the crystalline case, we use a dense -mesh . For the disordered alloys, the thermal conductivity and VDSF calculations are performed on sizes corresponding to and supercells, respectively. To take into account the stochastic noise of the generation of the disordered alloys, for each size the results are averaged over samples.
Appendix B Haydock’s recursion technique
Haydock’s recursion technique is an iterative method, based on Lanczos’ iterative algorithm, to efficiently estimate the imaginary part of the diagonal elements of the vibrational Green’s functions and consequently the spectral functions :
| (15) |
where is the dynamical matrix and a generic vector. Haydock’s method[46, 47, 27] allows one to compute the continued fraction expansion of the above expression, whose coefficients are evaluated by a recursive Lanczos chain. The advantages of Haydock’s technique are three-fold. Firstly, the method is known to be numerically robust, despite the well-known instabilities of the Lanczos tridiagonalization scheme [82], and approximately recursion steps were sufficient in our case to retrieve the acoustic phonon linewidth, in agreement with Ref. 47, 27. Secondly, once the coefficients are computed the estimation of for any is inexpensive. Moreover, perturbative anharmonic effects can be added effortlessly by imposing , where is a fit of the anharmonic linewidths [26]. However, we found that for the estimation this method would give no significant difference from the Matthiessen rule [38] , where is the linewidth extracted by the harmonic . Finally and most importantly, Haydock’s technique scales as if is sparse in the chosen basis. This is a major speed-up from the direct computation of , Eq. 7, which involves the diagonalization of and its cubic scaling.
Appendix C Raman spectrum
For a given polarization of the incident and scattered light, the nonresonant Stokes Raman spectra are derived from the spectral function, , computed via the Haydock algorithm [47, 46]:
where, takes into account the effect of the Bose-Einstein distribution [83]. The vector at the -th position and direction is defined as
where represent the polarizations of the incident and scattered light, respectively, and is the Raman tensor. Under the eVCA, the Raman tensor is periodic and can be easily computed for the unit cell of the virtual crystal [47]. Finally, The unpolarized Raman spectrum is obtained from the rotation invariants using the powder formula [84], with a computational cost of a few polarized spectra.
Appendix D Correlated mass disorder
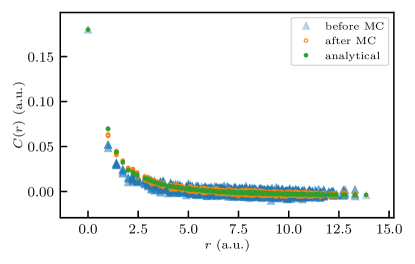
We employ the algorithm from Ref. 22 to create a spatially correlated mass distribution, followed by a Monte Carlo minimization to refine the solution and reduce the errors due to our (very) discrete set of masses: and . We focused on the symmetrical case with Germanium concentration .
Given a desired correlation function , the goal is to build a residual mass distribution according to Eq. 13.
This can be accomplished thanks to the convolution properties of the Fourier Transform (FT), computed with the Fast Fourier Transform algorithm. In fact, the mass distribution must satisfy the following equation:
| (16) |
where is an arbitrary phase. Stochastically equivalent configurations can be generated By extracting this arbitrary phase from a uniform distribution , with the additional requirement of to guarantee a real for a crystal with inversion symmetry. Since we are interested in correlation on scales larger than the unit cell, , we operated on the lattice, therefore treating the masses of the two atoms of the unit cell as a whole.
By Inverse FT (IFT), we retrieve . Then, we discretize it :
while conserving its variance and ensuring a zero average. Assigning for positive values and for negative ones, or vice versa, would conclude the algorithm from Ref. 22. Without a finer grid of mass values, e.g. Ref. 22 used values, the discretization introduces noise. In order to find the optimal we implemented a Monte Carlo algorithm to minimize the loss function:
where indicates the Monte Carlo step. Each Monte Carlo move consists of switching two elements of . is excluded by the loss function since cannot be modified by the Monte Carlo move and it is determined by the average of , initially imposed to zero. An example of the effect of this Monte Carlo refining is shown in Fig. 9.
We employed this algorithm with a short-ranged and a long-ranged correlation function, respectively and . Being the lattice parameter of the diamond crystal, the parameters indicate respectively the cubic root of the volume , an adimensional parameter to determine the cutoff of the Gaussian, and finally is a regularization parameter order of magnitudes smaller than the inverse of our largest side to avoid the non-analytical part of the FT of without altering the behavior for excessively.
Appendix E Details on the hydrodynamic extrapolation
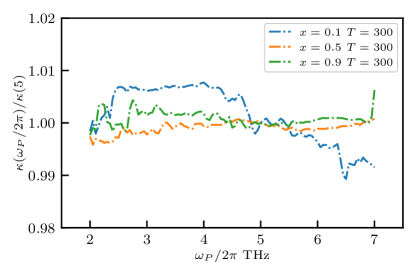
In the main text and Ref. 26 the choice of is discussed as the frequency separator between the acoustic crystalline-like contribution and the “diffusive” contribution computed on the disordered system. While reminds and is related to the crossover frequency between propagons and diffusons, determined with the Ioffe-Regel criterion [85], it is usually smaller and it allows more versatility of choice. The choice of is arbitrary as long as it happens in a region where the real-space disordered contribution is well-converged and the conditions for the acoustic basis are satisfied, i.e. the VDSF shows well-separated longitudinal and transverse acoustic bands. This is exemplified in Fig. 10, where it can be noticed the thermal conductivity as a function of , relative to the result for . Indeed, between and , the relative variation for three different concentrations is less than .
Appendix F Effect of mass disorder on anharmonicity
Harmonic disorder can significantly affect anharmonic scattering. Indeed, the anharmonic linewidths computed with third-order anharmonicity and FGR[86] depend on both the eigenvectors and eigenvalues of the (disordered) dynamical matrix. However, in Fig. 11 we show that despite the considerable difference between the virtual crystal anharmonic linewidths and the ones of a mass-disordered alloy, the thermal conductivity is not affected.
In the top panel Fig. 11 we compare the virtual crystal’s linewidths with the ones computed on a atoms (uncorrelated) mass-disordered alloy, both at . For the disordered alloy, the inter-atomic force constants are still computed in the eVCA approximation, using the Hiphive code[87], but with the eVCA, disordered, eigenvectors.
For both systems, we interpolated the anharmonic linewidths in frequency with a spline. Since the maximum frequency of the virtual crystal is lower than the one of the disordered alloy, we extrapolated with a constant. The two splines tend to overlap at lower frequencies while they differ significantly at higher frequencies. However, such a difference does not affect the frequency-resolved thermal conductivity plotted in the lower panel. As a rule of thumb, as long as the anharmonic difference is located in a frequency region dominated by disorder, g.e. the diffusive region, its effect on thermal conductivity is negligible. Therefore, our choice, shared by Ref. 37, 9, of using the virtual crystal linewidths does not reduce the accuracy of our calculations.
Appendix G Scattering rate scaling in finite systems
Calculations on atomistic systems in PBCs are characterized by an implicit cutoff distance given by the supercell size, . Assuming a long-range mass perturbation correlation function for an ideal system, the respective correlation function for an actual calculation is of the form , where is the Heaviside step function. In the Debye limit, the perturbative scattering rate can be expressed in terms of the Fourier transform of , , as [39, 22]
| (17) |
where is the speed of sound. Given the assumed form of , its Fourier transform is
| (18) | ||||
which in turn yields
| (19) |
For any finite , the dominant term for low is . For infinite , the dominant contribution is [22]. The crossover wavenumber can be found considering a dimensionless version of (19),
| (20) |
where , and equating the two asymptotic limits,
yielding .
References
- Snyder and Toberer [2008] G. J. Snyder and E. S. Toberer, Complex thermoelectric materials, Nature Mater 7, 105 (2008).
- Beretta et al. [2019] D. Beretta, N. Neophytou, J. M. Hodges, M. G. Kanatzidis, D. Narducci, M. Martin-Gonzalez, M. Beekman, B. Balke, G. Cerretti, W. Tremel, et al., Thermoelectrics: From history, a window to the future, Materials Science and Engineering: R: Reports 138, 100501 (2019).
- Pecunia et al. [2023] V. Pecunia, S. R. P. Silva, J. D. Phillips, E. Artegiani, A. Romeo, H. Shim, J. Park, J. H. Kim, J. S. Yun, G. C. Welch, et al., Roadmap on energy harvesting materials, J. Phys. Mater. 6, 042501 (2023), publisher: IOP Publishing.
- Steele and Rosi [1958] M. Steele and F. Rosi, Thermal conductivity and thermoelectric power of germanium-silicon alloys, Journal of Applied Physics 29, 1517 (1958).
- Dismukes et al. [1964] J. Dismukes, L. Ekstrom, E. Steigmeier, I. Kudman, and D. Beers, Thermal and electrical properties of heavily doped ge-si alloys up to 1300 k, Journal of Applied Physics 35, 2899 (1964).
- Stranz et al. [2013] A. Stranz, J. Kähler, A. Waag, and E. Peiner, Thermoelectric Properties of High-Doped Silicon from Room Temperature to 900K, J. Electron. Mater. 42, 2381 (2013).
- Hahn et al. [2021a] K. R. Hahn, C. Melis, F. Bernardini, and L. Colombo, Intrinsic thermoelectric figure of merit of bulk compositional sige alloys: A first-principles study, Physical Review Materials 5, 065403 (2021a).
- Kremer et al. [2004] R. Kremer, K. Graf, M. Cardona, G. Devyatykh, A. Gusev, A. Gibin, A. Inyushkin, A. Taldenkov, and H.-J. Pohl, Thermal conductivity of isotopically enriched 28si: revisited, Solid state communications 131, 499 (2004).
- Garg et al. [2011] J. Garg, N. Bonini, B. Kozinsky, and N. Marzari, Role of disorder and anharmonicity in the thermal conductivity of silicon-germanium alloys: A first-principles study, Phys. Rev. Lett. 106, 045901 (2011).
- He et al. [2012] Y. He, I. Savić, D. Donadio, and G. Galli, Lattice thermal conductivity of semiconducting bulk materials: atomistic simulations, Phys. Chem. Chem. Phys. 14, 16209 (2012).
- Hahn et al. [2021b] K. R. Hahn, C. Melis, F. Bernardini, and L. Colombo, Engineering the thermal conductivity of doped sige by mass variance: a first-principles proof of concept, Frontiers in Mechanical Engineering 7, 712989 (2021b).
- Lorenzi et al. [2018] B. Lorenzi, R. Dettori, M. T. Dunham, C. Melis, R. Tonini, L. Colombo, A. Sood, K. E. Goodson, and D. Narducci, Phonon Scattering in Silicon by Multiple Morphological Defects: A Multiscale Analysis, Journal of Elec Materi 47, 5148 (2018).
- Xiong et al. [2017] S. Xiong, D. Selli, S. Neogi, and D. Donadio, Native surface oxide turns alloyed silicon membranes into nanophononic metamaterials with ultralow thermal conductivity, Phys. Rev. B 95, 180301 (2017).
- De Gironcoli et al. [1991] S. De Gironcoli, P. Giannozzi, and S. Baroni, Structure and thermodynamics of si x ge 1- x alloys from ab initio monte carlo simulations, Physical review letters 66, 2116 (1991).
- Marzari et al. [1994] N. Marzari, S. de Gironcoli, and S. Baroni, Structure and phase stability of ga x in 1- x p solid solutions from computational alchemy, Physical review letters 72, 4001 (1994).
- Wang et al. [2008] X. W. Wang, H. Lee, Y. C. Lan, G. H. Zhu, G. Joshi, D. Z. Wang, J. Yang, A. J. Muto, M. Y. Tang, J. Klatsky, et al., Enhanced thermoelectric figure of merit in nanostructured n-type silicon germanium bulk alloy, Applied Physics Letters 93, 10.1063/1.3027060 (2008).
- Donadio [2019] D. Donadio, Advances in the optimization of silicon-based thermoelectrics: a theory perspective, Current Opinion in Green and Sustainable Chemistry 17, 35 (2019).
- Bathula et al. [2012] S. Bathula, M. Jayasimhadri, N. Singh, A. Srivastava, J. Pulikkotil, A. Dhar, and R. Budhani, Enhanced thermoelectric figure-of-merit in spark plasma sintered nanostructured n-type sige alloys, Applied Physics Letters 101, 213902 (2012).
- Savić et al. [2013] I. Savić, D. Donadio, F. Gygi, and G. Galli, Dimensionality and heat transport in si-ge superlattices, Applied Physics Letters 102 (2013).
- Ferrando-Villalba et al. [2015] P. Ferrando-Villalba, A. F. Lopeandía, F. X. Alvarez, B. Paul, C. de Tomás, M. I. Alonso, M. Garriga, A. R. Goñi, J. Santiso, G. Garcia, et al., Tailoring thermal conductivity by engineering compositional gradients in Si1-x Ge x superlattices, Nano Res. 8, 2833 (2015).
- Ferrando-Villalba et al. [2020] P. Ferrando-Villalba, S. Chen, A. F. Lopeandía, F. X. Alvarez, M. I. Alonso, M. Garriga, J. Santiso, G. Garcia, A. R. Goñi, D. Donadio, et al., Beating the Thermal Conductivity Alloy Limit Using Long-Period Compositionally Graded Si Ge $_x$ Superlattices, J. Phys. Chem. C 124, 19864 (2020).
- Thébaud et al. [2023] S. Thébaud, L. Lindsay, and T. Berlijn, Breaking rayleigh’s law with spatially correlated disorder to control phonon transport, Physical Review Letters 131, 026301 (2023).
- Chaney et al. [2021] D. Chaney, A. Castellano, A. Bosak, J. Bouchet, F. Bottin, B. Dorado, L. Paolasini, S. Rennie, C. Bell, R. Springell, et al., Tuneable correlated disorder in alloys, Physical Review Materials 5, 035004 (2021).
- Isaeva et al. [2019] L. Isaeva, G. Barbalinardo, D. Donadio, and S. Baroni, Modeling heat transport in crystals and glasses from a unified lattice-dynamical approach, Nat. Commun. 10, 3853 (2019).
- Simoncelli et al. [2019] M. Simoncelli, N. Marzari, and F. Mauri, Unified theory of thermal transport in crystals and glasses, Nat. Phys. 15, 809 (2019).
- Fiorentino et al. [2023a] A. Fiorentino, P. Pegolo, and S. Baroni, Hydrodynamic finite-size scaling of the thermal conductivity in glasses, npj Computational Materials 9, 10.1038/s41524-023-01116-2 (2023a).
- Fiorentino et al. [2024] A. Fiorentino, E. Drigo, S. Baroni, and P. Pegolo, Unearthing the foundational role of anharmonicity in heat transport in glasses, Phys. Rev. B 109, 224202 (2024).
- Green [1952] M. S. Green, Markoff random processes and the statistical mechanics of time-dependent phenomena, J. Chem. Phys. 20, 1281 (1952).
- Kubo [1957] R. Kubo, Statistical-mechanical theory of irreversible processes. i. general theory and simple applications to magnetic and conduction problems, J. Phys. Soc. Jpn. 12, 570 (1957).
- Kubo et al. [1957] R. Kubo, M. Yokota, and S. Nakajima, Statistical-mechanical theory of irreversible processes. ii. response to thermal disturbance, J. Phys. Soc. Jpn. 12, 1203 (1957).
- Fiorentino and Baroni [2023] A. Fiorentino and S. Baroni, From green-kubo to the full boltzmann kinetic approach to heat transport in crystals and glasses, Phys. Rev. B 107, 054311 (2023).
- Caldarelli et al. [2022] G. Caldarelli, M. Simoncelli, N. Marzari, F. Mauri, and L. Benfatto, Many-body green’s function approach to lattice thermal transport, Phys. Rev. B 106, 024312 (2022).
- Moon et al. [2018] J. Moon, B. Latour, and A. J. Minnich, Propagating elastic vibrations dominate thermal conduction in amorphous silicon, Phys. Rev. B 97, 024201 (2018).
- Baroni et al. [1987] S. Baroni, P. Giannozzi, and A. Testa, Green’s-function approach to linear response in solids, Phys. Rev. Lett. 58, 1861 (1987).
- Giannozzi et al. [1991] P. Giannozzi, S. de Gironcoli, P. Pavone, and S. Baroni, Ab initio calculation of phonon dispersions in semiconductors, Phys. Rev. B 43, 7231 (1991).
- Baroni et al. [2001] S. Baroni, S. De Gironcoli, A. Dal Corso, and P. Giannozzi, Phonons and related crystal properties from density-functional perturbation theory, Reviews of modern Physics 73, 515 (2001).
- Thebaud et al. [2020] S. Thebaud, C. A. Polanco, L. Lindsay, and T. Berlijn, Success and breakdown of the t-matrix approximation for phonon-disorder scattering, Physical Review B 102, 094206 (2020).
- Matthiessen and von Bose [1862] A. Matthiessen and M. von Bose, On the influence of temperature on the electric conducting power of metals, Philos. Trans. R. Soc. 152, 1 (1862).
- Tamura [1983] S.-i. Tamura, Isotope scattering of dispersive phonons in ge, Physical Review B 27, 858 (1983).
- Feldman et al. [1993] J. L. Feldman, M. D. Kluge, P. B. Allen, and F. Wooten, Thermal conductivity and localization in glasses: Numerical study of a model of amorphous silicon, Phys. Rev. B 48, 12589 (1993).
- de Gironcoli and Baroni [1992] S. de Gironcoli and S. Baroni, Effects of disorder on the vibrational properties of sige alloys: failure of mean-field approximations, Physical review letters 69, 1959 (1992).
- Thebaud et al. [2022] S. Thebaud, T. Berlijn, and L. Lindsay, Perturbation theory and thermal transport in mass-disordered alloys: Insights from green’s function methods, Physical Review B 105, 134202 (2022).
- Allen et al. [1999] P. B. Allen, J. L. Feldman, J. Fabian, and F. Wooten, Diffusons, locons and propagons: Character of atomie yibrations in amorphous si, Philos. Mag. B 79, 1715 (1999).
- Griffin [1968] A. Griffin, Brillouin light scattering from crystals in the hydrodynamic region, Rev. Mod. Phys. 40, 167 (1968).
- Feldman et al. [1999] J. L. Feldman, P. B. Allen, and S. R. Bickham, Numerical study of low-frequency vibrations in amorphous silicon, Phys. Rev. B 59, 3551 (1999).
- Haydock [1980] R. Haydock, The Recursive Solution of the Schrödinger Equation (Academic Press, 1980) pp. 215–294.
- Vast and Baroni [2000] N. Vast and S. Baroni, Effects of isotopic disorder on the Raman spectra of crystals: Theory and ab initio calculations for diamond and germanium, Phys. Rev. B 61, 9387 (2000).
- Giannozzi et al. [2009] P. Giannozzi, S. Baroni, N. Bonini, M. Calandra, R. Car, C. Cavazzoni, D. Ceresoli, G. L. Chiarotti, M. Cococcioni, I. Dabo, et al., Quantum espresso: a modular and open-source software project for quantum simulations of materials, Journal of physics: Condensed matter 21, 395502 (2009).
- Giannozzi et al. [2017] P. Giannozzi, O. Andreussi, T. Brumme, O. Bunau, M. B. Nardelli, M. Calandra, R. Car, C. Cavazzoni, D. Ceresoli, M. Cococcioni, et al., Advanced capabilities for materials modelling with quantum espresso, Journal of physics: Condensed matter 29, 465901 (2017).
- Giannozzi et al. [2020] P. Giannozzi, O. Baseggio, P. Bonfà, D. Brunato, R. Car, I. Carnimeo, C. Cavazzoni, S. De Gironcoli, P. Delugas, F. Ferrari Ruffino, et al., Quantum espresso toward the exascale, The Journal of chemical physics 152 (2020).
- Paulatto et al. [2013] L. Paulatto, F. Mauri, and M. Lazzeri, Anharmonic properties from a generalized third-order ab initio approach: Theory and applications to graphite and graphene, Physical Review B 87, 214303 (2013).
- Barbalinardo et al. [2020] G. Barbalinardo, Z. Chen, N. W. Lundgren, and D. Donadio, Efficient anharmonic lattice dynamics calculations of thermal transport in crystalline and disordered solids, J. Appl. Phys. 128, 135104 (2020).
- Alonso and Winer [1989] M. I. Alonso and K. Winer, Raman spectra of c-si 1- x ge x alloys, Physical Review B 39, 10056 (1989).
- Brüesch [1986] P. Brüesch, Phonons: Theory and Experiments II: Experiments and Interpretation of Experimental Results (Springer Berlin Heidelberg, 1986).
- Mooney et al. [1993] P. Mooney, F. Dacol, J. Tsang, and J. Chu, Raman scattering analysis of relaxed ge x si1- x alloy layers, Applied Physics Letters 62, 2069 (1993).
- Rouchon et al. [2014] D. Rouchon, M. Mermoux, F. Bertin, and J. Hartmann, Germanium content and strain in si1- xgex alloys characterized by raman spectroscopy, Journal of crystal growth 392, 66 (2014).
- Schrader et al. [1990] B. Schrader, A. Hoffmann, A. Simon, R. Podschadlowski, and M. Tischer, Nir-ft-raman-spectroscopy, state of the art, Journal of molecular structure 217, 207 (1990).
- Larkin and McGaughey [2014] J. M. Larkin and A. J. H. McGaughey, Thermal conductivity accumulation in amorphous silica and amorphous silicon, Phys. Rev. B 89, 144303 (2014).
- Abeles et al. [1962] B. Abeles, D. Beers, G. D. Cody, and J. Dismukes, Thermal conductivity of ge-si alloys at high temperatures, Physical review 125, 44 (1962).
- Lundgren et al. [2021] N. W. Lundgren, G. Barbalinardo, and D. Donadio, Mode localization and suppressed heat transport in amorphous alloys, Physical Review B 103, 024204 (2021).
- Pegolo and Grasselli [2024] P. Pegolo and F. Grasselli, Thermal transport of glasses via machine learning driven simulations, Frontiers in Materials 11, 10.3389/fmats.2024.1369034 (2024).
- Larkin and McGaughey [2013] J. M. Larkin and A. J. H. McGaughey, Predicting alloy vibrational mode properties using lattice dynamics calculations, molecular dynamics simulations, and the virtual crystal approximation, J. Appl. Phys. 114, 023507 (2013), https://doi.org/10.1063/1.4812737 .
- Lee et al. [2010] H. Lee, D. Vashaee, D. Z. Wang, M. S. Dresselhaus, Z. F. Ren, and G. Chen, Effects of nanoscale porosity on thermoelectric properties of SiGe, Journal of Applied Physics 107, 094308 (2010).
- Liu et al. [2009] X. Liu et al., High thermal conductivity of a hydrogenated amorphous silicon film, Phys. Rev. Lett. 102, 035901 (2009).
- Joshi et al. [2008] G. Joshi, H. Lee, Y. Lan, X. Wang, G. Zhu, D. Wang, R. W. Gould, D. C. Cuff, M. Y. Tang, M. S. Dresselhaus, G. Chen, and Z. Ren, Enhanced Thermoelectric Figure-of-Merit in Nanostructured p-type Silicon Germanium Bulk Alloys, Nano Lett. 8, 4670 (2008).
- Zhu et al. [2009] G. H. Zhu, H. Lee, Y. C. Lan, X. W. Wang, G. Joshi, D. Z. Wang, J. Yang, D. Vashaee, H. Guilbert, A. Pillitteri, M. S. Dresselhaus, G. Chen, and Z. F. Ren, Increased Phonon Scattering by Nanograins and Point Defects in Nanostructured Silicon with a Low Concentration of Germanium, Phys. Rev. Lett. 102, 196803 (2009).
- Pernot et al. [2010] G. Pernot, M. Stoffel, I. Savic, F. Pezzoli, P. Chen, G. Savelli, A. Jacquot, J. Schumann, U. Denker, I. Mönch, C. Deneke, O. G. Schmidt, J. M. Rampnoux, S. Wang, M. Plissonnier, A. Rastelli, S. Dilhaire, and N. Mingo, Precise control of thermal conductivity at the nanoscale through individual phonon-scattering barriers, Nature Mater 9, 491 (2010).
- Chaudhuri et al. [2010] A. Chaudhuri, A. Kundu, D. Roy, A. Dhar, J. L. Lebowitz, and H. Spohn, Heat transport and phonon localization in mass-disordered harmonic crystals, Phys. Rev. B 81, 064301 (2010).
- Ganter and Schirmacher [2010] C. Ganter and W. Schirmacher, Rayleigh scattering, long-time tails, and the harmonic spectrum of topologically disordered systems, Physical Review B 82, 094205 (2010).
- Allen and Kelner [1998] P. B. Allen and J. Kelner, Evolution of a vibrational wave packet on a disordered chain, Am. J. Phys. 66, 497 (1998).
- Mizuno et al. [2020] H. Mizuno, G. Ruocco, and S. Mossa, Sound damping in glasses: Interplay between anharmonicities and elastic heterogeneities, Physical Review B 101, 174206 (2020).
- Schirmacher et al. [2024] W. Schirmacher, M. Paoluzzi, F. C. Mocanu, D. Khomenko, G. Szamel, F. Zamponi, and G. Ruocco, The nature of non-phononic excitations in disordered systems, Nature Communications 15, 3107 (2024).
- Baldi et al. [2011] G. Baldi, V. M. Giordano, and G. Monaco, Elastic anomalies at terahertz frequencies and excess density of vibrational states in silica glass, Phys. Rev. B 83, 174203 (2011).
- Masciovecchio et al. [2006] C. Masciovecchio, G. Baldi, S. Caponi, L. Comez, S. Di Fonzo, D. Fioretto, A. Fontana, A. Gessini, S. Santucci, F. Sette, et al., Evidence for a crossover in the frequency dependence of the acoustic attenuation in vitreous silica, Physical review letters 97, 035501 (2006).
- Fiorentino et al. [2023b] A. Fiorentino, P. Pegolo, and E. Drigo, hydro_glasses (2023b).
- Talirz et al. [2020] L. Talirz et al., Materials cloud, a platform for open computational science, Sci. Data 7, 299 (2020).
- Gonze and Vigneron [1989] X. Gonze and J. Vigneron, Density-functional approach to nonlinear-response coefficients of solids, Phys. Rev. B 39, 13120 (1989).
- Debernardi and Baroni [1994] A. Debernardi, A and S. Baroni, 3rd-order density-functional perturbation theory - a practical implementation with applications to anharmonic couplings in Si, Sol. St. Comm. 91, 813 (1994).
- Debernardi et al. [1995] A. Debernardi, S. Baroni, and E. Molinari, Anharmonic Phonon Lifetimes in Semiconductors from Density-Functional Perturbation Theory, Phys. Rev. Lett. 75, 1819 (1995).
- Dal Corso et al. [1993] A. Dal Corso, S. Baroni, R. Resta, and S. de Gironcoli, Ab initio calculation of phonon dispersions in ii-vi semiconductors, Physical Review B 47, 3588 (1993).
- Monkhorst and Pack [1976] H. J. Monkhorst and J. D. Pack, Special points for brillouin-zone integrations, Physical review B 13, 5188 (1976).
- Paige [1980] C. Paige, Accuracy and effectiveness of the lanczos algorithm for the symmetric eigenproblem, Linear Algebra Appl. 34, 235 (1980).
- Lazzeri and Mauri [2003] M. Lazzeri and F. Mauri, First-principles calculation of vibrational raman spectra in large systems: Signature of small rings in crystalline s i o 2, Physical review letters 90, 036401 (2003).
- Prosandeev et al. [2005] S. Prosandeev, U. Waghmare, I. Levin, and J. Maslar, First-order raman spectra of a b 1/ 2’ b 1/ 2 ”o 3 double perovskites, Physical Review B 71, 214307 (2005).
- Ioffe and Regel [1960] A. F. Ioffe and A. R. Regel, in Progresses in Semiconductors, Vol. 4, edited by A. F. Gibson (Heywood, London, 1960) p. 237.
- Fabian and Allen [1996] J. Fabian and P. B. Allen, Anharmonic decay of vibrational states in amorphous silicon, Physical review letters 77, 3839 (1996).
- Eriksson et al. [2019] F. Eriksson, E. Fransson, and P. Erhart, The hiphive package for the extraction of high-order force constants by machine learning, Advanced Theory and Simulations 2, 1800184 (2019).