The SDSS-V Black Hole Mapper Reverberation Mapping Project: Multi-Line Dynamical Modeling of a Highly Variable Active Galactic Nucleus with Decade-long Light Curves
Abstract
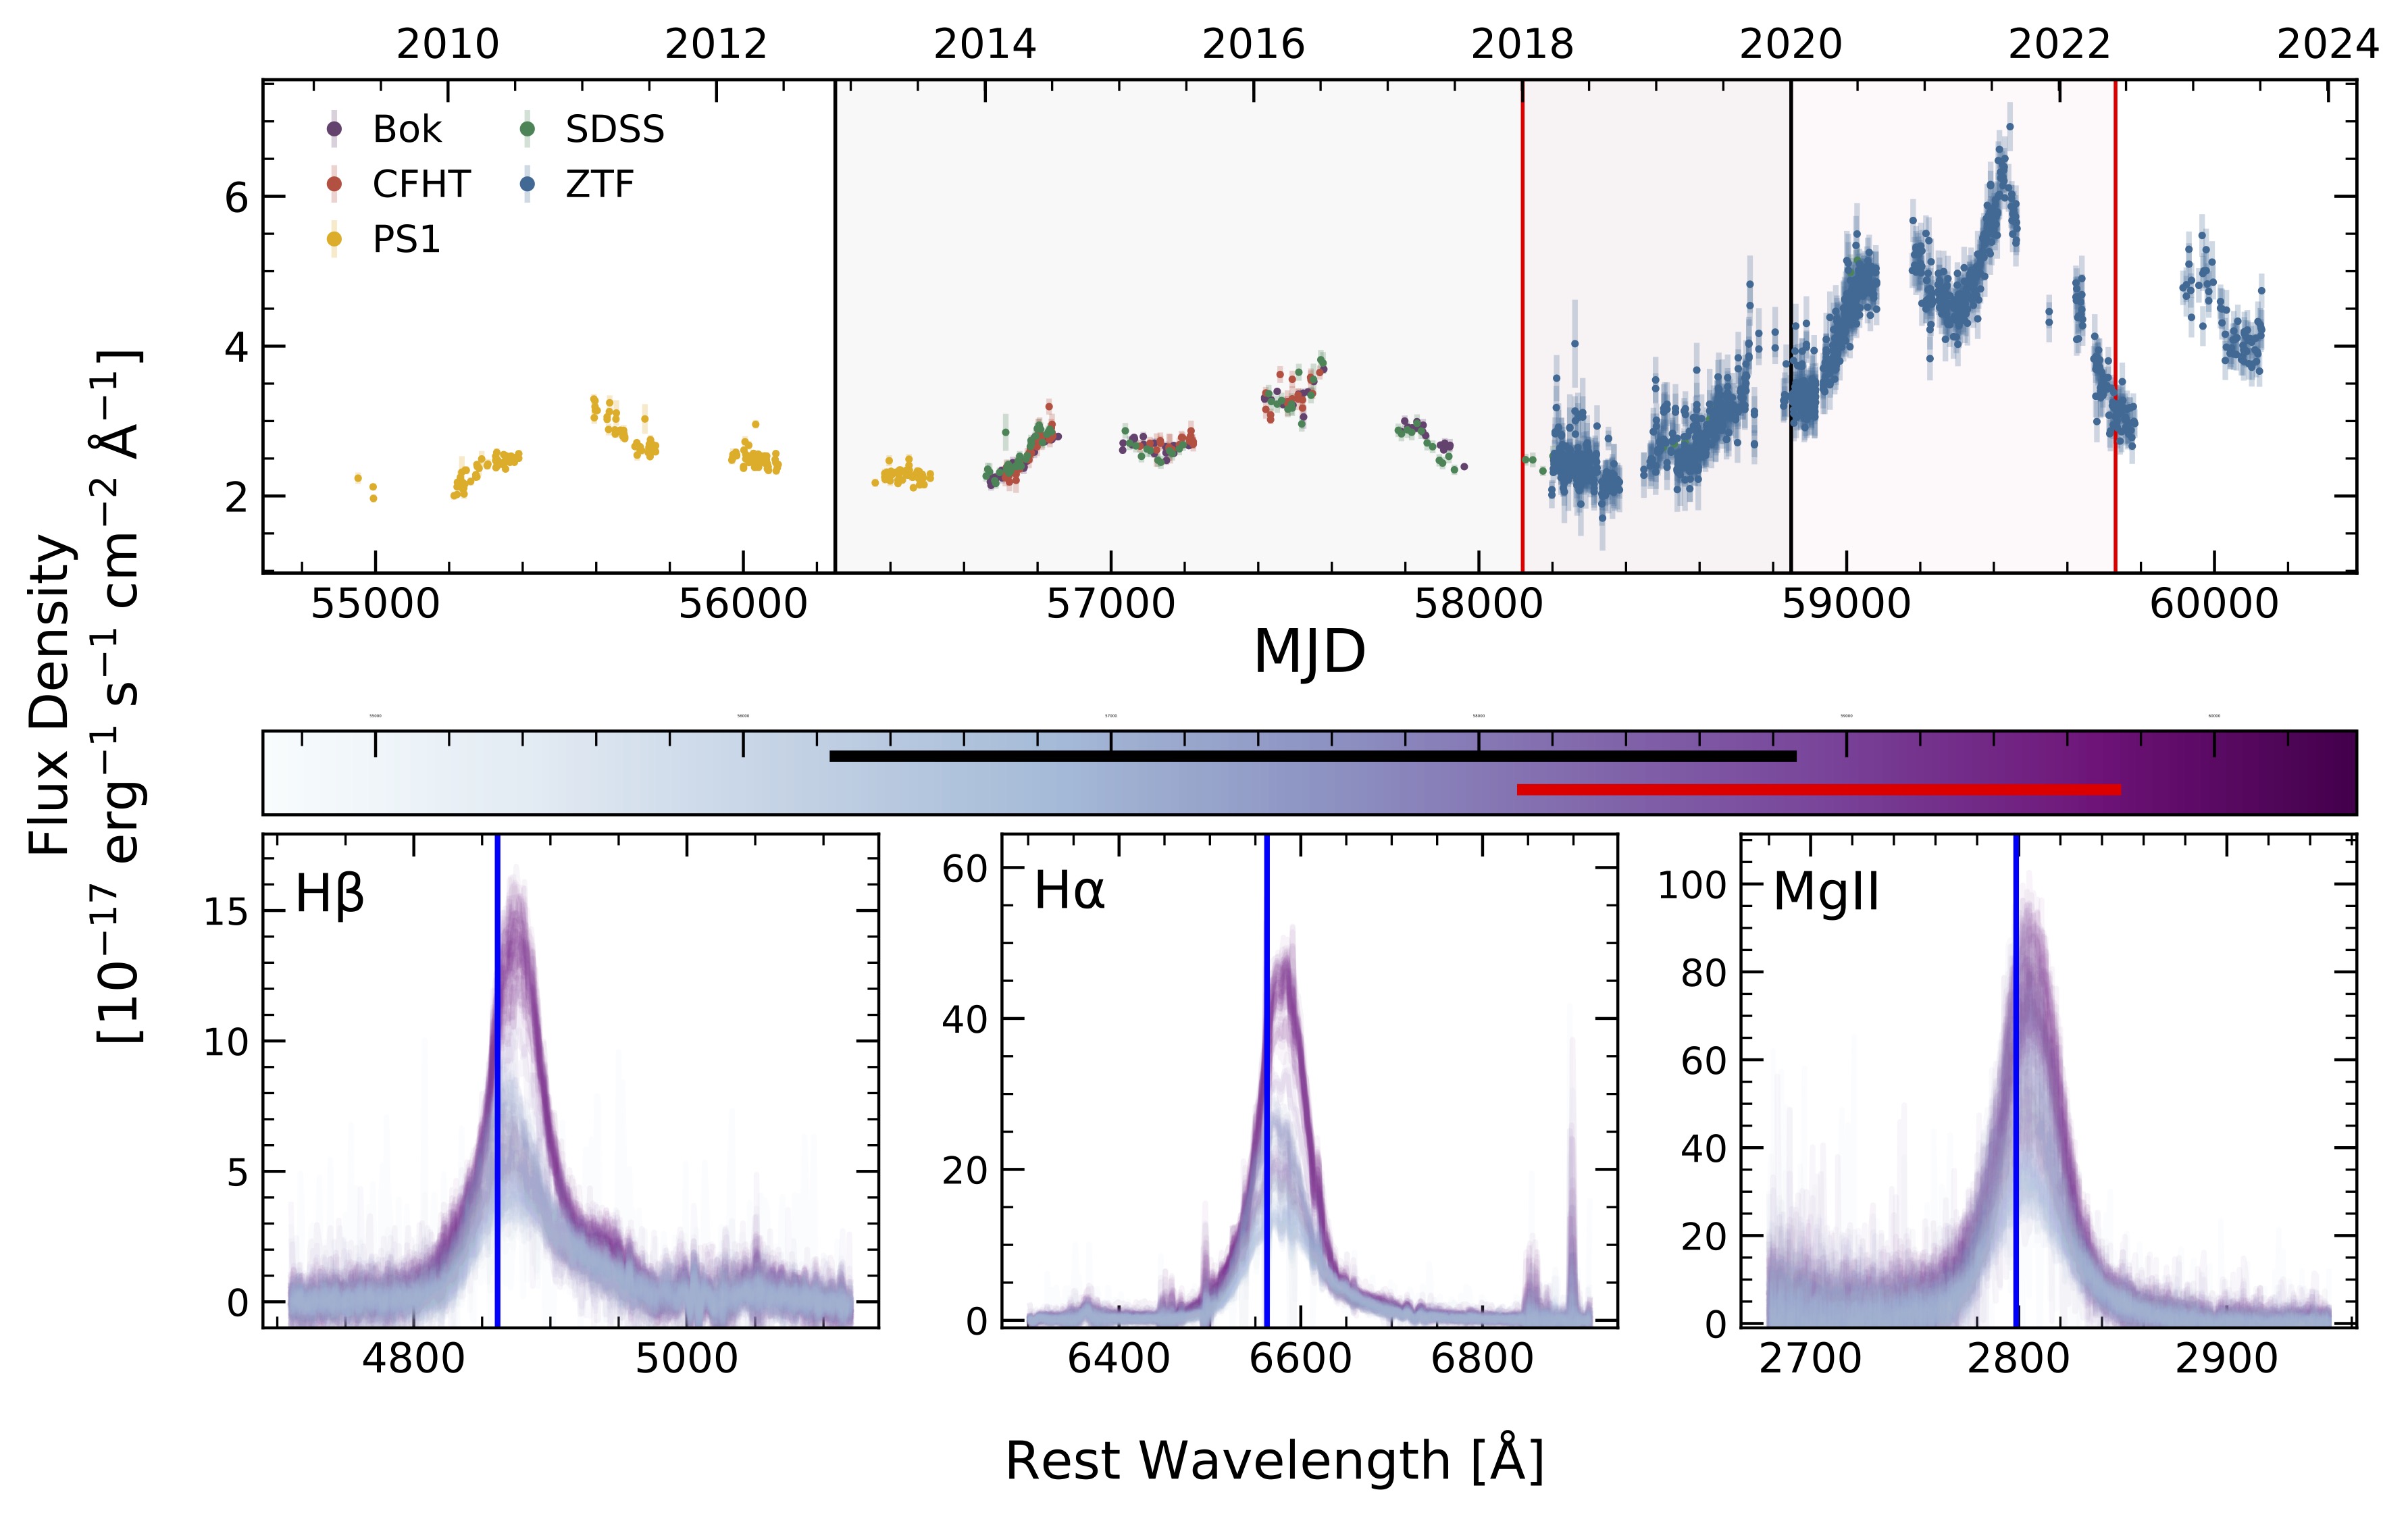
We present dynamical modeling of the broad-line region (BLR) for the highly variable AGN SDSS J141041.25+531849.0 () using photometric and spectroscopic monitoring data from the Sloan Digital Sky Survey Reverberation Mapping project and the SDSS-V Black Hole Mapper program, spanning from early 2013 to early 2023. We model the geometry and kinematics of the BLR in the H, H, and Mg ii emission lines for three different time periods to measure the potential change of structure within the BLR across time and line species. We consistently find a moderately edge-on thick-disk geometry for all BLRs, with a joint estimate for the mass of the supermassive black hole (SMBH) for each of three time periods, yielding when using the full dataset. The inferred individual virial factor is significantly smaller than the average factor for a local sample of dynamically modeled AGNs. There is strong evidence for non-virial motion, with over of clouds on inflowing/outflowing orbits. We analyze the change in model parameters across emission lines, finding the radii of BLRs for the emission lines are consistent with the following relative sizes . Comparing results across time, we find , with the change in BLR size for H being more significant than for the other two lines. The data also reveal complex, time-evolving, and potentially transient dynamics of the BLR gas over decade-long timescales, encouraging for future dynamical modeling of fine-scale BLR kinematics.
1 Introduction
It is well-known that nearly all massive galaxies harbor a supermassive black hole (SMBH) at their center (MagorrianEtAl1998; KormendyHo2013). Properties and effects of these SMBHs are most commonly observed through actively accreting SMBHs known as active galactic nuclei (AGNs). AGNs have been observed for nearly a century (Seyfert1943; Schmidt1963), and display a number of common properties in their time-series and spectroscopic data, including a characteristic stochastic variability on all timescales and observed wavelengths, broad emission lines, narrow emission lines, and continuum emission (Netzer2013). To explain observations of these different parts of the spectrum, a general picture of the inner emitting regions of AGNs has been put forward (e.g., Antonucci1993; UrryPadovani1995; Netzer2015b). The geometry and kinematics of these substructures imprint themselves on their emission, and reflect the properties of the SMBH, their effects on the SMBH’s surroundings, and their relation to the rest of its host galaxy. AGN temporal variability, and its correlation between different photometric bands, has been modeled well over year-long timescales with both statistically-informed (e.g., KellyEtAl2009a; MacLeodEtAl2010a; KellyEtAl2014; SuberlakEtAl2021; StoneEtAl2022b) and physically-informed (e.g., DexterAgol2010a; SunEtAl2020a; NeustadtKochanek2022d; StoneShen2022a) models. Such studies have demonstrated the connection between variability and physics within the AGN, including the timescale of optical variability correlating positively with the mass of the SMBH across a wide range of masses (BurkeEtAl2021), and with the rest-frame observed wavelength (e.g., MacLeodEtAl2010a).
However, there are many parts of this picture that remain uncertain, including the different geometries of the inner emitting substructures: the accretion disk, broad-line region (BLR), narrow-line region, dusty torus, etc. Statistical prescriptions employed to describe AGN optical variability have been shown to produce biased results (e.g., Kozlowski2017) and break down on days- to weeks-long timescales when using decades-long light curves (StoneEtAl2022b). Work on finer scales within the AGN can reveal the nature of certain substructures and probe properties of the AGN and SMBH. In particular the BLR, a region of gas clouds orbiting the SMBH photoionized by a central source to produce broad emission lines, has been frequently used to infer the mass of the SMBH through a method known as reverberation mapping (RM; BlandfordMcKee1982a; Peterson1993; Peterson2001).
RM exploits the intrinsic variability of AGNs, correlating the emission from the central source, assumed to arise from the accretion disk, to emission from the BLR which echoes the continuum (Peterson2001). Recombination times for the measured broad lines are relatively short, meaning path-dependent effects are dominant, so the emission line can be treated as a delayed and smoothed version of the photoionizing continuum radiation (Peterson2001). Assuming a virialized BLR, RM relates to a measured time delay :
| (1) |
where is the speed of light, is the gravitational constant, is a measured velocity of the BLR gas, and is a normalization factor, accounting for the geometry and kinematics of the BLR (Peterson2001).
can be obtained through time-series correlation methods and measured via the width of a given emission line. can be calibrated in a variety of ways, including with the empirical relation observed in the local Universe (OnkenEtAl2004a; GrahamEtAl2011; ParkEtAl2012; WooEtAl2013a; HoKim2014), but only for the population average rather than for individual systems. Combining RM with the empirical relation (KaspiEtAl2000; BentzEtAl2009; BentzEtAl2013) allows the calculation of with only a single spectrum (e.g., WandelEtAl1999; Vestergaard2002; McLureJarvis2002; VestergaardPeterson2006; Shen2013; ShenEtAl2016; ShenEtAl2024). Large-scale RM survey programs, such as the Sloan Digital Sky Survey Reverberation Mapping (SDSS-RM; ShenEtAl2015) project and the OzDES Reverberation Mapping program (e.g., KingEtAl2015; HoormannEtAl2019) obtain spectra for a large number of broad-line AGNs at multiple epochs to obtain lags and over a wide range of redshifts and AGN properties.
There are many aspects of general estimation that could be significantly improved: the uncertainty in a single-epoch measurement can be dex due to the uncertainty carried in and the relation (e.g., ShenEtAl2024). To improve estimates of , and investigate its dependency on conditions within the BLR and properties of the AGN, independent measurements of are needed. Traditional RM makes many assumptions about the BLR, including virial motions and temporal stability. Furthermore, most RM work only measures a mean lag of the BLR, although this can be improved by employing velocity-resolved RM to map out kinematics across the observed line profile. Finally, traditional RM assumes the width of a given emission line is constant, whereas it is known that the profile of the broad line may change over time due to changes in physical conditions within the BLR along or out of our line-of-sight (LOS) (e.g., KoristaGoad2004; BarthEtAl2015; WangEtAl2020).
To accurately map the geometry and kinematics of the BLR requires derivation of the transfer function that governs the response of the BLR to the photoionizing continuum (HorneEtAl2004a), as a function of LOS velocity and time delay. There are multiple methods to infer BLR geometry and kinematics given the transfer function, including velocity-resolved reverberation mapping (e.g., DenneyEtAl2009; BentzEtAl2009; GrierEtAl2013), the maximum entropy method (MEMEcho; WelshHorne1991; HorneEtAl2004a), linear inversion (SkielboeEtAl2015), and dynamical modeling (BottorffEtAl1997; PancoastEtAl2014b, hereafter PancoastEtAl2014b). In particular, dynamical modeling is an appealing method to probe the transfer function, as it utilizes a physically-motivated dynamical model to obtain estimates for all physical parameters involved, including and BLR inclination. By mapping the kinematics of the gas within the BLR, dynamical modeling can test the virial assumption in RM and produce as a byproduct. Thus, dynamical modeling can jointly infer both the size of the BLR and , without requiring certain important assumptions in deriving the BH mass (e.g., viriality and inclination) as in traditional RM work.
Over the past decade, nearly 30 AGNs have been analyzed with dynamical modeling using RM data, displaying a general trend in BLR geometries: a thick disk, inclined relatively face-on toward the observer (PancoastEtAl2014; GrierEtAl2017c; PancoastEtAl2018; LiEtAl2018; WilliamsEtAl2018a; WilliamsEtAl2020a; WilliamsEtAl2021; WangEtAl2020a; VillafanaEtAl2022a; BentzEtAl2021a; BentzEtAl2022; BentzEtAl2023). Dynamical modeling results reveal a variety of BLR kinematics, including inflow, outflow, virial motion, or a combination of them. In most instances, the results obtained from dynamical modeling match those obtained from traditional RM within their uncertainties, even with the measurement of from dynamical modeling being independent of the assumptions present in traditional RM.
More objects have been analyzed through their velocity-resolved lag profiles, including samples of super-Eddington AGNs (DuEtAl2016), and those with asymmetric broad emission line profiles (BrothertonEtAl2020; BaoEtAl2022; UEtAl2022; ZastrockyEtAl2024). Generally, AGNs containing broad emission lines with red asymmetry produce lag profiles representative of inflow or virial motion with some influence of inflow, and those with blue asymmetry produce lag profiles representative of outflow or virial motion with some influence of outflow. Although, there are a number of objects that counter this notion, with either contradictory lag profiles or complex profiles requiring more elaborate BLR models to explain (e.g., DuEtAl2018). Super-Eddington AGN lag profiles also display a range of BLR kinematics (DuEtAl2016). The inferred kinematics from velocity-resolved RM and dynamical modeling agree in a number of AGNs (e.g., VillafanaEtAl2022a).
| Parameter | Description | Bounds | Parameter | Description | Bounds |
|---|---|---|---|---|---|
| Mean radius of the BLR | Std. dev. of the distribution for non-elliptical orbits | ||||
| Shape parameter for the radial cloud distribution | Std. dev. of the distribution for non-elliptical orbits | ||||
| Inner radius of the BLR | Location of the center of the cloud velocity distribution in the plane | [0, 90] | |||
| I I footnotemark: Inclination angle of the system | [0, 90] | Std. dev. of the macroturbulent velocity distribution | |||
| II II footnotemark: Disk opening angle | [0, 90] | Instrumental line broadening | |||
| III III footnotemark: Near-side/Far-side preference parameter | [-0.5, 0.5] | Systematic line error | |||
| IV IV footnotemark: Disk outer face clustering parameter | Systematic continuum error | ||||
| V V footnotemark: Midplane transparency parameter | [0, 1] | Damped Random Walk (DRW) long-term variability amplitude | |||
| Mass of the SMBH | DRW timescale | ||||
| Fraction of clouds on elliptical orbits | [0, 1] | B | Linear trend slope | ||
| VI VI footnotemark: Inflow/Outflow parameter | [0, 1] | Response amplitude | |||
| Std. dev. of the distribution for elliptical orbits | Response power-law index | ||||
| Std. dev. of the distribution for elliptical orbits |
is face-on, is edge-on Larger suggests more clustering
is a disk, is a sphere is opaque, is transparent
is near-side, is far-side is inflow, is outflow