CSS161010: a luminous, fast blue optical transient with broad blueshifted hydrogen lines
Abstract
We present ultraviolet, optical and near-infrared photometric and optical spectroscopic observations of the luminous, fast blue optical transient (LFBOT), CSS161010:045834-081803 (CSS161010). The transient was found in a low-redshift () dwarf galaxy. The light curves of CSS161010 are characterized by an extremely fast evolution and blue colours. The band light curve shows that CSS161010 reaches an absolute peak of M mag in 3.8 days from the start of the outburst. After maximum, CSS161010 follows a power-law decline at all optical bands. These photometric properties are comparable to those of well-observed LFBOTs such as AT 2018cow, AT 2020mrf and AT 2020xnd. However, unlike these objects, the spectra of CSS161010 show a remarkable transformation from a blue and featureless continuum to spectra dominated by very broad, entirely blueshifted hydrogen emission lines of velocities of up to 10% of the speed of light. The persistent blueshifted emission and the lack of any emission at the rest wavelength of CSS161010 are a unique feature not seen in any transient before CSS161010. The combined observational properties of CSS161010 and its dwarf galaxy host favour the tidal disruption of a star by an intermediate-mass black hole as its origin.
1 Introduction
High cadence, wide-field sky surveys have revealed a significant number of new extra-galactic transients that show a large diversity in their spectral and photometric behaviour. Among the new types of objects, one group attracts attention due to their remarkably rapid evolution: the fast blue optical transients (FBOTs; Drout et al., 2014; Inserra, 2019; Pursiainen et al., 2018) or fast-evolving luminous transients (FELTs; Rest et al., 2018). FBOTs are characterised by rise times of days, peak absolute magnitudes of mag, and blue colours. Their hosts are generally found to be low-mass star-forming galaxies (Drout et al., 2014; Pursiainen et al., 2018). Due to their fast evolution, they are difficult to explain as supernova (SN) powered by the radioactive decay of 56Ni (Drout et al., 2014). Multiple different scenarios have been proposed to explain their properties, including shock breakout emission within a dense, surrounding wind or shell (e.g. Ofek et al., 2010; Drout et al., 2014; Rest et al., 2018), cooling envelope emission from the explosion of a star with a low-mass extended envelope with very little radioactive material (Drout et al., 2014), a common envelope jet (Soker et al., 2019; Soker, 2022), a tidal disruption event (TDE) caused by an intermediate-mass black hole (IMBH; Perley et al., 2019), and fallback accretion (Margutti et al., 2019).
Most FBOTs have been found in archival data from large imaging surveys, such as Pan-STARRS1 (PS1; Drout et al. 2014); the Palomar Transient Factory (PTF), the Supernova Legacy Survey (SNLS; Arcavi et al. 2016) and the Dark Energy Survey (DES; Pursiainen et al. 2018; Wiseman et al. 2020) as well as from observations by the Kepler space telescope (Rest et al., 2018). However, this picture is changing thanks to surveys that monitor the sky with a cadence of a few days (e.g. the All-Sky Automated Survey for SuperNovae – ASAS-SN, Shappee et al. 2014; the Asteroid Terrestrial-impact Last Alert System – ATLAS, Tonry et al. 2018; Smith et al. 2020; and the Zwicky Transient Facility – ZTF, Bellm et al. 2019; Graham et al. 2019) and new efforts focused on finding and characterising these events in almost real-time (e.g. Ho et al., 2021; Perley et al., 2021).
After the discovery of AT 2018cow (Prentice et al., 2018; Perley et al., 2019; Margutti et al., 2019; Ho et al., 2019; Chen et al., 2023; Inkenhaag et al., 2023), a new luminous subclass of FBOTs, now known as LFBOTs, was identified. This class includes AT 2018lug (ZTF18abvkwla Ho et al. 2020), CRTS-CSS161010 J045834-081803 (CSS161010 Coppejans et al. 2020, hereafter C20), AT 2020xnd (Perley et al., 2021; Ho et al., 2022; Bright et al., 2022), AT 2020mrf (Yao et al., 2022), AT 2022tsd (Matthews et al., 2023; Ho et al., 2023) and AT 2023fhn (Chrimes et al., 2024b, a). Most of these objects have been detected in the optical, radio, and X-rays. The only exception was AT 2018lug, which had no X-ray observations. Unlike in optical photometry, where all the objects follow a similar evolution, their behaviour is more diverse in the radio and X-rays: AT 2018lug is the most luminous of these events in the radio, while AT 2022tsd is the most luminous in the X-rays. Unfortunately, due to their fast evolution, multi-epoch spectral coverage in the optical has been obtained only for AT 2018cow. Therefore, despite extensive observations in different wavelengths, their nature is debated, and their origin is still unknown. However, recent observations of AT 2018cow at late epochs suggest that a central engine (Pasham et al., 2021) in the form of a black hole (BH) must be present (Inkenhaag et al., 2023), although it is unclear whether it is a stellar-mass BH or an intermediate-mass BH (IMBH; Migliori et al. 2024).
Although these LFBOTs were first detected, identified, and analysed in the optical, CSS161010 has only been characterised in the radio and X-rays (C20). We present the first ultraviolet (UV), optical and near-infrared (NIR) observations of CSS161010. The remarkable spectral and photometric coverage allows us to study its properties in detail. In particular, the detection of broad, entirely blueshifted hydrogen lines and the available information in the X-ray and radio (C20) may help us to provide important insights into these fast events.
The paper is organised as follows. A brief description of the observations is presented in Section 2. Section 3 characterises and discusses the nature of CSS161010. In Section 3.6, we discuss the origin of CSS161010, while our summary is given in Section 4. Throughout this work, we assume a flat CDM universe, with a Hubble constant of km s-1 Mpc-1, and .
2 Observations of CSS161010
CSS161010 ( , J2000) was discovered by the Catalina Real-Time Transient Survey (CRTS; Drake et al. 2009) on 2016 October 10 (JD = 2457671.98) at an unfiltered apparent magnitude of . An earlier detection was obtained by ASAS-SN (Shappee et al., 2014) on JD at an apparent V-band magnitude of mag. The last non-detection obtained by ASAS-SN was on 2016 October 6 (JD; detection limit of m mag). ATLAS obtained a deeper and latest non-detection on 2016 October 6 (JD; detection limit of m mag). We adopt the mid-point between ATLAS’s last non-detection and ASAS-SN’s first detection as the start of the outburst epoch, JD.
CSS161010 was spectroscopically observed on 2016 October 18 (Reynolds et al., 2016) and reported as a blue and nearly featureless object. We started our follow-up on this date ( days from the start of the outburst). A total of 12 epochs of optical spectroscopy were obtained from 9.4 to 106.0 days with five different instruments, while multi-wavelength photometric coverage was obtained between 1.72 and 77.91 days. The observations and data reduction details are presented in Appendix A.
3 Analysis of CSS161010
3.1 Galaxy
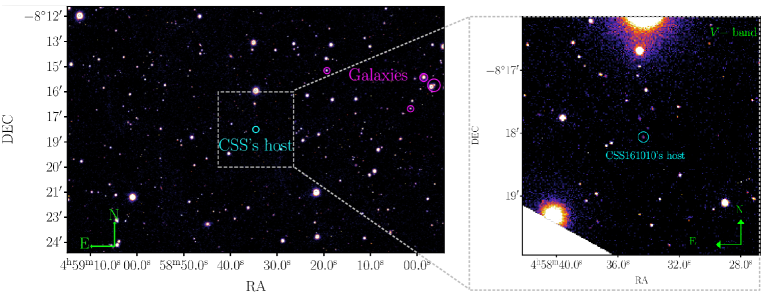
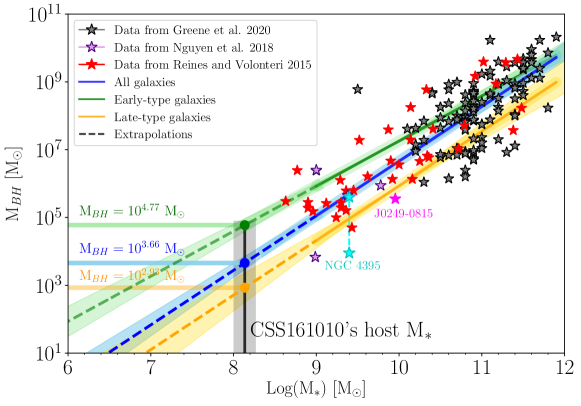
The host galaxy of CSS161010 is WISEA J045834.37-081804.4 (Figure 1), a dwarf galaxy () at (i.e., luminosity distance Mpc or a distance modulus of ). The redshift is derived from narrow emission lines visible in the transient spectra (H and [O III] 5007 Å). The optical spectrum of the host galaxy taken after the transient had faded below the detection threshold also confirmed this redshift (Appendix B). Galactic reddening in the direction of CSS161010 is mag (Schlafly & Finkbeiner, 2011). Based on the absence of Na i D absorption lines in the transient spectra and the low luminosity of the host galaxy, we assume that the host galaxy extinction towards CSS161010 is negligible. Using prospector (Johnson et al., 2021), we find that the host’s spectra and photometry are consistent with a stellar mass of log(MM⊙) (details are discussed in the Appendix B), higher than previously estimated by C20. This is mostly due to the -band photometry that further constrains the stellar mass. By extrapolating the BH mass – stellar mass correlations (Greene et al., 2020), the stellar mass of the host galaxy suggests the existence of a possible BH with a mass of – M⊙ (Figure 1), corresponding to an IMBH ( M⊙ M⊙; Greene et al. 2020).
3.2 Light curves and colours
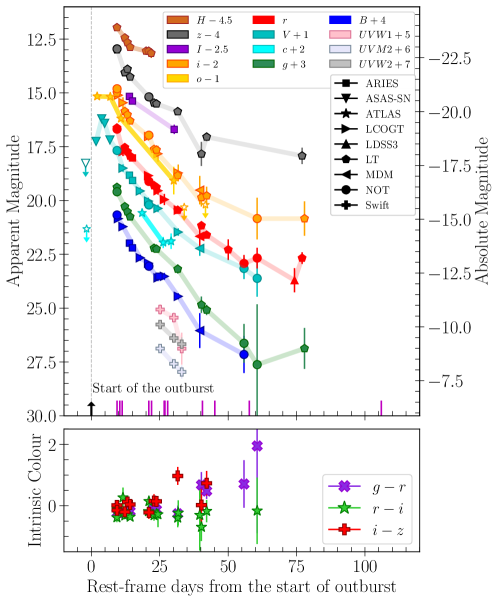
In Figure 2 we present the light curves of CSS161010. During the first six days after the start of the outburst, we obtained ASAS-SN V-band photometry, which allowed us to estimate a rise time of days and a peak absolute V-band magnitude of M mag. In days from the start of the outburst (2.5 days from the maximum), CSS161010 declines to half its peak flux. After the peak, it follows a power-law decline of at all optical bands. Overall, the transient shows an extremely fast evolution and blue colours. These properties resemble those found in well-observed LFBOTs like AT 2018cow (Prentice et al., 2018; Perley et al., 2019), AT 2020mrf (Yao et al., 2022) and AT 2020xnd (Perley et al., 2021; Ho et al., 2022).
The intrinsic colour curves of CSS161010 are presented in the bottom panel of Figure 2. Colour information is only available from days post-outburst. At this point, CSS161010 shows blue colours, which last for more days. From day 25 onwards, the and colours become bluer, while becomes redder, going from 0.14 mag at 23.8 days to 0.97 mag at 31.6 days. After this epoch, also becomes redder. During the full period of observations, the colour remains blue, with a quasi-constant evolution at around a mean value of mag. We obtained one epoch of imaging polarimetry at days from the start of the outburst; however, given the large uncertainties, we cannot confirm whether the source shows polarization.
We constructed the bolometric light curve and estimated the blackbody temperatures and radii for CSS161010 employing the superbol code (Nicholl, 2018). We used the extinction-corrected photometry. To have similar coverage in different bands at each epoch, we either interpolated or extrapolated the light curves using a low-order polynomial or obtained the magnitude from the nearest epochs using the V-band as a reference filter and assuming a constant colour. We then converted all magnitudes into fluxes at the effective wavelength of each filter and integrated them over the spectral energy distribution (SED). The flux outside the observed passbands was estimated by extrapolating the blackbody fit over all wavelengths.
We found that CSS161010 reached a peak luminosity of erg s-1 at days from the start of the outburst. After the peak, the bolometric light curve followed a power-law decline similar to that measured in the optical bands. Integrating over the observed epochs, we find a total radiated energy of erg. From to 60 days, the blackbody temperature () shows roughly constant evolution at around K, while the blackbody radius () mimics the light curve evolution: a fast rise to the peak, followed by a fast decline. It rises from R cm at days to cm at the peak. After that, the radius declines continuously until it reaches a value of cm at days (see Section 3.4).
3.3 Spectroscopic evolution
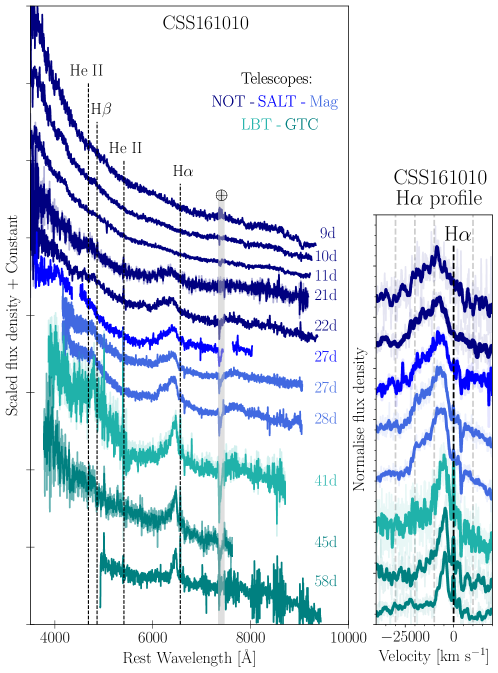
Figure 3 presents the optical spectroscopic evolution of CSS161010 from 9.4 to 57.7 days from the start of the outburst. The spectra show a remarkable transformation from a blue and featureless continuum to spectra dominated by very broad, blueshifted emission lines with peculiar shapes and extremely high velocities.
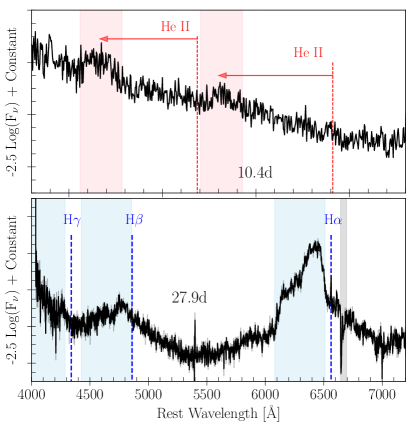
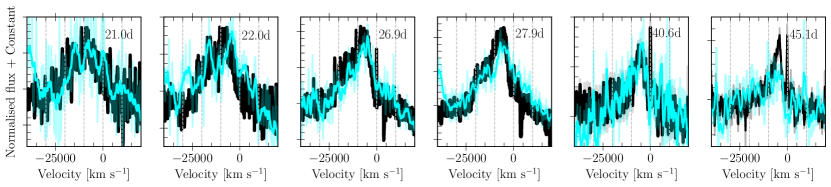
The first spectrum, at 9.4 days, is characterised by a featureless blue continuum with a blackbody temperature of around T K. One day later (10.4 days), the blackbody temperature decreased by K, and the spectrum started to show some features between 4000 and 5000 Å. After a detailed inspection, we found that these can be explained by He ii and emission lines at a velocity of km s-1 (top panel of Figure 4). These lines are also visible at 11.3 days, but they are no longer detectable at 21.0 days. From 21.0 days onwards, the spectra changed completely, and two broad emission features at Å and Å are now visible. These lines show an extraordinary evolution over time: they lack any absorption component, and their emission components evolve from a broad feature into a more complex, flat-topped profile with a blue shoulder (at days) and finally, after 40 days, into a feature with a narrower asymmetric shape. We identify these two broad emission features as H and H with blueshifted velocities between 10000 km s-1 at days and 4000 km s-1 at days (offset velocities from the rest wavelength at the broad line profile maxima). To verify this identification, we compare their profiles and evolution. Figure 5 shows this comparison from 21 to 45 days. Although the lower signal-to-noise in the blue part of the spectra prevents a detailed analysis of H, we find that both profiles evolve consistently, confirming our initial identification of these lines. We found that the Balmer decrement is until 28 days, and perhaps a little smaller at later epochs.
The highest velocities of H and H (the bluest parts of the profile) decrease from km s-1 at 21.0 days to km s-1 at 57.7 days (Appendix C, Figure C1), while the line centre always remains blueshifted by more than km s-1. The decreasing emission at the highest velocities is not unexpected since it reflects the disappearance of the fastest moving material; however, the persistent blueshifted emission and the lack of any emission at the rest wavelength (or redshifted from it) are striking. To our knowledge, this type of evolution has never been seen in any other transient.
3.4 Comparison to other LFBOTs
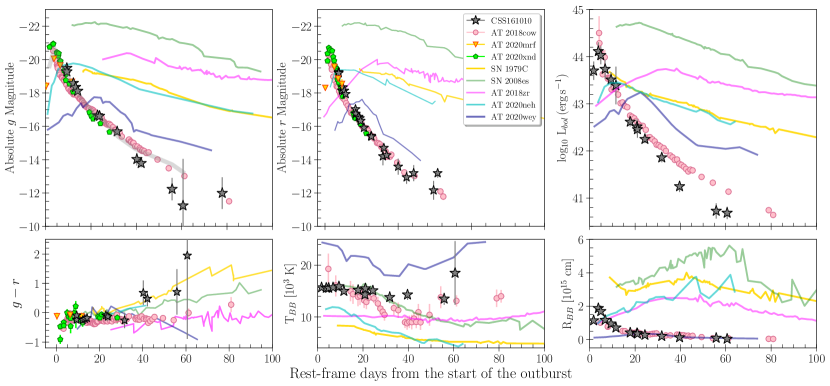
The fast photometric evolution of CSS161010 is reminiscent of other LFBOTs. Here, we compare our photometric and spectroscopic observations with those available for LFBOT objects. The best-observed cases are AT 2018cow, AT 2020mrf and AT 2020xnd. Information on these objects is presented in Table F1. In Figure 6, we show the and -band light curves, the bolometric light curve, colours, blackbody temperature and blackbody radius of CSS161010 together with those of LFBOTs. From the light curves, we can see that CSS161010 and AT 2020mrf have almost identical rise times of 3.8 and 3.7 days, respectively, whereas AT 2018cow has the fastest rise time of only 2.5 days. The rise time of AT 2020xnd is uncertain due to the poor constraints for its pre-peak light curve (Perley et al., 2021). However, it seems to rise between 2 and 5 days. At peak, the brightest object is AT 2020xnd (M mag), followed by AT 2018cow (M mag), CSS161010 (M mag) and AT 2020mrf (M mag). After the peak, they have similar decline rates and share similar blue colours up to days post-outburst, when a deviation toward redder colours is observed in CSS161010.
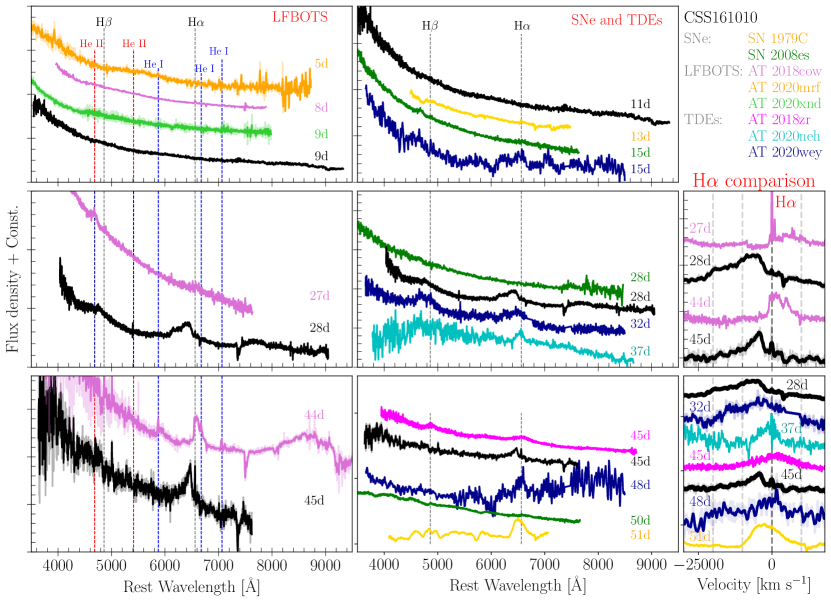
Figure 7 shows the spectra of CSS161010 at three different phases compared with these LFBOTs (left panels). Before 10 days after the start of the outburst, all spectra are characterised by a featureless blue continuum. After this phase, where we only have spectroscopic data for AT 2018cow and CSS161010, considerable differences appear. After days, the spectrum of CSS161010 shows broad blueshifted hydrogen emission profiles, while He i lines dominate the spectrum of AT 2018cow. Later, at days, the emission lines of both CSS161010 and AT 2018cow become narrower, more significantly so in the former.
3.5 Comparison to hydrogen-rich SNe and TDEs
One of the main characteristics of CSS161010 is the presence of hydrogen lines in its spectra. Based on this property, we compare CSS161010’s light curves and spectra with hydrogen-rich SNe (SNe II) and TDE candidates in Figures 6 and 7. We selected well-studied objects of each of these classes; these are SN 1979C (fast-declining SN II with a shallow H absorption feature; Panagia et al. 1980), SN 2008es (SLSN-II; Gezari et al. 2009) and three hydrogen-rich TDE candidates: AT 2018zr (Holoien et al., 2019; Charalampopoulos et al., 2022); AT 2020neh (Angus et al., 2022) and AT 2020wey (Charalampopoulos et al., 2023). Details of the comparison sample are presented in Table F1. From their photometric properties (Figure 6), we see that CSS161010 differs entirely from these hydrogen-rich events. The photometric evolution of hydrogen-rich SNe and TDE candidates is much slower, and their intrinsic colours are redder than those of CSS161010. They also have lower (except for AT 2020wey; Figure 6) and larger . Spectroscopically (Figure 3), in early phases, all objects are characterised by a featureless blue continuum, but they begin to differ as the lines appear. Although SN 1979C and CSS161010 both show H, their profiles are dissimilar. The H profile of SN 1979C is bell-shaped, with a slightly blueshifted peak emission ( km s-1). Blueshifted emission line peaks evolving to become rest frame-centred is a known property in SNe (Dessart & Hillier, 2005; Anderson et al., 2014). In the case of the SLSN-II SN 2008es, the H appears later (after days Gezari et al. 2009) and, during the comparison phases, shows different spectroscopic properties from CSS161010.
When comparing CSS161010 with TDE candidates, we see a large diversity. Unlike CSS161010, AT 2018zr and AT 2020neh have an H profile centred at the rest wavelength; AT 2018zr has a symmetric line profile, but AT 2020neh does not. Both objects lack absorption features. For AT 2020neh, blueshifted lines were detected at late phases ( days from the start of the outburst) and linked to optically thick outflowing material (Angus et al., 2022). Similar blueshifted profiles at very late times have been observed in SNe II and attributed to dust formation (e.g. SN 1998S, SN 2007od; Leonard et al. 2000; Andrews et al. 2010). Regardless of this, their line profiles are different from CSS161010. The spectral comparison with AT 2020wey is more interesting. At around 28-31 days, the spectra of CSS161010 and AT 2020wey appear similar. In particular, their H profiles are almost identical. The only difference is the missing redder part of the line profiles of CSS161010 (i.e. the entire profiles are blueshifted). However, later, at days, these two objects show very different spectra. TDEs often show blueshifted hydrogen line profiles with peculiar shapes (Roth & Kasen, 2018). This property is also observed in CSS161010, and from all the objects included in the comparison sample, the hydrogen-rich TDE AT 2020wey is the most similar, although it has a distinctly slower luminosity evolution and a much larger after days.
3.6 Discussion
Well-studied LFBOTs are found in dwarf star-forming galaxies (e.g. Coppejans et al., 2020; Wiseman et al., 2020; Ho et al., 2020), and thus have been considered to be likely associated with massive stars. We found that CSS161010’s host has very similar properties to AT 2020xnd’s host, they both have a small stellar mass (log(MM⊙) and 8.48) and a modest star formation rate (SFR(M⊙/yr) and 0.020, respectively). However, for AT 2020xnd, Perley et al. (2021) did not favour any specific scenario.
3.6.1 Stellar explosion scenario
C20 found that CSS161010’s X-ray and radio observations alone can be explained equally well by a stellar explosion or a TDE. Based on our optical observations, we find a stellar explosion to be unlikely. The presence of entirely blueshifted emission line profiles throughout the evolution cannot be explained in any SN scenario. The evolution is also inconsistent with the homologous expansion expected in any SN (Liu et al., 2018). Furthermore, the radioactively powered SN mechanism is unrealistic. Assuming that CSS161010 arises from a stellar explosion where all the energy is from radioactive decay, we can estimate the ejecta mass and the amount of 56Ni synthesized during the explosion by fitting the Arnett model (Arnett, 1982). Thus, considering a rise time (3.8 days), a canonical SN kinetic energy ( erg), an opacity of cm-2 g-1 and (see, Prentice et al., 2016), we derive an ejecta mass, M M⊙. Since 56Ni powers the main peak, and using the rise time and the peak luminosity of the bolometric light curve, we estimate a 56Ni mass of M⊙. The small Mej explains the fast rise, while the large amount of 56Ni explains the peak luminosity. Given that is much larger than the Mej, this scenario would be unphysical. Additionally, considering that the spectra show prominent hydrogen lines, the Mej must also contain some hydrogen, making this inconsistency even greater.
Recent studies (e.g. Fox & Smith, 2019; Xiang et al., 2021; Pellegrino et al., 2022) have found similarities between LFBOTs and Type Ibn SNe and suggest that these fast-evolving objects can be explained by the ejecta interacting with helium-rich circumstellar material (CSM). Xiang et al. (2021) found that the bolometric light curve of AT 2018cow can be fitted by a hybrid model that includes 56Ni and the interaction of the SN ejecta with a dense CSM. The spectra of AT 2018cow were argued to support this alternative scenario because they are dominated by narrow helium emission lines (Fox & Smith, 2019; Pellegrino et al., 2022). AT 2018cow and CSS161010 have similar light curves (Figure 6), so we might expect also CSS161010 to have a comparable powering mechanism (56Ni plus CSM). However, unlike AT 2018cow, the spectra of CSS161010 are dominated by very broad and entirely blueshifted hydrogen features. In CSS161010, we only detect narrow lines at late phases, and those lines are associated with the host galaxy. Therefore, the spectral properties of CSS161010 exclude this scenario.
3.6.2 Wolf-Rayet/Black Hole Mergers
The Wolf-Rayet star/black hole (or neutron star) merger scenario recently proposed for AT 2018cow (Metzger, 2022) seems problematic for CSS161010 because of the strong, blueshifted hydrogen lines. While the scenario allows the presence of hydrogen in a pre-SN disk-like structure, the orbital velocity of this disk is at least an order of magnitude slower than the observed . Acceleration by an outflow from the central engine would be needed, combined with rapid cooling of the shocked gas to allow for efficient Balmer line emission. The situation could be similar to that of a cool, dense shell in SNe interacting with a dense surrounding media (e.g., Chevalier & Fransson, 1994). The shocked disk would have a density of cm-3 ( is the temperature of the shocked gas) to have a cooling time of days (cf. Fransson et al., 1996). The gas cools under compression so that H-emitting gas would be orders of magnitude denser. Under these circumstances, Balmer decrements of are not unusual (e.g., Taddia et al., 2020) in contrast to the case B ratio of we observe. It is also unclear why the merger scenario should result in strong blueshifts.
The Case B H emission per cm-3 is (Osterbrock & Ferland, 2006), and if is the volume of the gas emitting H, then the H luminosity is . Here is the gas temperature in K, is the filling factor of the emitting gas, and and are the electron and proton number densities, respectively. For a helium-to-hydrogen number density ratio of 0.1 and fully ionized hydrogen, the mass of this volume is , or M⊙, where is in units of cm-3 and in erg s-1. For an ejected mass of 0.1 M⊙ and a temperature of K, this means that . We measured when H was first detected on day 21, and peaking at one week later, translating into , and , respectively.
The Case B recombination time of hydrogen is , where cm-3 s-1 (Osterbrock & Ferland, 2006), is less than one day for . This implies a steady state between ionisation and recombination, potentially with a time lag. If is the number of ionising photons per second in units of put out by the central source, and is the solid angle subtended by the H-emitting region as seen by the central source, . Here we have assumed that the total Case B recombination rate in the H-emitting region is . If we use from 21 and 28 days, then the corresponding values for are and , respectively. This is in stark contrast to what is expected from black-body spectra with the properties in Figure 6. At 21 (28) days black bodies only generate . A possible solution is that there is a week delay between the emitted ionising radiation and H emission due to geometry and light travel time, so that the number of ionising photons reaching the H cloud on day 28 may correspond to an epoch close to the peak of the bolometric luminosity in Figure 6. The luminosity is then some times higher than on day 28, and times larger (for a black-body spectrum). A 3-week delay between continuum and H emission geometrically would mean that the distance between the H-emitting regions and the central source is cm. Similar arguments for light-travel time effects in TDEs are discussed by Charalampopoulos et al. (2022). A problem with this interpretation is that is expected to be much less than unity for such a distance, and that we do see He ii lines much earlier than H.
It is, therefore, likely that a pure black-body spectrum from a central source cannot produce enough ionising radiation. One obvious candidate for the ’extra’ ionising radiation is the X-ray emission observed by C20, which for their assumed spectrum with energy distribution had a luminosity of erg s-1 between 0.3-10 keV months after optical peak. Extrapolating to lower energies, this would mean a rate of the number of ionising photons from the X-ray source that is . If the process is similar to that in active galactic nuclei (AGN; i.e., inverse Compton scattering), the number of ionising photons from the X-ray source is roughly proportional to the optical/UV luminosity. This could mean close to the optical peak, which would still only account for of the total number of black-body photons. Interestingly, the X-ray properties for AT 2018cow derived by Margutti et al. (2019) indicate that it had around 10 days. There should thus be sufficient X-ray emission to ionise the line-emitting gas.
A picture emerges where the fastest line-emitting gas expands with a speed of , and that it is, like in AGN, ionised mainly by the X-ray emission. After 11 (28) days when weak He ii lines are first seen (and when H is the strongest) this gas has reached cm. Light travel time can only account for a few days of delay if the ionising source is central. We find it more likely that the X-rays are produced over a larger volume, possibly in a jet-like structure as expected in TDEs (see, e.g., Charalampopoulos et al., 2022). The extent of the X-ray emitting region can be estimated from the expansion of the mildly relativistic blast wave in the models of C20 for the same epochs, which are cm. This picture seems incompatible with the Wolf-Rayet star/compact object merger scenario. However, it is consistent with a TDE where time-lags between the broadband light curves and the fluxes of broad emission lines have been observed, with shorter lags for, e.g., He i than H (see, e.g. Charalampopoulos et al., 2022; Faris et al., 2024).
3.6.3 TDE from an IMBH scenario
For a number of reasons, we find that a TDE appears to be the least problematic explanation for the spectroscopic and photometric properties of CSS161010, and also fits with the arguments about H and light-travel times above.
The entirely blueshifted line profiles of CSS161010 at all epochs can be explained as a result of outflows occurring in TDEs as previously seen in X-rays (Kara et al., 2016) but also in blueshifted UV/optical emission/absorption lines (Hung et al., 2019; Nicholl et al., 2020). In fact, Coppejans et al. (2020) concluded that CSS161010 has a mildly relativistic, decelerating outflow with an initial velocity of , that decreases to after one year. Some TDEs are known to launch a relativistic jet, e.g., the well-observed case Swift J164449.3+573451 (Burrows et al., 2011). In the case of Arp 299-B AT1, interpreted as a TDE, VLBI observations revealed an expanding and decelerating radio jet with an average intrinsic speed of 0.22c (Mattila et al., 2018), which is quite similar to the outflow speed estimated for CSS161010 at the late times.
Furthermore, the peak bolometric luminosity of CSS161010, L erg s-1, implies a super-Eddington accretion phase (for a BH mass of – M⊙, the Eddington luminosity is L erg s-1) and, therefore, strong outflows are expected (Shakura & Sunyaev, 1973; Lipunova, 1999). In the case of a TDE produced by an IMBH, we expect these outflows to be much stronger and persist longer than for a supermassive BH because the super Eddington mass fallback to the BH is predicted to persist for extended periods (Wu et al., 2018). Moreover, the lack of any absorption component in the optical lines can also be interpreted as a result of an outflow (Roth & Kasen, 2018). The disappearance of the bluest part (highest velocity) of the H profile may also be explained as the result of an outflow that expands with time (Roth & Kasen, 2018).
The continuous decay of after only days from the start of the outburst can be described within the framework of TDEs (Liu et al., 2018). Here, the of CSS161010 is within the typical values found for TDEs (Holoien et al. 2019; Charalampopoulos et al. 2022, 2023; cm). Moreover, the fast light curve decline rates could be explained as a partial TDE, in which a stellar remnant survives the interaction. Simulations have shown that the mass fallback rate to the BH in a partial TDE differs substantially from a t-5/3 power law expected for a total tidal disruption (Rees, 1984), and decays with a steep power law of anywhere from t-2 to t-5 (Coughlin & Nixon, 2019; Ryu et al., 2020). Hydrodynamic simulations (Kıroğlu et al., 2023) of a close encounter between a 1 M⊙ main-sequence star and a M⊙ IMBH found that a small amount of material is stripped from the star at each pericentre passage with a period of a few yr for a M⊙ BH. The star is eventually fully disrupted or ejected. The simulations predict highly super-Eddington accretion rates and brief flares with peak luminosities between erg s-1 and erg s-1 for BH masses in the range M⊙. These predicted peak luminosities are similar to that observed for CSS161010, providing additional support for this scenario.
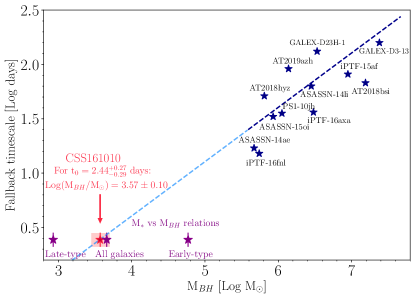
The fallback timescale (t) measured from the TDE’s light curve can provide an independent BH mass estimate (Blagorodnova et al., 2017; van Velzen et al., 2020; Mummery et al., 2023). This fallback timescale has been estimated for a sample of TDEs by fitting a power-law decay (L) to their bolometric light curves with the power-law index fixed, . As the characteristic decay time (t0) is comparable to the theoretical t (van Velzen et al., 2019), it is possible to derive the BH mass. Fitting the bolometric light curve of CSS161010, we found t days (Appendix D1), which implies a BH mass of M⊙ (Figure 8) consistent with our estimates based on the host galaxy’s stellar mass; this corroborates CSS161010 as a TDE candidate with one of the lowest BH mass to date.
Most low-redshift IMBH candidates have been found in low-mass, star-forming dwarf galaxies (Mezcua et al., 2016) through kinematic studies or by extrapolating the scaling relations between the BH properties and galaxy parameters. Observations of AGN, gravitational-wave signals, and TDEs have provided further evidence for their existence (Donato et al., 2014; Mezcua, 2017; Lin et al., 2018; Greene et al., 2020; Abbott et al., 2020; He et al., 2021; Wen et al., 2021; Angus et al., 2022). Although an IMBH is not expected to exist in every dwarf galaxy, simulations (Bellovary et al., 2019) indicate that the BH occupation fraction rapidly increases in galaxies with stellar masses above M⊙, with roughly 60% of M⊙ galaxies hosting an IMBH. For CSS161010, we measured an offset of (a projected distance of 300 pc; Appendix E) from the host galaxy’s centre. Although super-massive BHs are located at the centres of their host galaxies, IMBHs in dwarf galaxies are not all expected to coincide with the galaxy nucleus (Lin et al., 2018). In fact, recent simulations (Bellovary et al., 2019) indicate that half of the IMBHs in dwarf galaxies are more than 400 pc from the centres. BH growth in low-mass galaxies is expected to be stunted by SN feedback (Habouzit et al., 2017), so dwarf galaxies in the local Universe that have evolved in isolation can host BHs with masses comparable to the seed BHs in the early Universe.
4 Summary
We presented photometric and spectroscopic observations of CSS161010. We found that the light curves of CSS161010 are characterized by an extremely fast evolution and blue colours. CSS161010 reaches an absolute peak of M mag in 3.8 days from the start of the outburst. After-maximum, CSS161010 follows a power-law decline at all optical bands. These photometric properties are comparable to those shown by well-observed LFBOTs. However, unlike these objects, the spectra of CSS161010 are dominated by very broad blueshifted hydrogen emission lines starting at days from the start of the outburst. Our analysis shows any stellar explosion scenario to be unlikely and that CSS161010 is most naturally explained as a hydrogen-rich star (partially) disrupted by an IMBH. Multiwavelength observations of other LFBOTs (Pasham et al., 2021; Zhang et al., 2022; Inkenhaag et al., 2023; Chen et al., 2023; Ho et al., 2023) provide strong evidence favouring a central engine. Although the nature of the engine is unknown, a TDE by an IMBH is a plausible scenario in several cases (Inkenhaag et al., 2023; Ho et al., 2023). In fact, we argue that from a spectroscopic point of view, CSS161010 provides the most convincing case to date. If other LFBOTs, in addition to CSS161010 and AT 2018cow, can be explained as a TDE by an IMBH, further observations of such events could be used for pinpointing otherwise quiescent IMBHs, constraining their masses, occupation fractions, host galaxy properties and galactocentric distances.
acknowledgments
We thank Keiichi Maeda, Masaomi Tanaka, Hanindyo Kuncarayakti, Takashi Nagao and Taeho Ryu for valuable discussions; Anna Ho and Daniel Perley for discussing the physical properties of LFBOTs during the Interacting Supernovae MIAPbP meeting; Sjoert Van Velzen for sharing the data to reproduce Figure 8.
C.P.G., S.M., L.D. thanks the Munich Institute for Astro-, Particle and BioPhysics (MIAPbP), which is funded by the Deutsche Forschungsgemeinschaft (DFG, German Research Foundation) under Germany´s Excellence Strategy – EXC-2094 – 390783311, for the useful discussions.
C.P.G. acknowledges financial support from the Secretary of Universities and Research (Government of Catalonia) and by the Horizon 2020 Research and Innovation Programme of the European Union under the Marie Skłodowska-Curie and the Beatriu de Pinós 2021 BP 00168 programme, from the Spanish Ministerio de Ciencia e Innovación (MCIN) and the Agencia Estatal de Investigación (AEI) 10.13039/501100011033 under the PID2020-115253GA-I00 HOSTFLOWS project, and the program Unidad de Excelencia María de Maeztu CEX2020-001058-M. S.M. acknowledges financial support from the Research Council of Finland project 350458. P.L. acknowledges support from the Swedish Research Council. S.G.G. acknowledges support by FCT under Project No. UIDB/00099/2020. P.G.J. has received funding from the European Research Council (ERC) under the European Union’s Horizon 2020 research and innovation programme (Grant agreement No. 101095973). S.D. acknowledges the National Natural Science Foundation of China (Grant No. 12133005) and the New Cornerstone Science Foundation through the XPLORER PRIZE. N.E.R. acknowledges partial support from MIUR, PRIN 2017 (grant 20179ZF5KS). N.E.R, A.P., S.B. acknowledge the PRIN-INAF 2022 grant ”Shedding light on the nature of gap transients: from the observations to the models”. C.S.K. is supported by NSF grants AST-1908570 and AST-2307385. M.F. is supported by a Royal Society - Science Foundation Ireland University Research Fellowship. R.K. acknowledges support via the Research Council of Finland (grant 340613). M.D.S. is funded by the Independent Research Fund Denmark (IRFD, grant number 10.46540/2032-00022B). L.W. and M.G. acknowledge funding from the European Union’s Horizon 2020 research and innovation programme under grant agreement No. 101004719 (OPTICON-RadioNET Pilot, ORP). L.W., M.G. and A.H. acknowledge support from the Polish National Science Centre (NCN) grant No 2015/17/B/ST9/03167 (OPUS) to L.W., and the Polish participation in SALT is funded by grant No. MNiSW DIR/WK/2016/07.
J.M. has the support of the National Key R&D Program of China (2023YFE0101200), the National Natural Science Foundation of China (NSFC 12393813), CSST grant CMS-CSST-2021-A06, and the Yunnan Revitalization Talent Support Program (YunLing Scholar Project). E.R.C. acknowledges support from the National Research Foundation of South Africa.
Based on observations made with the Nordic Optical Telescope, owned in collaboration by the University of Turku and Aarhus University, and operated jointly by Aarhus University, the University of Turku and the University of Oslo, representing Denmark, Finland and Norway, the University of Iceland and Stockholm University at the Observatorio del Roque de los Muchachos, La Palma, Spain, of the Instituto de Astrofisica de Canarias.
Observations from the NOT were obtained through the NUTS collaboration, which are supported in part by the Instrument Centre for Danish Astrophysics (IDA). The data presented here were obtained in part with ALFOSC, which is provided by the Instituto de Astrofisica de Andalucia (IAA) under a joint agreement with the University of Copenhagen and NOTSA.
Based on observations made with the GTC telescope in the Spanish Observatorio del Roque de los Muchachos of the Instituto de Astrofísica de Canarias.
This work is based on observations made with the Large Binocular Telescope. The LBT is an international collaboration among institutions in the United States, Italy and Germany. LBT Corporation partners are: The University of Arizona on behalf of the Arizona Board of Regents; Istituto Nazionale di Astrofisica, Italy; LBT Beteiligungsgesellschaft, Germany, representing the Max-Planck Society, The Leibniz Institute for Astrophysics Potsdam, and Heidelberg University; The Ohio State University, representing OSU, University of Notre Dame, University of Minnesota and University of Virginia.
Some of the observations reported in this paper were obtained with the Southern African Large Telescope (SALT), as part of the Large Science Programme on transients 2016-2-LSP-001 (PI: Buckley).
This work has made use of data from the Asteroid Terrestrial-impact Last Alert System (ATLAS) project. The Asteroid Terrestrial-impact Last Alert System (ATLAS) project is primarily funded to search for near-earth asteroids through NASA grants NN12AR55G, 80NSSC18K0284, and 80NSSC18K1575; byproducts of the NEO search include images and catalogs from the survey area. This work was partially funded by Kepler/K2 grant J1944/80NSSC19K0112 and HST GO-15889, and STFC grants ST/T000198/1 and ST/S006109/1. The ATLAS science products have been made possible through the contributions of the University of Hawaii Institute for Astronomy, the Queen’s University Belfast, the Space Telescope Science Institute, the South African Astronomical Observatory, and The Millennium Institute of Astrophysics (MAS), Chile.
The Liverpool Telescope is operated on the island of La Palma by Liverpool John Moores University in the Spanish Observatorio del Roque de los Muchachos of the Instituto de Astrofisica de Canarias with financial support from the UK Science and Technology Facilities Council. This work makes use of data from the Las Cumbres Observatory network.
This research uses data obtained through the Telescope Access Program (TAP), which has been funded by the TAP member institutes. We thank the former Swift PI, late Neil Gehrels, the Observation Duty Scientists, and the science planners for approving and executing our Swift/UVOT program.
This publication makes use of data products from the Wide-field Infrared Survey Explorer, which is a joint project of the University of California, Los Angeles, and the Jet Propulsion Laboratory/California Institute of Technology, funded by the National Aeronautics and Space Administration. This publication also makes use of data products from NEOWISE, which is a project of the Jet Propulsion Laboratory/California Institute of Technology, funded by the Planetary Science Division of the National Aeronautics and Space Administration.
We thank Las Cumbres Observatory and its staff for their continued support of ASAS-SN. ASAS-SN is funded in part by the Gordon and Betty Moore Foundation through grants GBMF5490 and GBMF10501 to the Ohio State University, and also funded in part by the Alfred P. Sloan Foundation grant G-2021-14192.
Appendix A Observations of CSS161010
A.1 Photometry
Multi-wavelength photometric coverage of CSS161010 was acquired between 2016 October 10 and 2016 December 27. During the first nine days, three epochs of photometry were obtained by ASAS-SN; after this, optical imaging data were obtained with the 2-m Liverpool Telescope (LT) using the IO:O imager, the 2.56-m Nordic Optical Telescope (NOT) using the Alhambra Faint Object Spectrograph and Camera (ALFOSC) at the Roque de Los Muchachos Observatory (Spain), the 1.0-m telescopes of Las Cumbres Observatory Global Telescope Network (LCOGT; Brown et al. 2013), the 2.4m Hiltner telescope at the Michigan-Dartmouth-MIT (MDM) Observatory, the 1.04m Sampurnanad Telescope in the Aryabhatta Research Institute of observational sciencES (ARIES), the 1.3-m Devasthal Fast Optical (DFOT; Sagar et al. 2012) telescope at Nainital (India) and the imaging modes of the Low Dispersion Survey Spectrograph (LDSS-3) and Inamori Magellan Areal Camera and Spectrograph (IMACS) mounted on the 6.5-m Magellan telescopes. Additionally, seven epochs of near-infrared (NIR) photometry were obtained with the LT using the IO:I imager, while three epochs of UltraViolet (UV) Optical observations were obtained with the UltraViolet/Optical Telescope (UVOT) on board the Swift spacecraft. There were no X-ray detections associated with these Swift observations. All NOT observations were obtained through the NOT Unbiased Transient Survey (NUTS111https://nuts.sn.ie) allocated time.
All images were reduced using standard procedures, including bias removal and flat field correction. For the NIR images, the reductions also included sky subtraction. We used the photometric pipeline PmPyeasy (Chen et al., 2022) to obtain the optical and NIR photometry. We followed the photometry procedures outlined in Chen et al. (2022), which primarily include the following three steps: image registration and source detection, measuring instrumental magnitudes with arbitrary zero points, and deriving photometric zero points to put the magnitudes into standard magnitude systems. We performed aperture photometry for all the images using a 50 radius circular aperture. We used a relatively large aperture to include the flux of both the transient and the underlying host galaxy of CSS161010. We used the Pan-STARRS1 DR1 MeanObject database (Flewelling et al., 2020) for the optical-band photometric calibration. The final magnitudes are in the Vega system, and -band magnitudes are in AB magnitudes. We used the 2MASS (Skrutskie et al., 2006) photometric catalogue for the NIR photometric calibration. The NIR magnitudes are in the Vega system. The host galaxy flux was subtracted to get the transient brightness. We used galaxy images obtained with the 6.5-m Magellan telescopes (LDSS-3 and IMACS) on 20170721 and 20170919 to estimate the host galaxy flux.
We used the HEAsoft222https://heasarc.gsfc.nasa.gov/docs/software/heasoft/ v. 6.29c. toolset for Swift UVOT photometry. We first summed the exposures for each epoch using the task uvotimsum, and then we extracted source counts from a 50 radius region centred on CSS161010 using task uvotsource. The source counts were converted into the AB magnitude system based on the most recent UVOT calibrations (Breeveld et al., 2011). The galaxy flux was subtracted to get the Swift UVOT photometry. Optical, UVOT and NIR photometry are presented in Tables A1, A2, A3 and A4.
Photometry in the orange () and cyan () filters (blue and red filters that cover a wavelength range between 4200 and 6500 Å and from 5600 to 8200 Å, respectively) was obtained by the twin 0.5 m Asteroid Terrestrial-impact Last Alert System (ATLAS Tonry et al. 2018; Smith et al. 2020) and through the ATLAS forced photometry server333https://fallingstar-data.com/forcedphot/. Tabe A5 lists the mean magnitudes.
The host galaxy of CSS161010 was also imaged by the Wide-field Infrared Survey Explorer (WISE) in multiple epochs before and after its discovery.
We also obtained two epochs of NIR imaging with NOTCam at the NOT on 2017 February 6 (in ) and 2017 February 19 (in ). These images were reduced using standard NIR reduction techniques in the NOTCam package444https://www.not.iac.es/instruments/notcam/guide/observe.html in iraf. We searched for IR emission from the transient using the NIR images obtained on 2018 November 15 (C20). After alignment and subtraction (Alard & Lupton, 1998; Alard, 2000) between the 2017 and 2018 images, we found no trace of emission from the transient. A bright NIR source near the position of CSS161010 was detected in the NOTCam images, which is the same source as reported in 2020 (C20). It does not show any significant variability between the two observations.
The bright NIR source is also detected in the Wide-field Infrared Survey Explorer (WISE) satellite in the W1 and W2 bands at 3.6 and 4.4, respectively (C20). We queried the unTimely catalogue (Meisner et al., 2023), a time-domain catalogue of WISE detections derived from the unWISE co-added images (Meisner et al., 2018), in order to search for any variability in the source that could indicate transient flux associated with CSS161010. The mean date of the images obtained by the WISE satellite in the first visit after the first ASAS-SN detection of CSS161010 was on 2017 February 17 (JD=2457801.93; phase = 130d). The mean W1 Vega magnitude of all the 16 individual detections from 2010 to 2020 in the unTimely catalogue is 16.73, with a dispersion of 0.09 mag. The W1 magnitude of the source in the 2017 February visit is 16.60.1 mag, consistent with no variability. The W2 detection of the source is marginal, and it is not detected in most of the individual unWISE co-adds, notably in the 2017 February visit. Finally, we performed image subtraction between the unWISE W1 images immediately before and after the transient using the same methods as above and found no residual that would indicate transient flux.
A.2 Imaging polarimetry
Observations of CSS161010 were made on 2016 December 2, during the commissioning of the imaging polarimetric mode of the Robert Stobie Spectrograph (RSS; Burgh et al. 2003) at the South African Large Telescope (SALT; Buckley et al. 2006). Observations were made using the PI06645 filter to minimise the polarising beamsplitter’s spectral dispersion property. Four exposures were obtained with the corresponding half-wave plate in positions 0, 45, 22.5 and 67.5 degrees. Each exposure produced both the and beam on the detector, each HWP with a field of view of arc minutes. Bias subtraction proceeded in the usual fashion using the standard SALT data reduction tools and flat fielding. The polarized and unpolarized standard stars Vela1 95 and WD 0310-688 were observed during the same month with the same filter to set the HWP’s zero-point and to measure any instrumental polarization. Aperture photometry was performed on all the sufficiently bright point sources in the science and images, and the corresponding linear polarization was calculated from the extracted fluxes.
A.3 Spectroscopy
CSS161010 was observed spectroscopically at 12 epochs spanning phases between 9.4 and 106.0 days from the start of the outburst. The observations were carried out with five different instruments: ALFOSC at the NOT, MODS (Pogge et al., 2010) mounted on the twin 8.4-m Large Binocular Telescope (LBT) at Mount Graham International Observatory (AZ, USA), RSS at the SALT, IMACS on the 6.5-m Magellan telescope, and Optical System for Imaging and low-Intermediate-Resolution Integrated Spectroscopy (OSIRIS) at the 10.4-m Gran Telescopio Canarias (GTC). The log of spectroscopic observations of CSS161010 is presented in Table A6.
The spectra were reduced using standard iraf routines (bias subtraction, flat-field correction, 1D extraction, and wavelength calibration) and custom pipelines (e.g. PySALT, foscgui555https://sngroup.oapd.inaf.it). The flux calibration was performed using spectra of standard stars obtained during the same night. All spectra will be available via the WISeREP666https://www.wiserep.org/ repository (Yaron & Gal-Yam, 2012). All data will be available on Zenodo (https://zenodo.org/communities/sndata).
| UT date | JD | Phase | Telescope/Instrument‡ | |||||||
| (days)∗ | (mag) | (mag) | (mag) | (mag) | (mag) | (mag) | ||||
| 20161006 | 2457667.78 | ASAS-SN | ||||||||
| 20161010 | 2457671.70 | 1.72 | ASAS-SN | |||||||
| 20161012 | 2457673.85 | 3.80 | ASAS-SN | |||||||
| 20161013 | 2457674.95 | 4.87 | ASAS-SN | |||||||
| 20161015 | 2457676.94 | 6.79 | ASAS-SN | |||||||
| 20161018 | 2457679.59 | 9.36 | LT/IO:O | |||||||
| 20161018 | 2457679.63 | 9.39 | NOT/ALFOSC | |||||||
| 20161018 | 2457680.11 | 9.86 | LCOGT | |||||||
| 20161020 | 2457681.87 | 11.56 | LCOGT | |||||||
| 20161021 | 2457682.57 | 12.24 | LT/IO:O | |||||||
| 20161022 | 2457683.57 | 13.21 | LT/IO:O | |||||||
| 20161023 | 2457684.57 | 14.17 | LT/IO:O | |||||||
| 20161026 | 2457688.39 | 17.87 | LCOGT | |||||||
| 20161029 | 2457691.49 | 20.87 | LCOGT | |||||||
| 20161030 | 2457691.67 | 21.04 | NOT/ALFOSC | |||||||
| 20161101 | 2457693.61 | 22.92 | LT/IO:O | |||||||
| 20161102 | 2457694.52 | 23.80 | LT/IO:O | |||||||
| 20161102 | 2457695.08 | 24.34 | LCOGT | |||||||
| 20161105 | 2457697.50 | 26.68 | LCOGT | |||||||
| 20161110 | 2457702.55 | 31.57 | LT/IO:O | |||||||
| 20161110 | 2457702.76 | 31.77 | LCOGT | |||||||
| 20161118 | 2457710.88 | 39.63 | MDM | |||||||
| 20161119 | 2457711.51 | 40.24 | LT/IO:O | |||||||
| 20161120 | 2457713.49 | 42.15 | LT/IO:O | |||||||
| 20161129 | 2457721.64 | 50.04 | LT/IO:O | |||||||
| 20161205 | 2457727.59 | 55.80 | NOT/ALFOSC | |||||||
| 20161210 | 2457732.57 | 60.61 | NOT/ALFOSC | |||||||
| 20161224 | 2457746.67 | 74.26 | Mag/LDSS-3 | |||||||
| 20161227 | 2457749.53 | 77.02 | LT/IO:O | |||||||
| 20161227 | 2457750.45 | 77.91 | LT/IO:O | |||||||
| Host | ||||||||||
| 20170721 | 2457955.91 | 276.69 | Mag/LDSS-3 | |||||||
| 20170919 | 2457984.87 | 304.71 | Mag/IMACS | |||||||
| 20170922 | 2458018.65 | 337.39 | NOT/ALFOSC | |||||||
-
Notes:
⋆ All reported magnitudes are host-subtracted.
∗ Rest-frame phase in days from the start of the outburst, JD .
‡ Telescope code: LCOGT: Las Cumbres Observatory Global Network; LT: 2.0-m Liverpool Telescope; Mag/IMACS: Inamori Magellan Areal Camera and Spectrograph on Magellan; Mag/LDSS-3: The Low Dispersion Survey Spectrograph on Magellan; MDM: Hiltner 2.4m Telescope in the MDM observatory; NOT/ALFOSC: Alhambra Faint Object Spectrograph and Camera on the Nordic Optical Telescope (NOT).
photometry is in the Vega system; photometry is in the AB system.
| UT date | JD | Phase | ||||
|---|---|---|---|---|---|---|
| (days)∗ | (mag) | (mag) | (mag) | (mag) | ||
| 20161022 | 2457684.29 | 13.90 | ||||
| 20161023 | 2457685.43 | 15.00 | ||||
| 20161102 | 2457695.48 | 24.73 | – | – | ||
| 20161108 | 2457701.22 | 30.28 |
-
Notes:
-
∗ Rest-frame phase in days from the start of the outburst, JD =
| UT date | JD | Phase | UVW1 | UVM2 | UVW2 |
|---|---|---|---|---|---|
| (days)∗ | (mag) | (mag) | (mag) | ||
| 20161103 | 2457695.90 | 25.14 | |||
| 20161108 | 2457701.10 | 30.17 | |||
| 20161111 | 2457704.09 | 33.06 |
-
Notes:
-
⋆ All reported magnitudes are host-subtracted.
-
∗ Rest-frame phase in days from the start of the outburst, JD = .
| UT date | JD | Phase | Magnitude |
|---|---|---|---|
| (days)∗ | (mag) | ||
| 20161018 | 2457679.60 | 9.37 | |
| 20161021 | 2457682.58 | 12.24 | |
| 20161022 | 2457683.57 | 13.21 | |
| 20161023 | 2457684.57 | 14.17 | |
| 20161029 | 2457690.61 | 20.02 | |
| 20161030 | 2457691.59 | 20.97 | |
| 20161031 | 2457692.55 | 21.89 |
-
Notes: Rest-frame phase in days from the start of the outburst, JD .
| UT date | JD | Phase | Band | Magnitude |
|---|---|---|---|---|
| (days)∗ | (mag) | |||
| 20161006 | 2457668.14 | |||
| 20161010 | 2457672.12 | 2.13 | ||
| 20161015 | 2457677.08 | 6.93 | ||
| 20161018 | 2457681.11 | 10.82 | ||
| 20161027 | 2457689.10 | 18.56 | ||
| 20161104 | 2457697.08 | 26.28 | ||
| 20161107 | 2457700.05 | 29.15 | ||
| 20161108 | 2457701.06 | 30.13 | ||
| 20161112 | 2457705.01 | 33.95 | ||
| 20161120 | 2457713.03 | 41.71 | ||
| 20161124 | 2457717.04 | 45.59 |
-
Notes: Rest-frame phase in days from the start of the outburst, JD .
| UT date | JD | Phase | Range | Telescope | Grism/Grating |
|---|---|---|---|---|---|
| (days)∗ | (Å) | +Instrument | |||
| 20161018 | 2457679.64 | 9.40 | NOT+ALFOSC | Grism#4 | |
| 20161019 | 2457680.67 | 10.40 | NOT+ALFOSC | Grism#4 | |
| 20161020 | 2457681.59 | 11.29 | NOT+ALFOSC | Grism#4 | |
| 20161030 | 2457691.65 | 21.02 | NOT+ALFOSC | Grism#4 | |
| 20161031 | 2457692.66 | 22.00 | NOT+ALFOSC | Grism#4 | |
| 20161104 | 2457697.44 | 26.62 | SALT+RSS | PG0300 | |
| 20161105 | 2457697.73 | 26.91 | Mag+IMACS | Gri-300-17.5 | |
| 20161106 | 2457698.78 | 27.92 | Mag+IMACS | Gri-300-17.5 | |
| 20161119 | 2457711.88 | 40.60 | LBT+MODS | G400L/G670L | |
| 20161124 | 2457716.55 | 45.11 | GTC+OSIRIS | R1000B/R1000R | |
| 20161206 | 2457729.58 | 57.72 | GTC+OSIRIS | R1000R | |
| 20170125 | 2457779.48 | 106.00 | GTC+OSIRIS | R1000B |
-
NOTES:
-
∗ Rest-frame phase in days from the start of the outburst, JD.
-
Telescope code: GTC: Gran Telescopio Canarias; LBT: Large Binocular Telescope; Mag: 6.5-m Magellan telescope; NOT: Nordic Optical Telescope; SALT: South African Large Telescope.
Appendix B Host galaxy analysis
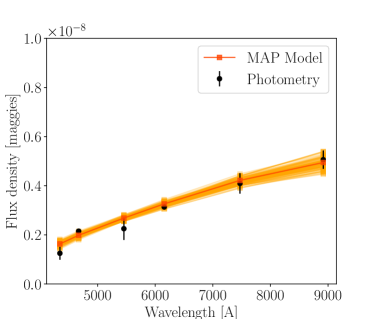
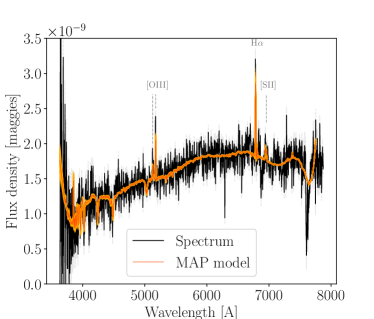
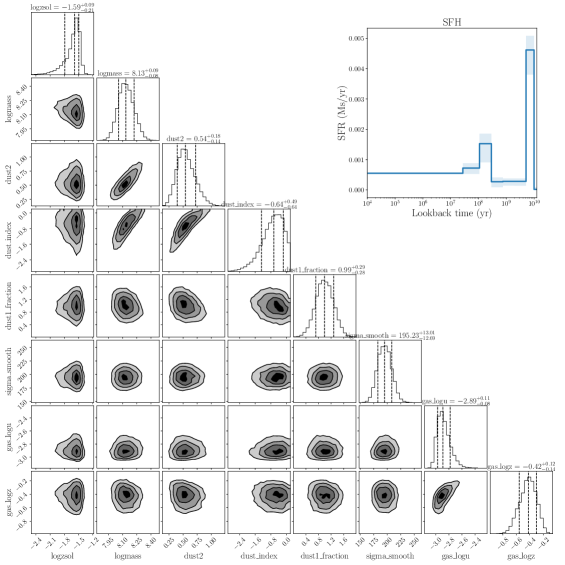
Using the host galaxy GTC/OSIRIS spectrum (JD) covering the wavelength range Å, and photometry (JD and 2457984.87), we characterised CSS161010’s host properties. We use prospector (Johnson et al., 2021), a versatile stellar population fitting tool that uses Monte Carlo sampling of the posterior distributions with emcee (Foreman-Mackey et al., 2013). The photometry and spectroscopy are simultaneously fit, ensuring a proper spectrum calibration by optimizing the parameters of a polynomial that multiplies the model spectrum to match the observed spectrum at each iteration in the fitting process. Therefore, the spectral continuum does not influence the inferred physical stellar parameters. A free parameter also ensures that the stellar model spectra are smoothed to the same resolution as the observed spectrum. We use the miles stellar libraries (Sánchez-Blázquez et al., 2006) as provided by the Flexible Stellar Population Synthesis code fsps (Conroy et al., 2009; Foreman-Mackey et al., 2014), and a non-parametric star-formation history consisting of eight age bins. Seven age bins have a free amplitude parameter, while the eighth is constrained by the total stellar mass formed. A single stellar metallicity is inferred, and a dust screen model (Kriek & Conroy, 2013) is assumed to affect all stars and with two free parameters for the dust optical depth and the slope of the attenuation curve. The young stars in star-forming regions (yr) are also affected by an additional dust component parameterized by the prescription of Blitz & Shu (1980), including a free gas dust fraction parameter. We also simultaneously fit the nebular part of the spectrum, which has two additional parameters, the gas ionisation parameter and the gas-phase metallicity. Thus, we have 15 free parameters inferred through a Monte Carlo sampling with 200 walkers and 2000 iterations. The best-fit models compared to the data, the corner plots of some parameters and the star-formation history are shown in Figure B1. The 16th, 50th and 84th percentiles of all parameters are shown in Table B1.
The velocity dispersion parameter we obtained, km s-1 is dominated by the broadening needed to go from the spectral resolution of the templates to that of the instrument (295 km s-1). Higher-resolution spectra are necessary for an accurate velocity dispersion that could help constrain the BH mass independently through the relation (Ferrarese & Merritt, 2000).
We also derived the gas phase metallicity using the emission lines from the H II region near CSS161010. By measuring the fluxes of H, H, [O III] and [N II] , and applying the O3N2 and N2 diagnostic methods from Marino et al. (2013), and the diagnostic from Dopita et al. (2016), we obtained an oxygen abundance of 12 + log(O/H) dex, 12 + log(O/H) dex and 12 + log(O/H) dex, respectively. These estimates are consistent and suggest a low metallicity (0.23 Z⊙), which also agrees quite well with the gas-phase metallicity found with prospector (0.379 Z⊙). The difference between the much lower stellar metallicity (0.026 Z⊙) and the gas-phase metallicity could arise from two different star-formation episodes in the host galaxy: a very old primordial burst that created most of the old stars with extremely low metallicity, and a low but non-null episode of recent star-formation that explains the nebular line presence and the higher gas-phase metallicity. This interpretation agrees well with the estimated star-formation history that shows two major peaks: one in the oldest bin (yr) and a more recent one spanning the youngest four bins (yr). Similar results have been previously found for other dwarf galaxies (Gallazzi et al., 2005; Lian et al., 2018; Fraser-McKelvie et al., 2022).
A detailed analysis of WISEA J045834.37-081804.4 was presented in 2020 by C20. Using an optical spectrum and photometry they found a current stellar age of Gyr, a stellar mass of M⊙, a star formation rate of M⊙yr-1, and a specific star formation rate of Gyr-1. They pointed out that their estimated stellar mass would indicate a central black hole with an intermediate mass of M⊙, possibly even lower than our estimate. Most of these parameters resemble ours, although the stellar mass differs from our estimations by an order of magnitude. This is mostly due to our addition of -band photometry that further constrains the stellar mass. However, we noticed that if we run prospector with the gas phase and stellar metallicities fixed to the value found from our host spectrum, we find a stellar mass of log(MM⊙), which is similar to the mass obtained by C20. Nevertheless, we favour our initial result, where the gas phase and stellar metallicities are free parameters because they provide very different information on the galaxy evolution (Fraser-McKelvie et al., 2022).
| SFR (M⊙/yr) at | |
|---|---|
| SFR (M⊙/yr) at | |
| SFR (M⊙/yr) at | |
| SFR (M⊙/yr) at | |
| SFR (M⊙/yr) at | |
| SFR (M⊙/yr) at | |
| SFR (M⊙/yr) at | |
| SFR (M⊙/yr) at ⋄ | |
| Log(Z/Z⊙) | |
| Log(MM⊙) | |
| Log(Age/yr)∗ | |
| Recent SFR(M⊙/yr) | |
| Dust () | |
| Dust_index () | |
| Gas dust fraction (%)† | |
| Gas ionisation parameter | |
| Log(Zgas/Z⊙) | |
| (km/s) |
-
NOTES:
-
∗ Mass-weighted age obtained from the total stellar mass and the star-formation rates bins of the SFH.
-
† Fraction of dust () that also affects the young stellar populations (yr).
-
⋄ The last SFR bin is obtained from the other seven bins and the total stellar mass formed.
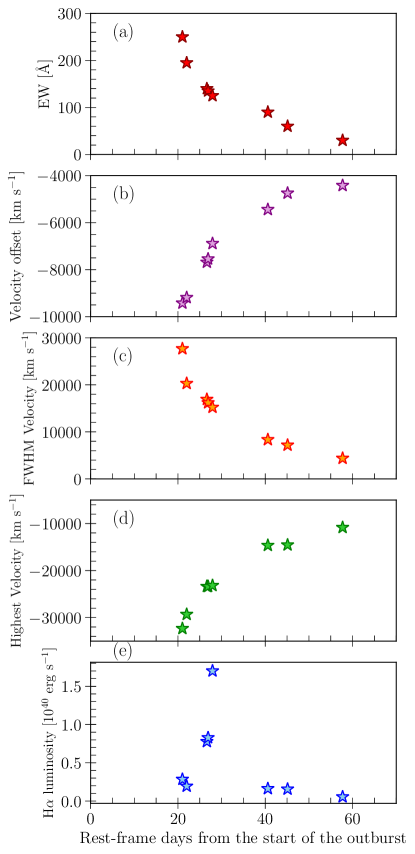
Appendix C H emission profile properties
To quantify the evolution of H in CSS161010, we measured its equivalent width (EW), velocity offset, full width at half-maximum (FWHM), the highest velocity indicated by the bluest part of the line profile and luminosity (Figure C1). The EW, FWHM, and highest velocity are most affected as the line becomes weaker. The EW evolves from at 21.0 days to Å at 57.7 days, while the FWHM velocity drops from to km s-1 during the same period. The highest velocities of H and H (the bluest parts of the profile) decrease from km s-1 at 21.0 days (consistent with the velocities measured for He ii) to km s-1 at 57.7 days, while the line centre always remains blueshifted by more than km s-1. The H luminosity rises for days, having a peak luminosity of at days. Post peak, the luminosity rapidly decreases, and after days, it has a quasi-constant evolution.
Appendix D Black hole mass from CSS161010 light curve
Recently, evidence has been found that the TDE properties are related to the BH mass (e.g. Blagorodnova et al. 2017; Wevers et al. 2017; van Velzen et al. 2021; Hammerstein et al. 2023). This connection is reinforced by a correlation found between the decay rate of the TDE light curve and the BH mass (Blagorodnova et al., 2017; van Velzen et al., 2019, 2020), where faster-decaying objects have smaller BH masses. Theoretically, the expected decline rate of the post-disruption mass return flow is consistent with a power law decay t-5/3 (Rees, 1988; Phinney, 1989); however, other parameters can affect it (Lodato et al., 2009) and different indices have been found in observations (from to van Velzen et al. 2021; Hammerstein et al. 2023). In fact, recent simulations have shown that the fallback rate from partial TDEs is proportional to a power law decay with index between and (Coughlin & Nixon, 2019; Ryu et al., 2020).
We estimate the index that best reproduces CSS161010’s light curve by fitting a power law decay (L \text(t/t) to its bolometric light curve. We use Monte Carlo sampling of the posterior distributions with emcee (Foreman-Mackey et al., 2013) to obtain the free parameters in our model, which are the characteristic time (t0) and the power-law index (). We found t days and (blue line, Figure D1). This power-law index is the highest reported to date and is in the range of indexes suggested for a partial TDE (Ryu et al., 2020).
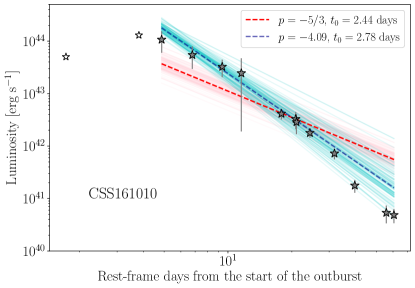
To constrain the BH mass of a TDE, we can use the correlation between the fallback timescale (t) and the BH mass. As t is comparable to t0, we can estimate this parameter by fitting the bolometric light curve of the transient with a power law decay using a fixed power-law index (). With the emcee sampler, we fit CSS161010’s bolometric light curve and obtain a t days (red line, Figure D1). Extrapolating the correlation between t and BH mass (Figure 8) and using t days, we find a BH mass of M⊙. For t days, we get a BH mass of M⊙. These BH mass values are in the middle of the range we found using scaling relations (similar to the mass obtained by fitting all galaxies; Figure 1; Appendix B. All these findings support CSS161010 as the fastest declining TDE (candidate) to date with one of the lowest BH masses.
Appendix E Location of CSS161010 within its host galaxy
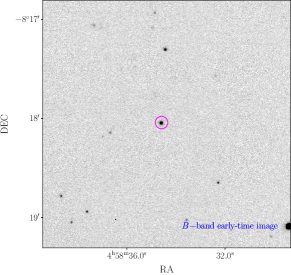
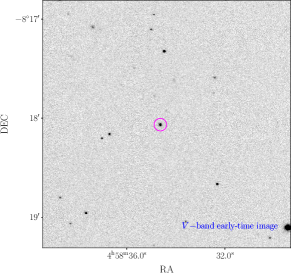
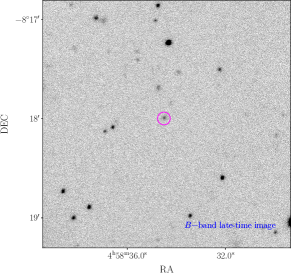
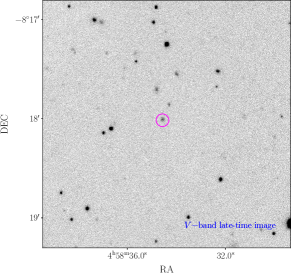
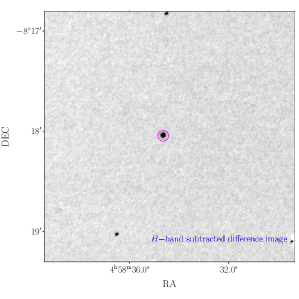
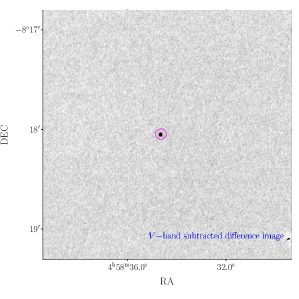
To investigate the location of CSS161010 within its host galaxy, we selected pairs of images obtained with ALFOSC on the NOT showing the transient while still bright and the host galaxy after the transient had faded away. For this, we used and band images obtained on the nights of 2016 October 29 and 2017 September 21, respectively (Figure E1). The latter images were obtained with a 900-sec integration per band. The early-time image in each band was aligned to the late-time image using ten isolated and non-saturated stars across the field of view, including shifts in and and rotation as the free parameters. The early-time images (with a better seeing) were then convolved to match the late-time images using isis 2.2 (Alard & Lupton, 1998; Alard, 2000) prior to subtraction. The position of the transient was measured from the subtracted images using centroiding. It was compared with the centroid position of the compact host galaxy measured from the late-time images. We find that in R.A., the transient position coincides with the centroid position of the host galaxy within 2. However, in Decl. we find a statistically significant offset of ” in (10) and ” in band (16). At the distance of the host galaxy, the band offset corresponds to a projected distance of 280 pc. In comparison, we measured a FWHM extent of 1.7” (corresponding to 1.2 kpc) for the host galaxy in the late-time band images with a seeing of FWHM = 1.1”. We note that Coppejans et al. (2020) found a similar offset between the optical and radio coordinates of the transient and its host galaxy in the band.
Appendix F Other tables
| Object | Redshift | Start of the outburst date (JD) | References |
|---|---|---|---|
| LBOTS | |||
| AT 2018cow | 0.014 | 2458284.84 | Prentice et al. (2018); Perley et al. (2019) |
| AT 2020mrf | 0.135 | 2459012.5 | Yao et al. (2022) |
| AT 2020xnd | 0.2433 | 2459132.50 | Perley et al. (2021); Ho et al. (2022) |
| H-rich SNe | |||
| SN 1979C | 0.00455 | 2443970.5 | Panagia et al. (1980) |
| SN 2008es | 0.205 | 2454574.5 | Gezari et al. (2009) |
| H-rich TDEs | |||
| AT 2018zr | 0.071 | 2458156.2 | Holoien et al. (2019); Charalampopoulos et al. (2022) |
| AT 2020neh | 0.062 | 2459018.6 | Angus et al. (2022) |
| AT 2020wey | 0.0274 | 2459175.5 | Charalampopoulos et al. (2023) |
References
- Abbott et al. (2020) Abbott, R., Abbott, T. D., Abraham, S., et al. 2020, ApJ, 900, L13, doi: 10.3847/2041-8213/aba493
- Alard (2000) Alard, C. 2000, A&AS, 144, 363, doi: 10.1051/aas:2000214
- Alard & Lupton (1998) Alard, C., & Lupton, R. H. 1998, ApJ, 503, 325, doi: 10.1086/305984
- Anderson et al. (2014) Anderson, J. P., Dessart, L., Gutierrez, C. P., et al. 2014, MNRAS, 441, 671, doi: 10.1093/mnras/stu610
- Andrews et al. (2010) Andrews, J. E., Gallagher, J. S., Clayton, G. C., et al. 2010, ApJ, 715, 541, doi: 10.1088/0004-637X/715/1/541
- Angus et al. (2022) Angus, C. R., Baldassare, V. F., Mockler, B., et al. 2022, Nature Astronomy, 6, 1452, doi: 10.1038/s41550-022-01811-y
- Arcavi et al. (2016) Arcavi, I., Wolf, W. M., Howell, D. A., et al. 2016, ApJ, 819, 35, doi: 10.3847/0004-637X/819/1/35
- Arnett (1982) Arnett, W. D. 1982, ApJ, 253, 785, doi: 10.1086/159681
- Bellm et al. (2019) Bellm, E. C., Kulkarni, S. R., Graham, M. J., et al. 2019, PASP, 131, 018002, doi: 10.1088/1538-3873/aaecbe
- Bellovary et al. (2019) Bellovary, J. M., Cleary, C. E., Munshi, F., et al. 2019, MNRAS, 482, 2913, doi: 10.1093/mnras/sty2842
- Blagorodnova et al. (2017) Blagorodnova, N., Gezari, S., Hung, T., et al. 2017, ApJ, 844, 46, doi: 10.3847/1538-4357/aa7579
- Blitz & Shu (1980) Blitz, L., & Shu, F. H. 1980, ApJ, 238, 148, doi: 10.1086/157968
- Breeveld et al. (2011) Breeveld, A. A., Landsman, W., Holland, S. T., et al. 2011, in American Institute of Physics Conference Series, Vol. 1358, Gamma Ray Bursts 2010, ed. J. E. McEnery, J. L. Racusin, & N. Gehrels, 373–376, doi: 10.1063/1.3621807
- Bright et al. (2022) Bright, J. S., Margutti, R., Matthews, D., et al. 2022, ApJ, 926, 112, doi: 10.3847/1538-4357/ac4506
- Brown et al. (2013) Brown, T. M., Baliber, N., Bianco, F. B., et al. 2013, PASP, 125, 1031, doi: 10.1086/673168
- Buckley et al. (2006) Buckley, D. A. H., Swart, G. P., & Meiring, J. G. 2006, in Society of Photo-Optical Instrumentation Engineers (SPIE) Conference Series, Vol. 6267, Society of Photo-Optical Instrumentation Engineers (SPIE) Conference Series, ed. L. M. Stepp, 62670Z, doi: 10.1117/12.673750
- Burgh et al. (2003) Burgh, E. B., Nordsieck, K. H., Kobulnicky, H. A., et al. 2003, in Society of Photo-Optical Instrumentation Engineers (SPIE) Conference Series, Vol. 4841, Instrument Design and Performance for Optical/Infrared Ground-based Telescopes, ed. M. Iye & A. F. M. Moorwood, 1463–1471, doi: 10.1117/12.460312
- Burrows et al. (2011) Burrows, D. N., Kennea, J. A., Ghisellini, G., et al. 2011, Nature, 476, 421, doi: 10.1038/nature10374
- Charalampopoulos et al. (2023) Charalampopoulos, P., Pursiainen, M., Leloudas, G., et al. 2023, A&A, 673, A95, doi: 10.1051/0004-6361/202245065
- Charalampopoulos et al. (2022) Charalampopoulos, P., Leloudas, G., Malesani, D. B., et al. 2022, A&A, 659, A34, doi: 10.1051/0004-6361/202142122
- Chen et al. (2022) Chen, P., Dong, S., Kochanek, C. S., et al. 2022, ApJS, 259, 53, doi: 10.3847/1538-4365/ac50b7
- Chen et al. (2023) Chen, Y., Drout, M. R., Piro, A. L., et al. 2023, ApJ, 955, 43, doi: 10.3847/1538-4357/ace964
- Chevalier & Fransson (1994) Chevalier, R. A., & Fransson, C. 1994, ApJ, 420, 268, doi: 10.1086/173557
- Chrimes et al. (2024a) Chrimes, A. A., Coppejans, D. L., Jonker, P. G., et al. 2024a, arXiv e-prints, arXiv:2406.13821, doi: 10.48550/arXiv.2406.13821
- Chrimes et al. (2024b) Chrimes, A. A., Jonker, P. G., Levan, A. J., et al. 2024b, MNRAS, 527, L47, doi: 10.1093/mnrasl/slad145
- Conroy et al. (2009) Conroy, C., Gunn, J. E., & White, M. 2009, ApJ, 699, 486, doi: 10.1088/0004-637X/699/1/486
- Coppejans et al. (2020) Coppejans, D. L., Margutti, R., Terreran, G., et al. 2020, ApJ, 895, L23, doi: 10.3847/2041-8213/ab8cc7
- Coughlin & Nixon (2019) Coughlin, E. R., & Nixon, C. J. 2019, ApJ, 883, L17, doi: 10.3847/2041-8213/ab412d
- den Brok et al. (2015) den Brok, M., Seth, A. C., Barth, A. J., et al. 2015, ApJ, 809, 101, doi: 10.1088/0004-637X/809/1/101
- Dessart & Hillier (2005) Dessart, L., & Hillier, D. J. 2005, A&A, 437, 667, doi: 10.1051/0004-6361:20042525
- Donato et al. (2014) Donato, D., Cenko, S. B., Covino, S., et al. 2014, ApJ, 781, 59, doi: 10.1088/0004-637X/781/2/59
- Dopita et al. (2016) Dopita, M. A., Kewley, L. J., Sutherland, R. S., & Nicholls, D. C. 2016, Ap&SS, 361, 61, doi: 10.1007/s10509-016-2657-8
- Drake et al. (2009) Drake, A. J., et al. 2009, ApJ, 696, 870, doi: 10.1088/0004-637X/696/1/870
- Drout et al. (2014) Drout, M. R., Chornock, R., Soderberg, A. M., et al. 2014, ApJ, 794, 23, doi: 10.1088/0004-637X/794/1/23
- Faris et al. (2024) Faris, S., Arcavi, I., Makrygianni, L., et al. 2024, ApJ, 969, 104, doi: 10.3847/1538-4357/ad4a72
- Ferrarese & Merritt (2000) Ferrarese, L., & Merritt, D. 2000, ApJ, 539, L9, doi: 10.1086/312838
- Flewelling et al. (2020) Flewelling, H. A., Magnier, E. A., Chambers, K. C., et al. 2020, ApJS, 251, 7, doi: 10.3847/1538-4365/abb82d
- Foreman-Mackey et al. (2013) Foreman-Mackey, D., Hogg, D. W., Lang, D., & Goodman, J. 2013, PASP, 125, 306, doi: 10.1086/670067
- Foreman-Mackey et al. (2014) Foreman-Mackey, D., Sick, J., & Johnson, B. 2014, python-fsps: Python bindings to FSPS (v0.1.1), v0.1.1, Zenodo, Zenodo, doi: 10.5281/zenodo.12157
- Fox & Smith (2019) Fox, O. D., & Smith, N. 2019, MNRAS, 488, 3772, doi: 10.1093/mnras/stz1925
- Fransson et al. (1996) Fransson, C., Lundqvist, P., & Chevalier, R. A. 1996, ApJ, 461, 993, doi: 10.1086/177119
- Fraser-McKelvie et al. (2022) Fraser-McKelvie, A., Cortese, L., Groves, B., et al. 2022, MNRAS, 510, 320, doi: 10.1093/mnras/stab3430
- Gallazzi et al. (2005) Gallazzi, A., Charlot, S., Brinchmann, J., White, S. D. M., & Tremonti, C. A. 2005, MNRAS, 362, 41, doi: 10.1111/j.1365-2966.2005.09321.x
- Gezari et al. (2009) Gezari, S., Halpern, J. P., Grupe, D., et al. 2009, ApJ, 690, 1313, doi: 10.1088/0004-637X/690/2/1313
- Graham et al. (2019) Graham, M. J., Kulkarni, S. R., Bellm, E. C., et al. 2019, PASP, 131, 078001, doi: 10.1088/1538-3873/ab006c
- Greene et al. (2020) Greene, J. E., Strader, J., & Ho, L. C. 2020, ARA&A, 58, 257, doi: 10.1146/annurev-astro-032620-021835
- Habouzit et al. (2017) Habouzit, M., Volonteri, M., & Dubois, Y. 2017, MNRAS, 468, 3935, doi: 10.1093/mnras/stx666
- Hammerstein et al. (2023) Hammerstein, E., van Velzen, S., Gezari, S., et al. 2023, ApJ, 942, 9, doi: 10.3847/1538-4357/aca283
- He et al. (2021) He, J. S., Dou, L. M., Ai, Y. L., et al. 2021, A&A, 652, A15, doi: 10.1051/0004-6361/202140828
- Ho et al. (2019) Ho, A. Y. Q., Phinney, E. S., Ravi, V., et al. 2019, ApJ, 871, 73, doi: 10.3847/1538-4357/aaf473
- Ho et al. (2020) Ho, A. Y. Q., Perley, D. A., Kulkarni, S. R., et al. 2020, ApJ, 895, 49, doi: 10.3847/1538-4357/ab8bcf
- Ho et al. (2021) Ho, A. Y. Q., Perley, D. A., Gal-Yam, A., et al. 2021, arXiv e-prints, arXiv:2105.08811. https://arxiv.org/abs/2105.08811
- Ho et al. (2022) Ho, A. Y. Q., Margalit, B., Bremer, M., et al. 2022, ApJ, 932, 116, doi: 10.3847/1538-4357/ac4e97
- Ho et al. (2023) Ho, A. Y. Q., Perley, D. A., Chen, P., et al. 2023, Nature, 623, 927, doi: 10.1038/s41586-023-06673-6
- Holoien et al. (2019) Holoien, T. W. S., Huber, M. E., Shappee, B. J., et al. 2019, ApJ, 880, 120, doi: 10.3847/1538-4357/ab2ae1
- Hung et al. (2019) Hung, T., Cenko, S. B., Roth, N., et al. 2019, ApJ, 879, 119, doi: 10.3847/1538-4357/ab24de
- Inkenhaag et al. (2023) Inkenhaag, A., Jonker, P. G., Levan, A. J., et al. 2023, arXiv e-prints, arXiv:2308.07381, doi: 10.48550/arXiv.2308.07381
- Inserra (2019) Inserra, C. 2019, Nature Astronomy, 3, 697, doi: 10.1038/s41550-019-0854-4
- Johnson et al. (2021) Johnson, B. D., Leja, J., Conroy, C., & Speagle, J. S. 2021, ApJS, 254, 22, doi: 10.3847/1538-4365/abef67
- Kara et al. (2016) Kara, E., Miller, J. M., Reynolds, C., & Dai, L. 2016, Nature, 535, 388, doi: 10.1038/nature18007
- Kıroğlu et al. (2023) Kıroğlu, F., Lombardi, J. C., Kremer, K., et al. 2023, ApJ, 948, 89, doi: 10.3847/1538-4357/acc24c
- Kriek & Conroy (2013) Kriek, M., & Conroy, C. 2013, ApJ, 775, L16, doi: 10.1088/2041-8205/775/1/L16
- Leonard et al. (2000) Leonard, D. C., Filippenko, A. V., Barth, A. J., & Matheson, T. 2000, ApJ, 536, 239, doi: 10.1086/308910
- Lian et al. (2018) Lian, J., Thomas, D., Maraston, C., et al. 2018, MNRAS, 474, 1143, doi: 10.1093/mnras/stx2829
- Lin et al. (2018) Lin, D., Strader, J., Carrasco, E. R., et al. 2018, Nature Astronomy, 2, 656, doi: 10.1038/s41550-018-0493-1
- Lipunova (1999) Lipunova, G. V. 1999, Astronomy Letters, 25, 508, doi: 10.48550/arXiv.astro-ph/9906324
- Liu et al. (2018) Liu, L.-D., Zhang, B., Wang, L.-J., & Dai, Z.-G. 2018, ApJ, 868, L24, doi: 10.3847/2041-8213/aaeff6
- Lodato et al. (2009) Lodato, G., King, A. R., & Pringle, J. E. 2009, MNRAS, 392, 332, doi: 10.1111/j.1365-2966.2008.14049.x
- Margutti et al. (2019) Margutti, R., Metzger, B. D., Chornock, R., et al. 2019, ApJ, 872, 18, doi: 10.3847/1538-4357/aafa01
- Marino et al. (2013) Marino, R. A., Rosales-Ortega, F. F., Sánchez, S. F., et al. 2013, A&A, 559, A114, doi: 10.1051/0004-6361/201321956
- Matthews et al. (2023) Matthews, D., Margutti, R., Metzger, B. D., et al. 2023, Research Notes of the American Astronomical Society, 7, 126, doi: 10.3847/2515-5172/acdde1
- Mattila et al. (2018) Mattila, S., Pérez-Torres, M., Efstathiou, A., et al. 2018, Science, 361, 482, doi: 10.1126/science.aao4669
- Meisner et al. (2023) Meisner, A. M., Caselden, D., Schlafly, E. F., & Kiwy, F. 2023, AJ, 165, 36, doi: 10.3847/1538-3881/aca2ab
- Meisner et al. (2018) Meisner, A. M., Lang, D., & Schlegel, D. J. 2018, AJ, 156, 69, doi: 10.3847/1538-3881/aacbcd
- Metzger (2022) Metzger, B. D. 2022, ApJ, 932, 84, doi: 10.3847/1538-4357/ac6d59
- Mezcua (2017) Mezcua, M. 2017, International Journal of Modern Physics D, 26, 1730021, doi: 10.1142/S021827181730021X
- Mezcua et al. (2016) Mezcua, M., Civano, F., Fabbiano, G., Miyaji, T., & Marchesi, S. 2016, ApJ, 817, 20, doi: 10.3847/0004-637X/817/1/20
- Migliori et al. (2024) Migliori, G., Margutti, R., Metzger, B. D., et al. 2024, ApJ, 963, L24, doi: 10.3847/2041-8213/ad2764
- Mummery et al. (2023) Mummery, A., van Velzen, S., Nathan, E., et al. 2023, arXiv e-prints, arXiv:2308.08255, doi: 10.48550/arXiv.2308.08255
- Nguyen et al. (2018) Nguyen, D. D., Seth, A. C., Neumayer, N., et al. 2018, ApJ, 858, 118, doi: 10.3847/1538-4357/aabe28
- Nicholl (2018) Nicholl, M. 2018, Research Notes of the American Astronomical Society, 2, 230, doi: 10.3847/2515-5172/aaf799
- Nicholl et al. (2020) Nicholl, M., Wevers, T., Oates, S. R., et al. 2020, MNRAS, 499, 482, doi: 10.1093/mnras/staa2824
- Ofek et al. (2010) Ofek, E. O., Rabinak, I., Neill, J. D., et al. 2010, ApJ, 724, 1396, doi: 10.1088/0004-637X/724/2/1396
- Osterbrock & Ferland (2006) Osterbrock, D. E., & Ferland, G. J. 2006, Astrophysics of gaseous nebulae and active galactic nuclei
- Panagia et al. (1980) Panagia, N., Vettolani, G., Boksenberg, A., et al. 1980, MNRAS, 192, 861
- Pasham et al. (2021) Pasham, D. R., Ho, W. C. G., Alston, W., et al. 2021, Nature Astronomy, 6, 249, doi: 10.1038/s41550-021-01524-8
- Pellegrino et al. (2022) Pellegrino, C., Howell, D. A., Vinkó, J., et al. 2022, ApJ, 926, 125, doi: 10.3847/1538-4357/ac3e63
- Perley et al. (2019) Perley, D. A., Mazzali, P. A., Yan, L., et al. 2019, MNRAS, 484, 1031, doi: 10.1093/mnras/sty3420
- Perley et al. (2021) Perley, D. A., Ho, A. Y. Q., Yao, Y., et al. 2021, MNRAS, 508, 5138, doi: 10.1093/mnras/stab2785
- Phinney (1989) Phinney, E. S. 1989, in The Center of the Galaxy, ed. M. Morris, Vol. 136, 543
- Pogge et al. (2010) Pogge, R. W., Atwood, B., Brewer, D. F., et al. 2010, in Society of Photo-Optical Instrumentation Engineers (SPIE) Conference Series, Vol. 7735, Ground-based and Airborne Instrumentation for Astronomy III, ed. I. S. McLean, S. K. Ramsay, & H. Takami, 77350A, doi: 10.1117/12.857215
- Prentice et al. (2016) Prentice, S. J., Mazzali, P. A., Pian, E., et al. 2016, MNRAS, 458, 2973, doi: 10.1093/mnras/stw299
- Prentice et al. (2018) Prentice, S. J., Maguire, K., Smartt, S. J., et al. 2018, ApJ, 865, L3, doi: 10.3847/2041-8213/aadd90
- Pursiainen et al. (2018) Pursiainen, M., Childress, M., Smith, M., et al. 2018, MNRAS, 481, 894, doi: 10.1093/mnras/sty2309
- Rees (1984) Rees, M. J. 1984, ARA&A, 22, 471, doi: 10.1146/annurev.aa.22.090184.002351
- Rees (1988) —. 1988, Nature, 333, 523, doi: 10.1038/333523a0
- Reines & Volonteri (2015) Reines, A. E., & Volonteri, M. 2015, ApJ, 813, 82, doi: 10.1088/0004-637X/813/2/82
- Rest et al. (2018) Rest, A., Garnavich, P. M., Khatami, D., et al. 2018, Nature Astronomy, 2, 307, doi: 10.1038/s41550-018-0423-2
- Reynolds et al. (2016) Reynolds, T., Dong, S., Fraser, M., et al. 2016, The Astronomer’s Telegram, 9645, 1
- Roth & Kasen (2018) Roth, N., & Kasen, D. 2018, ApJ, 855, 54, doi: 10.3847/1538-4357/aaaec6
- Ryu et al. (2020) Ryu, T., Krolik, J., Piran, T., & Noble, S. C. 2020, ApJ, 904, 100, doi: 10.3847/1538-4357/abb3ce
- Sagar et al. (2012) Sagar, R., Kumar, B., Omar, A., & Pandey, A. K. 2012, in Society of Photo-Optical Instrumentation Engineers (SPIE) Conference Series, Vol. 8444, Ground-based and Airborne Telescopes IV, ed. L. M. Stepp, R. Gilmozzi, & H. J. Hall, 84441T, doi: 10.1117/12.925634
- Sánchez-Blázquez et al. (2006) Sánchez-Blázquez, P., Peletier, R. F., Jiménez-Vicente, J., et al. 2006, MNRAS, 371, 703, doi: 10.1111/j.1365-2966.2006.10699.x
- Schlafly & Finkbeiner (2011) Schlafly, E. F., & Finkbeiner, D. P. 2011, ApJ, 737, 103, doi: 10.1088/0004-637X/737/2/103
- Shakura & Sunyaev (1973) Shakura, N. I., & Sunyaev, R. A. 1973, A&A, 24, 337
- Shappee et al. (2014) Shappee, B. J., Prieto, J. L., Grupe, D., et al. 2014, ApJ, 788, 48, doi: 10.1088/0004-637X/788/1/48
- Skrutskie et al. (2006) Skrutskie, M. F., Cutri, R. M., Stiening, R., et al. 2006, AJ, 131, 1163, doi: 10.1086/498708
- Smith et al. (2020) Smith, K. W., Smartt, S. J., Young, D. R., et al. 2020, PASP, 132, 085002, doi: 10.1088/1538-3873/ab936e
- Soker (2022) Soker, N. 2022, Research in Astronomy and Astrophysics, 22, 055010, doi: 10.1088/1674-4527/ac5b40
- Soker et al. (2019) Soker, N., Grichener, A., & Gilkis, A. 2019, MNRAS, 484, 4972, doi: 10.1093/mnras/stz364
- Taddia et al. (2020) Taddia, F., Stritzinger, M. D., Fransson, C., et al. 2020, A&A, 638, A92, doi: 10.1051/0004-6361/201936654
- Tonry et al. (2018) Tonry, J. L., Denneau, L., Heinze, A. N., et al. 2018, Publications of the Astronomical Society of the Pacific, 130, 064505, doi: 10.1088/1538-3873/aabadf
- van Velzen et al. (2020) van Velzen, S., Holoien, T. W. S., Onori, F., Hung, T., & Arcavi, I. 2020, Space Sci. Rev., 216, 124, doi: 10.1007/s11214-020-00753-z
- van Velzen et al. (2019) van Velzen, S., Stone, N. C., Metzger, B. D., et al. 2019, ApJ, 878, 82, doi: 10.3847/1538-4357/ab1844
- van Velzen et al. (2021) van Velzen, S., Gezari, S., Hammerstein, E., et al. 2021, ApJ, 908, 4, doi: 10.3847/1538-4357/abc258
- Wen et al. (2021) Wen, S., Jonker, P. G., Stone, N. C., & Zabludoff, A. I. 2021, ApJ, 918, 46, doi: 10.3847/1538-4357/ac00b5
- Wevers et al. (2017) Wevers, T., van Velzen, S., Jonker, P. G., et al. 2017, MNRAS, 471, 1694, doi: 10.1093/mnras/stx1703
- Wiseman et al. (2020) Wiseman, P., Pursiainen, M., Childress, M., et al. 2020, MNRAS, 498, 2575, doi: 10.1093/mnras/staa2474
- Woo et al. (2019) Woo, J.-H., Cho, H., Gallo, E., et al. 2019, Nature Astronomy, 3, 755, doi: 10.1038/s41550-019-0790-3
- Wu et al. (2018) Wu, S., Coughlin, E. R., & Nixon, C. 2018, MNRAS, 478, 3016, doi: 10.1093/mnras/sty971
- Xiang et al. (2021) Xiang, D., Wang, X., Lin, W., et al. 2021, ApJ, 910, 42, doi: 10.3847/1538-4357/abdeba
- Yao et al. (2022) Yao, Y., Ho, A. Y. Q., Medvedev, P., et al. 2022, ApJ, 934, 104, doi: 10.3847/1538-4357/ac7a41
- Yaron & Gal-Yam (2012) Yaron, O., & Gal-Yam, A. 2012, PASP, 124, 668, doi: 10.1086/666656
- Zhang et al. (2022) Zhang, W., Shu, X., Chen, J.-H., et al. 2022, Research in Astronomy and Astrophysics, 22, 125016, doi: 10.1088/1674-4527/ac9c4b
- Zuo et al. (2024) Zuo, W., Guo, H., Sun, J., et al. 2024, arXiv e-prints, arXiv:2405.11750, doi: 10.48550/arXiv.2405.11750