Molecular dynamics simulations of head-on low-velocity collisions between particles
Abstract
The particle contact model is important for powder simulations. Although several contact models have been proposed, their validity has not yet been well established. Therefore, we perform molecular dynamics (MD) simulations to clarify the particle interaction. We simulate head-on collisions of two particles with impact velocities less than a few % of the sound velocity to investigate the dependence of the interparticle force and the coefficient of restitution on the impact velocity and particle radius. In this study, we treat particles with a radius of 10-100 nm and perform simulations with up to 0.2 billion atoms. We find that the interparticle force exhibits hysteresis between the loading and unloading phases. Larger impact velocities result in strong hysteresis and plastic deformation. For all impact velocities and particle radii, the coefficient of restitution is smaller than that given by the Johnson-Kendall-Robert theory, which is a contact model that gives the force between elastic spherical particles. A contact model of inelastic particles cannot reproduce our MD simulations. In particular, the coefficient of restitution is significantly reduced when the impact velocity exceeds a certain value. This significant energy dissipation cannot be explained even by the contact models including plastic deformation. We also find that the coefficient of restitution increases with increasing particle radius. We also find that the previous contact models including plastic deformation cannot explain the strong energy dissipation obtained in our MD simulations, although they agree with the MD results for very low impact velocities. Accordingly, we have constructed a new dissipative contact model in which the dissipative force increases with the stress generated by collisions. The new stress-dependent model successfully reproduces our MD results over a wider range of impact velocities than the conventional models do. In addition, we proposed another, simpler, dissipative contact model that can also reproduce the MD results.
I Introduction
Particle collisions are universal processes that occur in many fields of science and technology [e.g., 1, 2, 3]. In mineral-processing engineering, for example, fine ores form agglomerates such as pellets; particle collision processes are essential for their formation, growth, and fragmentation. In the fertilizer industry, agglomeration technology is used to form granules. In astrophysics, dust aggregates—the starting materials of planets—are formed by many silica and water ice particles. In this process, submicron-sized dust particles stick together at collision velocities of m/s to form agglomerates. Furthermore, the structure of the small bodies of the solar system is described by the granular mechanic’s theories, which have been studied theoretically, experimentally, and numerically [e.g., 4].
Powder simulations have been used to study the physics of agglomerates, including the structures and tensile strengths of agglomerates, the threshold collision velocity for fragmentation, and fragment distributions [e.g., 5, 6, 7, 8, 9, 10]. In powder simulations, the interaction forces and torques between particles are usually calculated assuming spherical particles. Several contact models have been proposed for spherical particles. The Johnson–Kendall–Roberts (JKR) theory [11, 12, 13, 14, 15] is the model often used in the powder simulations [e.g., 10, 6, 5, 8, 7, 9]. The JKR theory assumes a pressure distribution in which the pressure diverges at the rim of the contact region. This model is consistent with the experiments that use large particles. Besides the JKR theory, other contact models have been proposed. The Derjaguin–Muller–Toporov (DMT) theory is another contact model [16]; it is suitable for small particles and assumes that adhesive forces act around the rim of the contact area between the particles. The Maugis–Dugdale solution was proposed for medium-sized particles [17, 18]. Several previous studies indicated that although these models describe the basic contact process, their treatments of energy dissipation are insufficient. In particular, a study using molecular dynamics simulations showed that the kinetic energy of the macroscopic particles is converted into molecular motions, which results in more energy dissipation than in the JKR theory [19]. Other molecular dynamics simulations of head-on collisions between non-adhesive particles demonstrated that plastic deformation of the particles results in the dissipation of kinetic energy, and they also obtained the yield velocity at which the plastic deformation begins [20, 21]. Molecular motion and particle deformation result in energy dissipation and affect the physical processes of the powder system, but these effects are not included in the contact models listed above. Krijt et al. [22] constructed a new dissipation model that adds the viscoelasticity of the particles and the effect of the plastic deformation to the JKR theory. Krijt et al. showed the validity of their model for micron-sized particles by comparing it to some experiments of collisions with impact velocities lower than a few % of sound velocities. It is necessary to check the validity of their model through microscopic molecular dynamics simulations.
Some contact models do include particle deformation and molecular motions. For example, crack propagation in the contact area due to the molecular motion has been studied [23]. Dissipation forces due to the viscoelastic deformation were also considered [22, 24]. The contact models that include these effects are consistent with experiments on collisions between particles larger than a few m in size [e.g., 22, 25, 26]. However, their validity for smaller particles has not yet been confirmed. Molecular dynamics simulations are particularly useful to clarify the actual particle interactions for such small particle sizes.
Molecular dynamics (MD) simulations are used to study the physical processes involved by analyzing molecular motion. In other words, MD simulations are molecular -body simulations. Such MD simulations have been used primarily in engineering, biology, and even in the study of particle contact dynamics. In particularly, collisions between nanoparticles have been well investigated [e.g., 27, 28, 29, 30, 31, 32, 33, 34, 35, 36]. Collisions between a nanoparticle and an atomic cluster were also simulated, and their rebound or adhesion was studied [37]. Nietiadi et al. [34, 29] simulated the collisions between silica nanoparticles with an impact velocity of less than 1000 m/s and investigated the COR and bouncing threshold. They used Si and O atoms to model the silica nanoparticles, and covalent bonds bind these atoms. Most of these studies focused on high-velocity collisions of nanoparticles with impact velocities exceeding 1000 m/s, about 20 % of the sound velocity, to investigate particle melting and fragmentation, which is beyond the scope of contact models. Although there have been few MD simulation studies with impact velocities of the order of tens of m/s, a few % of the sound velocity, the validity of contact models under these conditions has not yet been confirmed. Tanaka et al. [19] used the Lennard-Jones potential as the interatomic potential and investigated the collisions between submicron-sized particles with an impact velocity of less than 50 m/s, assuming argon atoms. They found that the COR obtained from the MD simulations is smaller than that predicted by the JKR theory and that collisions with large velocities cause strong deformation and energy dissipation. Nietiadi et al. [35, 29] investigated the collisions between nanoparticles of radii less than 20 nm. In this way, the previous studies mainly simulated collisions between nanoparticles with a radius on the order of 10 nm, consisting of several million molecules, and since low collision velocities result only in coalescence, they investigated collision velocities with about 10% of the sound velocity, although such collision processes cannot be described by the contact model presented above. As the particles become larger, they start to bounce back even at a few % of the sound velocity, and such a collision process can be compared to the contact model. To validate the model, we should use particles of about 100 nm or less, where bouncing occurs. Here, we use MD simulations to explore the realistic particle interactions with submicron particles at impact velocities of around 100 m/s. We have also developed a new contact model with dissipation that can reproduce MD simulations.
In this paper, we study particle collisions using MD simulations. The JKR theory and a dissipative model of Krijt et al. [22] are first introduced in Sec. II because the JKR theory is often used in the powder simulations and the dissipative model is an extended model of the JKR theory. We next explain our simulation method, the particle models, and the initial condition of the collisions in Sec. III. In Sec. IV, we present the results of the MD simulations in which particle interactions and the coefficient of restitution are investigated. Based on these results, we construct new contact models in Sec. V. Finally, we summarize our results and discuss future work in Sec. VI.
II contact model
II.1 Hertz theory
In this section, we first explain the models of the interaction between two elastic spheres in contact. We start with the Hertz theory. We consider two particles with radii and . They have Young’s moduli and , Poisson’s ratios and , and masses and . We introduce the reduced particle radius , the reduced Young’s modulus , and the reduced mass . When the spheres are in contact, the contact surface can be treated as a disk with radius . The mutual approach is the compression length given by
| (1) |
where is the distance between the centers of the two particles. In the Hertz theory, connection and disconnection occur at ; thus, is positive for particles in contact.
The Hertzian force can be written as follows:
| (2) |
where the radius of the contact surface between the two particles, , is given by in the Hertz theory. The Hertzian force is always repulsive and non-adhesive, as a positive force denotes a repulsive one. The forces are identical in both the loading and unloading phases, and there is no hysteresis. As a result, the coefficient of restitution is always in the Hertz theory. We can also obtain the Hertzian potential energy by integrating eq. (2):
| (3) |
The pressure at the center of the contact area increases with and is given by
| (4) |
II.2 Johnson–Kendall–Roberts theory
In the JKR theory [11, 15], and are related as
| (5) |
where is the surface energy per unit area111Note that in this paper is equal to and twice of Krijt et al. [22].. The contact radius is obtained from this equation as a function of . The force between the particles is given by
| (6) |
A positive value of again indicates a repulsive force, whereas a negative one indicates an attractive force. The potential energy in the JKR theory can be written as follows
| (7) |
This equation consists of two terms: the first represents the elastic potential energy, and the second represents the surface energy. The maximum absolute value of the attractive force between the two contacting particles, , is given by , and it occurs at , where is the stationary mutual approach. The stationary point exists where and is denoted by the subscription 0. The stationary contact radius and the stationary mutual approach are given by
| (8) |
The pressure at the center of the contact area is given
| (9) |
In the JKR theory, contact between the two particles starts at , and the disconnection occurs at . The difference in between the connection and disconnection represents hysteresis, which indicates energy dissipation in the amount of [39], which gives the coefficient of restitution in the JKR theory.
II.3 Krijt model
The contact model of Krijt et al. [22] (hereafter referred to as the Krijt model) includes two energy dissipation mechanisms. One is the bulk dissipative force due to the viscoelasticity [24, 40]. The other is a delayed evolution of the contact radius based on the viscoelastic crack theory [23].
In the Krijt model, the interaction force between two particles in contact consists of two components, and the equation for relative motion is given by
| (10) |
where is the elastic force and is the dissipative force:
| (11) | |||||
| (12) |
where is the pressure distribution across the contact area [41, 22] and is the relaxation time [40, 24]. Since depends on both and , the elastic force has hysteresis due to the delayed evolution of . Some studied suggested that is approximately proportional to the particle radius [22, 42]. We should note that the dissipation force has the opposite sign to the relative velocity because . Thus, this dissipation force acts in the same way as a viscous resistance.
To describe the evolution of the contact radius, the Krijt model uses the Griffith theory [43] instead of eq. (5). The Griffith theory describes the crack propagation and gives the rate of evolution of the contact radius, , which is proportional to . The detailed formula for is presented in Appendix B. The viscoelastic effect in crack propagation results in a delay in the evolution of compared with that given by eq. (5) and causes hysteresis in the evolution of the contact radius and the elastic force between loading and unloading phases [e.g., 22, 44]. In our MD simulations for nano- and submicron-sized particles, however, we find that the hysteresis of due to the delayed is much smaller than that of the dissipative force .
Given the initial conditions of the collision, the outcome of the collision can be obtained by numerically solving eq. (10). Krijt et al. incorporated the plastic deformation model of Thornton and Ning [45] into the outcome to obtain a coefficient of restitution that includes the effects of plastic deformation. The plastic deformation of the Thornton and Ning model with results in a decrease in , as expressed by the following equation:
| (13) |
where is the yield velocity, which is the impact velocity at which the plastic deformation begins, and . Takato et al. [20] performed MD simulations of collisions between non-adhesive particles and estimated m/s for nm for Argon particles. Krijt et al. combined obtained by numerically solving eq. (10) with the energy dissipation due to plastic deformation in the eq. (13) and obtained the coefficient of restitution including the effect of plastic deformation as:
| (14) |
III Methods
We have simulated the head-on collisions between two equal-mass particles using the MD simulation code LAMMPS [46]. The particles are spheres consisting of 12–6 Lennard–Jones (LJ) atoms arranged in a face-centered cubic (fcc) structure. The LJ atoms are subject to the potential , where is the distance between the - and -th atoms, is the potential depth, and is the distance at which . We normalize the parameters using and the molecular weight, thus expressing them in so-called LJ units. For example, the unit of temperature is , where is the Boltzmann constant and is set in the LJ units. We prepare a population of molecules arranged in an fcc structure and cut the molecules outside a certain distance from the origin to form a sphere. The number of atoms in a particle is from to . The particle density is . The particle temperature is determined by giving random motion to the atoms: where , and are the mass and velocity of the -th atom. The initial particle temperature is set to in the canonical ensemble (NVT), corresponding to, for example, K for argon. In this paper, we treat the collisions with extremely low temperatures as a first step. We place two particles at a distance greater than from each other and give an initial velocity for each particle so that they collide head-on. The orientations of each particle are randomly rotated. We also vary the impact velocity from to 0.50. We adopt a cutoff distance for the interaction for all atoms at and perform the simulations in the microcanonical ensemble (NVE) for a time of at least with a timestep of in the LJ units. The positions and velocities of molecules are updated by the Velocity Verlet algorithm.
We introduce examples of LJ units for three atoms, shown in Table 1. The LJ lengths are almost the same, and the particle radius corresponds to 10–100 nm. Water molecules have a complex potential. Note that the normalizing parameters of water molecules are quantitatively different by a factor of several.
| (g/mol) | (nm) | (meV) | (ps) | (m/s) | |
|---|---|---|---|---|---|
| Ar | 39.95 | 0.341 | 10.32 | 2.16 | 158 |
| H2O | 18.02 | 0.319 | 53 | 0.599 | 533 |
| Ag | 107.87 | 0.2644 | 345 | 0.476 | 555 |
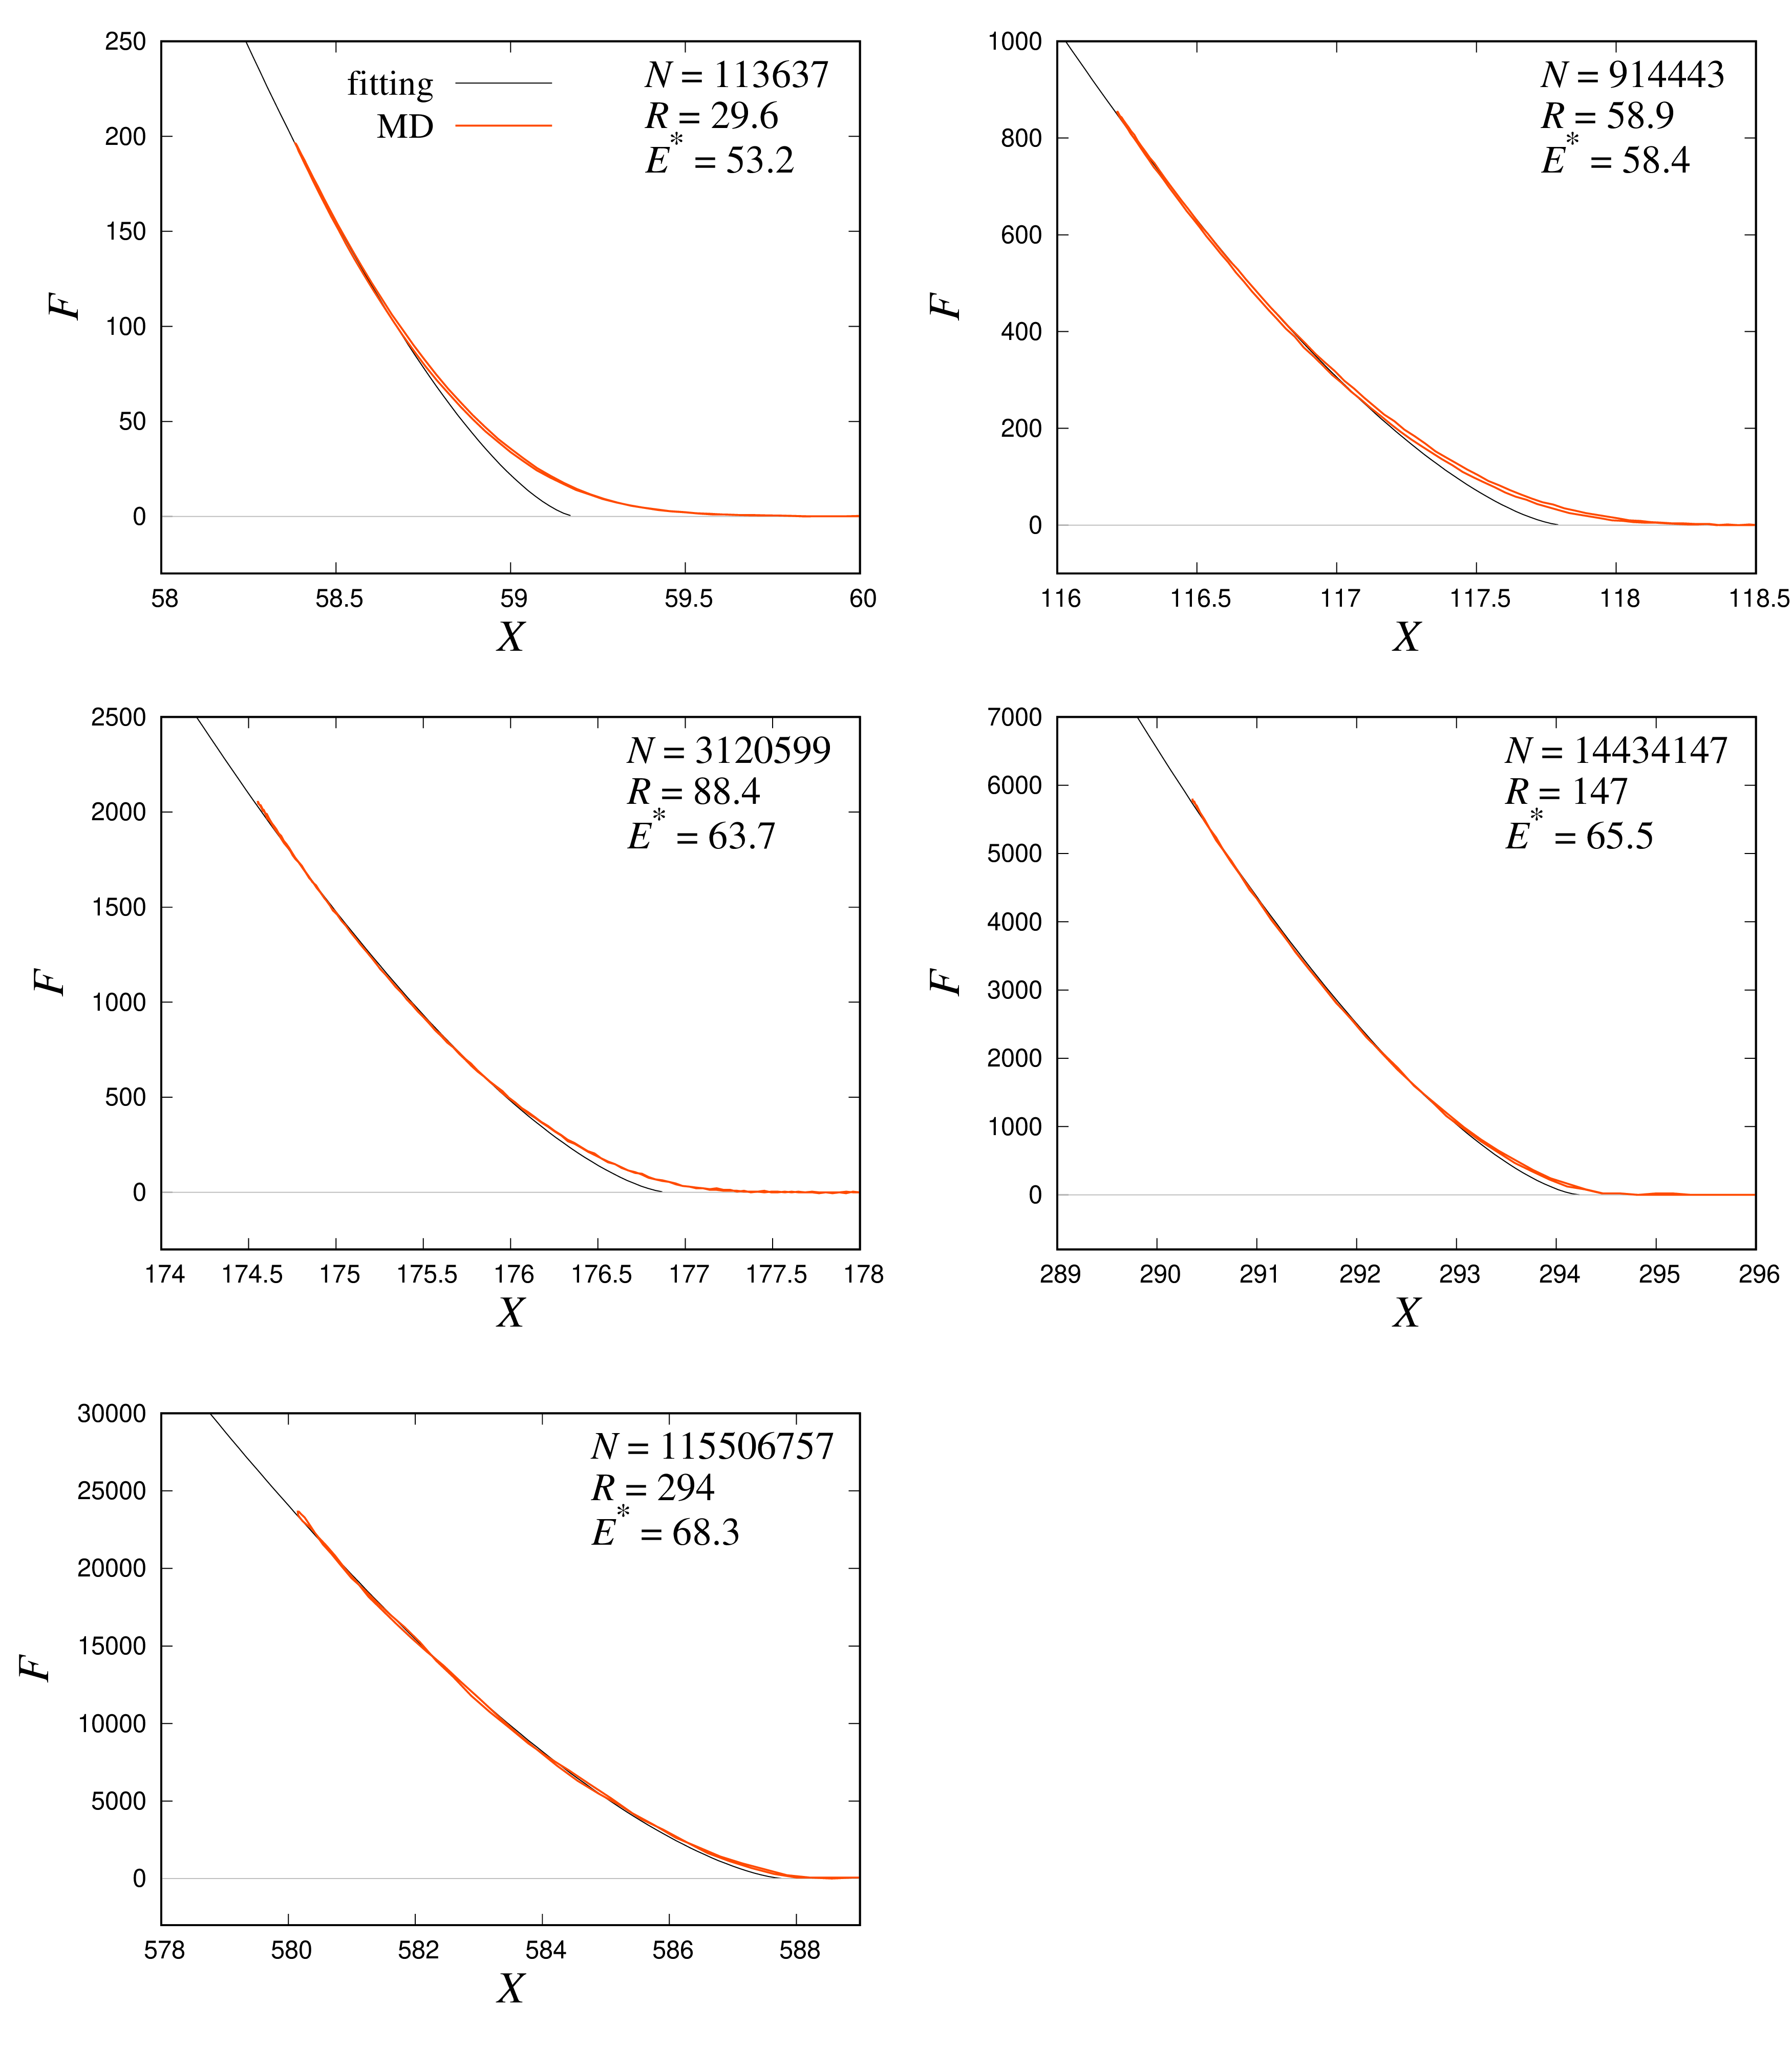
By simulating a Hertzian contact, we next determine the particle radius and the reduced Young’s modulus . In the Hertz theory, there are no adhesive forces between particles. To simulate a Hertzian contact, we therefore remove the attractive term between atoms belonging to different particles. By fitting to the Hertzian force, we can obtain and , which we represent in Table 2. The fitting procedures are shown in Appendix A. A previous simulation investigated the elastic constant of FCC LJ solid and showed [50]. Their obtained is smaller than that of our MD simulations due to their shorter cut-off length than ours. We adopt the surface energy as and Poisson’s ratio . The surface energy of the particle is derived as discussed in Appendix C. The sound velocity of the particles is calculated as . In this paper, we mainly treat the impact velocities less than a few % of the sound velocity ().
| 113637 | 29.6 | 53.2 |
| 914443 | 58.9 | 58.4 |
| 3120599 | 88.4 | 63.7 |
| 14434147 | 147 | 65.5 |
| 115506757 | 294 | 68.3 |
IV Results
IV.1 Interparticle force
IV.1.1 Hysteresis
We show an example of collision simulation with and in Fig. 1. The particle radius and impact velocity correspond to 50 nm and 15–50 m/s, respectively, in the physical units. We always use the LJ units, although we omit the symbols such as and from now on. From left to right, the panels show the particles in the initial stage, during the contact, and after the disconnection. After disconnection, the surfaces become rough because of the displacement of atoms. We calculate the center of mass of each particle and derive its velocity and acceleration by differentiating it with respect to time. The interparticle force is then obtained by multiplying the acceleration by the particle mass.
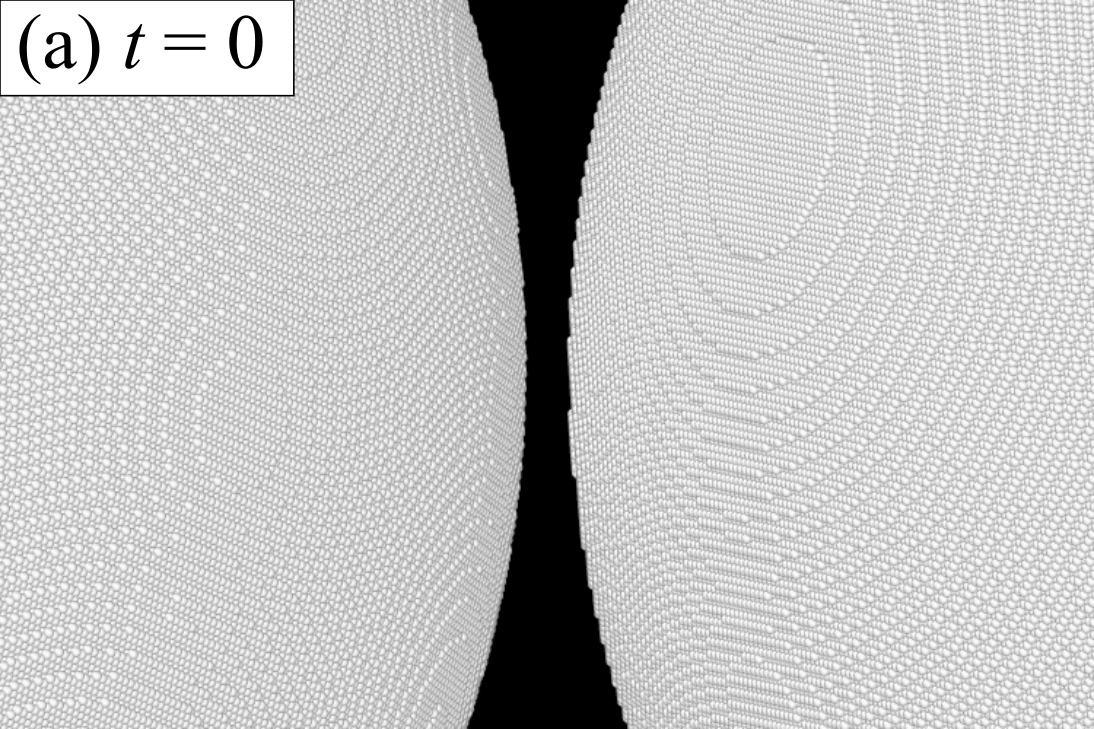
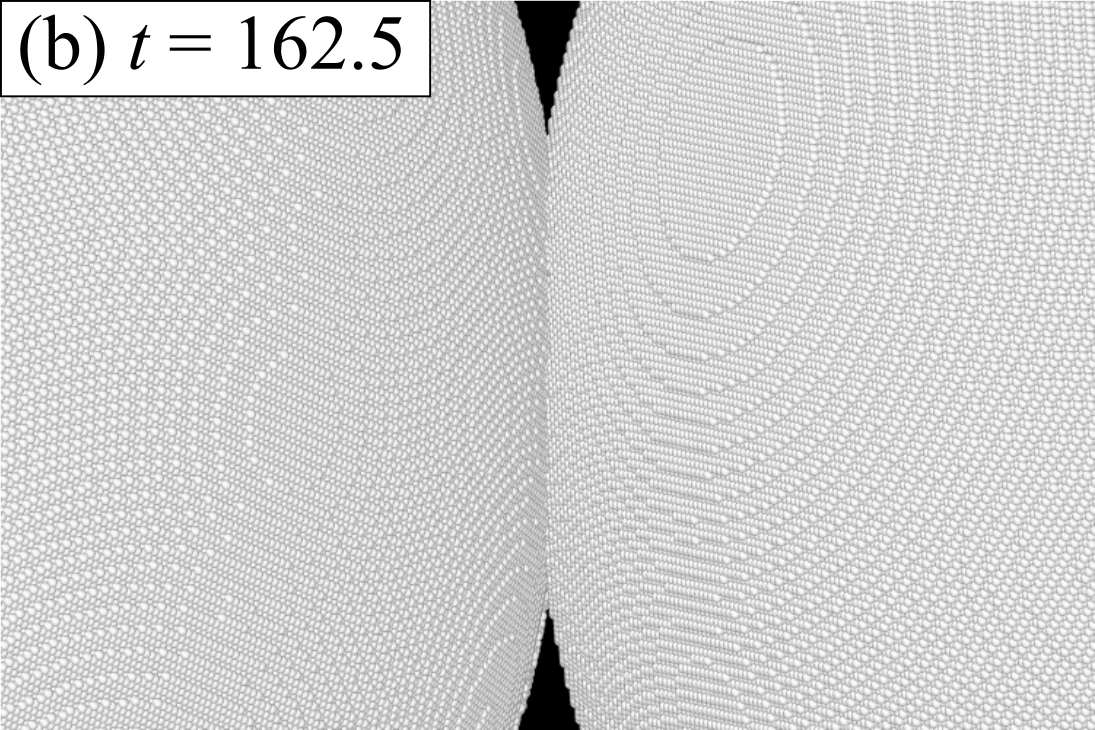
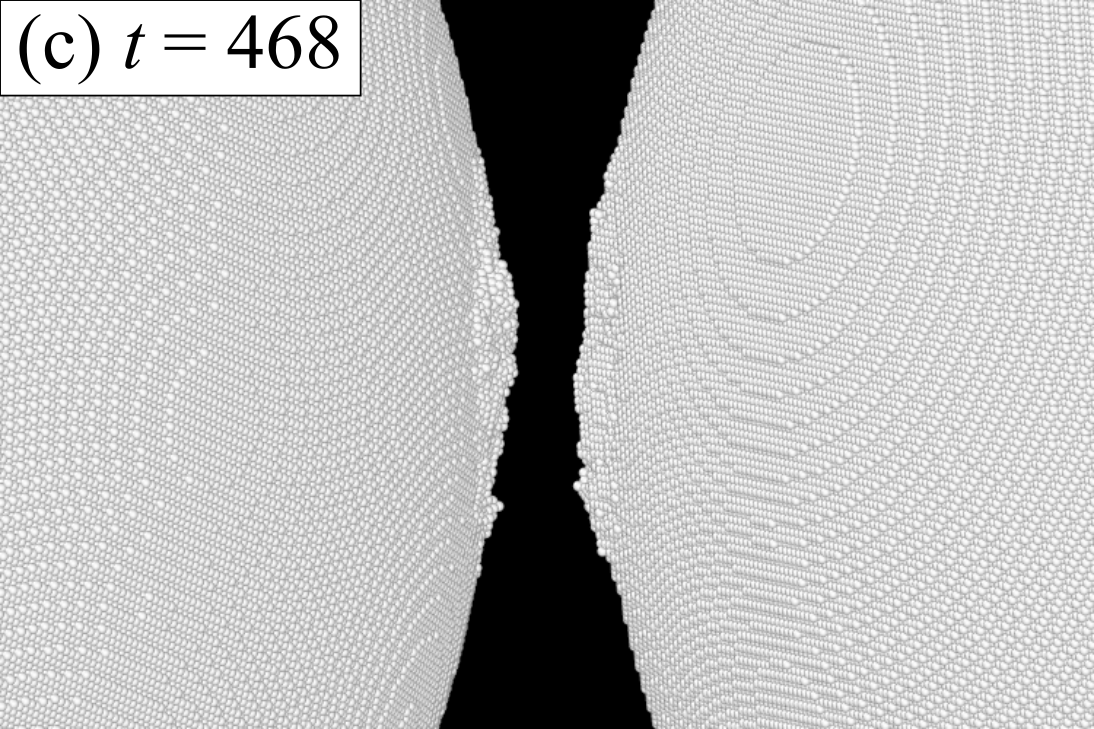
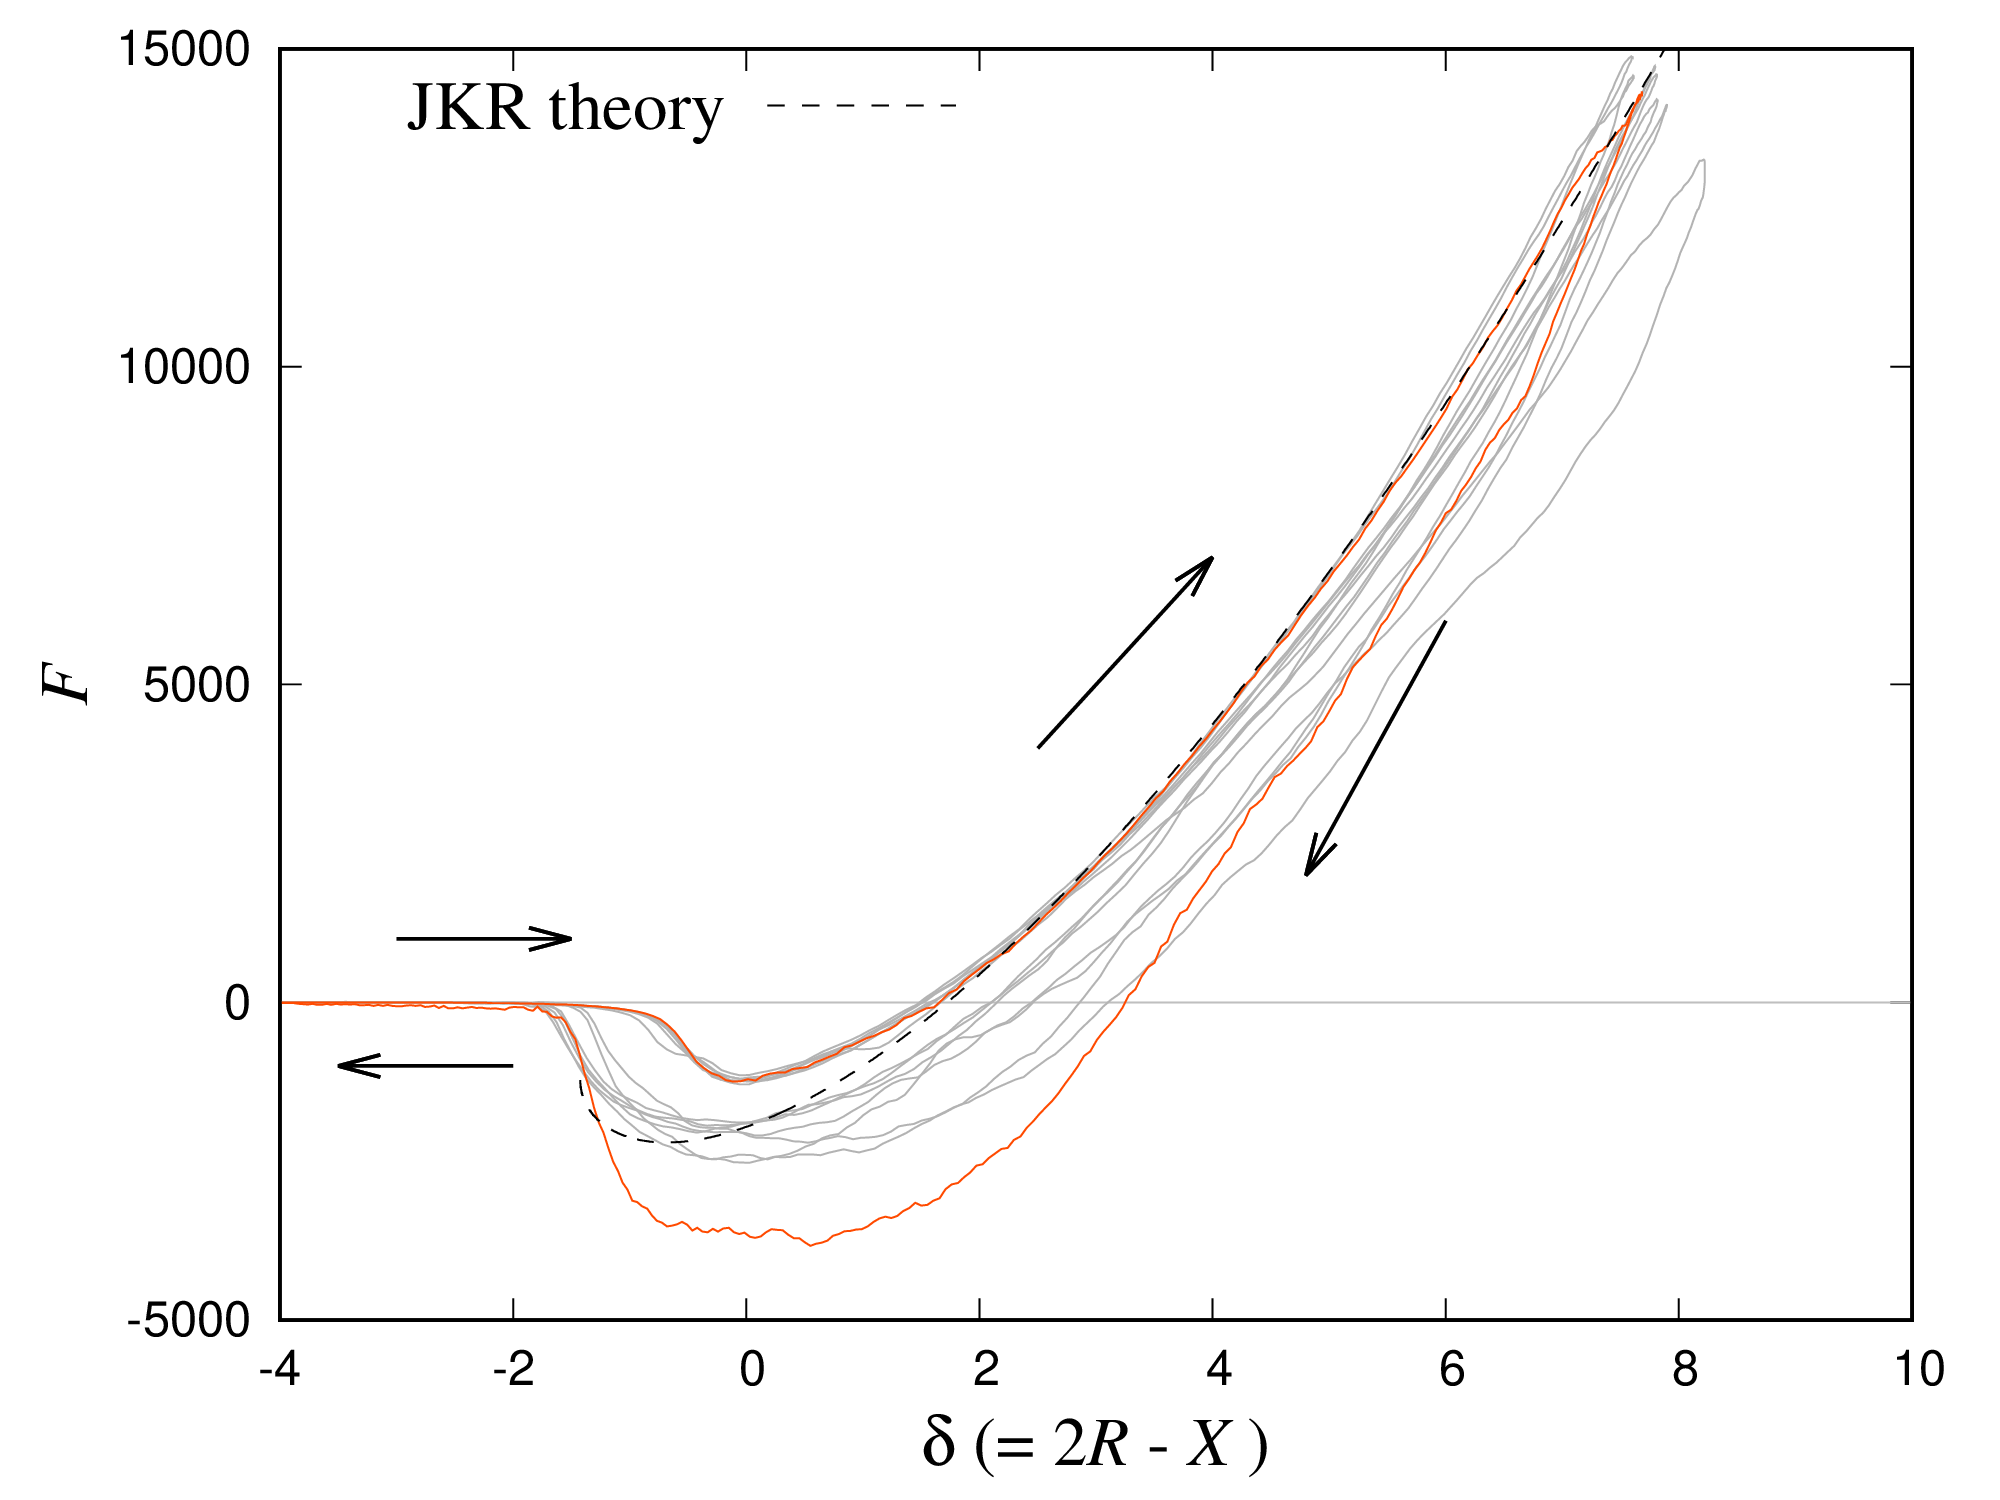
Figure 2 shows the interparticle force as a function of . The red curve shows the case illustrated in Fig. 1, the gray curves show the results obtained with different crystal orientations, and the dotted line shows the JKR theory. The unstable solution of the JKR theory is omitted in the figure since it is not stably realized in the actual contact process. In the JKR theory, the two particles are in contact at , disconnected at , and are in the stationary state at for . The maximum attractive force is for . The JKR force in both the loading and unloading phases follows the same curve, although the moments of connection and disconnection are different; this represents the hysteresis in the JKR theory. The two particles first approach each other, represented by increasing . A negative force acts on them when they come into contact because of the attractive molecular force. As they are compressed, the repulsive force increases with increasing , which is the loading phase. After the greatest compression, the two particles rebound, and decreases; this corresponds to the unloading phase. For becomes , the disconnection of the contact occurs; otherwise, the two particles coalesce, oscillating between loading and unloading.
In all the MD simulations, we find a difference between the loading and unloading phases, which is the hysteresis in the MD simulations. The example case discussed above has the largest hysteresis among eight runs. The collisional process depends on the orientations of each particle, and particles easily stick to each other when their orientations are similar [35]. Although the force in the loading phase agrees with the JKR theory, the force in the unloading phase differs from that in the loading phase. Figure 2 shows that hysteresis shifts the mutual approach toward larger in the unloading phase. Particle kinetic energy is dissipated by the area enclosed by the loading and unloading curves. We note that the total energy of the molecular system is conserved. The kinetic energy of particle translational motion is converted to the internal energy of particles. The energy conversion is discussed in detail in Section IV.3.
IV.1.2 Dependence on particle radius and impact velocity
Figure 3 shows the interparticle force as a function of for all radius cases with and 0.10. The particles coalesce for , and the force oscillates at a larger than in the JKR theory. For , the force paths of the loading and unloading phases are distinctly different and the force finally oscillates at , which indicates the occurrence of the plastic deformation. Focusing on the force difference between the loading and unloading phases normalized by , we see that it is about for and about 3-4 times as large as for . This trend is roughly consistent with the relationship as and , where we approximate , if the hysteresis comes from the dissipative force of the Krijt model. As the radius increases, the difference in force normalized by also increases. However, the effect of hysteresis becomes smaller as the radius increases since the kinetic energy, which is inertia, is proportional to .
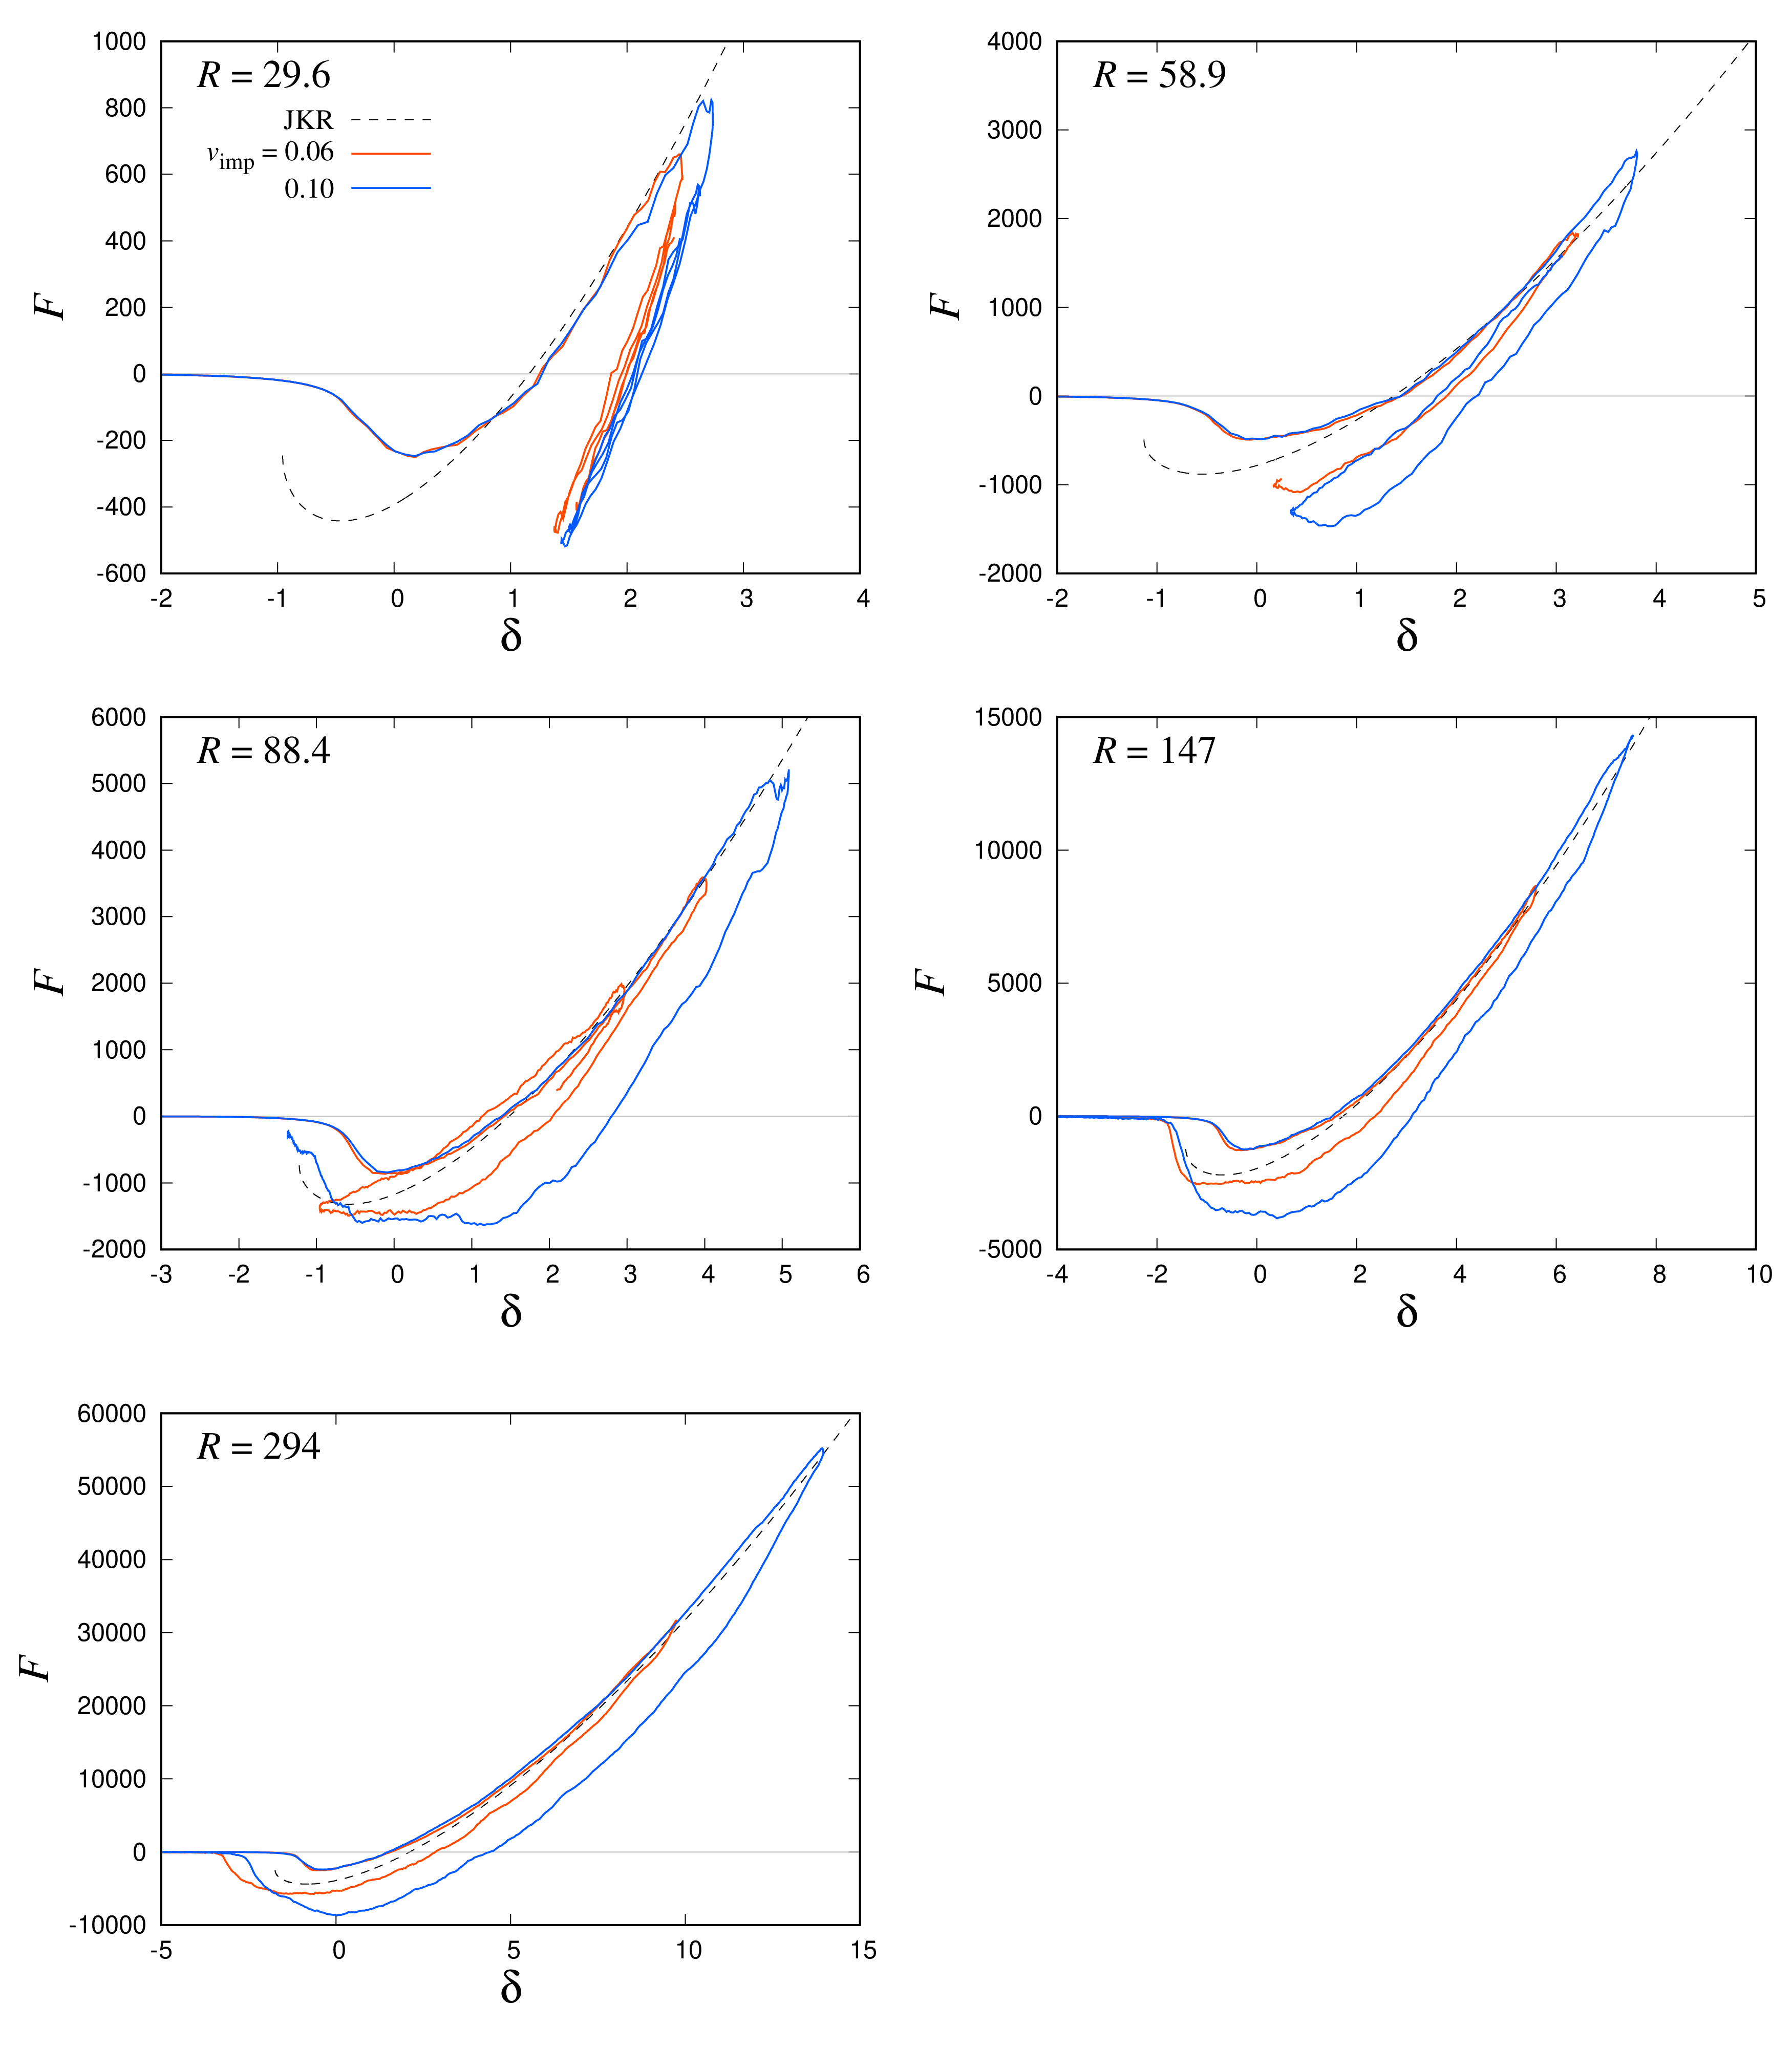
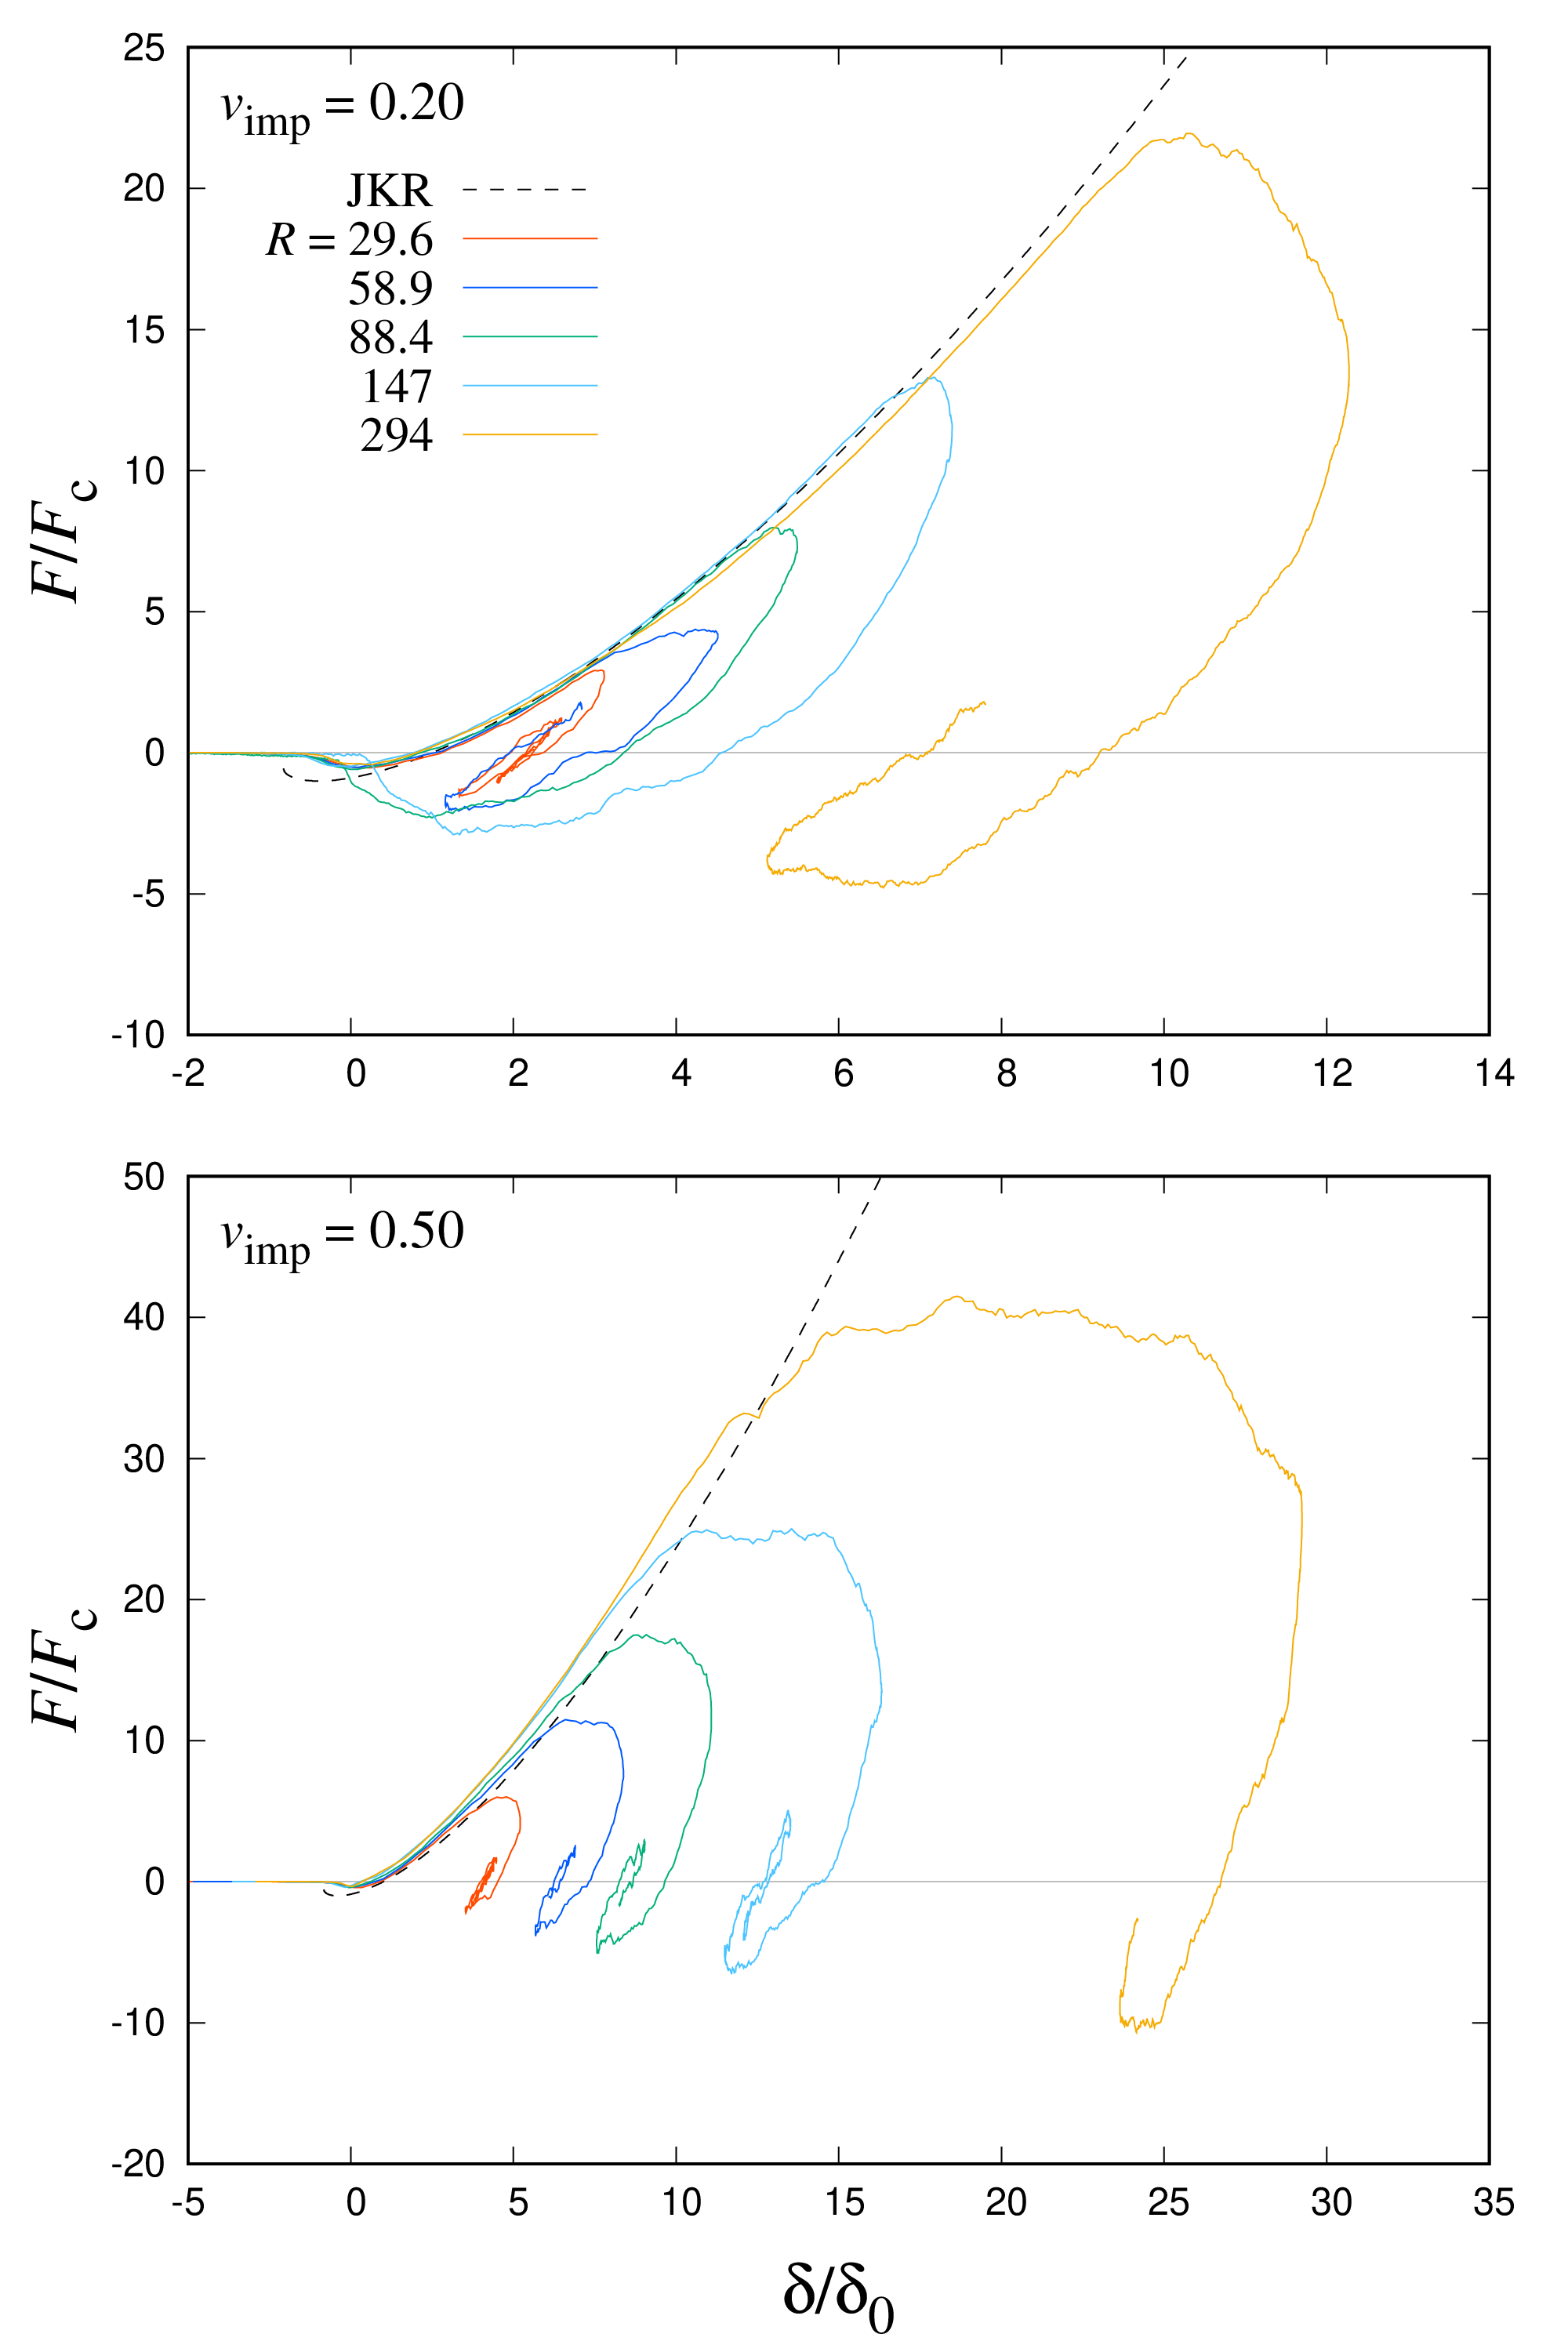
Figure 4 shows the interparticle force as a function of normalized by and for all radius cases with and 0.50. The hysteresis is clearly apparent in Fig. 4. Higher impact velocities cause significant shifts in in the unloading phase, resulting in stronger hysteresis. The significant shifts in for indicate plastic deformation. In all radius cases, the particles coalesce for with the remaining at large , which suggests strong plastic deformation. Though this figure shows the collision results with a particular orientation, such large shifts in occur and particles stick even for other orientations.
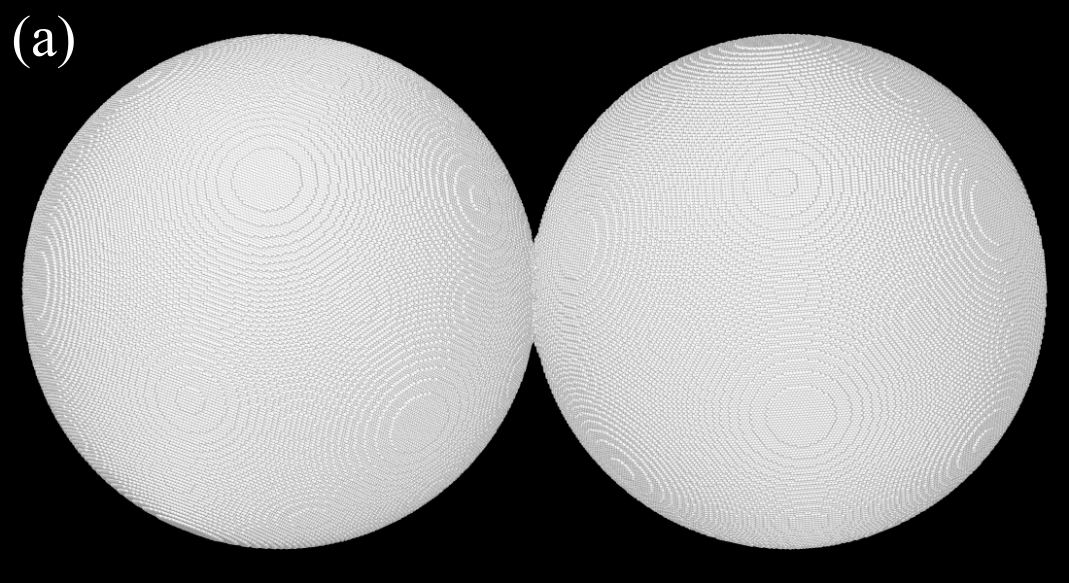
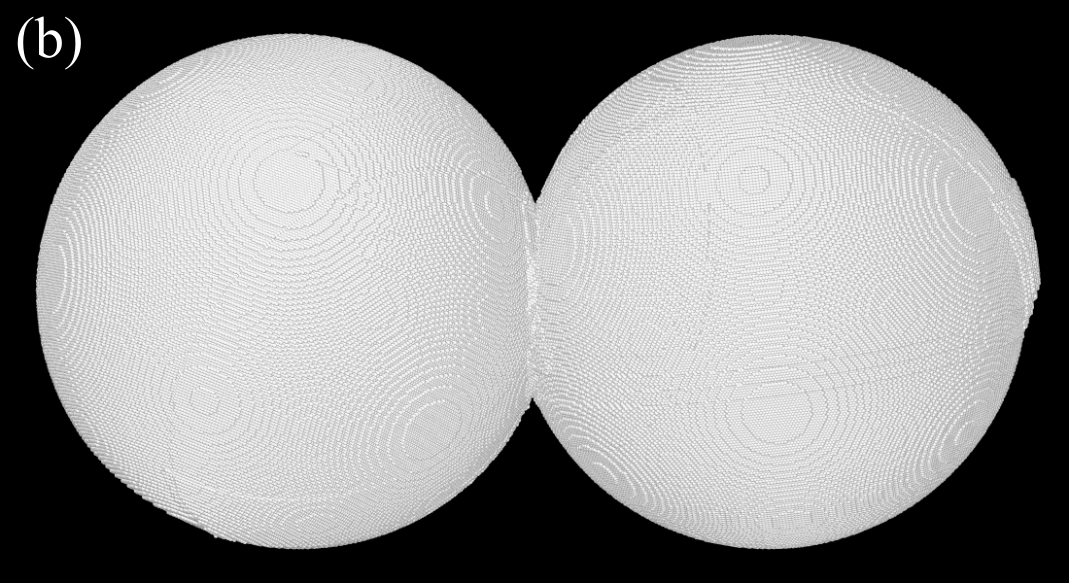
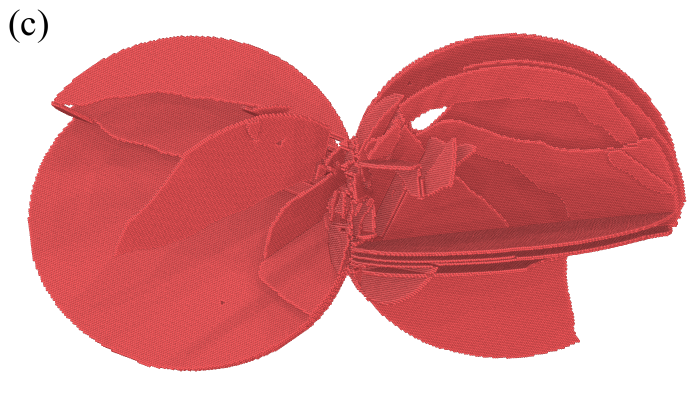
Figures 5a and b show images of particles with and 0.50 at the ends of the simulations for . The particles remain spherical for . In contrast, a bump is formed on the particle surface, and the contact area is increased for . This deep sticking causes a significant shift in in the unloading phase. The bump on the right-most particle in Fig. 5b is called an antipodal deformation. The atoms are pushed from the contact area to the opposite surface, forming the bump. Figure 5c shows the atoms that do not arrange in an FCC lattice structure, indicating cracks in the particles. The cracks are seats and extend from the contact surface in a planar state, which can be observed as the crack lines on the surface in Figure 5b. In particular, the crystal structure around the contact surface is extremely broken.
IV.1.3 Plastic deformation
Plastic deformation occurs due to stress acting on the contact area. The interparticle force in Figs. 3 and 4 shows possible plastic deformation at all impact velocities for and at all radii for . In this section, we estimate the pressure and verify whether it is sufficient to cause plastic deformation.
The onset of plastic deformation is determined by the yield strength . Takato et al. [20] performed MD simulations of collisions between non-adhesive particles and found a yield velocity of for , which corresponds to . On the other hand, the yield strength is theoretically given as for defect-free material [52, 22]. Spheres begin to deform plastically when the pressure at the center of the contact area reaches [15]. Then, the plastic deformation of particles is expected to occur for numerically and theoretically. We compare these values with maximum pressures between particles in our MD simulations.
The pressure at the center of the contact area can be estimated by eq. (4). Since from the energy conservation, the initial kinetic energy equals the Hertzian potential energy of eq. (3) at the maximum compression, the maximum can be estimated as
| (15) |
Combining eqs. (4) and (15), we can estimate the maximum pressure as for . We note that the estimated maximum pressure using the Hertz theory does not depend on the particle radius. For small particles, the Hertz theory underestimates and , and the JKR theory estimates them more accurately; for , with .
The pressure estimated above is less than the theoretical onset pressure of plastic deformation () but larger than that obtained by the previous MD simulation. The displacement of shown in Figs. 3 and 4 indicates the occurrence of the plastic deformation. Therefore, in this study, we use their onset pressure of plastic deformation.
IV.1.4 Contact radius
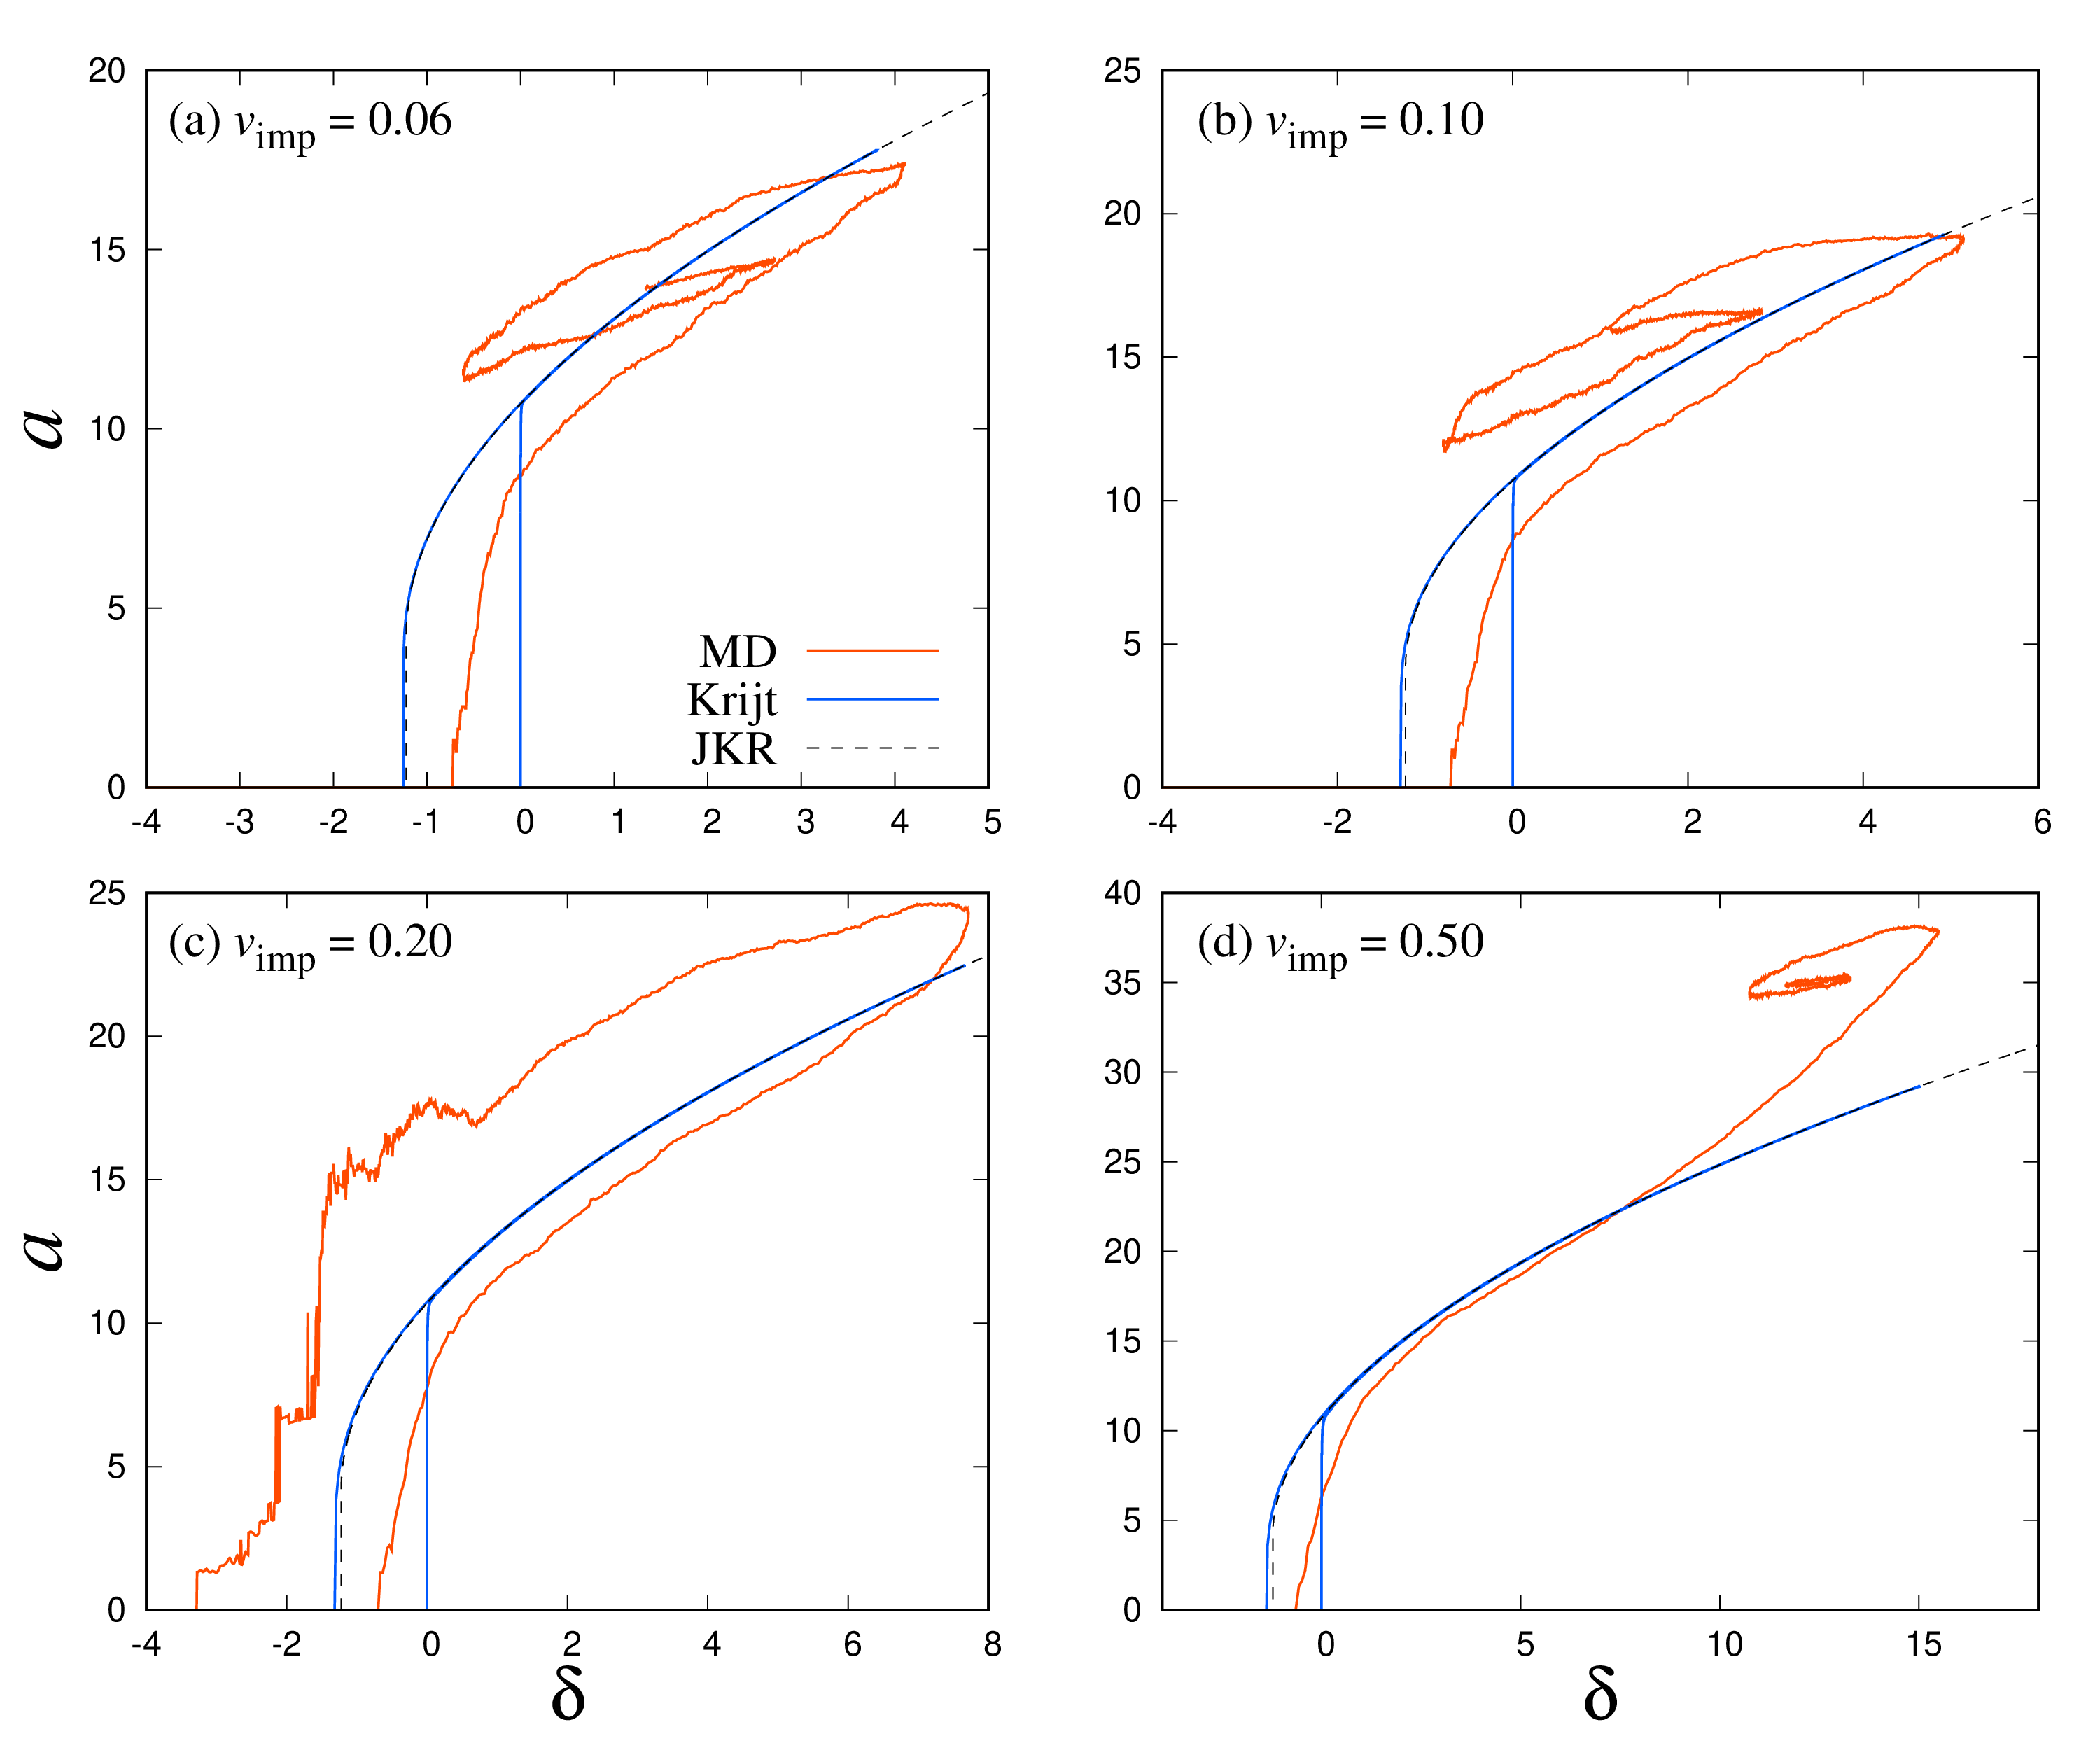
We calculate the contact radius using the gyration radius derived from the molecule distribution in a thin layer of the thickness 1 containing the contact surface. Let be the position vectors projected onto the contact surface for molecules in this layer. The gyration radius is given by , where and are the position of the center of mass and number of the molecules in the layer, respectively. Then, we obtain . Figure 6 shows the contact radius as a function of for . The contact radius of the MD simulations is smaller than that of the JKR theory in the loading phase and larger in the unloading phase, indicating the delayed and the hysteresis. The hysteresis of in the MD simulations is larger than that of the Krijt model, although the behavior of the contact radius evolution is similar to that of the Krijt model.
For the high-velocity collisions of , the contact radius increases around the most compressed point. For , the contact radius increases significantly around the most compressed point due to plastic deformation (see Fig. 6). Such an effect of plastic deformation is not considered in the JKR theory.
In the crack propagation model [e.g., 23, 22], is delayed due to the viscoelasticity, but the degree of delay predicted by the model is insufficient compared to that in the MD simulations. The model has the uncertainty of the relaxation time , which may cause the deference between the MD simulations and the model.
IV.2 Coefficient of restitution
IV.2.1 Dependence on the impact velocity
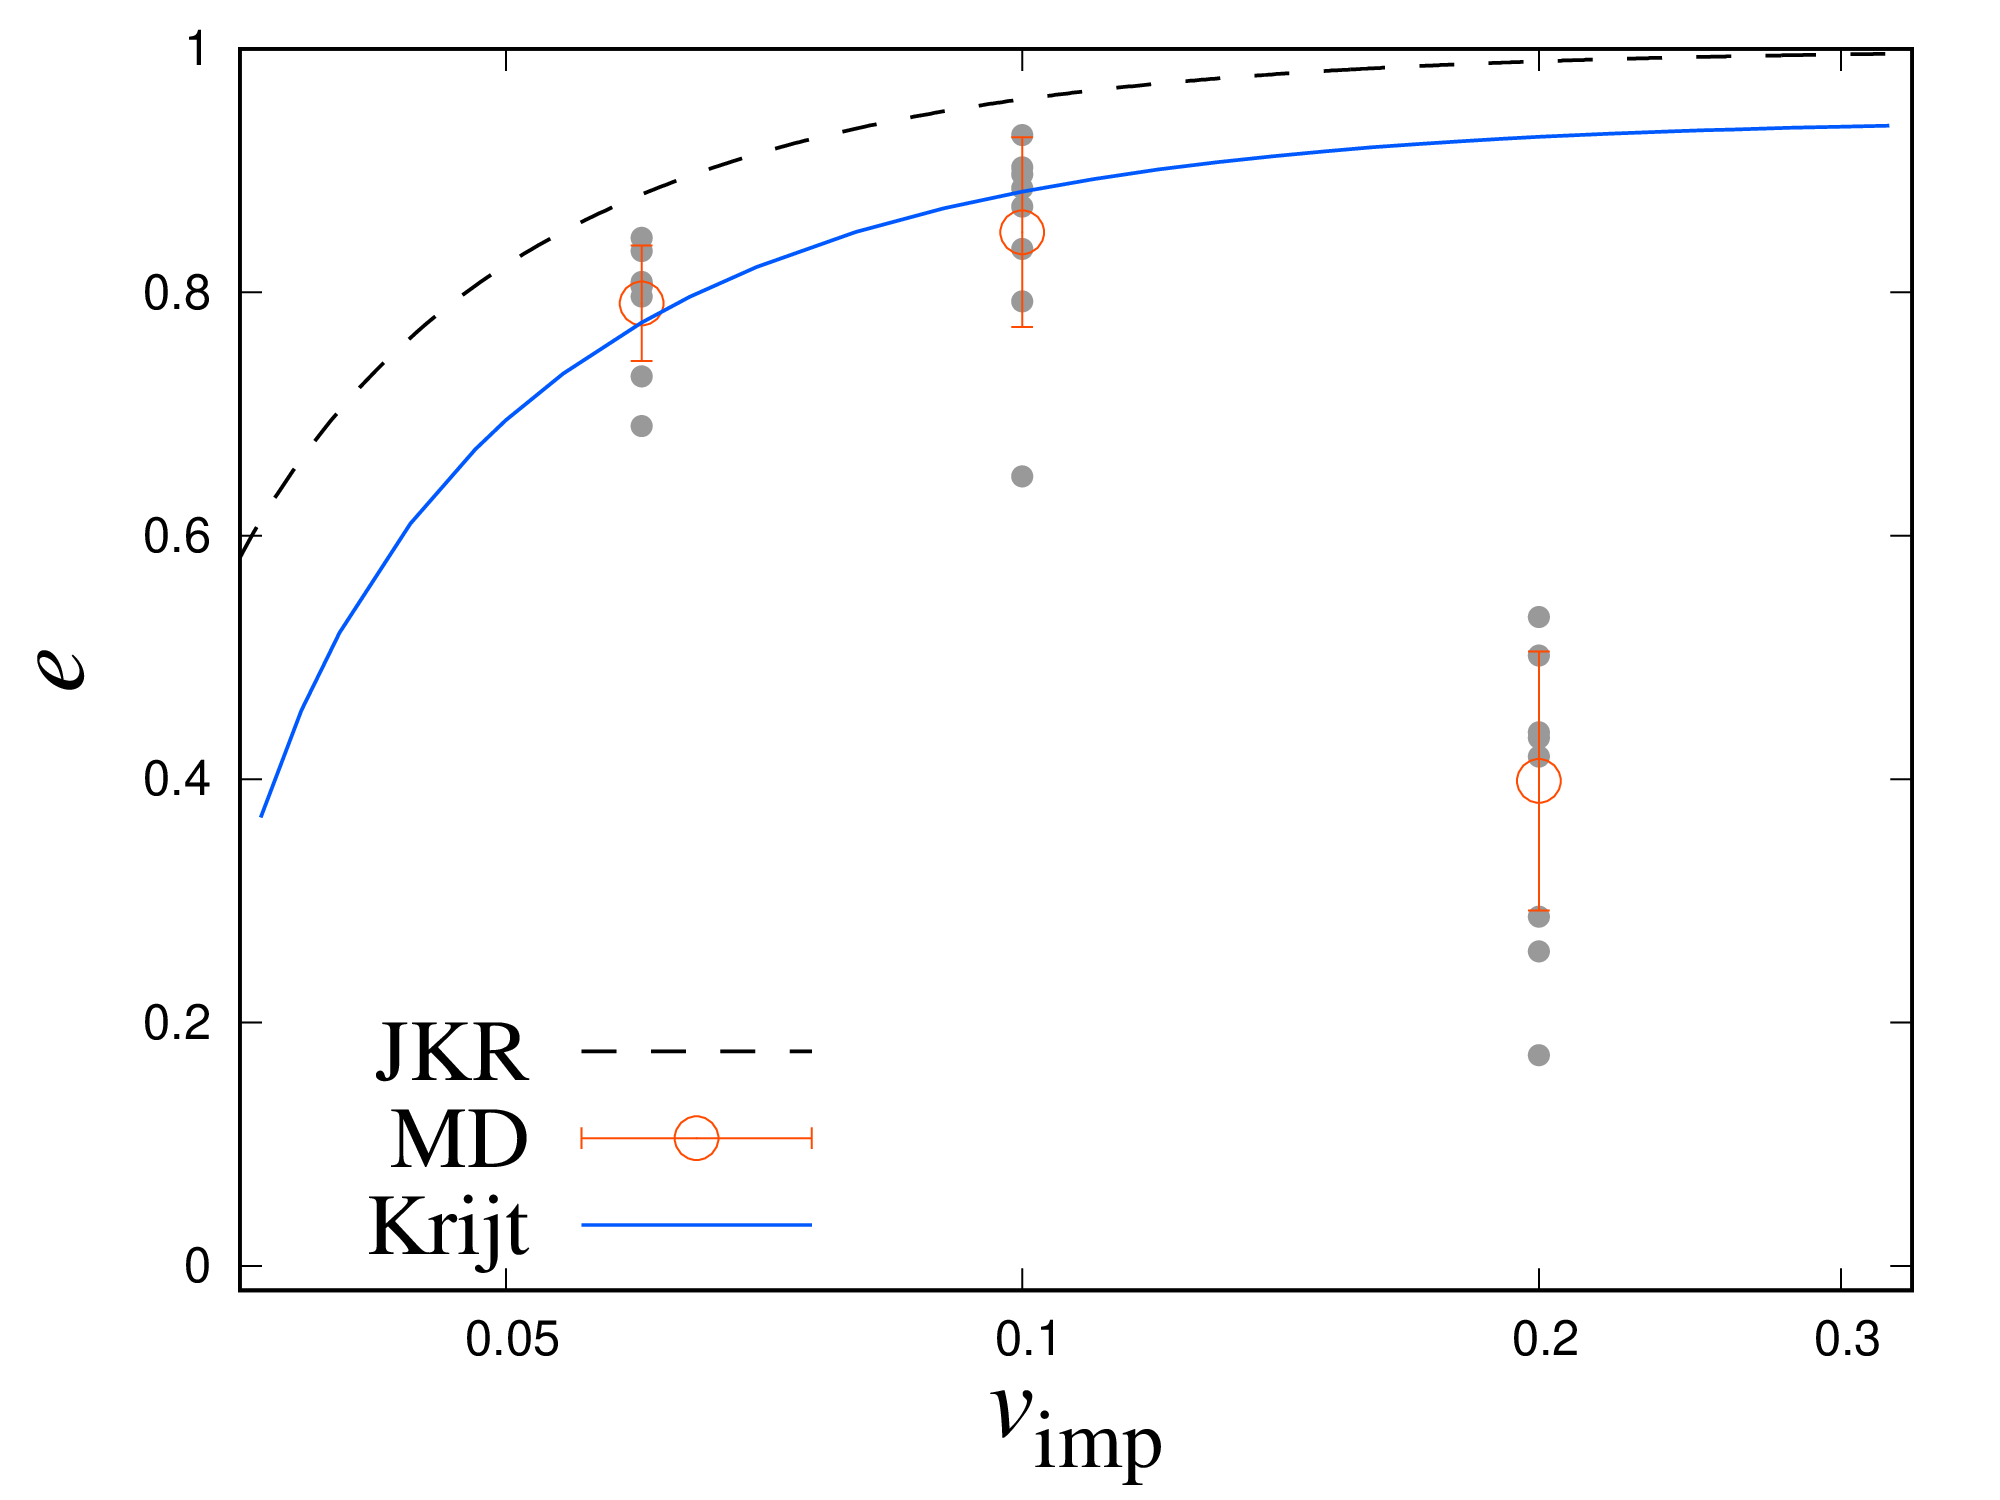
The coefficient of restitution (COR) provides an appropriate method for evaluating the effects of the kinetic energy dissipation of the translational motion. Figure 7 shows the COR for and 0.20 for particles with . A previous study suggested that the crystal orientation within the particles may significantly affect the collision results [35], consistent with Fig. 7. Figure 7 also shows that the COR of the MD simulations is smaller than that obtained from the JKR theory. As shown in Section IV.1, the hysteresis is larger for collisions with higher impact velocities, which leads to larger energy dissipation and smaller values of . Since the energy dissipation is independent of the impact velocity in the JKR theory, approaches 1.0 as the impact velocity increases. The Krijt model predicts larger energy dissipation than does the JKR theory because it includes the energy dissipation due to the hysteresis described in Section II.3. In Fig. 7, we set to fit the MD results with . This model can also reproduce the MD results for within the error bars, although it does not match for . This occurs because high-velocity collisions have large hysteresis, as shown in Fig. 4, causing to decrease as the impact velocity increases. A stronger energy dissipation occurs in the MD simulations than that caused by the model of plastic deformation.
Here, we compare our MD simulations with previous studies for velocity dependence. Nietiadi et al.[29] treated silica particles of nm radius. In their results, the COR has a peak similar to our MD simulations, but the peak is located where is 5-8 % of sound velocity, which is several times as large as that of our results, about 1 % of sound velocity. This difference is thought to be due to the difference in potentials: silica has covalent bonds and spherically asymmetric potential, whereas LJ atoms have non-covalent bonds and spherically symmetric potential. The LJ atoms tend to move tangentially to the contact surface and deform easily even at low impact velocities, and translational energy is easily converted to kinetic energy of atomic random motion. Therefore, the impact velocity where peaks in our simulations is smaller than that of previous studies. Nietiadi et al.[35] used LJ atoms as we do and examined for and showed the peak of at the same impact velocity. Tanaka et al.[19] examined the coefficient of restitution for only, and their results are consistent with that of this study. Few previous studies examined the particle collisions with and thus cannot be compared to our results. Our results indicate a strong dependence of the translational kinetic energy dissipation on the radii for .
IV.2.2 Dependence on radius
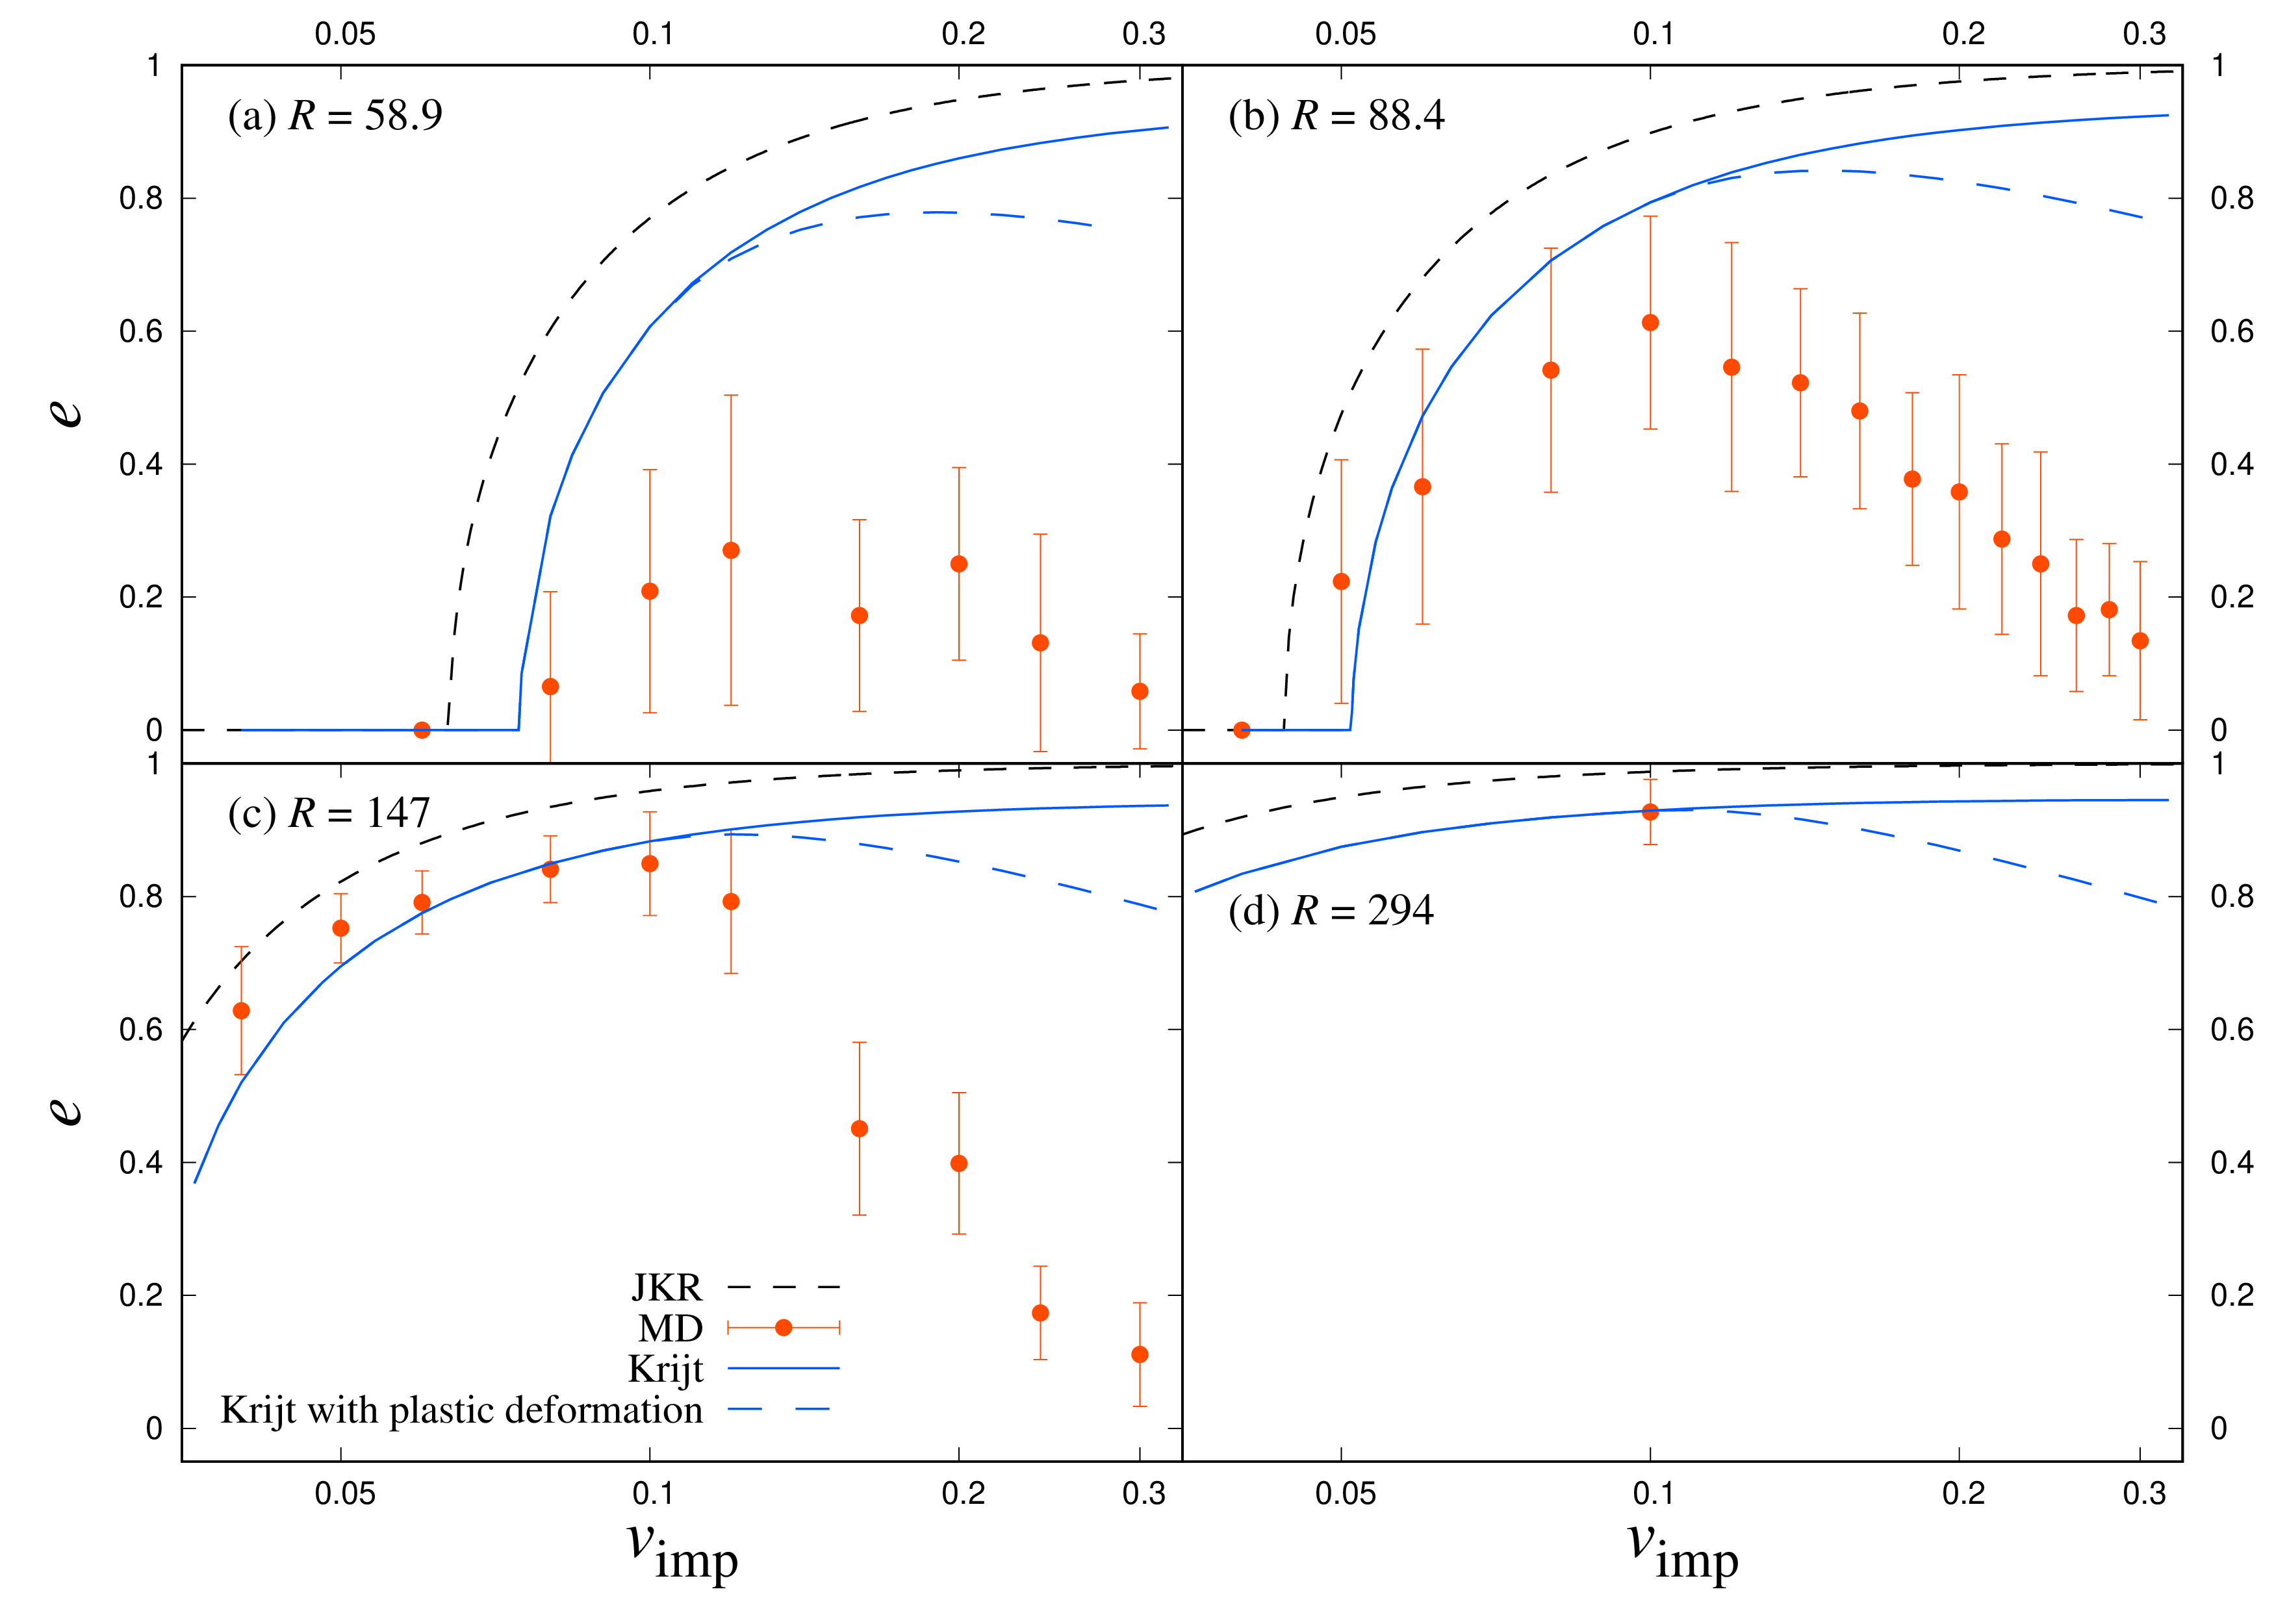
Figure 8 compares the COR obtained for and 294 as a function of with the results from the JKR theory and the Krijt model. For , all particle collisions result in coalescence. In the JKR theory, the collisions result in energy dissipation of , which means that collisions with smaller particles result in smaller because the translational kinetic energy is proportional to . In the MD simulations, decreases, and its deviation increases as the radius decreases. As shown in Fig. 3, the hysteresis is larger for smaller radii and higher impact velocities, which explains the trend of the COR in Fig. 8.
The coefficient of restitution obtained by the MD simulations for is the same as Tanaka et al. [19]. Nietiadi et al. [29, 34] also found that has the peak and weakly depends on the particle radius for radii between 10-20 nm, which corresponds to 30 and 60 in the LJ units. However, our MD simulations show that the results of collisions with and 58.9 are quite different; all collisions with result in coalescence while reaches for . The difference between the previous studies and our study comes from the interaction of molecules consisting of particles. The previous studies used silica nanoparticles in which covalent bonds bond Si and O atoms. Such a particle is expected to be more rigid and to have a larger Young’s modulus than that in particles composed of LJ atoms. Comparison to the previous studies suggests that the molecular bonds affect particle collisions well.
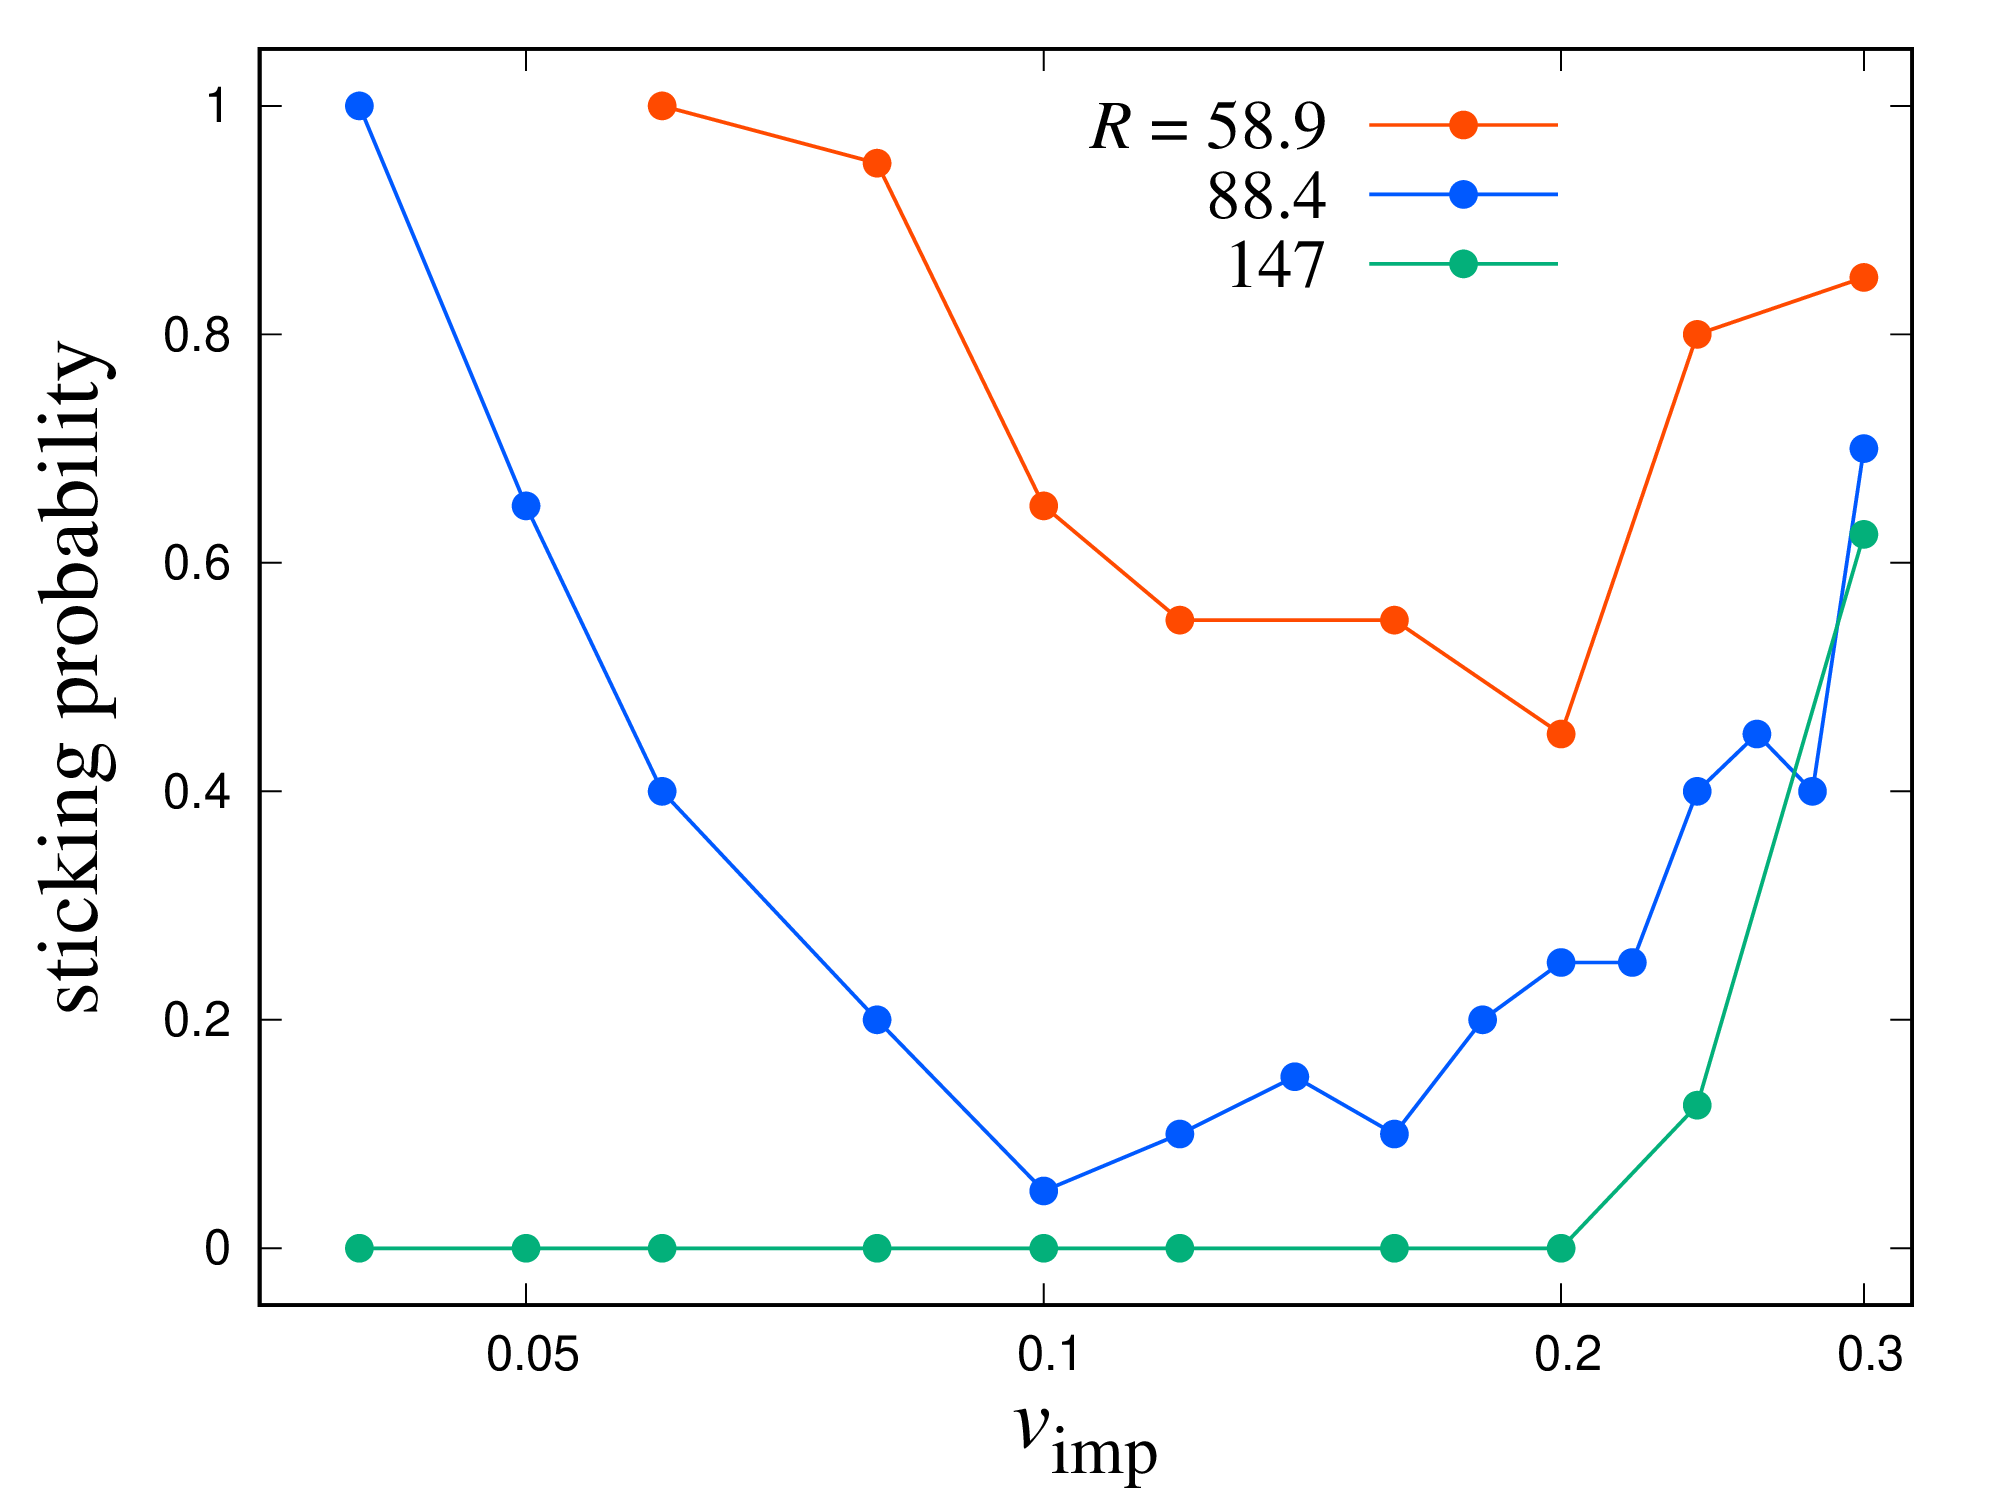
Figure 9 shows the sticking probability for each particle radius as a function of . For low impact velocities, smaller particles easily stick. The onset impact velocity for bouncing increases with decreasing particle radius. For , the sticking probability rapidly decreases since coalescence occurs with strong energy dissipation due to plastic deformation.
IV.2.3 Comparison with the Krijt model including the plastic deformation
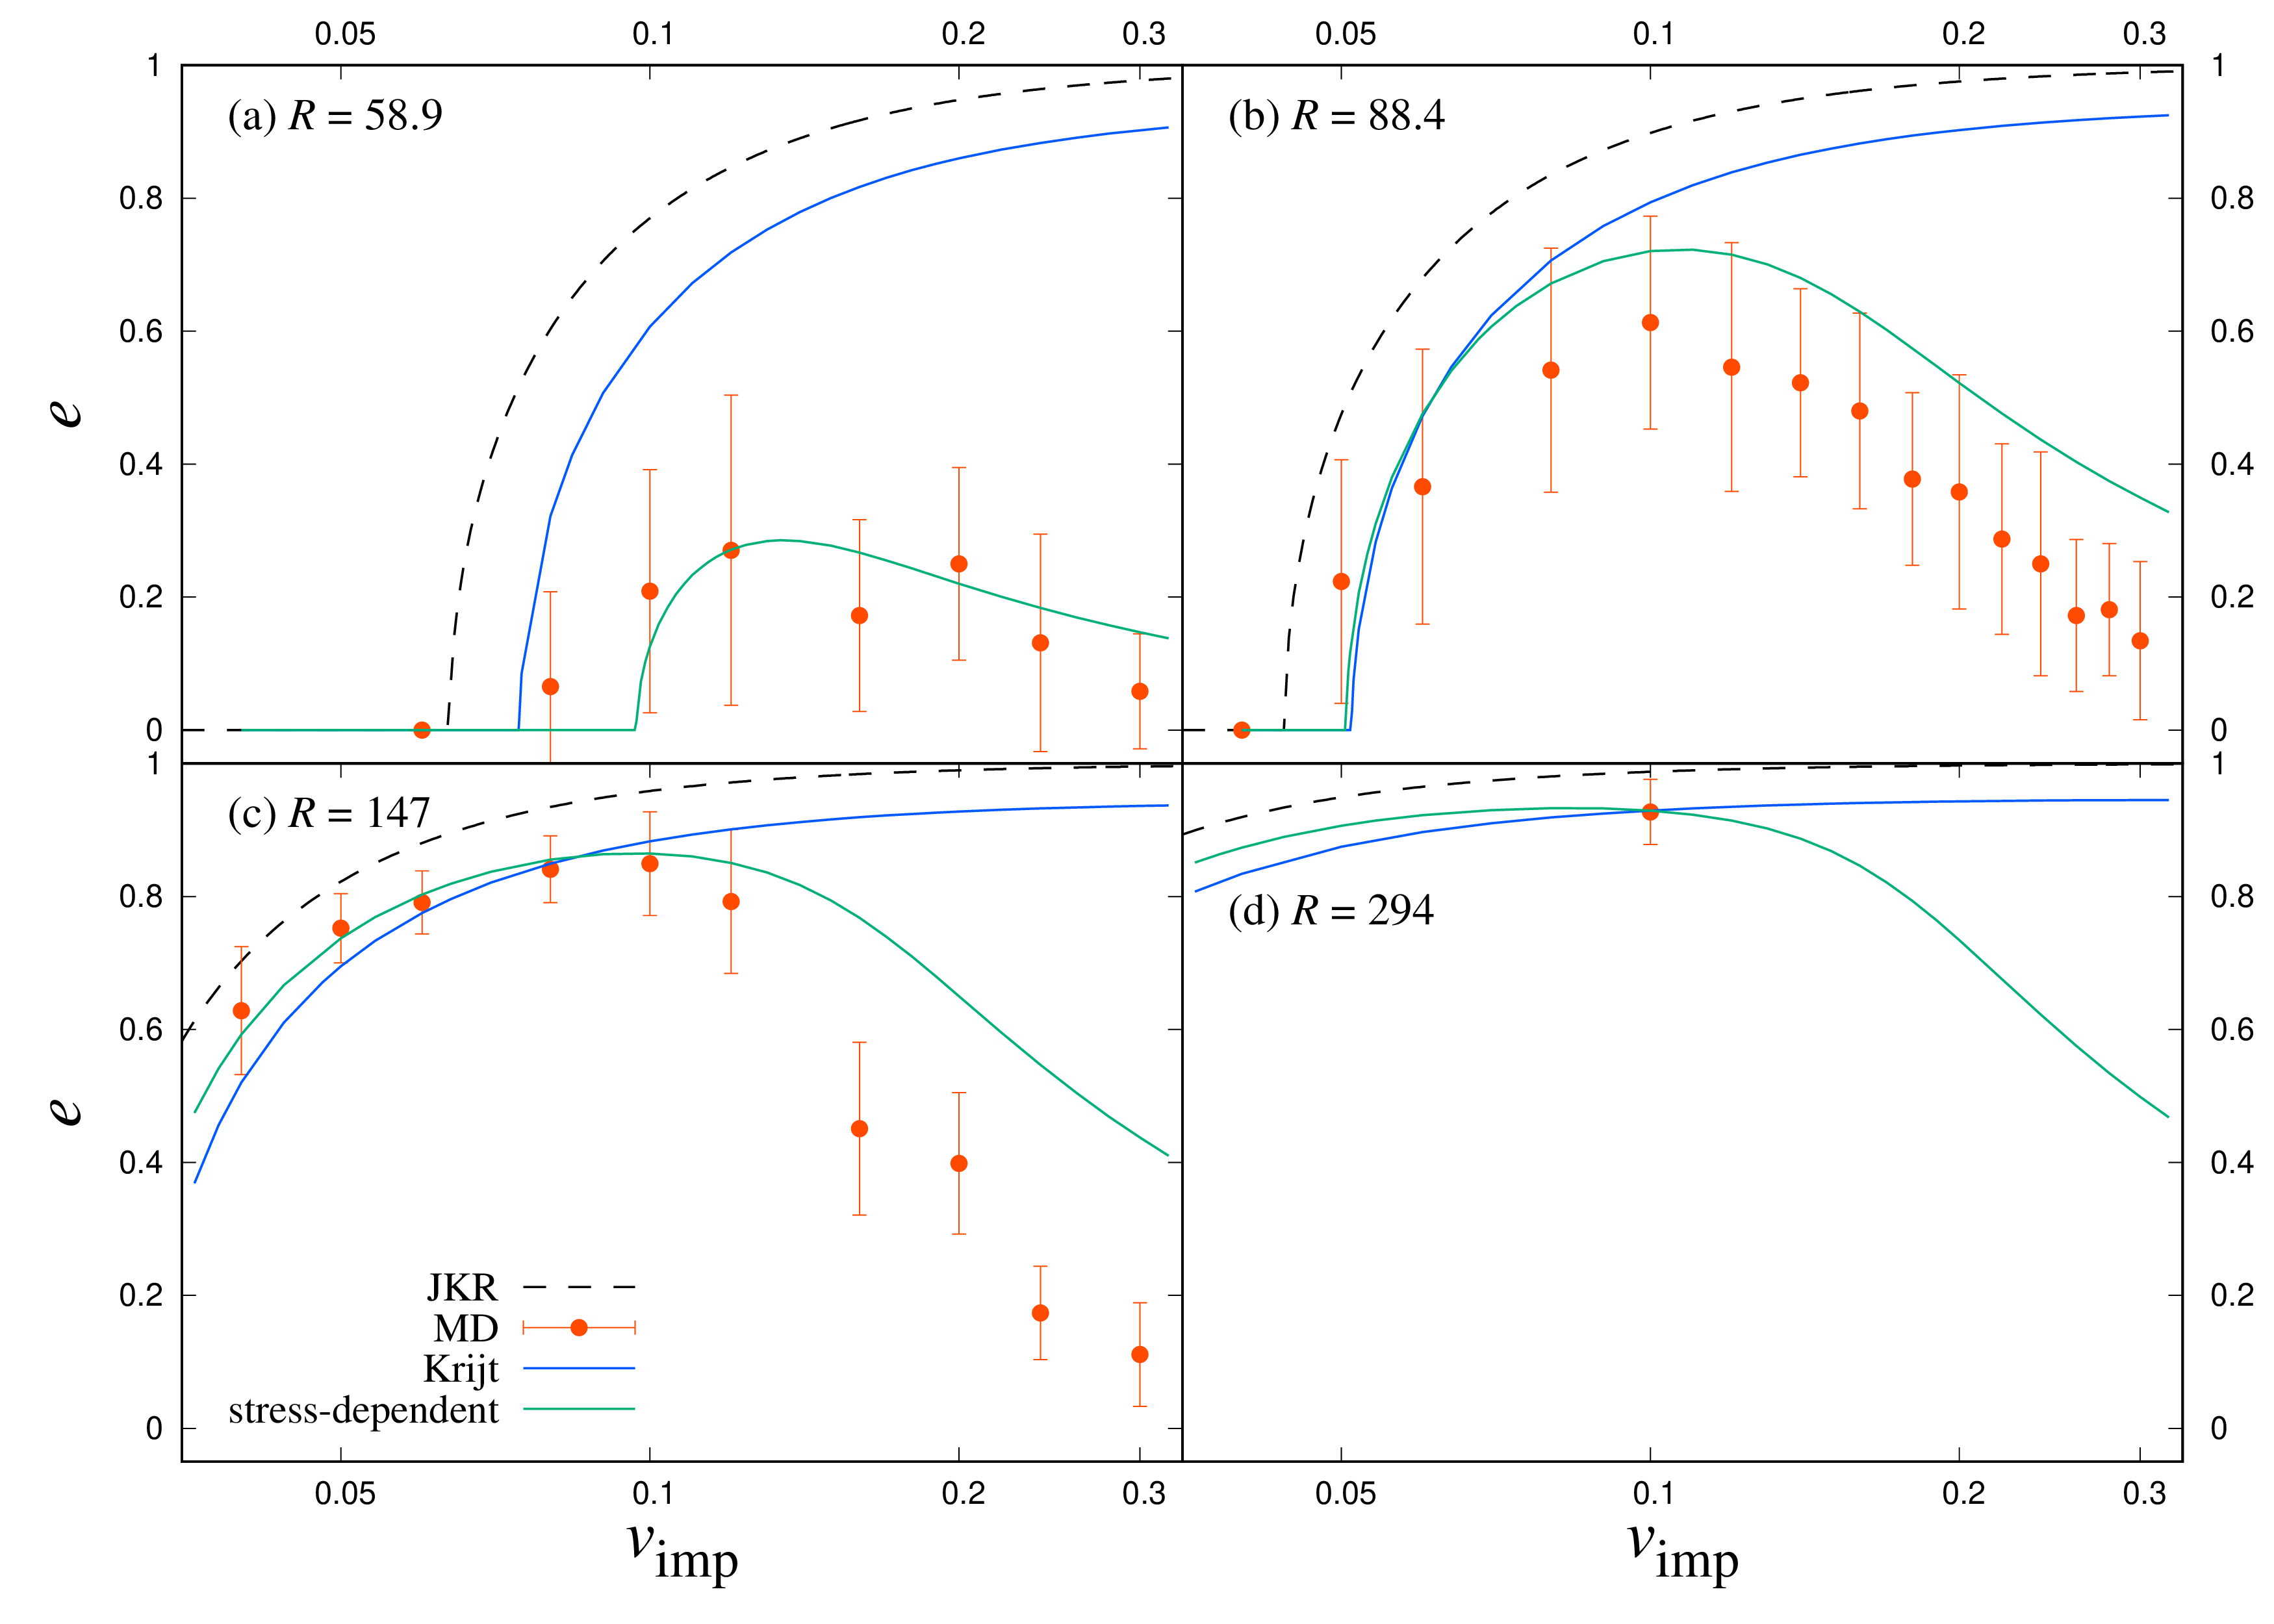
In the Krijt model, we set the relaxation time to be [22]. The Krijt model agrees well with the MD results for with and for with . For , the Krijt model reproduces the coefficient of restitution with to within the error bars but not that with . In other words, the Krijt model reproduces MD results only for low impact velocities and large radii.
The Krijt model considers the effect of plastic deformation based on Thornton and Ning [45]. The plastic deformation leads to decreased due to energy loss as shown in eq. (13). As discussed in Sec. IV.1.3, we employ obtained by Takato for the Krijt model with plastic deformation, and plot it in Figs. 7, 8, and 11. However, as shown in Fig. 8, the energy dissipation due to the plastic deformation of the model is insufficient to reproduce the MD results although the COR of the Krijt model with plastic deformation decreases with for . The value of is estimated from the Hertz theory, and the JKR theory is expected to give just slightly smaller. Consequently, the model curves are expected to shift to the lower left. However, the shift is not enough to be consistent with the MD simulations although the shift increases with decreasing particle radius. Even when the impact velocity is near or less than the onset velocity of the plastic deformation, more dissipation of the translational kinetic energy occurs in the MD simulations. In particular, the energy dissipation strongly depends on the particle radius and the Krijt model does not fit with this radius dependence. The results of this study indicate that collisions between particles with adhesion result in additional dissipation compared to the previous MD studies using particles without adhesion.
IV.3 Energetics
In molecular systems, the total energy is conserved, where and are the kinetic and potential energies, respectively. The kinetic energy can be divided into , where is the translational kinetic energy of the macroscopic particles and is the kinetic energy of random molecular motions; i.e., the thermal energy:
| (16) |
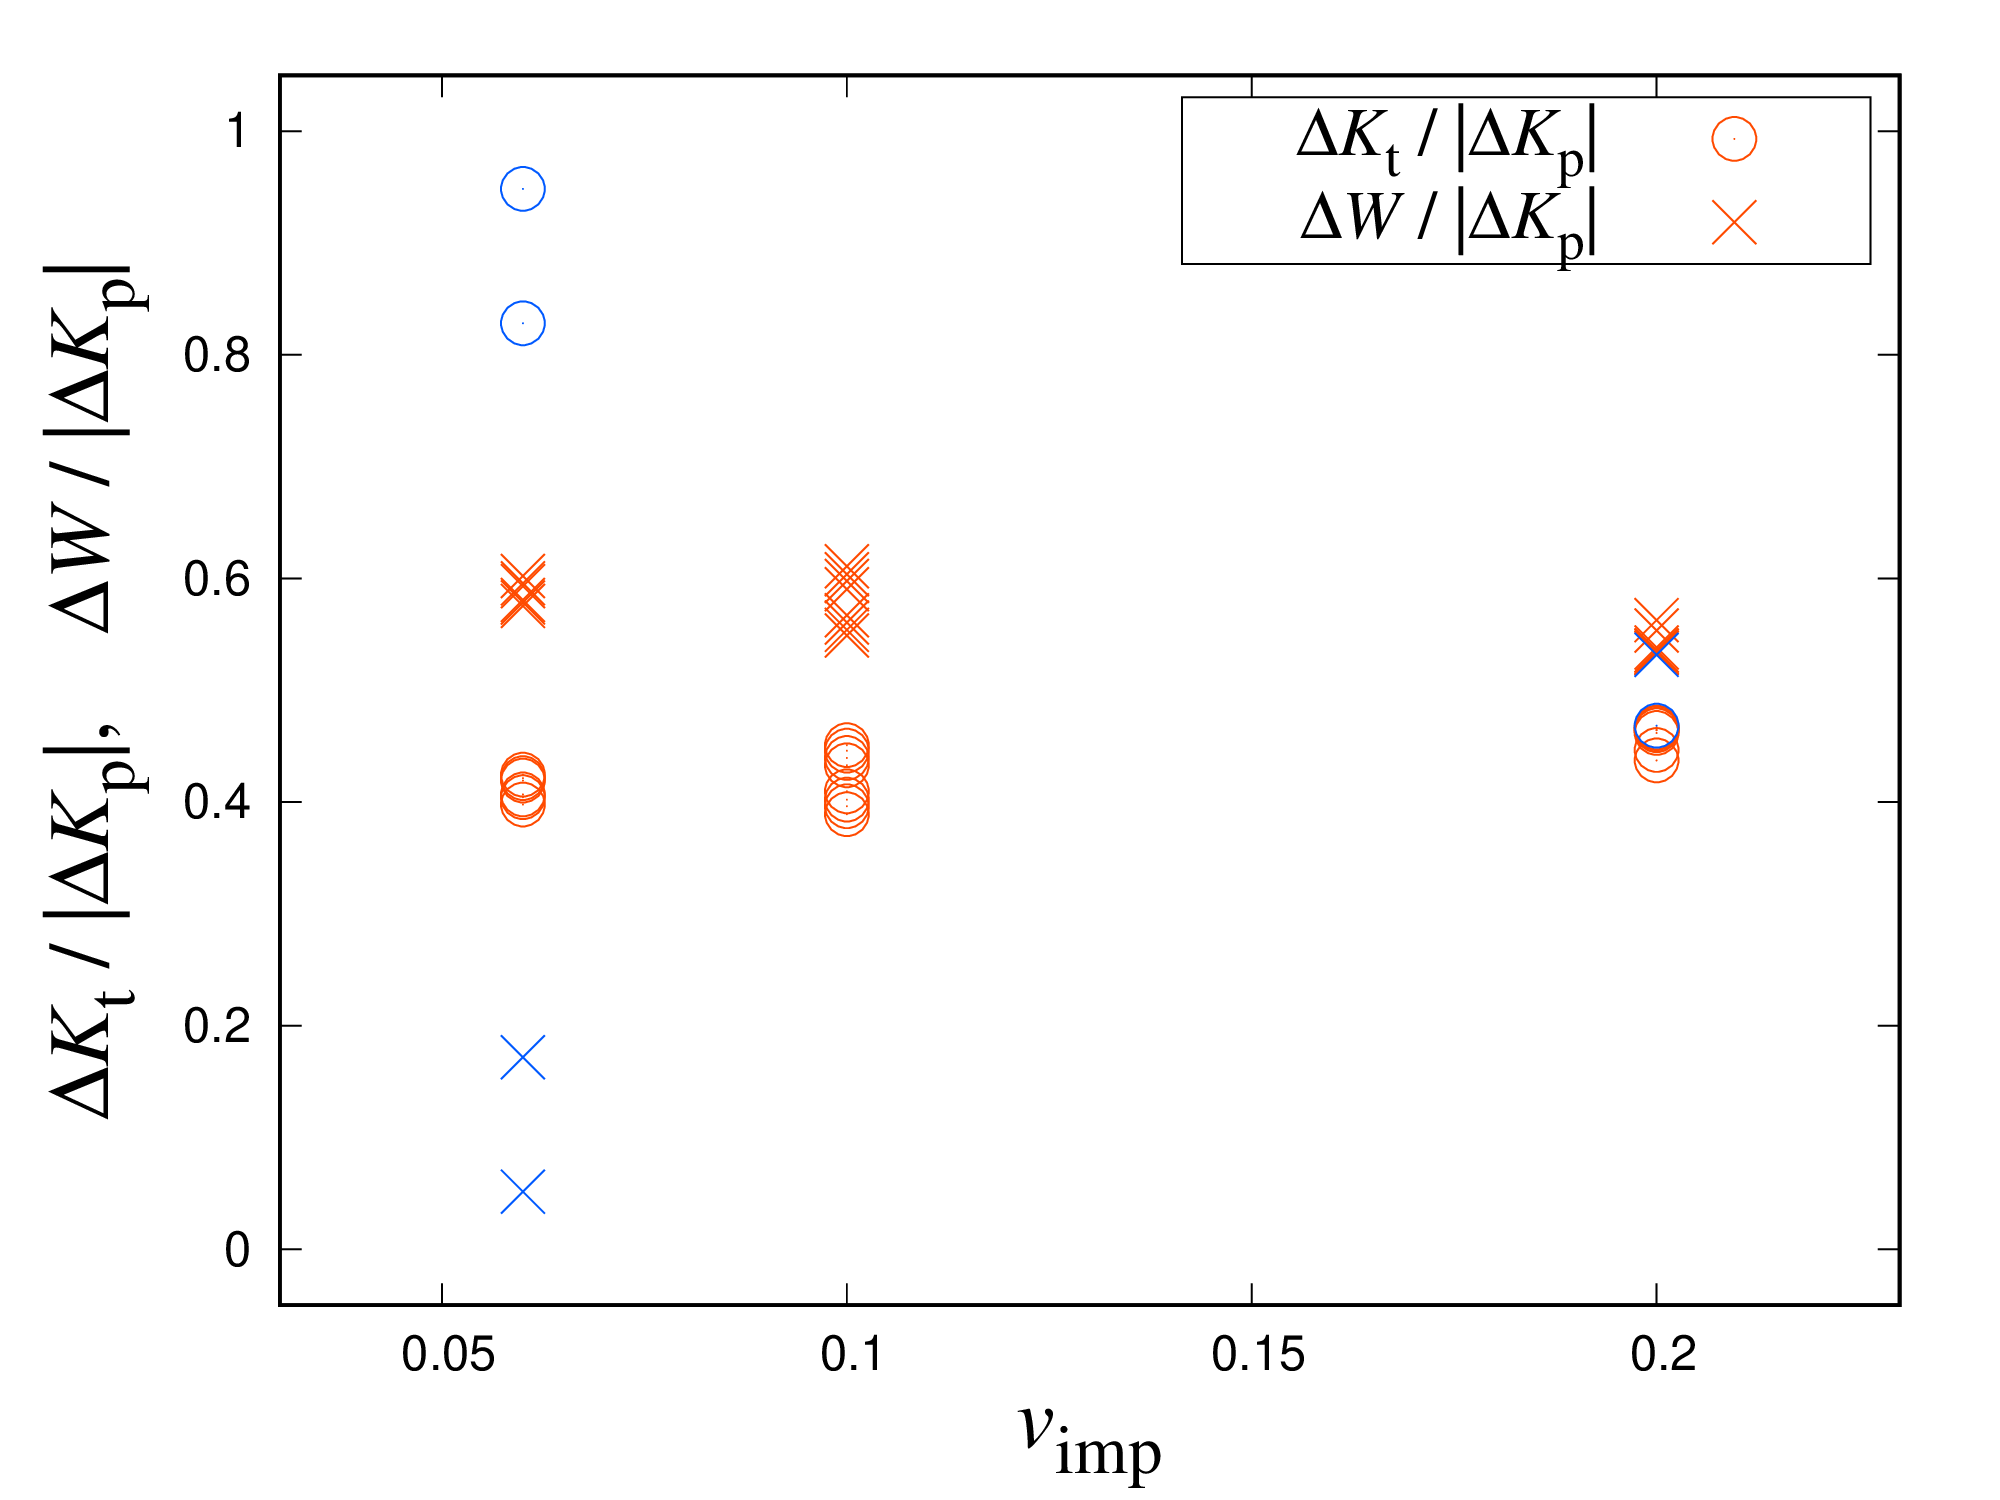
where and are the mass and velocity of the -th atom, and is the velocity of the center of mass of the macroscopic particle to which the -th atom belongs. Because the initial temperature of the particle is close to zero, at the end of each simulation is almost equal to the increase of the thermal energy . Bulk systems, such as those considered by the JKR theory, mainly discuss the bulk kinetic energy and do not consider changes in and . Here, we investigate the energetics of collisions in the MD simulations. Figure 10 shows and as a function of . The respective energy–conversion ratios are and when particles bounce and disconnection occurs. When particles coalesce, most of is converted to for low impact velocities. In this case, all of should be converted, but the change in is small at low impact velocities because barely any molecular displacement occurs. Thus, the coalescence results for are dominated by energy conversion to . On the other hand, at high impact velocities, , the energy conversion for the coalescing case is the same as that for a case in which disconnection occurs. The particles are deformed, and sufficient molecular displacements occur to dissipate the translational kinetic energy into both the potential and thermal energies: and . Assuming that the masses of the two particles after disconnection are the same as those before the collision, the kinetic–energy ratio of the particles is . We have confirmed that in all results, which means that fewer molecules move between the particles and that the particle masses before and after the collisions are approximately the same.
V New dissipation models
As shown in Sec. IV.2, our MD simulations of particle collisions have stronger energy dissipation than those predicted either by the JKR theory or the Krijt model. In particular, for high impact velocities with and for small particles with , the CORs are much smaller than those predicted by the Krijt model. Here, we propose two new dissipation models that reproduce the energy dissipation in our MD simulation results.
V.1 Stress-dependent dissipation model
The dissipative force of the Krijt model is in qualitative agreement with the ratio of obtained by the MD simulations, as discussed in Section IV.1.2. However, for the coefficient of restitution , the MD simulation results do not agree with the Krijt model. Therefore, we discuss what the Krijt model lacks and modify the model to reproduce .
The large energy dissipation that occurs in high-velocity collisions may be due to the high stresses in such collisions. Using eq. (4) and (15), we find the pressures at maximum compression to be and for and 0.20, respectively in the case with . The maximum pressures predicted by the JKR theory are and for and 0.20 for . Because Young’s modulus is about twice as large as , the induced pressures are . Such high pressures can cause plastic deformation and, thus, strong energy dissipation. This estimate agrees with the strong energy dissipation observed in our MD simulation for high-velocity collisions. On the other hand, for small particles, the pressure is not small even at the stationary contact with . In fact, for and , the pressure is obtained as from eq. (9). The JKR theory predicts for and . Thus, for small particles with , the induced pressure can cause plastic deformation even in low-velocity collisions. This is consistent with the small values of COR shown in Fig. 8a.
We, therefore, propose a new, stress-dependent dissipation model to reproduce the strong energy dissipation that occurs under high stress in particle collisions. In this model, we adopt the same formula for the dissipation force as in the Krijt model (eq. (12)), although the relaxation time now depends on the pressure at the center of the contact area, as
| (17) |
where and are coefficients and is a power-law-index. The pressure at the center of the contact area is given by eq. (9). The relaxation time is linear in the particle radius:
| (18) |
where is a coefficient. We adopt the exponential form of on to express the strong energy dissipation dependent on the stress. Using eq. (17), we solve eq. (23) and (10) to investigate the evolution of the contact radius and the relative motion of two particles. Then, we search for optimal values of , and in the range of , and to fit our model to the MD simulation results.
Figure 11 shows the fitting results obtained with and . Since for , we obtain . The relaxation time is almost the same as that in the Krijt model. This new model is consistent with the MD simulation results well for and 294. The new model also reproduces the MD simulation results in the range for and for . Compared with the Krijt model, the new model better reproduces the MD simulation results for and the COR peak for and for low impact velocities. These fitted values are expected to depend on the potential. For example, in the case of silica, the pressure at which deformation occurs is expected to be greater than for LJ atoms, and then is expected to be smaller than that for LJ atoms. At high impact velocities, there appear to be some discrepancies between the model and the MD simulations. To achieve a more accurate reproduction at high-velocity collisions, it may be necessary to handle plastic deformation in a more precise way.
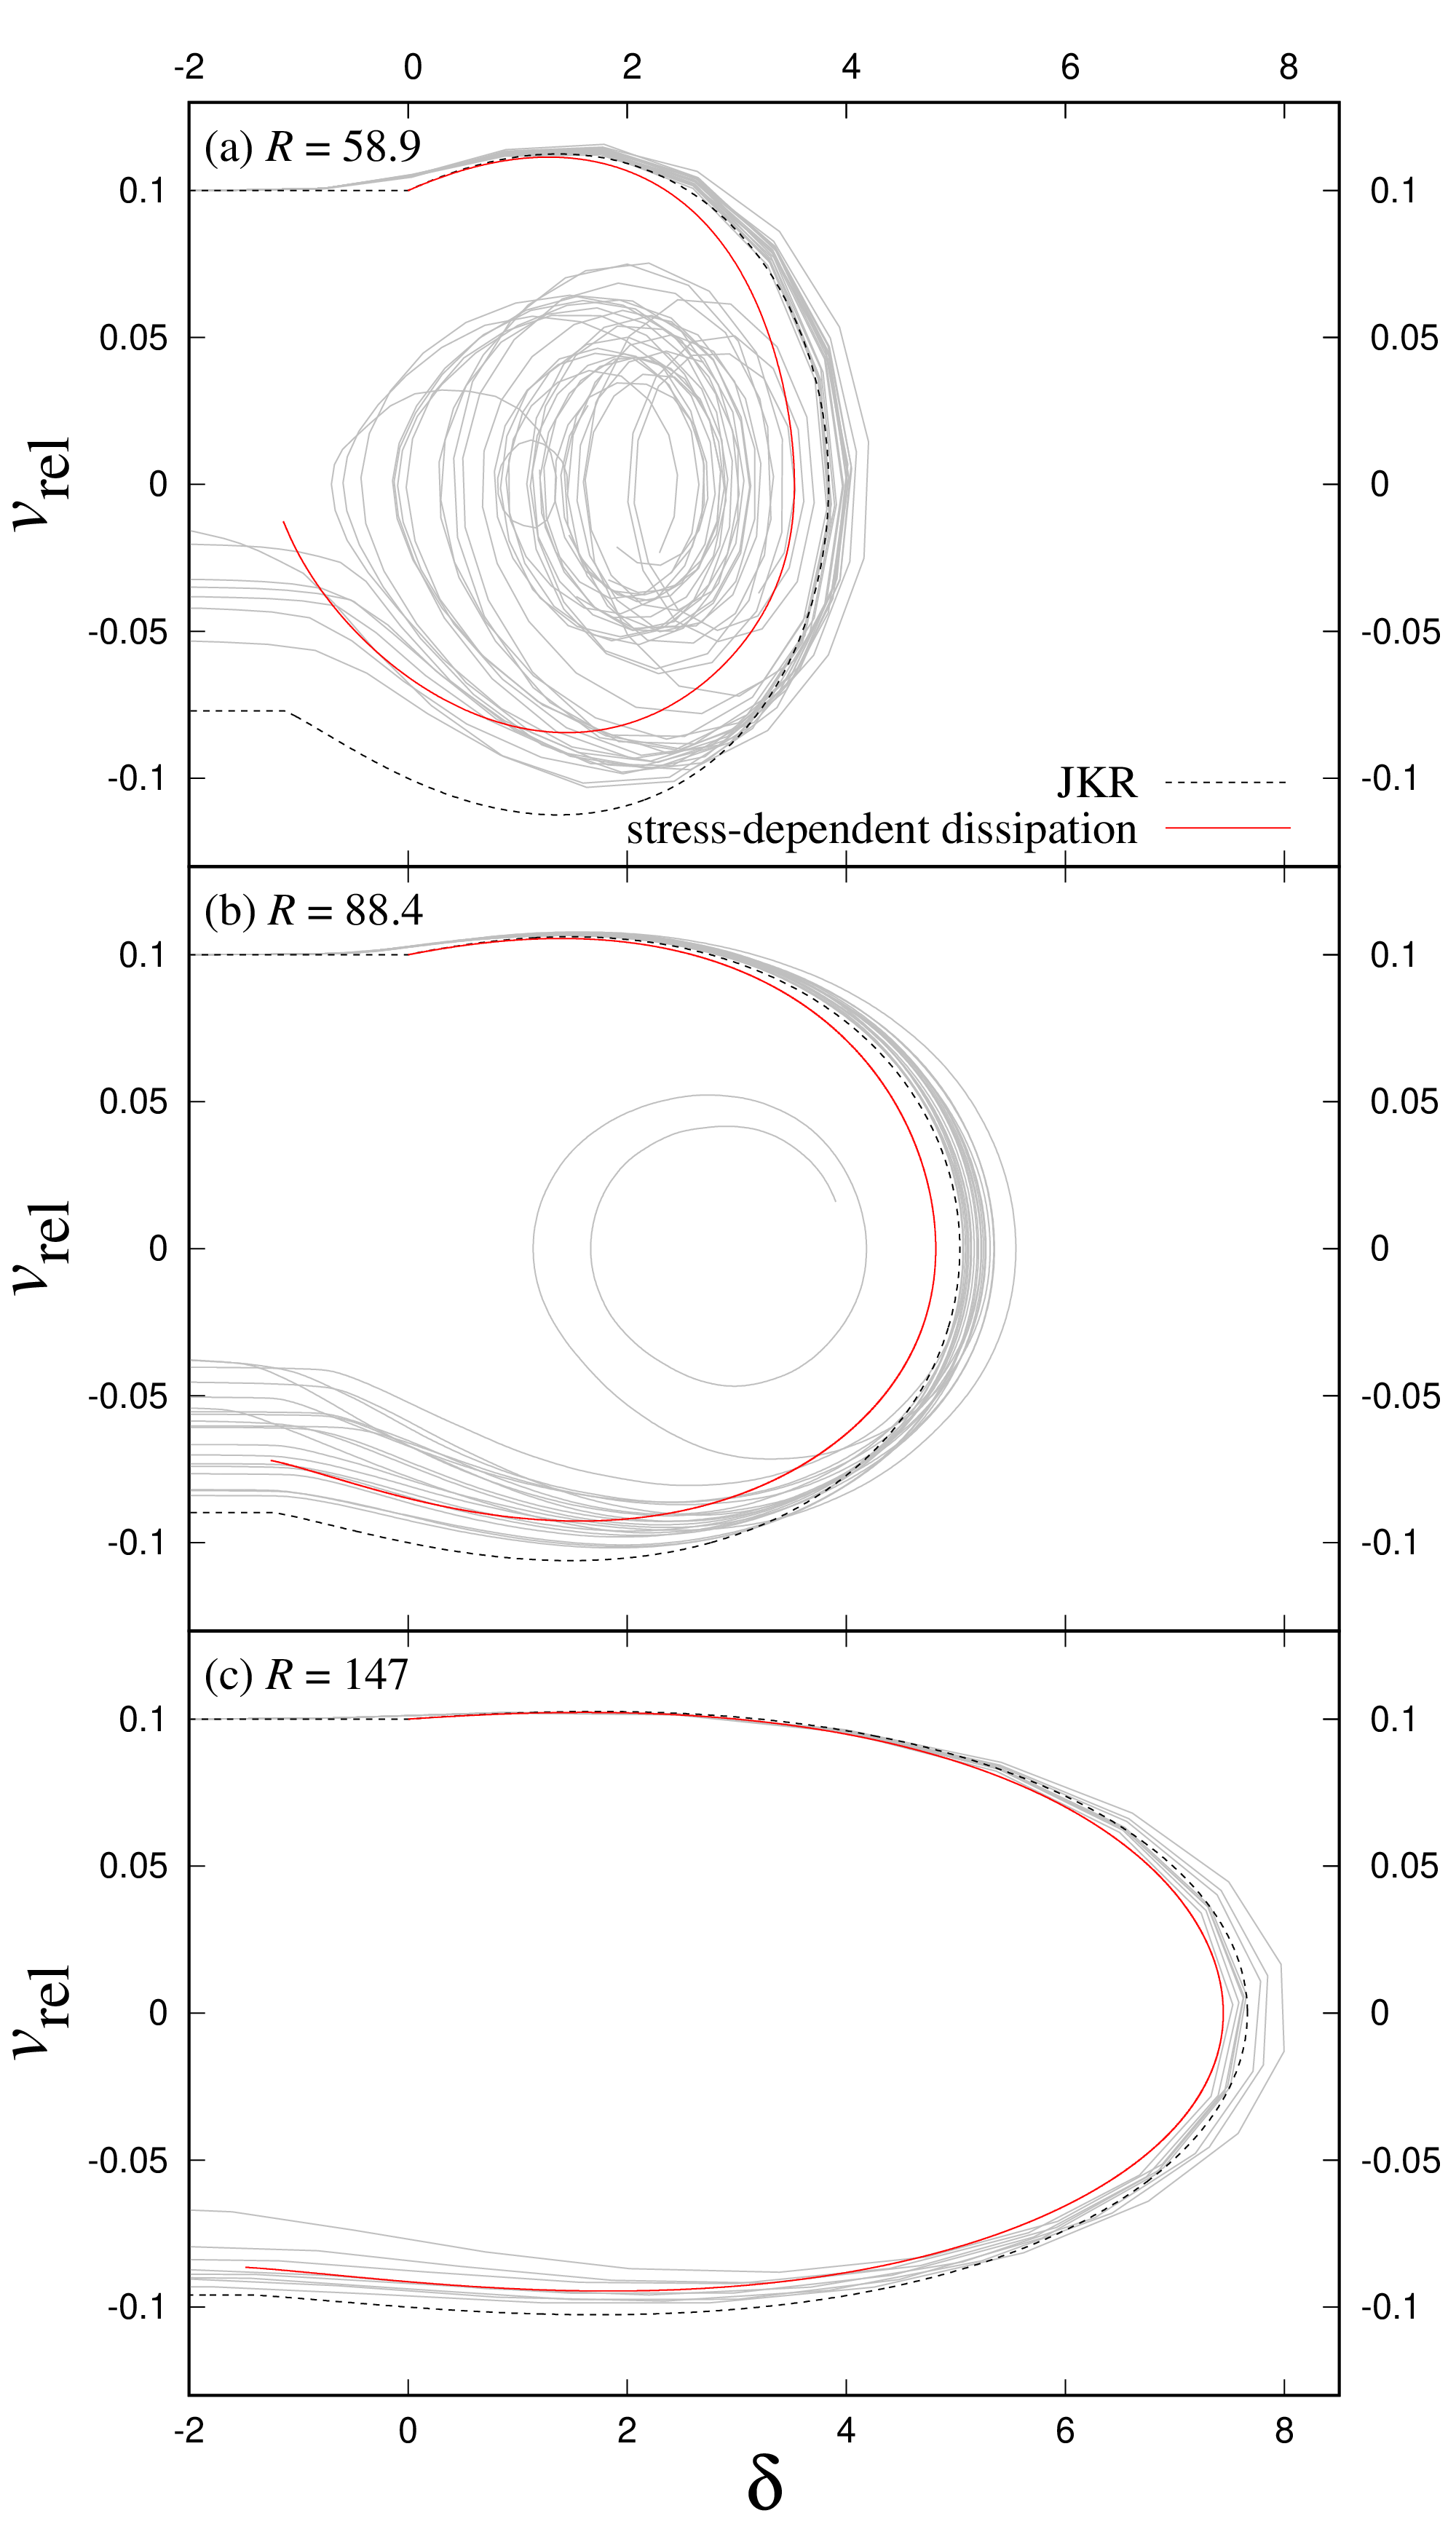
We also examine the trajectories of particles in the - phase plane to check whether the new model can reproduce the contact model by comparing the MD results. Figure 12 shows the - relation with . We find that in the new model is smaller than those in either the JKR theory or the MD simulation results. Although the new model reproduces the motion of large particles well, the displacement of cannot be reproduced perfectly. At in Fig. 12, the difference of between the MD simulations and the new model at maximum compression is about 0.4, which may indicate plastic deformation.
V.2 Simple dissipation model
The Krijt and the new models described above are too complex to apply in powder simulations. We, therefore, propose a simple power-law dissipation model in which the dissipation force is given by
| (19) |
where is a coefficient and and are power-law-indices. We include the factor because the dissipation force and relative velocity point in opposite directions. We searched for optimal values of , , and to fit the MD simulation results by solving the equation of motion:
| (20) |
In this model, we do not consider the time evolution of the contact radius but instead use the contact radius based on eq (5).
Figure 13 shows the COR for this simple model with , and . This model reproduces the MD simulation results for . Small and large result in weak dissipation. We find that the appropriate values are and . Because we simply add the dissipative force to the JKR force, it is easy to use this model for powder simulations with low-velocity collisions.

VI Summary
In the present work, we have studied head-on collisions between two equal-mass particles by using Molecular Dynamics (MD) simulations with the Lennard-Jones (LJ) potential as the intermolecular potential. We have investigated the normal interparticle force between the macroscopic particles and the coefficient of restitution (COR) , and we have constructed a new contact model that includes energy dissipation to reproduce the simulation results. Our main findings are summarized as follows:
-
1.
In the unloading phase of collisions between two particles, the interparticle force deviates from that of the JKR theory, whereas in the loading phase, it agrees with the JKR theory (Figs. 2 and 3). The difference in the force between the loading and unloading phases represents the hysteresis in the particle interaction, which dissipates the kinetic energy of the motion of each particle’s center of mass. The contact radius also has hysteresis; of the MD simulations is smaller than that of the JKR theory in the loading phase and larger in the unloading phase. The hysteresis in the force is greater for smaller particle sizes or higher collision velocities. In particular, for high-velocity collisions with , plastic deformation of the particle is observed (Figs. 4 and 5). The plastic deformation for can be explained by the yield strength estimated by the previous studies.
-
2.
Energy dissipation in a collision reduces . The CORs obtained in our MD simulations are smaller than those of the JKR theory, which is natural because energy dissipation occurs at any time during contact in the MD simulations. The Krijt model includes such hysteresis in the force to accurately describe the energy dissipation. For high-velocity collisions (), our MD simulations show much higher energy dissipation than that predicted by the Krijt model, although the Krijt model reproduces our simulations well for low-velocity collisions () in Fig. 8. In contrast, the strong energy dissipation in the MD simulations for cannot be explained even by the Krijt model with plastic deformation using the yield strength obtained by the previous MD simulations of collisions between non-adhesive particles. Collisions of adhesive particles produce additional dissipation rather than non-adhesive particles.
-
3.
To reproduce the strong energy dissipation observed in our MD simulations for high-velocity collisions, we have proposed a new, stress-dependent dissipation model in which the relaxation time, , increases rapidly with the pressure at the center of the contact surface, , for (eq. (17)). We found that the stress-dependent dissipation model successfully reproduces the CORs in our MD simulations well for . We have also proposed another simple dissipation model (eq. (19)) that can reproduce the CORs of our MD simulations for and which is expected to be useful for powder simulations.
The proposed new models successfully reproduce the MD results for , although the energy dissipation is insufficient for higher impact velocities. This is due to particle deformation at high impact velocities, which leads to significantly small values of the COR. Neither the Krijt model nor the proposed models include this effect. Thus, we cannot reproduce the COR of our MD simulations at high impact velocities. Both the new stress-dependent model and the Krijt model solve for the evolution of the contact radius independently, although the dissipation due to delay of is negligibly small in these models. We, therefore, used the same relaxation time in the dissipation force and contact radius evolution. If in eq. (23) is much larger than that of dissipation force, the delay of is more significant and can be effective in decreasing COR. This is one of the possibilities to explain our MD simulations. We thus need to understand better the property of .
We also need to consider the effects of different particle properties. In this study, we used particles with an ideal FCC structure. However, we should also investigate the effects of structures such as body-centered cubic (BCC) or amorphous structures and their dependence on the filling factors of the macroscopic particles. The particle temperature also affects the collision results, and we should explore this as well in a future paper. We should also simulate particle collisions with more realistic molecules, such as water, to understand dust growth in planet-forming regions. These subjects are all planned for future work.
Acknowledgements.
The authors thank Sota Arakawa for his valuable comments on our results. Y.Y. was supported by JSPS KAKENHI Grant Number 22KJ0859, and E.K. and H.T. were supported by JSPS KAKENHI Grant Number 18H05438. H.T was supported by JSPS KAKENHI Grant No. 23K22549. Our MD simulations were performed on Cray XC50 and the GPU cluster at the Center for Computational Astrophysics, National Astronomical Observatory of Japan. The authors also thank Enago (www.enago.jp) for the English language review.Appendix A Determination of and
We used MD simulations to determine the particle radius and the reduced Young’s modulus . We prepared five particles by hollowing out atoms so that 29.4, 58.8, 88.2, 147, and 294. We also remove the attractive term from the molecular potential between atoms belonging to different particles. The modified LJ potential then becomes
| (21) |
where is the Kronecker delta, and and represent the macroscopic particles to which the - and -th atoms belong, respectively. In this case, the force between particles corresponds to a Hertzian contact. We calculate the force between the particles and fit the parameters and using eq. (2). When we fit the parameters, we ignore the data for small since a small force works due to the intermolecular force existing even if the two particles are not in contact. Figure. 14 shows the forces and fitting lines as a function of , and Table. 2 summarizes the fitting results. The fitting results are slightly larger than the initially prepared radii, with a difference of less than 1. Here, we simulated only one run for each radius with the same orientation as that shown in Fig. 3. Note that the fitting results may change slightly depending on the orientations.
Appendix B Model of crack propagation
Here, we summarize the crack–propagation model used in the Krijt model. The apparent surface energy is expressed as [22]
| (22) |
If and have the relationship shown in eq. (5), which is satisfied by the JKR theory, then . Because of viscoelasticity, however, the evolution of the contact area differs slightly from that of the JKR theory [e.g., 24, 22]. The crack speed can be written as [53, 23]
| (23) |
where and (spacing between atoms). We also assume the initial condition given in Appendix. B of Krijt et al. [22].
Appendix C Surface energy
We derive the surface energy in our MD simulations using the potential energy of a spherical particle with an FCC structure of the atoms. The surface energy of a spherical particle is given by
| (24) |
where is the number of atoms in the system, and is the potential energy per atom in the FCC solid. The total potential energy of the particle, , is obtained from our MD simulation. The energy is the value when the atoms extend to infinity, meaning there is no surface or boundary.
The energy is obtained as follows. If the LJ potential has no cutoff, the potential energy per atom in the FCC solid, , is given by [54]
| (25) | |||||
where is the nearest neighbor distance and is the distance between a reference atom and any other atom . For the FCC structure, the coefficients and are given by
| (26) |
However, in this study, we set the cutoff , so we need to include the effects of the cutoff in determining . We can neglect the cutoff effect on the coefficient due to the rapid decreases of . There are two cutoff effects on the coefficient . One is to set the potential to be zero at by replacing with . The resulting correction is given by
| (27) |
where is the volume per atom in the FCC structure. The other cutoff effect on is neglecting terms with . We find that the correction due to the neglect, , equals . Thus, including these corrections, we obtain as
| (28) | |||||
The nearest neighbor distance is determined by the equilibrium condition . From the equilibrium condition with eq. (28), we obtain and . The obtained agrees with that of the spherical particles in our MD simulations.
The potential is obtained from the MD simulation. We obtain for and 147 respectively in the LJ units. Finally, we get respectively. Thus, We take as the nominal value in this paper. This value agrees with that of the previous work [19].
References
- Reynolds et al. [2005] G. Reynolds, J. Fu, Y. Cheong, M. Hounslow, and A. Salman, Chemical Engineering Science 60, 3969 (2005), granulation across the length scales - 2nd International Workshop on Granulation.
- Jutzi et al. [2008] M. Jutzi, W. Benz, and P. Michel, Icarus 198, 242 (2008).
- Mishra and Thornton [2001] B. Mishra and C. Thornton, International Journal of Mineral Processing 61, 225 (2001).
- Hestroffer et al. [2019] D. Hestroffer, P. Sánchez, L. Staron, A. C. Bagatin, S. Eggl, W. Losert, N. Murdoch, E. Opsomer, F. Radjai, D. C. Richardson, M. Salazar, D. J. Scheeres, S. Schwartz, N. Taberlet, and H. Yano, The Astronomy and Astrophysics Review 27, 6 (2019), arXiv:1907.02615 [astro-ph.EP] .
- Suyama et al. [2008] T. Suyama, K. Wada, and H. Tanaka, Astrophysical Journal 684, 1310 (2008).
- Wada et al. [2013] K. Wada, H. Tanaka, S. Okuzumi, H. Kobayashi, T. Suyama, H. Kimura, and T. Yamamoto, Astronomy & Astrophysics 559, A62 (2013).
- Hasegawa et al. [2023] Y. Hasegawa, T. K. Suzuki, H. Tanaka, H. Kobayashi, and K. Wada, Astrophysical Journal 944, 38 (2023).
- Hasegawa et al. [2021] Y. Hasegawa, T. K. Suzuki, H. Tanaka, H. Kobayashi, and K. Wada, Astrophysical Journal 915, 22 (2021).
- Tatsuuma et al. [2019] M. Tatsuuma, A. Kataoka, and H. Tanaka, Astrophysical Journal 874, 159 (2019).
- Wada et al. [2008] K. Wada, H. Tanaka, T. Suyama, H. Kimura, and T. Yamamoto, Astrophys. J. 677, 1296 (2008).
- Johnson et al. [1971] K. L. Johnson, K. Kendall, and A. D. Roberts, Proceedings of the Royal Society of London Series A 324, 301 (1971).
- Dominik and Tielens [1995] C. Dominik and A. G. G. M. Tielens, Philosophical Magazine, Part A 72, 783 (1995).
- Dominik and Tielens [1996] C. Dominik and A. G. G. M. Tielens, Philosophical Magazine, Part A 73, 1279 (1996).
- Dominik and Tielens [1997] C. Dominik and A. G. G. M. Tielens, Astrophysical Journal 480, 647 (1997).
- Johnson [1987] K. L. Johnson, Contact Mechanics (Cambridge University Press, 1987).
- Derjaguin et al. [1975] B. V. Derjaguin, V. M. Muller, and Y. P. Toporov, Journal of Colloid and Interface Science 53, 314 (1975).
- Dugdale [1960] D. S. Dugdale, Journal of Mechanics Physics of Solids 8, 100 (1960).
- Maugis [1992] D. Maugis, Journal of Colloid and Interface Science 150, 243 (1992).
- Tanaka et al. [2012] H. Tanaka, K. Wada, T. Suyama, and S. Okuzumi, Progress of Theoretical Physics Supplement 195, 101 (2012).
- Takato et al. [2014] Y. Takato, S. Sen, and J. B. Lechman, Phys. Rev. E 89, 033308 (2014).
- Takato et al. [2015] Y. Takato, M. E. Benson, and S. Sen, Phys. Rev. E 92, 032403 (2015).
- Krijt et al. [2013] S. Krijt, C. Güttler, D. Heißelmann, C. Dominik, and A. G. G. M. Tielens, Journal of Physics D Applied Physics 46, 435303 (2013).
- Greenwood [2004] J. A. Greenwood, Journal of Physics D Applied Physics 37, 2557 (2004).
- Brilliantov et al. [2007] N. V. Brilliantov, N. Albers, F. Spahn, and T. Pöschel, Phys. Rev. E 76, 051302 (2007).
- Kim and Dunn [2008] O. V. Kim and P. F. Dunn, Journal of Aerosol Science 39, 373 (2008).
- Wall et al. [1990] S. Wall, W. John, H.-C. Wang, and S. L. Goren, Aerosol Science Technology 12, 926 (1990).
- Anders and Urbassek [2021] C. Anders and H. M. Urbassek, Astronomy & Astrophysics 647, L13 (2021).
- Nietiadi et al. [2020a] M. L. Nietiadi, F. Valencia, R. I. Gonzalez, E. M. Bringa, and H. M. Urbassek, Astronomy & Astrophysics 641, A159 (2020a).
- Nietiadi et al. [2020b] M. L. Nietiadi, Y. Rosandi, and H. M. Urbassek, Nanoscale Research Letters 15, 67 (2020b).
- Takato et al. [2018] Y. Takato, M. E. Benson, and S. Sen, Proceedings of the Royal Society of London Series A 474, 20170723 (2018).
- Millán et al. [2016] E. N. Millán, D. R. Tramontina, H. M. Urbassek, and E. M. Bringa, Phys. Rev. E 93, 063004 (2016).
- Nietiadi et al. [2017a] M. L. Nietiadi, P. Umstätter, I. Alabd Alhafez, Y. Rosandi, E. M. Bringa, and H. M. Urbassek, Geophysical Research Letters 44, 10,822 (2017a).
- Nietiadi et al. [2020c] M. L. Nietiadi, Y. Rosandi, and H. M. Urbassek, Icarus 352, 113996 (2020c).
- Nietiadi et al. [2017b] M. L. Nietiadi, P. Umstätter, T. Tjong, Y. Rosandi, E. N. Millán, E. M. Bringa, and H. M. Urbassek, Physical Chemistry Chemical Physics (Incorporating Faraday Transactions) 19, 16555 (2017b).
- Nietiadi et al. [2019] M. L. Nietiadi, E. N. Millán, E. M. Bringa, and H. M. Urbassek, Phys. Rev. E 99, 032904 (2019).
- Umstätter and Urbassek [2021] P. Umstätter and H. M. Urbassek, Scientific Reports 11, 14591 (2021).
- Awasthi et al. [2007] A. Awasthi, S. C. Hendy, P. Zoontjens, S. A. Brown, and F. Natali, Phys. Rev. B 76, 115437 (2007), arXiv:0709.0994 [cond-mat.other] .
- Note [1] Note that in this paper is equal to and twice of Krijt et al. [22].
- Wada et al. [2007] K. Wada, H. Tanaka, T. Suyama, H. Kimura, and T. Yamamoto, Astrophysical Journal 661, 320 (2007).
- Brilliantov et al. [1996] N. V. Brilliantov, F. Spahn, J.-M. Hertzsch, and T. Pöschel, Phys. Rev. E 53, 5382 (1996).
- Muller et al. [1980] V. M. Muller, V. S. Yushchenko, and B. V. Derjaguin, Journal of Colloid and Interface Science 77, 91 (1980).
- Arakawa and Krijt [2021] S. Arakawa and S. Krijt, Astrophysical Journal 910, 130 (2021).
- Griffith [1921] A. A. Griffith, Philosophical Transactions of the Royal Society of London Series A 221, 163 (1921).
- Wahl et al. [2006] K. Wahl, S. Asif, J. Greenwood, and K. Johnson, Journal of Colloid and Interface Science 296, 178 (2006).
- Thornton and Ning [1998] C. Thornton and Z. Ning, Powder Technology 99, 154 (1998).
- Thompson et al. [2022] A. P. Thompson, H. M. Aktulga, R. Berger, D. S. Bolintineanu, W. M. Brown, P. S. Crozier, P. J. in ’t Veld, A. Kohlmeyer, S. G. Moore, T. D. Nguyen, R. Shan, M. J. Stevens, J. Tranchida, C. Trott, and S. J. Plimpton, Comp. Phys. Comm. 271, 108171 (2022).
- Michels et al. [1949] A. Michels, H. Wijker, and H. Wijker, Physica 15, 627 (1949).
- Hirschfelder et al. [1967] J. O. Hirschfelder, C. F. Curtiss, and R. B. Bird, Molecular theory of gases and liquids (Wiley, New York, 1967).
- Lu and Pound [1975] T. H. Lu and G. M. Pound, Physica Status Solidi (a) 30, 619 (1975).
- Quesnel et al. [1993] D. J. Quesnel, D. S. Rimai, and L. P. DeMejo, Phys. Rev. B 48, 6795 (1993).
- Stukowski [2010] A. Stukowski, Modelling Simul. Mater. Sci. Eng. 18, 015012 (2010).
- Petch [1953] N. J. Petch, J. Iron Steel Inst. 174, 25 (1953).
- Greenwood and Johnson [2006] J. A. Greenwood and K. L. Johnson, Journal of Colloid and Interface Science 296, 284 (2006).
- Kittel [1976] C. Kittel, Introduction to solid state physics, 5th ed. (Wiley, New York, 1976).