Elevating Software Trust: Unveiling and Quantifying the Risk Landscape
Abstract
Considering the ever-evolving threat landscape and rapid changes in software development, we propose a risk assessment framework SRiQT (Software Risk Quantification through Trust). This framework is based on the necessity of a dynamic, data-driven, and adaptable process to quantify risk in the software supply chain. Usually, when formulating such frameworks, static pre-defined weights are assigned to reflect the impact of each contributing parameter while aggregating these individual parameters to compute resulting risk scores. This leads to inflexibility, a lack of adaptability, and reduced accuracy, making them unsuitable for the changing nature of the digital world. We adopt a novel perspective by examining risk through the lens of trust and incorporating the human aspect. Moreover, we quantify risk associated with individual software by assessing and formulating risk elements quantitatively and exploring dynamic data-driven weight assignment. This enhances the sensitivity of the framework to cater to the evolving risk factors associated with software development and the different actors involved in the entire process. The devised framework is tested through a dataset containing 9000 samples, comprehensive scenarios, assessments, and expert opinions. Furthermore, a comparison between scores computed by the OpenSSF scorecard, OWASP risk calculator, and the proposed SRiQT framework has also been presented. The results suggest that SRiQT mitigates subjectivity and yields dynamic data-driven weights as well as risk scores.
Index Terms:
Risk Quantification, Risk in Software Supply Chain, Software Risk Score, Risk Assessment Framework, Trust Perspective on Software Risk.I Introduction
In today’s interconnected and digital world, the creation and distribution of software have evolved into intricate processes known as software supply chains. Similar to traditional supply chains that involve the production, distribution, and delivery of physical goods, software supply chains encompass various stages through which a piece of software is developed, tested, packaged, and ultimately delivered to consumers [1, 2]. These stages involve collaboration among different stakeholders, including developers, vendors, suppliers, and distributors, all working together to bring software to life [24]. Ensuring safe, reliable, and efficacious ways to deliver software products to end users is fundamental to the software supply chain [3].
The diversity of entities engaged in the process, along with the 3rd party components (e.g., equipment, code, and libraries), magnifies the susceptibilities and risks [4, 5]. According to the European Union Agency for Cybersecurity’s (ENISA) report, attacks related to the software supply chain are considered the prime threat in the current threat landscape [6]. Vulnerability in or attack on even a single component of these chains has catastrophic impacts as it has the potential to propagate to other components within the same supply chain [7]. Therefore, it is of paramount importance that such risks be identified and addressed suitably. Moreover, if there exists multiple vulnerabilities or risks, an organization has to determine which vulnerability to address first [8].
When choosing software to download, users must compare multiple (risky) options and make decisions based on objective criteria rather than subjective opinion [9]. Risk assessment guides decisions in scenarios like prioritizing resource allocation for addressing security issues or choosing safer software options [8]. Moreover, it is important to quantify the risk to estimate the severity of the risk and eliminate subjectivity and inconsistencies in evaluating these risk levels to make informed decisions [10]. For instance, a subjective risk assessment performed to evaluate a piece of software might yield a low risk level when carried out by an individual, and the same piece of software might be assessed as a high risk level by another individual in the same setting in the same organization. This subjective and inconsistent assessment makes it difficult for the organization to make decisions regarding the software.
Most research works on software risk assessment centers around qualitative analyses [14, 15, 16, 17, 18, 19], which introduces a factor of subjectivity and inconsistency in outcomes. For instance, if two people evaluating the risk associated with the same software have different levels of experience/expertise, the risk assessed by them will be different due to their subjective opinions. In the context of quantitative risk evaluation, weights are associated with individual parameters to reflect their influence on the cumulative risk score. These weights are often static, pre-defined, and there exists a lack of justification for the selection of preset values for these weights (e.g., if the number of parameters influencing the cumulative risk score is , taking a mean of all these parametric values suggest a static and pre-defined weight of associated with each parameter without any reasoning to justify why the equal weight is employed instead of for one and for the other and so on), which also introduces an element of subjectivity. The objective quantification of these weights has been overlooked while formulating risk evaluation models [14, 20]. Moreover, a significant proportion of these risk assessment frameworks emphasize only the software development stage and accordingly employ parameters regarding only the software code itself [21, 22]. In addition, the omission of software dependencies from risk management models is a significant limitation that potentially undermines the effectiveness of these models [23]. Furthermore, the human aspect has been ignored while defining the threat landscape for risk assessment.
Trust and risk are like two peas in a pod; assessing the trustworthiness of an entity helps in understanding the potential risks associated with that entity [11]. In other words, trust is seen as a risk mitigation strategy, and it reduces perceived risk [12]. The existing literature indicates a noteworthy gap in examining software risk, specifically in relation to the perspective of trust. To the best of our knowledge, none of the current studies have explored software risk from the trust standpoint, highlighting a substantial and unexplored area within the research landscape. It is of significant importance to study and define trust to assess software ecosystems [13]. How trust dynamics interplay with software-related risks is worth investigating and will provide valuable insights into the vulnerabilities and challenges faced in the domain of software supply chain.
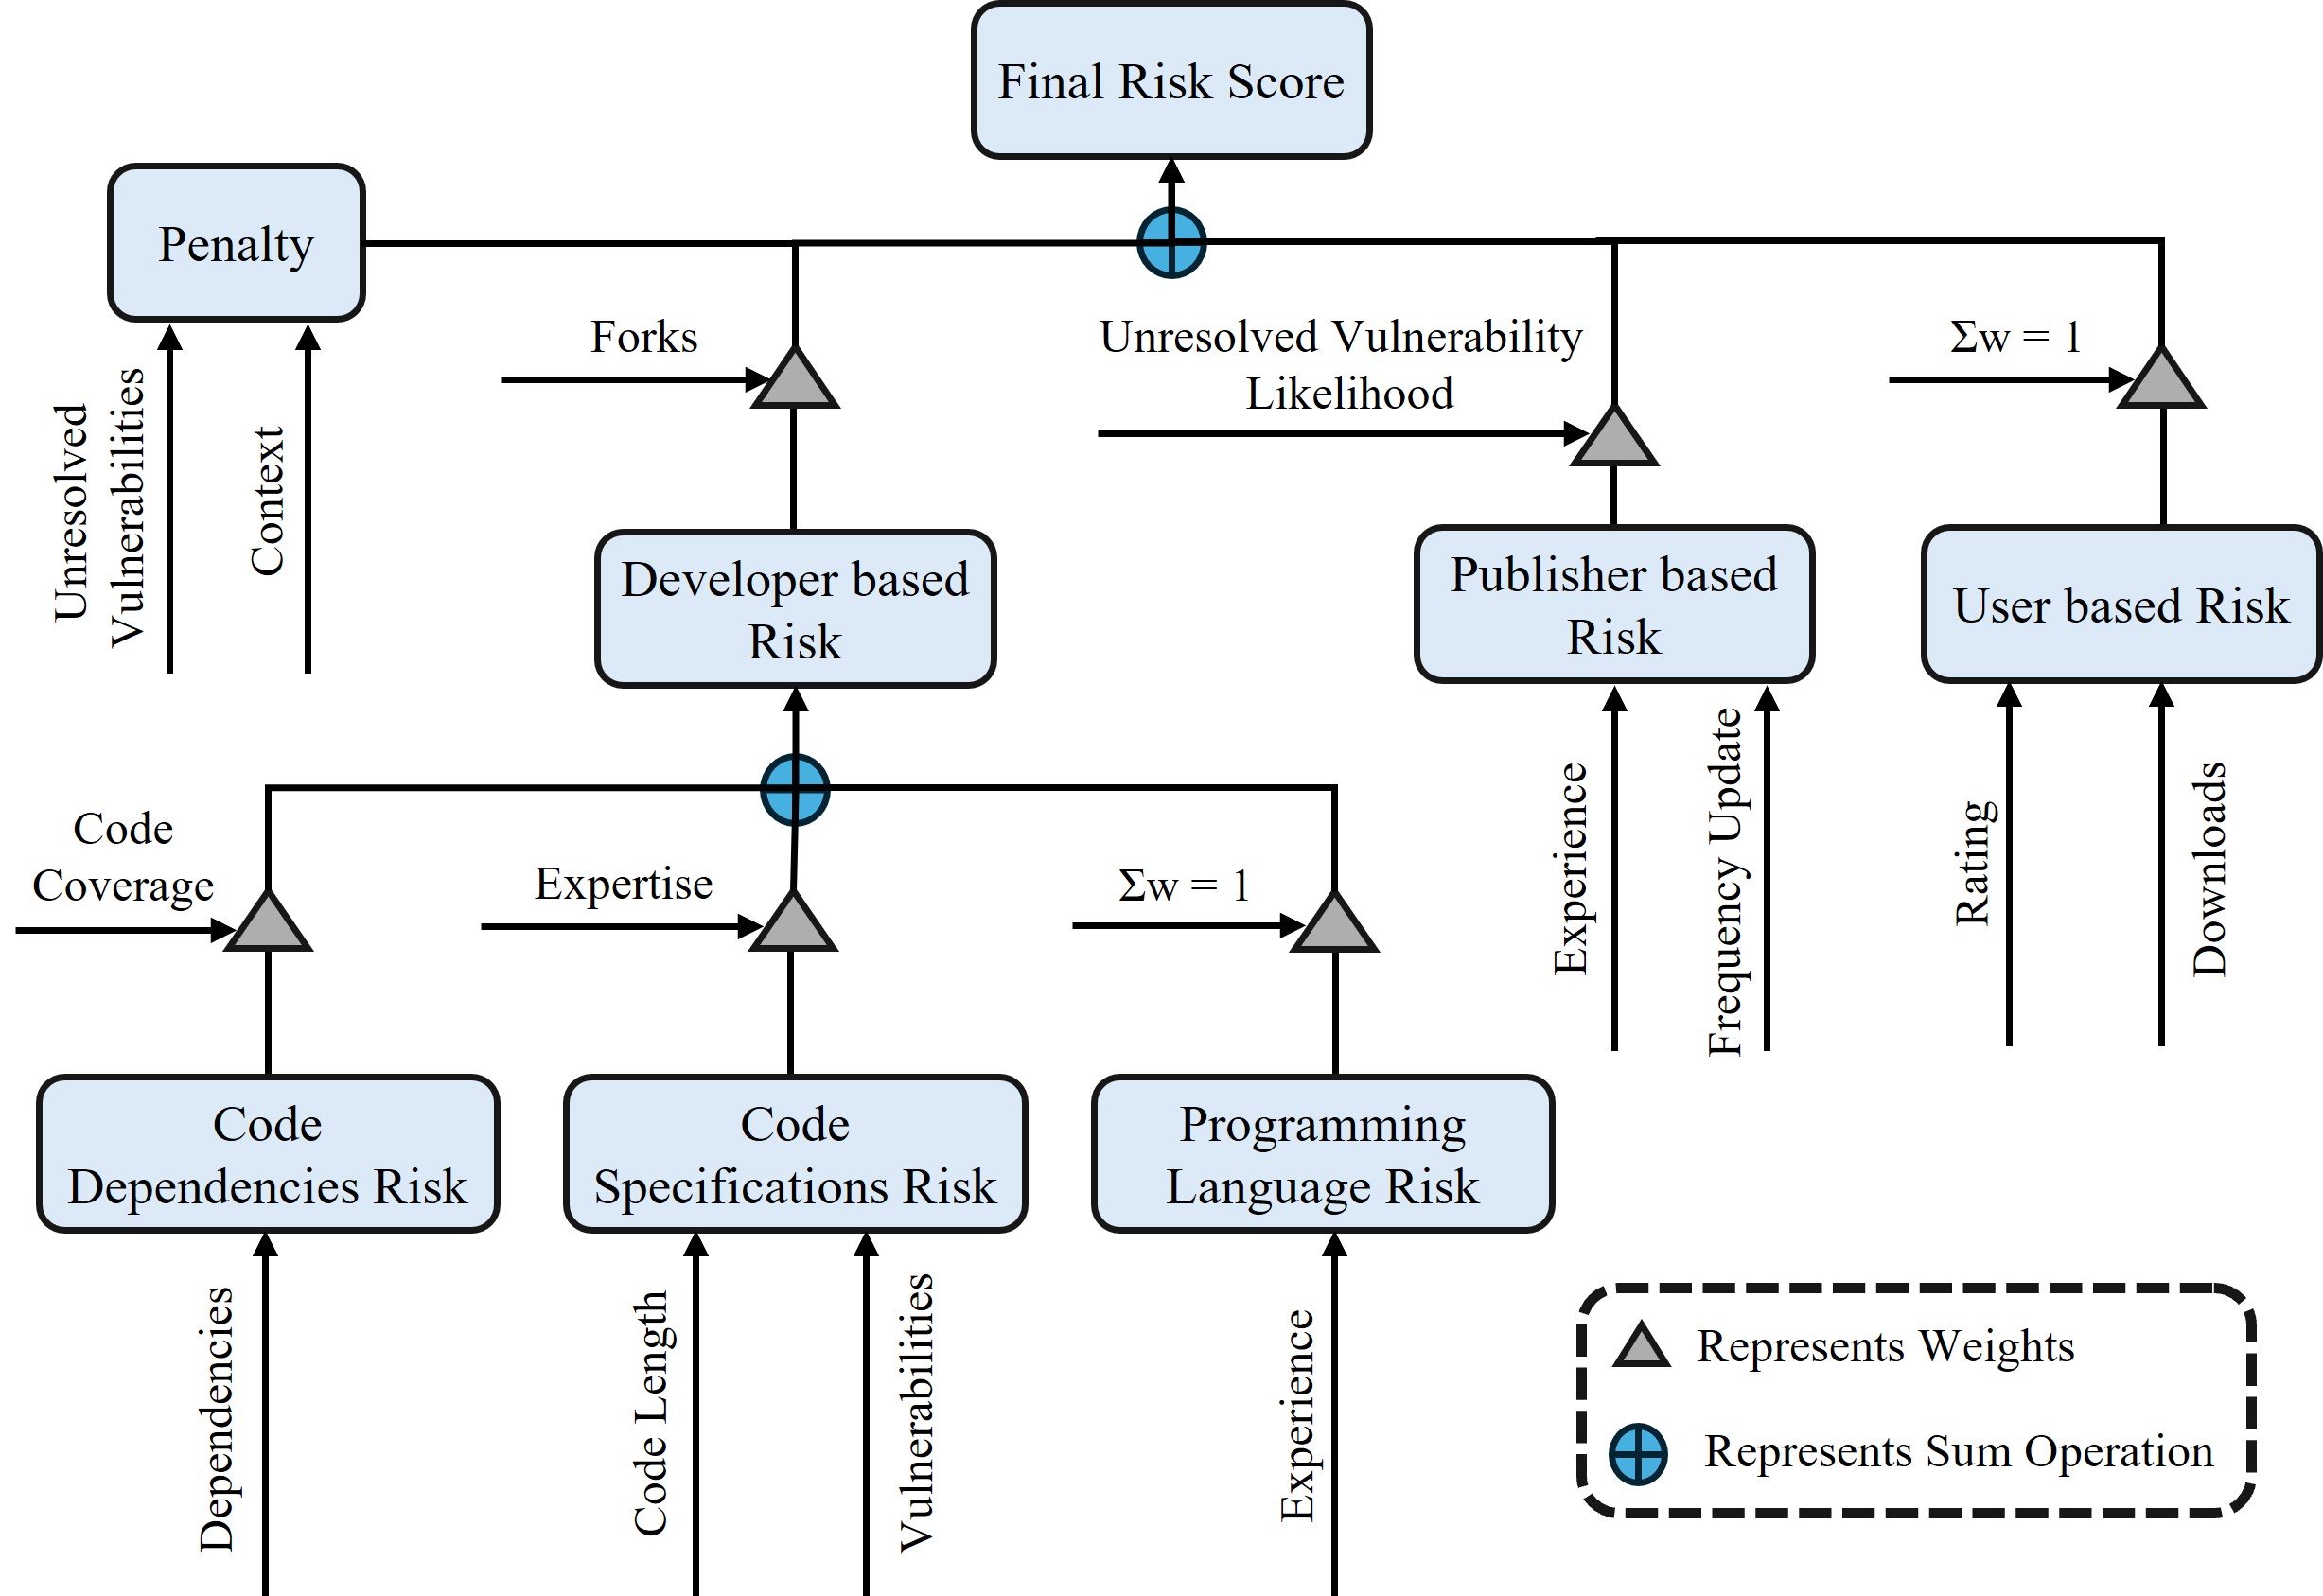
Accordingly, we propose a novel software risk assessment framework SRiQT (Software Risk Quantification through Trust) that relies on quantitative influencing parameters to formulate individual risk segments along with data driven and dynamic weights associated with these risk segments to address subjectivity and inconsistency in risk assessment. SRiQT focuses on the human aspect of the software supply chain and incorporates parameters related to the developer, publisher, and the user in addition to software code and dependencies-related attributes from a trust perspective, i.e., it assesses the risk associated with the software through the parameters acquired from different parts of the software supply chain that are based on the major components from the trust management domain such as reputation, experience, recommendation, penalty, etc. In other words, the computation of risks associated with software and the subsequent decision-making processes are approached and analyzed through the lens of trust. Furthermore, it accounts for context, integrates historical occurrences, and leverages timeliness to manage risk propagation. Figure 1 outlines the proposed SRiQT framework.
I-A Our Contributions
The research at hand focuses on the following main contributions:
-
•
Envisaging a software risk assessment framework from the trust viewpoint SRiQT (Software Risk Quantification through Trust), which has not been undertaken previously to the best of our knowledge.
-
•
Providing new insights into risk assessment, including the influence of human factors and parameters associated with individual actors in a software supply chain, parameters besides code characteristics, software dependencies, context, historical behavior with relevant time-aware impact, recommendations or opinions, and penalty. The majority of these have not been considered by the state of the art in software risk management.
-
•
Introducing novel non-subjective attributes and quantifying these attributes and individual risk segments to yield consistent and non-subjective risk scores which the existing tools such as the Open Web Application Security Project (OWASP) risk calculator[25] lack. Please note that subjectivity here does not refer to context-based subjectivity but bias or partiality.
-
•
Employing suitable and rational influencing parameters as weights and catering to up-to-date/current risk factors while formulating contributing parameters to address the problem of weight quantification and achieving data driven and dynamic weights associated with individual attributes and risk segments. This feature is lacking in the existing tools such as the Open Source Security Foundation (OpenSSF) scorecard [26] and OWASP risk calculator.
-
•
Conducting an extensive evaluation, which demonstrates benefits over prior work, including mitigation of subjectivity and inconsistency, the impact of the human aspect, and data-driven dynamic computations.
I-B Organization of the Paper
The rest of the paper is organized as follows. Section II reviews the state-of-the-art risk assessment models and tools. Section III presents the problem statement, provides definitions for the major components, and specifies participating actors, Section IV examines the step-wise rationale behind the selected influencing parameters, Section V covers the details of our proposed SRiQT’s system model, whereas Section VI discuses the parameter tuning for tackling particular scenarios and tailoring specific elements within the envisaged SRiQT framework. Section VII offers insights into the dataset that has been employed and reports the results, and Section VIII presents a discussion regarding the claimed contributions, yielded results, and comparisons. Finally, Section IX concludes the paper and outlines future directions.
| Framework | Quantitative | Consistent | Actor Element | Dynamic Weight | Data Driven Weight | Reputation | Context | Trust Perspective |
| OWASP | ✗ | ✗ | ✗ | ✗ | ✗ | ✗ | ✗ | ✗ |
| OpenSSF Scorecard | ✓ | ✓ | ✗ | ✗ | ✗ | ✗ | ✗ | ✗ |
| CVSS | ✓ | ✗ | ✗ | ✗ | ✗ | ✗ | ✗ | ✗ |
| Risk Explorer | ✗ | ✓ | ✗ | – | – | – | – | ✗ |
| EU-Risk | ✗ | – | ✗ | ✗ | ✗ | ✗ | ✗ | ✗ |
| SRiQT | ✓ | ✓ | ✓ | ✓ | ✓ | ✓ | ✓ | ✓ |
II Related Work
This section presents a detailed literature review of the existing risk assessment works in both academia and the industry, followed by an overview of the contrasting features among the current tools (i.e., OpenSSF scorecard and OWASP) and the proposed SRiQT framework. Table I exhibits a comparison between existing risk assessment tools in the industry and the proposed SRiQT framework.
II-A Literature Review
Owing to the reliance of the digital industry, specifically software development and distribution, on open access and open source elements, adversaries are leveraging the existence of trust relationships among various stakeholders [24]. To tackle these concerns, several frameworks have been presented, and several projects have been initiated, including but not limited to the Common Vulnerability Scoring System (CVSS) by the National Institute of Standards and Technology (NIST) [14], OWASP [25], OpenSSF scorecard [26], MITRE [27], Supply-chain Levels for Software Artifacts (SLSA) [23], EU-risk assessment [28], and Risk explorer [29].
CVSS by NIST established a publicly accessible framework to indicate the attributes and repercussions of different vulnerabilities related to IT systems. The national vulnerability database furnishes precise CVSS scores for known vulnerabilities [14]. However, it brings in an element of subjectivity; it is difficult for us (1) to find how the scores aligned with severity are computed (e.g., target distribution low, medium, and high mapping on ranges 1%-25%, 26%-75%, and 76%-100%, respectively), and (2) to understand the reasoning behind adjustment or weighting factors (e.g., the base equation for impact has a factor of 10.41, or exploitability has a factor of 20, which has not been explained).
The OWASP risk rating methodology utilizes a conventional risk assessment approach, wherein risk is determined by both the probability of an attack occurring and the potential impact of a successful attack [25]. However, it introduces subjectivity, employs pre-defined scores to qualitative factors without a data-driven approach which is difficult to follow (e.g., score mappings of 1, 4, and 9 for motives), the overall likelihood and impact scores have been computed by averaging out all the scores for individual factors which implies that all the considered factors influence the final risk score equally.
The OpenSSF scorecard by the Open Source Security Foundation is an automated tool designed to assess the security status of packages by analyzing the source code hosted on GitHub [26, 30]. However, it is unclear to us how the scores for individual parameters are decided (e.g., for the branch protection parameter in the OpenSSF scorecard, how are the scores 3, 6, 8, 9, and 10 decided for different tiers?). Moreover, the quantification of the degree of impact associated with the individual parameters is missing, i.e., the parameter dangerous overflow is assigned a severity level of critical, and a pre-defined static value for this weight has been assigned.
MITRE presents a comprehensive framework (end-to-end) that prioritizes the firm integrity of the software supply chain across all stages of design, development, and delivery [27]. Nonetheless, this encompasses solely software bill of materials (SBOM) derived metadata, infrastructure for software development, signing, and distribution.
Similarly, SLSA is SBOM-based, i.e., it offers transparency regarding the software components and ensures the integrity of SBOM. For open-source software, it guarantees to map all packages to the authorized list of packages and components. In contrast, for vendor-based software, the evaluation of the credibility of the assertions put forth by the vendors is emphasized due to the absence of source repositories [23]. Nevertheless, the focus is solely on the building aspect; the trustworthiness of dependencies is not considered, consequently overlooking a thorough analysis of all the elements contributing to the software along with the code quality.
EU-risk assessment report discusses the escalated risk tied to software development and updating processes, vulnerabilities introduced due to misconfiguration, relying on a single supplier, etc. [28]. However, it solely concentrates on the software development process and does not consider actor-based parameters, which suggests that it may not fully realize the entire scope of the threat landscape by overlooking the human factor.
Risk explorer for software supply chains exhibits an attack tree and methodologies for malevolent code injection. Moreover, defenses against various attack techniques are also presented [29]. Nonetheless, it does not include quantitative analysis and scoring mechanisms, which makes it challenging to judge the risk severity and prioritize risks based on severity to make objective decisions.
There is little research within the academic community that emphasizes risk assessment of software in software supply chain [31, 21, 22, 32, 33, 34].
HyunChul et al. [31] present risk as the combination of the likelihood of the vulnerability being in a specific state and the subsequent consequences. However, while defining the vulnerability risk index, the authors assume the vulnerabilities are statically independent. Moreover, the notion of vulnerability life cycle stages has been employed along with CVSS metrics, which brings subjectivity, potentially leading to inconsistent assessments. Brian Chess in [21] focuses primarily on the source code analysis only for risk assessment. Similarly, code complexity data and neural network-based risk analysis have been suggested in [22]. The authors take into consideration only the source code and sample-related metrics. In [32], the authors employ Bayesian belief networks for software risk assessment; however, like many others, they only rely on software development-related qualitative risk factors. Authors in [33] have proposed a dataset; however, they exclusively depend on software requirement risks and attributes drawn from experts and literature. Similarly, in [34], only software requirement risk has been considered. The focus of academic research in risk management has primarily revolved around the project management viewpoint, which is mainly centered on risk assessment in software development projects.
Within the existing literature, there are four key limitations. First, the central part of software supply chain risk assessment research primarily focuses on qualitative analyses. Within quantitative risk evaluation, the quantification of weights has been overlooked, and instead, random static values of weights have been manually pre-defined. Second, there’s a recurring absence of guidance regarding incorporating pre-defined adjustment factors into the formulation of such assessment models, which leads to subjectivity, inconsistency, and a lack of a data-driven dynamic approach to decision making. Third, a substantial proportion of these risk assessment frameworks fixates solely on the software development phase, thereby incorporating parameters solely concerning the software code itself. Moreover, the exclusion of software dependencies from risk management models constitutes a noteworthy limitation that may undermine the efficacy of these models by ignoring the security vulnerabilities and risks that may propagate through these dependencies. Lastly, the current research studies predominantly rely on conventional factors within the risk evaluation process, often neglecting the potential influence of the human elements (e.g., developer’s experience, publisher’s reputation, and user rating history) that significantly impact the threat landscape of the overall risk environment.
Accordingly, there is a compelling requirement for a risk assessment framework that effectively evaluates software within a software supply chain. This framework should encompass essential influencing parameters, including human factors, mitigate subjectivity, account for context, and leverage timeliness to manage risk propagation, and the integration of historical occurrences.
| Features | OWASP | OpenSSF | SRiQT |
| Quantitative | Utilizes qualitative parameters only | Utilizes a combination of qualitative and quantitative parameters | Represents both qualitative and quantitative attributes in terms of quantitative factors |
| Technical Parameters | Focuses on qualitative attributes, which includes both technical and non-technical parameters | Considers technical parameters or risk factors only | Focuses on quantitative attributes, which includes both technical and non- technical parameters |
| Data Driven | Individual checks and the weights assigned to each check are pre-defined static values | Individual checks and the weights assigned to each check are pre-defined static values | Relies solely on data-driven attribute checks as well as weights associated with individual parameters |
| Open Source | Can be used for any project | Focuses only on the open source projects on Github | With minimal adjustment, can be applied to any software application |
| Dynamic Weights | Computes overall likelihood and impact scores by averaging all scores for individual factors, i.e., each parameter has an equal static and pre-defined weight assigned, implying that each considered factor equally influences the final risk score | Employs static pre-defined weights while aggregating the overall score | Utilizes dynamic data-driven weights associated with individual parameters as well as the distinct risk segments |
| Inconsistency | Evaluations for the same piece of software performed by different assessors in the same setting and context yield different results, which presents subjectivity and inconsistencies in the assessments | Yields consistent results | Utilizes quantifiable and objective parameters to produce consistent results |
| Computed Final Score | Results yielded for the same piece of software computed by different assessors in the same setting and context are highly subjective and inconsistent | Comparison results suggest that there is a need to have additional features highlighting the human aspect, reputation and recommendations | Results are non-subjective, consistent and data-driven |
II-B Existing Tools
We compare the proposed SRiQT framework with the existing security/risk calculation tools OpenSSF scorecard and OWASP risk calculator by highlighting the differences and further explaining the need for the envisaged SRiQT framework. Refer to Table II for details.
III Problem setup
If user A needs to download a piece of software, A should be able to assess if the software can be trusted by having a risk score computed for this software. As this risk evaluation is from the trust perspective, it is imperative for this evaluation to derive major components, e.g., context, reputation, and recommendations from trust management domain [37] for A to have a holistic view. Risk is generally considered a multifarious abstraction that relies entirely on the subject’s perception. According to NIST, risk refers to the probability or likelihood of a negative event or outcome occurring, often resulting in harm, loss, damage, or some form of adverse impact [38]. It involves situations where uncertainty exists about the future outcome, encompassing both the potential for something detrimental to happen and the magnitude of its consequences [39]. As mentioned earlier, trust and risk are closely linked. Evaluating the trustworthiness of an entity assists in realizing the potential risks associated with that entity.
Definition 1 (Trust).
According to ITU-T, trust is the quantifiable confidence and/or belief that reflects the aggregated value from past experiences and the anticipated value for the future [40].
Definition 2 (Risk).
Risk is defined as the distrust of an entity towards a target entity or an entire system relying on context, reputation, and recommendations/opinions.
As we are viewing risk with a trust perspective in our approach, the risk is defined, and subsequently, the risk assessment model is formulated using key components derived from the domain of trust.
Definition 3 (Context).
Context in the realm of software refers to the category or type of software being considered. This encompasses software designed for tasks like system automation or management, software aimed at enhancing security, or application software intended for diverse functionalities. The context of software influences the considerations and preferences when prioritizing risks [37].
Definition 4 (Reputation).
Reputation refers to the historical conduct of the entities involved in the software supply chain, including but not limited to software developers, publishers, and consumers. Among other parameters, the reputation is driven by the credibility demonstrated by these individual entities over a period of time [41].
Definition 5 (Recommendations).
Recommendations refer to the opinions or ratings provided by users in relation to the target entity [42].
In order to facilitate user A in making a decision to opt for better and less risky software, quantification of the risk associated with the available software options is necessary. Quantifying risk relates to computing numerical values to diverse aspects of risk. This requires transforming qualitative data about risk into quantitative measures, allowing for a more precise and objective assessment of their potential effects. Through quantifying risk, individuals and organizations are able to assess and prioritize it in the order of significance or severity and make well-informed decisions regarding their mitigation.
The human elements, i.e., the actor-related characteristics such as the developer’s experience, publisher’s reputation, and user rating history, provide a comprehensive understanding of the threat landscape for the risk evaluation. Three key actors, the developer, the publisher, and the user, play distinct yet interconnected roles within the software ecosystem, and their interactions with the software or parts of it significantly impact the overall dynamics of the supply chain.
III-1 Developer
The developer, playing a central role among the key participants, is crucial for shaping the software through involvement in its design, coding, and comprehensive development. The quality, functionality, and security of the software product are directly impacted by the developer’s expertise and decision-making throughout the development phase.
III-2 Publisher
The publisher, being another vital contributor, assumes the role of distributing and ensuring the accessibility of the software to end users. This encompasses activities like packaging, marketing, and delivering the software through diverse channels. The actions taken by the publisher shape the market perception of the software and impact its accessibility to users.
III-3 User
The user, representing the final endpoint of the software supply chain, plays a vital role in the adoption, utilization, and feedback loop. Users interact with the software, provide insights, report issues, and contribute to the product’s overall lifecycle. Their credibility, in turn, shapes the future development and iterations of the software.
Accordingly, a risk assessment model is required to assess risk scores associated with software within a supply chain. Since trustworthiness helps in understanding and realizing the corresponding risk, it is beneficial to model risk from the viewpoint of trust. Moreover, to include the human element, a comprehensive examination of the software supply chain, encompassing three pivotal actors: the developer, the publisher, and the user, is needed.
IV Parameter Selection
Selecting the appropriate parameters for risk assessment of software from a trust perspective is a critical step in devising a trust-driven risk evaluation framework for ensuring the security of software systems. It is imperative to consider a multitude of factors that impact trust and security when determining the parameters that contribute to this assessment. This encompasses a blend of standards’ requirements, published peer-reviewed work, expert consultation, and observable attributes associated with the software.
IV-A Step 1: Standards’ Requirements
IV-B Step 2: Human Element
IV-C Step 3: Published Peer Reviewed Work and Expert Opinion
IV-D Step 4: Observable Attributes
It is essential to identify potential attributes present in the available data [47] to understand the information at hand and extract meaningful insights or conduct further analysis by employing this data. The parameters from (i) the dataset regarding top npm GitHub repositories111https://www.kaggle.com/datasets/mikelanciano/top-npm-github-repositories, (ii) GitHub, and (iii) Node Package Manager (NPM) have been utilized while devising the proposed risk analysis framework. Bhandari et al. [48] highlight the significance of code characteristics, including code length and the choice of programming language, in determining the software’s security stance. Code length impacts the potential for vulnerabilities, with longer codebases potentially having more areas for exploitation. The programming language also introduces specific security challenges or advantages, which must be factored into the assessment. This highlights the importance of both quantitative and qualitative aspects of code. Another key consideration is that available observable attributes and data are not limited to the code. While code-related attributes like code complexity and language choice are vital, other factors play a crucial role in predicting vulnerabilities and identifying patterns of vulnerabilities. These additional attributes include the category of the software, the involved actors, known vulnerabilities, recommendations, and historical behaviors, among other attributes [37, 43, 44, 49, 40]. A comprehensive risk assessment considers these broader aspects to gain a holistic view of the software’s trustworthiness.
In essence, by carefully selecting and analyzing these parameters, it becomes possible to build a comprehensive and effective risk assessment framework that enhances the security and trustworthiness of software in a software supply chain. This multifaceted approach is vital for addressing the ever-evolving landscape of software vulnerabilities and threats, ultimately ensuring the reliability of software systems.
V System Model
Let an individual software be , wherein , and a time instance is denoted by , where . Please note that the time index is being used to acknowledge the dynamic nature of risks, which can change with evolving circumstances or influencing risk factors. It is crucial to know when the risk computation took place, or in other words, how old the risk assessment is.
V-A Developer based Risk:
The developer-based risk () is an amalgamation of the risk from code dependencies, code specifications, programming language, historical information on vulnerabilities, and the developer’s experience associated with the software at time instance .
V-A1 Code Dependencies
The code dependencies-based risk () depends on the dependencies of the software at time instance . Please note that dependencies here (in this manuscript) refer to other 3rd party software and packages rather than libraries222Software package comprises a set of modules, whereas a software library consists of pre-written code..
Motivation: Literature and security solution providers indicate that a higher number of dependencies increases risk and suggest minimizing dependencies to mitigate associated risks [50, 51]. It is worth noting that to minimize subjectivity, factors such as the quality of dependencies have been omitted from consideration.
We have
| (1) |
where is the risk from code dependencies of the software, and is the number of dependencies for the software at time instance .
V-A2 Code Specifications
The code specifications-based risk is a combination of code characteristics, i.e., length, characteristics, and the relevant expertise of the developer for software at time .
Motivation: Literature suggests the reliance of software risk on the code characteristics [22, 52]. Moreover, studies indicate the impact of the developer’s reputation on different phases of the software review process [53]. Multiplication operation is employed to capture the proportion contribution of the code characteristics and to intensify the effect of vulnerabilities in .
We have
| (2) |
where is the risk from code specifications, is the weight associated with the code length based on the historical reputation of the developer of software at time , and is the total number of lines in the code.
We have
| (3) |
where is the number of vulnerabilities in all the software developed by the same developer, and is the set of all software developed by the same developer at time . Simply put, the weight represents the average number of vulnerabilities per software developed by a developer. It is worth noting that for the developer who has previously developed software with no vulnerabilities, the weight will be zero regardless of the total number of software developed. In other words, even if the developer has developed only a couple of software before and no vulnerability has been reported on that software, the developer will be given a chance with the code specification-based risk.
V-A3 Programming Language
The programming language-related risk () relies on the proportion of the experience of the developer(s) in terms of the number of years in a programming language to the overall experience in software development.
Motivation: Literature indicates that extensive experience within a domain is essential to achieve exceptional levels of performance [54]. In other words, trust and distrust towards an entity rely on the experience. The subtraction from 1 indicates the inverse effect, i.e., as the experience proportion increases, the risk associated with it decreases.
We have
| (4) |
where is the risk from the programming language, denotes a developer, represents the experience of a developer in terms of the number of years in the same language, whereas is the total number of years that developer has been developing software.
V-A4 Aggregation of A.1, A.2, and A.3
To compute the developer’s overall risk (), the weighted sum of three individual components, i.e., the risks related to the code dependencies (), code specifications (), and programming language () have been calculated as:
| (5) |
where is the total risk associated with the developer, is the risk linked to the code dependencies and is the weight associated with it, is the risk connected with the code specifications and is the weight for it, whereas is the risk related to the programming language and is the weight linked with it for software at time .
Motivation: Code coverage quantifies how thoroughly a test suite tests a software system [55]. Literature suggests that code coverage helps in maintenance tasks like predicting the likelihood of faults in a software [56, 57].
We have
| (6) |
where is the weight associated with the code dependency risk, and is the code coverage.
Motivation: As mentioned above, the expertise and experience of the developer play a significant role in developing high-performing software [54]. Exponential function with a negative power is used to inversely emphasize on the smaller positive values. Moreover, in comparison to alternative functions such as , it maps all real numbers to positive real numbers and is simpler to scale its value between 0 and 1.
We have
| (7) |
where is the expertise/experience of the developer in terms of programming language at time , and its value lies in the interval [0, 1];
| (8) |
where is the set of all previously developed software by the same developer in the same language, and is the set of all previously developed software by the same developer.
We have
| (9) |
Note: The absolute sum of all weights is calibrated to be equal to 1. Literature suggests that this is an established practice [58].
V-B Publisher based Risk:
The risk associated with a publisher of software in a software supply chain is defined as the amalgamation of the update frequency and the reputation/experience of the said publisher.
Assumption: Similar to the developer’s experience, the experience and expertise of all actors involved impact the risk associated with software. The average number of software published per year and the frequency of updates required for that software are inversely related to the risk segment.
We have
| (10) |
where is the risk associated with the publisher, is the experience of the publisher in terms of the number of software published, represents a publisher, is the update frequency of the software, and is the experience of the publisher in terms of years. Please note that the update frequency is in the range (0, 1].
V-C User indicated Risk:
The risk indication provided by a user regarding software is defined as the proportion of users who indicated satisfaction with the software compared to those who downloaded it.
Motivation: The observed distribution of data suggests that consumer trust in software is represented by the ratio of users who expressed satisfaction with the software to those who downloaded it. The subtraction from 1 implies the inverse effect, i.e., as the satisfaction proportion increases, the risk associated with it decreases.
We have
| (11) |
where is the risk associated with a particular software according to the recommendation or opinion from users, is the rating (i.e., number of stars) assigned by the users to specific software, and is the total number of times that software has been downloaded.
V-D Penalty :
Penalty () is the increment in the final risk score () of a software at time instance and is associated with the software which has established a particular degree of mistrust.
Motivation: Exponential expression is used to emphasize the smaller positive values. The subtraction from 1 specifies the vulnerabilities result in an inverse effect, i.e., as the exponential expression increases, the penalty associated with it decreases. It is noteworthy that for the same base value, a higher proportion of unfixed vulnerabilities results in a higher value, whereas if the base value is increased, the impact of the unresolved vulnerabilities is less pronounced. The context parameter is employed to adjust the stringency of penalties based on the software category, while the proportion of unresolved vulnerabilities reflects the level of susceptibility. Literature in the trust management domain suggests the use of pre-defined fixed values for penalty factor. However, in the proposed risk evaluation framework, we aim for a data-driven and dynamic penalty factor [59].
We have
| (12) |
where is the penalty factor, and is the proportion of unresolved vulnerabilities. Please note that if the software has no vulnerabilities, . is the context of the software in question and
| (13) |
where is the context of the software being evaluated. In this paper, we consider cases of context, i.e., security software (i.e., ), automation software (i.e., ), and other software (i.e., ).
Note: The values of 0.2, 0.3, and 0.5 selected for context are chosen by keeping the sum of all equal to 1. These values can be customized to align with the stringent requirements of the organization.
We have
| (14) |
V-E Final Risk Score :
The final risk score () combines the actor (i.e., developer, publisher, and user) based risk components into a single score and is computed as . However, to enable comparisons among various risk scores, the risk has been depicted on a scale ranging from 0 to 1 by employing the sigmoid function [60]. This guarantees uniform interpretation for comparability. Moreover, to make the resulting score gradually increase, the sigmoid function has been modified, and the adjustment factors, e.g., 4 and 0.04, have been determined by graph analysis to analyze the potential outcomes. The resultant final risk is depicted as:
| (15) |
and
| (16) |
Note: The sum of all weights is calibrated to be equal to 1.
Motivation: Forks enable developers to conduct code reviews and audits by comparisons between the original codebase and modifications made in the forked repositories. This enables the identification of potential security vulnerabilities, compliance issues, or other risks, allowing collaborative efforts to address them effectively [61]. The higher the number of forks, the lesser the weight of the corresponding risk will be.
We have
| (17) |
where is the number of forks given to the software.
Motivation: The literature suggests that the probability of unresolved vulnerabilities can be computed by employing the following equation [62]. The higher the likelihood of unresolved vulnerability, the higher the weight of the risk will be.
We have
| (18) |
where are the number of known vulnerabilities resolved, and are the number of known vulnerabilities unresolved.
V-F Final Risk Score with Penalty
The final risk score with a penalty () is the risk score of a software at time after the penalty has been applied. This risk score is computed as:
| (19) |
V-G Risk Bands
The resulting risk scores are categorized into four bands, facilitating the communication and classification of the risk level linked to a specific software. Each band typically represents a range of scores corresponding to a particular level of risk, allowing for more straightforward interpretation and decision-making. The process works as follows:
V-G1 Low Risk Band
This indicates that the risk associated with the assessed software is minimal. It suggests that the likelihood of negative outcomes is low, and the impact, if any, is expected to be minor.
V-G2 Moderate Risk Band
This suggests a moderate level of risk. While the likelihood of adverse events might be higher than in the low-risk band, the potential impact is still manageable. Attention and monitoring may be required to prevent escalation.
V-G3 High Risk Band
This signifies a significant level of risk. There is a higher likelihood of adverse events occurring, and the potential impact is substantial. Immediate action or intervention may be necessary to mitigate the risk and prevent severe consequences.
V-G4 Critical Risk Band
This represents the highest level of risk. The likelihood of severe consequences is extremely high, and immediate and decisive actions are typically required to address the situation. This band often signifies a potential crisis or emergency that demands urgent attention.
| Sample | Code Length | Developer | Publisher | Year | Language | Update Frequency | Forks | Downloads | Unresolved Vulnerabilities | Known Vulnerabilities | Dependencies | Rating | Code Coverage | Context |
| 1 | 222 | V | L | 2019 | Python | 0.77 | 562 | 15181 | 0 | 2294 | 26 | 5037 | 0.97 | 0.2 |
| 2 | 272 | W | H | 2017 | C | 0.35 | 1961 | 27459 | 5 | 1576 | 6 | 15093 | 0.85 | 0.3 |
| ⋮ | ⋮ | |||||||||||||
| 4500 | 305 | H | S | 2023 | Python | 0.81 | 541 | 7605 | 1 | 48 | 0 | 1661 | 0 | 0.3 |
| 4501 | 663 | N | O | 2020 | Java | 0.93 | 4443 | 80721 | 799 | 11909 | 0 | 37328 | 0.91 | 0.5 |
| ⋮ | ⋮ | |||||||||||||
| 8999 | 48 | R | D | 2018 | Python | 0.004 | 260 | 1733 | 17 | 868 | 16 | 216 | 0.88 | 0.2 |
| 9000 | 138 | N | J | 2017 | C | 0.86 | 161 | 2579 | 4 | 289 | 11 | 559 | 0 | 0.2 |
VI Parameter Tuning
The envisaged SRiQT framework is adaptable to suit the particular needs of the organization. Moreover, it is essential to address specific scenarios (e.g., when there exists no dependencies or the publisher is a new publisher) that may arise. This section elaborates on both the customization options and occurrences of particular situations that may require modification to the risk assessment process. Please note that some customization options can add subjectivity between organizations; however, it will keep the computations within the organization non-subjective and consistent as the tuning will represent the context and not partiality.
VI-A Greater Dependencies’ Influence
The influence of dependencies can be heightened by incorporating a sensitivity factor when computing , which is defined by the organization to align with their security requirements, by multiplying it with in equation 1.
VI-B No Dependencies
If the said software code does not have any external dependencies, the resulting risk based on code dependencies will be zero.
VI-C New Publisher
If the publisher of the software is new, i.e., if they lack prior experience ( and/or is zero), the resulting risk based on the publisher attains its maximum value of 1.
VI-D Customized Risk Bands
In risk management, a one-size-fits-all approach may not adequately address each organization’s unique characteristics and security requirements. Organizations have the autonomy to customize their risk bands to align with their business objectives, reflect the evolving threat landscape, and adapt to industry regulations.
VI-E Customized Weights
The proposed risk assessment model employs dynamic, i.e., data-driven weights relying on risk-influencing parameters to adapt to the constantly evolving security considerations in the software supply chain. However, these weights can be tailored to align with the stringent requirements of the organization. Please note that customizing weights can add subjectivity between organizations; however, it will keep the computations within the organization consistent as the tuning will represent the context and not partiality.
VI-F Calibrating or Normalizing Risk Score
To maintain a risk score within the range of 0 to 1, it is necessary to calibrate or normalize the computed risk score. This practice is logical as it compares values against similar metrics used in other software or packages within the organization. Typically, organizations rely on a predefined set of approved or commonly used software to carry out their tasks. Assessing risk about other software within this set is a prudent approach, providing a meaningful context for evaluating potential risks associated with the organization’s software ecosystem.
VI-G Penalty
The penalty threshold has been set by taking a mean of the minimum and maximum possible risk values, i.e., 0 and 1, respectively. This threshold is adjustable based on the stringent requirements of individual users/organizations to make the risk evaluation criteria more or less strict. Moreover, the values of 0.2, 0.3, and 0.5 selected for context in equation 13 can be customized to align with the stringent requirements of the organization.
VII Results
In this section, we provide insights into the dataset utilized for calculating risk through the proposed SRiQT framework. Furthermore, yielded results and discussions on those results are also presented.
VII-A Dataset
The data employed to compute risk is taken from (i) the data regarding top npm GitHub repositories, which is a combination of data taken from platforms for software development and software hosting, e.g., GitHub and NPM, and (ii) synthetic data for remaining attributes.
While it is technically feasible to extract data for these remaining attributes from GitHub and NPM repositories, the process involves complex data mining and analysis techniques beyond this current study’s scope. We have generated representative values for these parameters to demonstrate the efficacy of our proposed risk analysis framework without compromising its validity. This approach allows us to validate the framework’s functionality while maintaining focus on its core methodological contributions.
Let denote the entire dataset and denote the subset of the dataset, excluding the parameters and their corresponding values that were generated. Please note that only includes code dependencies, code coverage, user ratings, forks, vulnerabilities resolved, and total vulnerabilities. Table III provides the entire dataset’s () structure and a few samples.
VII-B Validation
The most significant challenge when devising the proposed risk assessment framework is the unavailability of a labeled dataset, i.e., a dataset containing ground truth values with an emphasis on the trust perspective and the human element. It hinders the feasibility of validation through traditional ways, i.e., through comparing the results with the established ground truth. Therefore, conventional validation methods relying on labels or ground truth assessments are not applicable in our case. This emphasizes the necessity for alternative validation approaches. Accordingly, thorough testing was conducted to verify the effectiveness of the envisaged SRiQT framework, employing a set of 9000 samples. Through this rigorous testing, the framework’s performance is thoroughly examined, and its ability to handle various situations is assessed. The testing process is pivotal in confirming the strength and relevance of our results to broader contexts. Moreover, comparisons of the scores generated by the OpenSSF scorecard, OWASP risk calculator, and the proposed SRiQT framework have been provided to validate the necessity of the parameters employed by the proposed SRiQT framework.
Table IV presents the final outcomes via the proposed SRiQT framework for the selected samples. Table V exhibits the comparison of scores computed by OpenSSF scorecard [35] and the proposed risk framework along with the manual verification. Moreover, Table VI presents the comparison of the risk scores calculated using the proposed SRiQT framework by first including and then excluding the parameters for which self-generated data points were utilized, whereas Table VII delineates the risk scores computed by 5 assessors using OWASP risk calculator [36].
VIII Discussion
This section explores how well the proposed SRiQT framework aligns with its stated contributions in Section I followed by a discussion on computed outputs.
VIII-A Contributions
As mentioned earlier, the envisaged SRiQT framework aimed to (i) quantify risk to eliminate subjectivity and inconsistent risk assessments, (ii) explore the human element, i.e., the risk associated with the actors engaged in software supply chain, (iii) employ data-driven and dynamic weights to reflect the influence of individual parameters and metrics, and (iv) consider dependencies, when computing risk scores.
VIII-A1 Quantification and Subjectivity
The proposed SRiQT framework provided a clear and measurable way to formulate and express metrics. This quantification made it easier to judge the risk severity and to prioritize risks based on severity to make objective decisions. For instance, if a user has to choose between 2 software that can achieve the same objectives, one software with a risk score of 0.3 out of 1, whereas the other with a risk score of 0.55 out of 1, it will be easier for the user to choose among the two options. This also removed inconsistencies in risk computations performed by different parties. Each individual parameter (e.g., developer’s reputation), major component (e.g., penalty), and risk segment (e.g., developer-based risk) has been represented in numeric value. All equations, i.e., equations 1–19 yield quantitative values.
VIII-A2 Human Element
The devised framework integrated the risk associated with the human aspect of the software supply chain. It incorporated various parameters regarding individual actors, e.g., developer’s expertise, publisher’s experience, and user credibility. These parameters enabled a sensitive and comprehensive evaluation of the potential risks originating from the human elements throughout the software supply chain. The impact of human factors on risk has been formulated in equations 5, 10, and 11.
VIII-A3 Data-driven Weights
While developing the envisaged SRiQT framework, data-driven weights have been employed instead of pre-defined static weights as evident from equations 3, 6, 7, etc. The adaptability of dynamic weight allocation guarantees that the risk assessment remains relevant and reliable in the face of emerging threats and evolving operational environments by assessing a risk score based on the instantaneous values of the contributing parameters. In other words, the changes in the values of parameters used in the computation of weights associated with risk segments will also impact the influence of these risk segments in the final risk score.
VIII-A4 Software Dependencies
Software dependencies have been taken into account while formulating a risk element for developer-based risk, i.e., code dependencies-based risk in equation 1. Moreover, the influence of dependencies on the risk based on code dependencies is adjustable according to the security requirements of the organization, as mentioned earlier in Section VI-A.
VIII-B Evaluations
| Sample | Band | |||||
| 1 | 48476.27 | 0.37 | 0.66 | 0.37 | 0.37 | Moderate Risk |
| 2 | 225369.1 | 0.04 | 0.45 | 0.64 | 0.65 | High Risk |
| ⋮ | ⋮ | |||||
| 4500 | 96020.01 | 0.02 | 0.78 | 0.95 | 0.98 | Critical Risk |
| 4501 | 295440.1 | 0.03 | 0.53 | 0.21 | 0.21 | Low Risk |
| ⋮ | ⋮ | |||||
| 8999 | 34403.97 | 0.04 | 0.87 | 0.79 | 0.82 | Critical Risk |
| 9000 | 14369.99 | 0.02 | 0.78 | 0.40 | 0.40 | Moderate Risk |
The overarching observation in Table IV indicates a strong correlation between the overall risk () and the inherent risks associated with the involved developers () introduced during the development process and the risks indicated by users (). This linkage highlights the significance of delving into and proactively managing challenges that may arise at the development stage and considering the requirements of consumers. The importance of the reliance on developer-based risk on dependencies lies in the acknowledgment that the risk posed by dependencies is a crucial determinant in the overall risk profile associated with the development process.
VIII-B1 Final Risk Score
The risk associated with the developer for Sample 1 in Table IV is assessed as low and the risk attributed to the publisher and the user for the same software reaches the moderate and the high level, respectively, primarily attributed to the publisher’s lack of experience and a significantly lower number of users rating the software. Nevertheless, the impact of this high risk is mitigated in the final risk score due to a finely proportioned resolution of vulnerabilities.
The elevated developer risk in Sample 4501 arises from a heightened code specification-related risk, accompanied by a suboptimal proportion of vulnerability resolution. The software is designed for other applications (i.e., context) and, therefore, adheres to a less stringent criteria for risk assessment.
| Proposed Risk | Proposed Band | Scorecard Risk | Scorecard Band | Manual Verification |
| 0.99 | Critical Risk | 1.8 | High Risk | Critical |
| 0.27 | Moderate Risk | 7.3 | Low Risk | Moderate |
| 0.22 | Low Risk | 4.1 | Medium Risk | Low |
| 0.37 | Moderate Risk | 5.7 | Low Risk | Moderate |
| 0.2 | Low Risk | 5.3 | Low Risk | Low |
| 0.97 | Critical Risk | 2.3 | High Risk | Critical |
| 0.39 | Moderate Risk | 5.7 | Low Risk | Moderate |
| 0.46 | Moderate Risk | 2.0 | High Risk | High |
| 0.56 | High Risk | 6.1 | Low Risk | Moderate |
| 1.0 | Critical Risk | 2.1 | High Risk | Critical |
VIII-C Comparison
Table V presents 10 random samples from the results generated by utilizing the OpenSSF scorecard alongside the corresponding risk scores derived from the proposed risk assessment framework SRiQT for the same repositories. While comparing the outcomes yielded by both methods, it was observed that the scores computed by the two are not directly correlated. Some scores computed by the OpenSSF scorecard suggest a higher risk band as compared to the risk scores computed by SRiQT, whereas some recommend a lower risk band as opposed to the calculations made by using SRiQT. This indicates that the parameters or risk factors not considered by the OpenSSF scorecard have an impact on the final risk scores. This implies that the attributes taken into account by the OpenSSF scorecard to assess the security state of the software are insufficient for accurately determining the risk level associated with the software. It necessitates additional parameters to be taken into account to properly identify the risk status and make it more stringent. Please note that the bands utilized by OpenSSF scorecard for final score are low (), medium (), high (), critical () represented by colored rings of yellow, orange, red, and maroon respectively on the scores, whereas the risk bands applied on the final risk score in the proposed methodology are low (), moderate (), high (), and critical (). Sample 3 has been scored as a medium risk by the OpenSSF scorecard (column 3) despite having no vulnerabilities, no dangerous workflow patterns, no defined security policy, etc. Similarly, Sample 9 has been scored as low risk by the OpenSSF scorecard even though vulnerabilities exist, the code review has less than 50% changes approved, no fuzzing or static code analysis has been used, and there is no best practices badge associated. Proper formulation instead of pre-defined values for assigning scores and severity weight to individual parameters is equally as important as selecting the most relevant influencing parameters, the developer’s and publisher’s reputation and experience, along with user experience/satisfaction.
Please note that the manual verification here includes all the parameters considered by the proposed risk framework, along with the the parameters employed by the OpenSSF scorecard. Sample 1 has the following: (1) no code coverage, (2) the developer has a reputation for developing software with a significantly high number of vulnerabilities, (3) the developer has little experience in developing software using this language, (4) no fuzzing, (5) no security policy, (6) no best practices, and (7) no information on dangerous workflows, (8) high number of detected vulnerabilities, (9) no branch protection, etc. Therefore, manual verification suggests that the risk level is critical.
Similarly, Sample 8 has the following: (1) no code coverage, (2) the developer has a reputation of developing software with moderate number of vulnerabilities, (3) the developer has little experience in the developing software using this language, (4) the context of the software is other than security or automation, (5) no fuzzing, (6) no security policy, (7) no best practices, and (8) no information on dangerous workflows etc. Accordingly, manual verification suggests that the risk level is high. Please note that the manual verification risk rating is not according to the number of quoted risk factors. It is according to the severity of the risk factors and the scoring against them.
| Proposed Risk with | Proposed Band with | Proposed Risk with | Proposed Band with |
| 0.99 | Critical Risk | 0.98 | Critical Risk |
| 0.27 | Moderate Risk | 0.88 | Critical Risk |
| 0.22 | Low Risk | 0.95 | Critical Risk |
| 0.37 | Moderate Risk | 0.96 | Critical Risk |
| 0.2 | Low Risk | 0.92 | Critical Risk |
| 0.97 | Critical Risk | 0.95 | Critical Risk |
| 0.39 | Moderate Risk | 0.94 | Critical Risk |
| 0.46 | Moderate Risk | 0.97 | Critical Risk |
| 0.56 | High Risk | 0.97 | Critical Risk |
| 1.0 | Critical Risk | 0.98 | Critical Risk |
| Assessor 1 | Assessor 2 | Assessor 3 | Assessor 4 | Assessor 5 |
| Low (LF:5.875, IF:2) | Medium (LF:4.5, IF:3.75) | Medium (LF:6, IF:2.75) | Low (LF:5.875, IF:2) | Low (LF4.375:, IF:2) |
| Low (LF:5.875, IF:2) | Low (LF:2, IF:3.75) | Medium (LF:6.125, IF:2.75) | Critical (LF:7.375, IF:7.5) | Medium (LF:5.125, IF:3.25) |
| Low (LF:5.625, IF:1.75) | Medium (LF:4, IF:3.75) | Low (LF:5.25, IF:2.75) | Critical (LF:7.125, IF:7.5) | Medium (LF:4.125, IF:3.5) |
| Medium (LF:5.625, IF:4.25) | High (LF:6.125, IF:3.75) | Medium (LF:6.125, IF:2.75) | Critical (LF:7.5, IF:9) | High (LF:3.25, IF:6) |
| Medium (LF:6, IF:2.25) | Medium (LF:4.625, IF:3.75) | Low (LF:5.875, IF:2.75) | Medium (LF:6, IF:2.25) | Medium (LF:4.375, IF:5.75) |
| Low (LF:5.25, IF:2.75) | High (LF:6.5, IF:3.75) | Low (LF:5.375, IF:2.75) | Low (LF:5.25, IF:2.75) | Medium (LF:4.875, IF:5.5) |
| High (LF:6, IF:3.75) | Low (LF:2.625, IF:3.75) | Medium (LF:7, IF:2.75) | Critical (LF:7.25, IF:9) | High (LF:3.875, IF:8) |
| Low (LF:5.25, IF:2.75) | Medium (LF:3.125, IF:3.75) | Low (LF:5.5, IF:2.75) | Low (LF:5.25, IF:2.75) | Low (LF:5.75, IF:2) |
| Low (LF:5.25, IF:1.75) | Medium (LF:5.375, IF:3.75) | Low (LF:5.625, IF:2.75) | Critical (LF:6.875, IF:7) | Low (LF:3.125, IF:2.5) |
| Low (LF:5.875, IF:2) | Low (LF:2.375, IF:3.75) | Medium (LF:6.125, IF:2.75) | High (LF:6, IF:5) | Low (LF:5.25, IF:2) |
Table VI presents the comparison of the risk scores calculated using the proposed SRiQT framework by first employing the entire dataset and then is used which excludes the parameters (i.e., regarding the date of the software, experience in language, developer’s and publisher’s experience, number of downloads, update frequency, context, and penalty/reward) for which self-generated data points were utilized. While computing the risk scores for , equation 11 was modified to remove the parameter for a number of downloads and normalize the value of user ratings to bring it into the range [0,1]. The values computed with all the parameters differ significantly from the ones calculated by employing only a subset of all the parameters. Moreover, the values computed by employing (i.e., values in column 3) are exceptionally high, making all the software critically risky. Moreover, these values do not directly correlate to their counterparts, which demonstrates the eminence of the excluded parameters and reflects the importance of the security context of the software, reputation of developer and publisher, and penalty to assess trust-based risk level. The parameters impacting the values presented in column 3 include code dependencies, code coverage, user ratings, forks, vulnerabilities resolved, and total vulnerabilities.
Table VII delineates risk scores calculated by using OWASP risk calculator by 5 assessors working in the computer systems and security domain and have been associated with research and engineering for 5 years or more. As mentioned before, results evaluated by OWASP risk calculator are highly subjective (biased) and it is evident from the scores computed by different assessors in the same setting and context. Please note that and represent the likelihood factor and impact factor, respectively.
IX Conclusion & Future Work
This paper has thoroughly explored the risk assessment associated with software security and shed light on the complex relationship of factors influencing the security and trust of software systems. By evaluating risk scores and categorizing them into bands, we have established a framework for comprehending and communicating the level of risk systematically without subjectivity. Exploring the human element via three key actors (i.e., developers, publishers, and users) and corresponding metrics in the software supply chain further enriched our understanding of the multifaceted nature of software risk.
In the future, the authors intend to carry out a qualitative study to rigorously assess quantitative risk assessment frameworks in the software supply chain. Another promising direction for ongoing investigation is developing a simulator for software supply chain simulation and data generation for risk assessment. Such a simulator will significantly enhance our ability to model and analyze diverse risk scenarios, enabling more comprehensive risk assessments. Through simulated data generation, we will be able to systematically test the resilience of software systems under various conditions, helping us refine risk quantification methodologies and fortify our defenses against potential vulnerabilities. Moreover, we intend to utilize techniques like reinforcement learning to facilitate the risk assessment as well as the validation process.
X Acknowledgments
This research paper is conducted under the 6G Security Research and Development Project, as led by the Commonwealth Scientific and Industrial Research Organisation (CSIRO) through funding appropriated by the Australian Government’s Department of Home Affairs. This paper does not reflect any Australian Government policy position. For more information regarding this Project, please refer to https://research.csiro.au/6gsecurity/.
References
- [1] B. Hammi and S. Zeadally, “Software Supply-Chain Security: Issues and Countermeasures,” Computer, vol. 56, no. 7, pp. 54–66, 2023.
- [2] M.S. Melara and M. Bowman. “What is Software Supply Chain Security?,” arXiv preprint arXiv:2209.04006, 2022.
- [3] C. J. Alberts, A. J. Dorofee, R. Creel, R. J. Ellison and C. Woody, “A Systemic Approach for Assessing Software Supply-Chain Risk,” In 44th Hawaii International Conference on System Sciences, USA, pp. 1–8, 2011.
- [4] Y. Wang, B. Chen, K. Huang, B. Shi, C. Xu, X. Peng, Y. Wu and Y. Liu, “An empirical study of usages, updates and risks of third-party libraries in java projects,” In IEEE International Conference on Software Maintenance and Evolution (ICSME), pp. 35–45, 2020.
- [5] B. Zhao, S. Ji, J. Xu, Y. Tian, Q. Wei, Q. Wang, C. Lyu, X. Zhang, C. Lin, J. Wu and R. Beyah, “One Bad Apple Spoils the Barrel: Understanding the Security Risks Introduced by Third-Party Components in IoT Firmware,” IEEE Transactions on Dependable and Secure Computing, pp. 1–18, 2023.
- [6] European Network and Information Security Agency (ENISA), “Threat Landscape for Supply Chain Attacks,” 2021.
- [7] Cybersecurity & Infrastructure Security Agency (CISA), “Securing the software supply chain”, Enduring Security Framework, 2022.
- [8] S. Esayas and T. Mahler, “An integrated method for compliance and risk assessment: experiences from a case study,” In IEEE Conference on Communications and Network Security (CNS), Florence, pp. 568–576, 2015.
- [9] S. Hart, A.L. Ferrara and F. Paci, “Fuzzy-based approach to assess and prioritize privacy risks,” Soft Computing, vol. 24, pp.1553–1563, 2020.
- [10] X. Wang, Y. Xu and W. Li, “Research on the risk evaluation of enterprises’ carbon compliance failure,” Frontiers in Ecology and Evolution, vol. 11, pp. 1152804, 2023.
- [11] S. Taylor, M. Surridge and B. Pickering, “Regulatory compliance modelling using risk management techniques, ” In IEEE World AI IoT Congress (AIIoT), pp. 0474–0481, 2021.
- [12] Z. Kenesei, K. Ásványi, L. Kökény, M. Jászberényi, M. Miskolczi, T. Gyulavári, J. Syahrivar, “Trust and perceived risk: How different manifestations affect the adoption of autonomous vehicles,” Transportation Research Part A: Policy and Practice, vol. 164, pp. 379–393, 2022.
- [13] F. Hou, S. Jansen, “A systematic literature review on trust in the software ecosystem,” Empirical Software Engineering, vol. 28, no. 8, 2023.
- [14] P. Mell, K. Scarfone, and S. Romanosky, National Institute of Standards and Technology, “The Common Vulnerability Scoring System (CVSS) and Its Applicability to Federal Agency Systems,” Computer Security Division, 2007.
- [15] G. Elahi, E. Yu and N. Zannone, “Security Risk Management by Qualitative Vulnerability Analysis,” In Third International Workshop on Security Measurements and Metrics, Canada, pp. 1–10, 2011.
- [16] Software Engineering Institute (SEI), “Managing Uncertainty in a Changing World,” Risk Management Conference, 1997.
- [17] L.L. Russo, “Software System Safety Guide,” US Army Communications - Electronic Command (CECOM), 1992.
- [18] Air Force Systems Command and Air Force Logistics Command (AFSC/AFLC), “Software Risk Abatement,” 1988.
- [19] A. McKinlay VI, “Software System Safety Engineering,” Software Safety Eng. Course, June 1992.
- [20] R. Wang, L. Gao, Q. Sun and D. Sun, “An Improved CVSS-based Vulnerability Scoring Mechanism,” In Third International Conference on Multimedia Information Networking and Security, China, pp. 352–355, 2011.
- [21] B. Chess, “Metrics that matter: Quantifying software security risk,” In Workshop on Software Security Assurance Tools, Techniques, and Metrics, pp. 500–265, 2006.
- [22] D. E. Neumann, “An enhanced neural network technique for software risk analysis,” IEEE Transactions on Software Engineering, vol. 28, no. 9, pp. 904–912, 2002.
- [23] Supply-chain Levels for Software Artifacts (SLSA), “Safeguarding artifact integrity across any software supply chain,” https://slsa.dev/ [accessed on: Feb 19, 2024].
- [24] P. Ladisa, H. Plate, M. Martinez and O. Barais, “Sok: Taxonomy of attacks on open-source software supply chains,” In IEEE Symposium on Security and Privacy (SP), pp. 1509–1526, 2023.
- [25] OWASP Risk Rating Methodology, https://owasp.org/www-community/OWASP\_Risk\_Rating\_Methodology, Accessed on: 22-03-2024.
- [26] Open Source Security Foundation (OpenSSF), https://github.com/ossf/scorecard, Accessed on: 22-03-2024.
- [27] C. Clancy, J. Ferraro, R. Martin, A. Pennington, C. Sledjeski and C. Wiener, MITRE, “Deliver uncompromised: Securing critical software supply chains,” MITRE Technical Papers 24, p. 01, 2021.
- [28] NIS Cooperation Group, “EU Coordinated Risk Assessment of the Cybersecurity of 5G Networks,” 2019.
- [29] P. Ladisa, H. Plate, M. Martinez, O. Barais and S. E. Ponta, “Risk Explorer for Software Supply Chains: Understanding the Attack Surface of Open-Source based Software Development,” In ACM Workshop on Software Supply Chain Offensive Research and Ecosystem Defenses, pp. 35–36, 2022.
- [30] N. Zahan, S. Shohan, D. Harris, and L. Williams, “Do Software Security Practices Yield Fewer Vulnerabilities?,” In IEEE/ACM 45th International Conference on Software Engineering: Software Engineering in Practice (ICSE-SEIP), pp. 292–303, 2023.
- [31] H. Joh, and Y.K. Malaiya, “A framework for software security risk evaluation using the vulnerability lifecycle and CVSS metrics,” In International Workshop on Risk and Trust in Extended Enterprises, pp. 430–434, 2010.
- [32] C. Kumar and D.K. Yadav, “A probabilistic software risk assessment and estimation model for software projects,” Procedia Computer Science, vol. 54, pp. 353–361, 2015.
- [33] Z.S. Shaukat, R. Naseem and M. Zubair, “A dataset for software requirements risk prediction,” In IEEE International Conference on Computational Science and Engineering (CSE), pp. 112–118, 2018.
- [34] S.K. Pemmada, J. Nayak and B. Naik, “A deep intelligent framework for software risk prediction using improved firefly optimization,” Neural Computing and Applications, vol. 35, no. 26, pp. 19523–19539, 2023.
- [35] OpenSSF Scorecard Report, https://securityscorecards.dev/viewer/?uri=, Accessed on: 02-04-2024.
- [36] OWASP Risk Rating Calculator, https://www.owasp-risk-rating.com/, Accessed on: 02-04-2024.
- [37] S.A. Siddiqui, A. Mahmood, Q.Z. Sheng, H. Suzuki and W. Ni, “Trust in Vehicles: Toward Context-Aware Trust and Attack Resistance for the Internet of Vehicles,” IEEE Transactions on Intelligent Transportation Systems, vol. 24, no. 9, pp. 9546–9560, 2023.
- [38] K. Dempsey, P. Eavy, G. Moore, National Institute of Standards and Technology (NIST), “Automation Support for Security Control Assessments”, 2017.
- [39] K.L. Dempsey, N.S. Chawla, A. Johnson, R. Johnston, A.C. Jones, A. Orebaugh, M. Scholl, K. Stine, National Institute of Standards and Technology (NIST), “Information security continuous monitoring (ISCM) for federal information systems and organizations,” 2011.
- [40] X. Song, D. Jin, L. Yu, G.M. Lee, L. Wong, P. Harvey and L. Ciavaglia, ITU-T Focus Group on Autonomous Networks, “Trustworthiness evaluation for autonomous networks including IMT-2020 and beyond,” ITU-T Technical Specification, 2022.
- [41] S. Ganeriwal, L.K. Balzano and M.B. Srivastava, “Reputation-based framework for high integrity sensor networks,” ACM Transactions on Sensor Networks (TOSN), vol. 4, no. 3, pp. 1–37, 2008.
- [42] J. Kang, Z. Xiong, D. Niyato, D. Ye, D.I. Kim and J. Zhao, “Toward secure blockchain-enabled internet of vehicles: Optimizing consensus management using reputation and contract theory,” IEEE Transactions on Vehicular Technology, vol. 68, no.3, pp.2906–2920, 2019.
- [43] L. Williams, “Trusting trust: Humans in the software supply chain loop,” IEEE Security & Privacy, vol. 20, no. 5, pp. 7–10, 2022.
- [44] M. Fourné, D. Wermke, S. Fahl and Y. Acar, “A Viewpoint on Human Factors in Software Supply Chain Security: A Research Agenda,” IEEE Security & Privacy, vol. 21, no. 6, pp. 59–63, 2023.
- [45] S. Sagar, A. Mahmood, Q.Z. Sheng, J.K. Pabani and W.E. Zhang, “Understanding the trustworthiness management in the social internet of things: a survey,” arXiv preprint arXiv:2202.03624 , 2022.
- [46] Y. Yu, Q. Lu and Y. Fu, “Dynamic Trust Management for the Edge Devices in Industrial Internet,” IEEE Internet of Things Journal, pp. 1–11, 2024.
- [47] S. Miller, B. Ainsworth, L. Yardley, A. Milton, M. Weal, P. Smith and L. Morrison, “A Framework for Analyzing and Measuring Usage and Engagement Data (AMUsED) in Digital Interventions: Viewpoint,” Journal of Medical Internet Research, vol. 21, no. 2, p.e10966, 2019.
- [48] G. Bhandari, A. Naseer, and L. Moonen, “CVEfixes: automated collection of vulnerabilities and their fixes from open-source software,” In 17th International Conference on Predictive Models and Data Analytics in Software Engineering, pp. 30–39, 2021.
- [49] Joint Technical Committee ISO/IEC, Information Technology – Security Techniques – Information Security Management Systems, 2018.
- [50] J. Tellnes, “Dependencies: No software is an island,” Master’s thesis, The University of Bergen, 2013.
- [51] Snyk, “Software dependencies: How to manage dependencies at scale,” https://snyk.io/series/open-source-security/software-dependencies/, Accessed on 20-03-2024.
- [52] W.E. Wong, Y. Qi, and K. Cooper, “Source code-based software risk assessing,” In Proceedings of the 2005 ACM symposium on Applied computing, pp. 1485–1490, 2005.
- [53] A. Bosu and J.C. Carver, “Impact of developer reputation on code review outcomes in oss projects: An empirical investigation,” In Proceedings of the 8th ACM/IEEE international symposium on empirical software engineering and measurement, pp. 1–10, 2014.
- [54] K.A. Ericsson, “The influence of experience and deliberate practice on the development of superior expert performance,” The Cambridge handbook of expertise and expert performance, vol. 38, pp. 685–705, 2006.
- [55] M. Ivanković, G. Petrović, R. Just, and G. Fraser, “Code coverage at Google,” In Proceedings of the 27th ACM Joint Meeting on European Software Engineering Conference and Symposium on the Foundations of Software Engineering, pp. 955–963, 2019.
- [56] S. Elbaum, D. Gable, and G. Rothermel, “The impact of software evolution on code coverage information,” In Proceedings IEEE International Conference on Software Maintenance (ICSM), pp. 170–179, 2001.
- [57] S. G. Elbaum and J. C. Munson, “Evaluating regression test suites based on their fault exposure capability,” Journal of Software Maintenance: Research and Practice, vol. 12, no. 3, pp. 171-–184, 2000.
- [58] S. A. Siddiqui, A. Mahmood, Q. Z. Sheng, H. Suzuki, and W. Ni, “Trust in vehicles: toward context-aware trust and attack resistance for the internet of vehicles,” IEEE Transactions on Intelligent Transportation Systems, vol. 24, no. 9, pp. 9546–9560, 2023.
- [59] F. Ahmad, F. Kurugollu, C. A. Kerrache, S. Sezer and L. Liu, “NOTRINO: A NOvel hybrid TRust management scheme for Internet-of-Vehicles,” IEEE Transactions on Vehicular Technology, vol. 70, no. 9, pp. 9244-9257, 2021.
- [60] Y. Chen, L. Li, W. Li, Q. Guo, Z. Du, Z. Xu, “Chapter 2 - Fundamentals of neural networks”, Eds. Y. Chen, L. Li, W. Li, Q. Guo, Z. Du, Z. Xu, AI Computing Systems, pp. 17–51, 2024.
- [61] Contributing to a project, https://docs.github.com/en/get-started/exploring-projects-on-github/contributing-to-a-project, Accessed on: 25-03-2024.
- [62] H. Gao, C. Liu, Y. Yin, Y. Xu and Y. Li, “A hybrid approach to trust node assessment and management for VANETs cooperative data communication: Historical interaction perspective,” IEEE Transactions on Intelligent Transportation Systems, vol. 23, no. 9, pp. 16504-16513, 2022.