SiCo: A Size-Controllable Virtual Try-On Approach
for Informed Decision-Making
Abstract
Virtual try-on (VTO) applications aim to improve the online shopping experience by allowing users to preview garments, before making purchase decisions. However, many VTO tools fail to consider the crucial relationship between a garment’s size and the user’s body size, often employing a one-size-fits-all approach when visualizing a clothing item. This results in poor size recommendations and purchase decisions leading to increased return rates. To address this limitation, we introduce SiCo, an online VTO system, where users can upload images of themselves and visualize how different sizes of clothing would look on their body to help make better-informed purchase decisions. Our user study shows SiCo’s superiority over baseline VTO. The results indicate that our approach significantly enhances user ability to gauge the appearance of outfits on their bodies and boosts their confidence in selecting clothing sizes that match desired goals. Based on our evaluation, we believe our VTO design has the potential to reduce return rates and enhance the online clothes shopping experience. Our code is available at https://github.com/SherryXTChen/SiCo.
 |
 |
 |
 |
 |
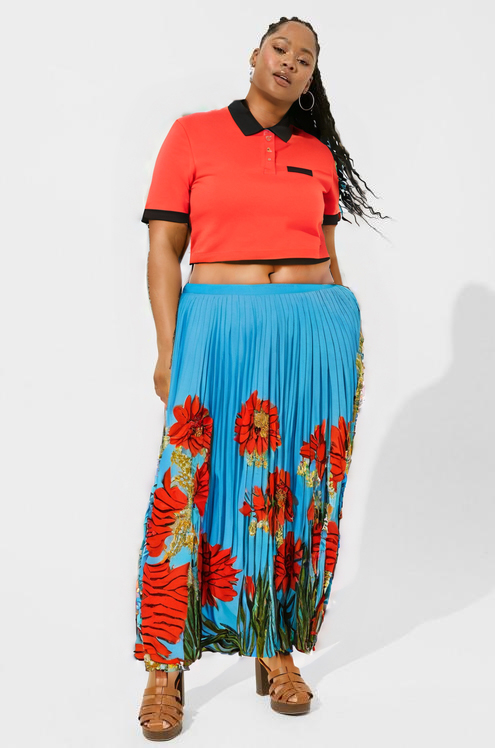 |
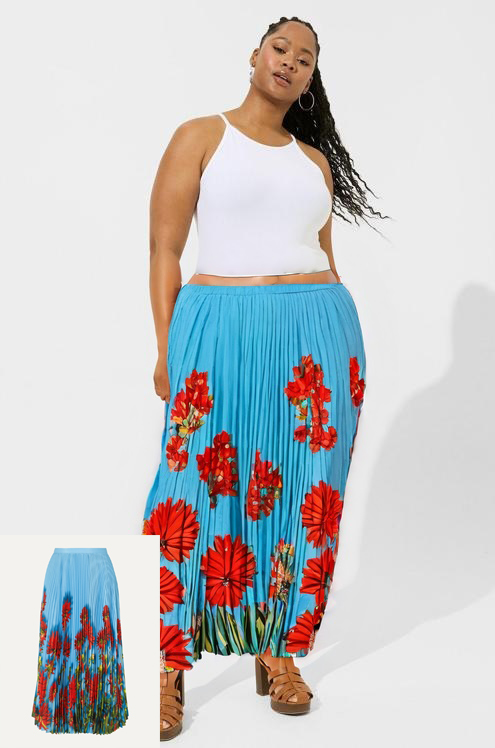
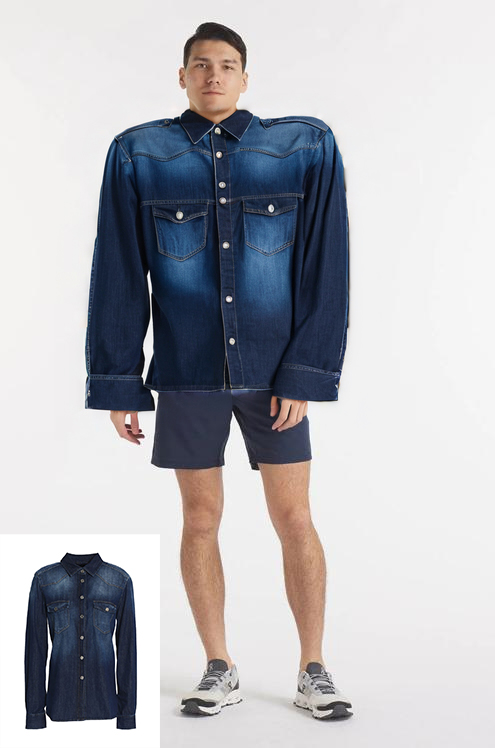
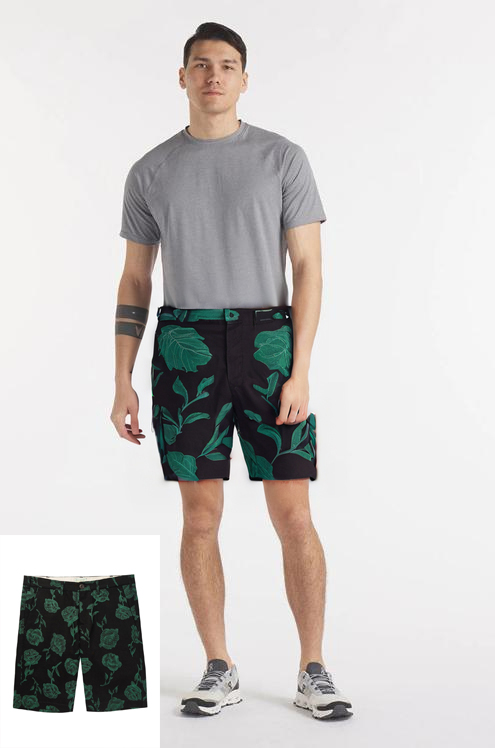
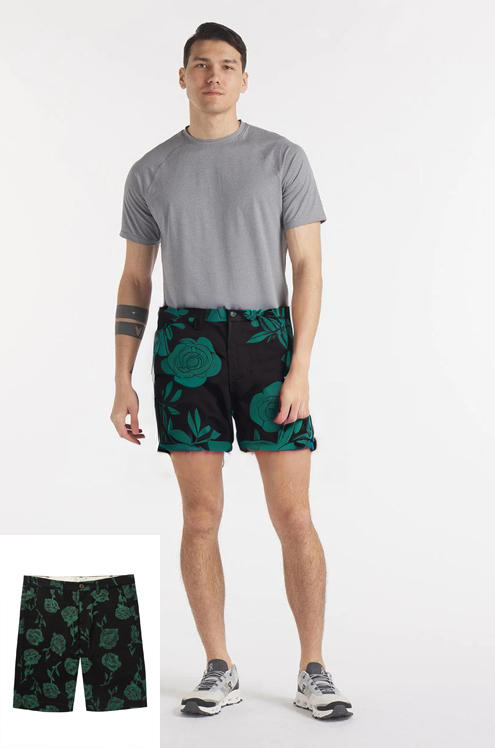
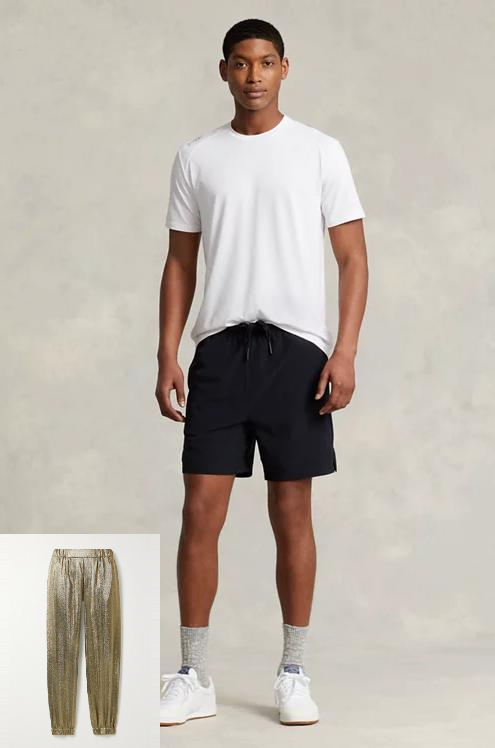
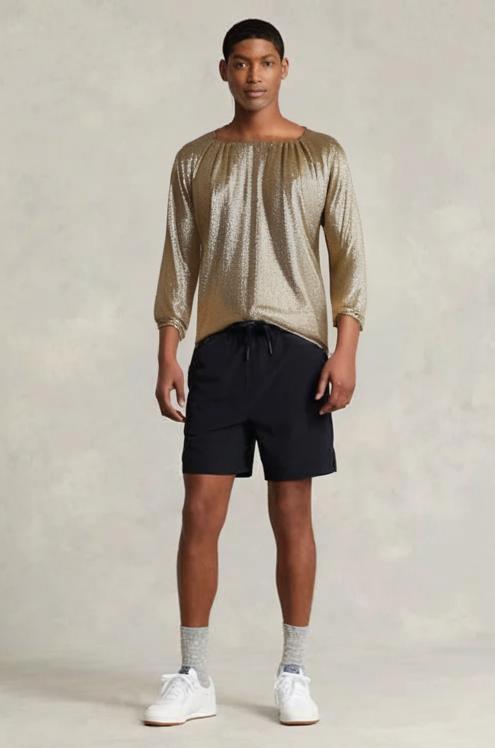
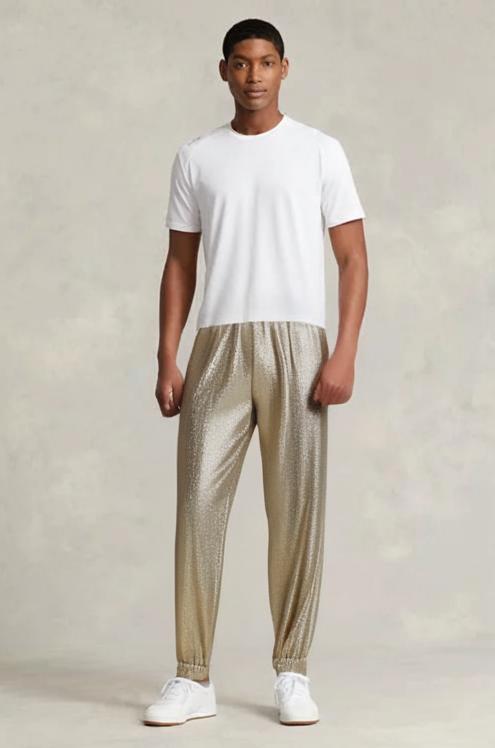
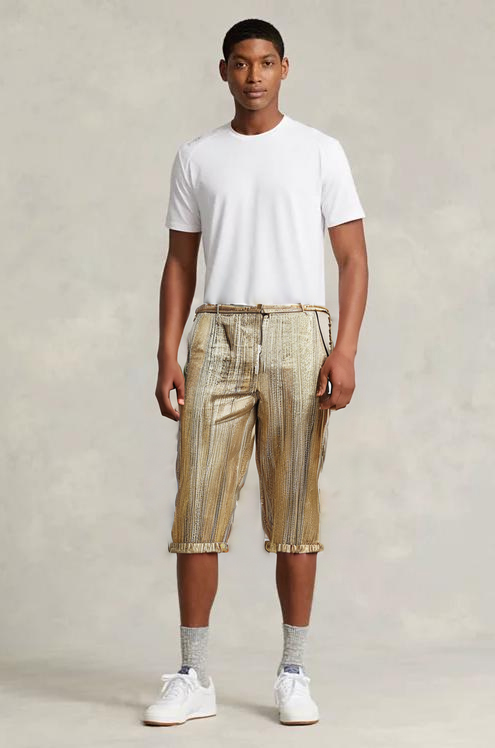
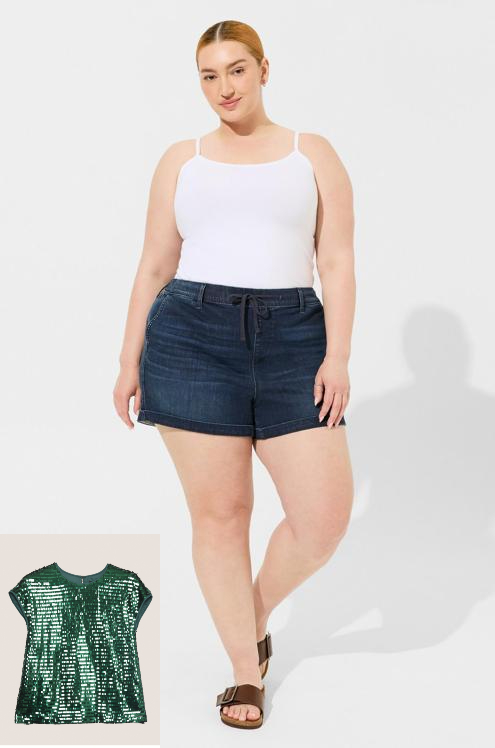
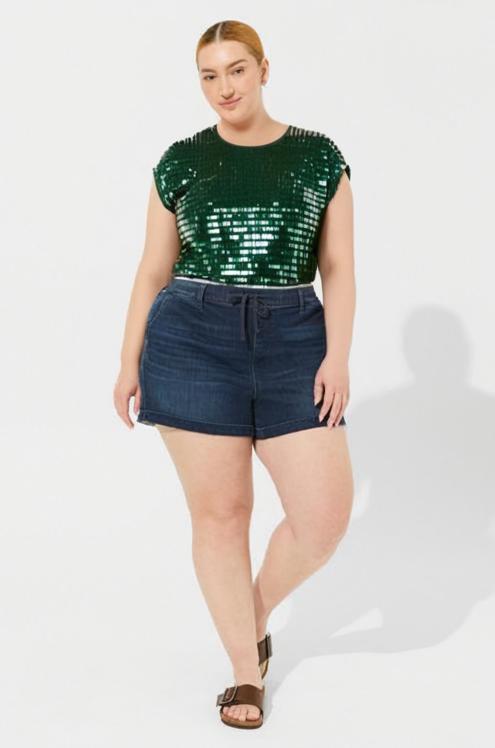
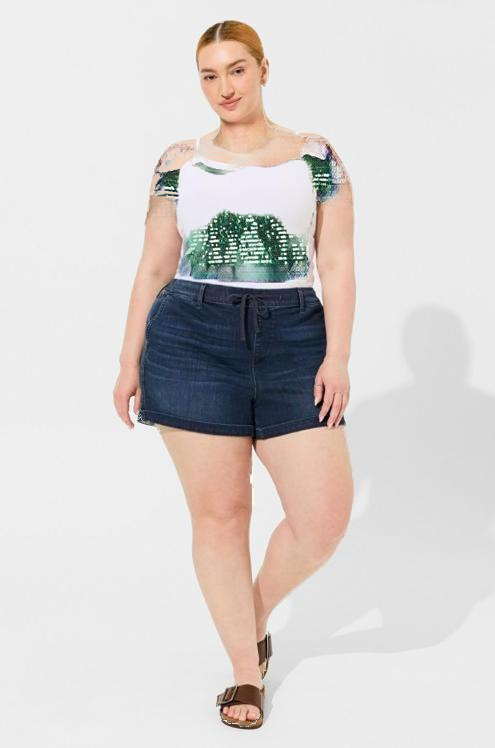
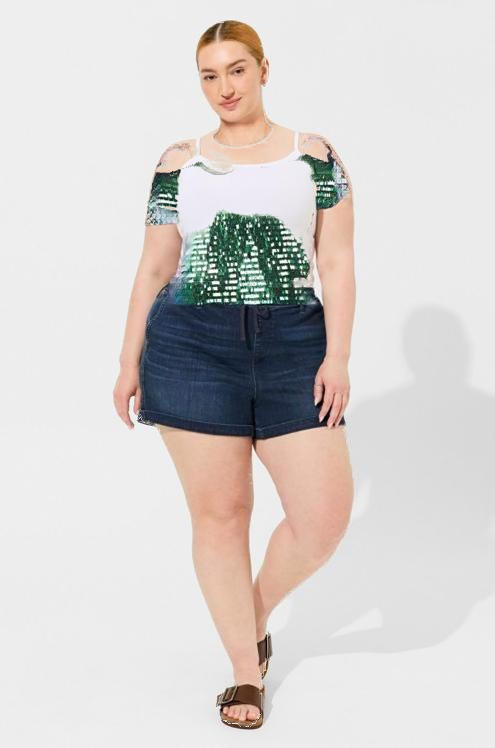
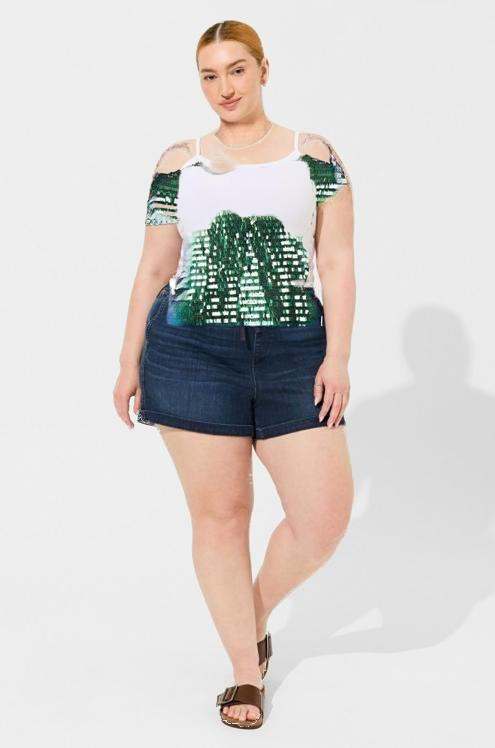
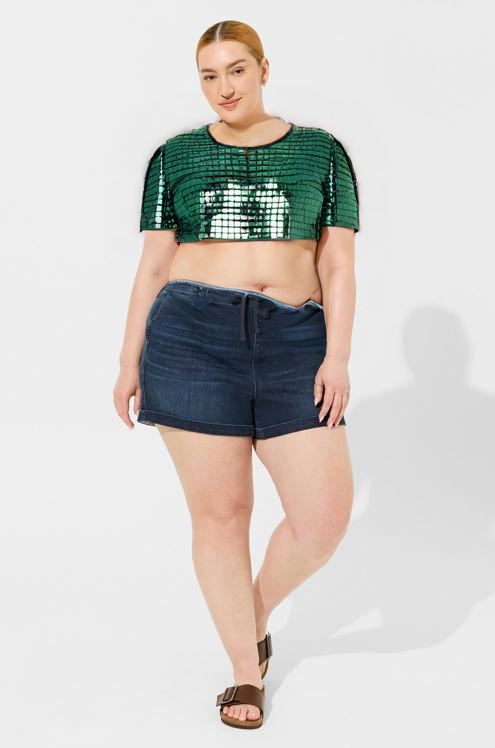
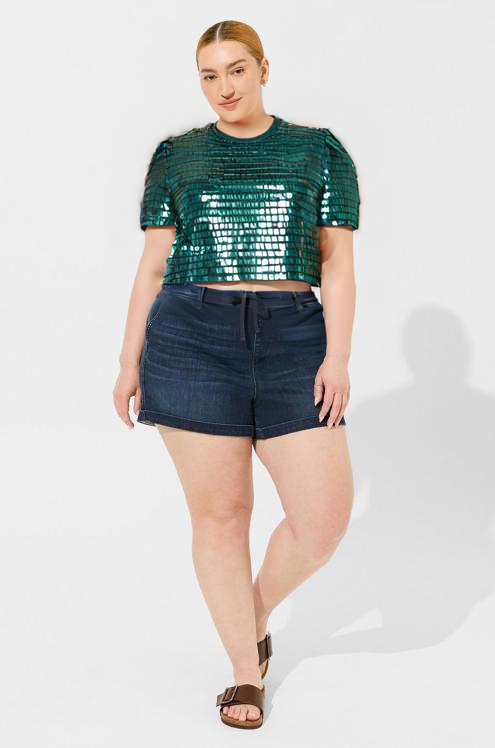
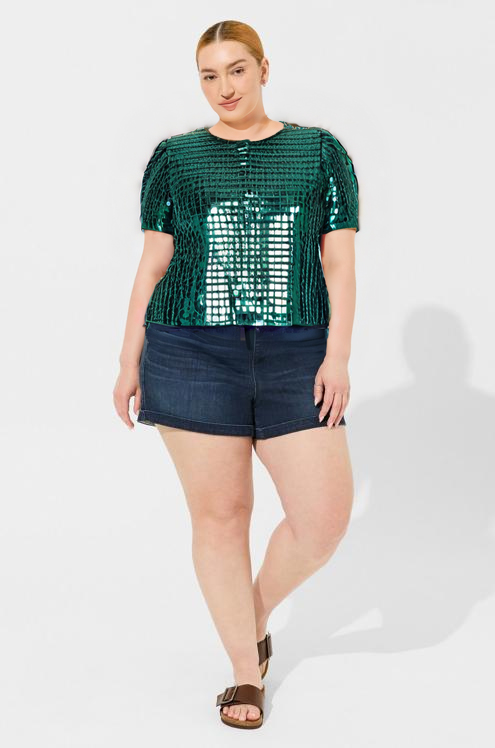
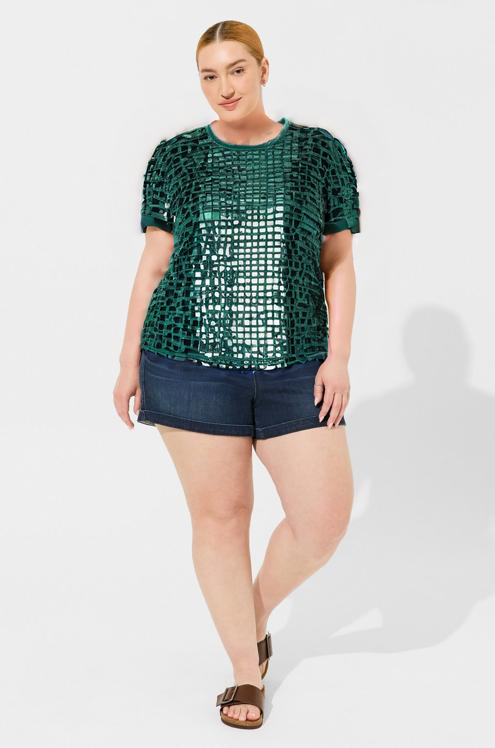
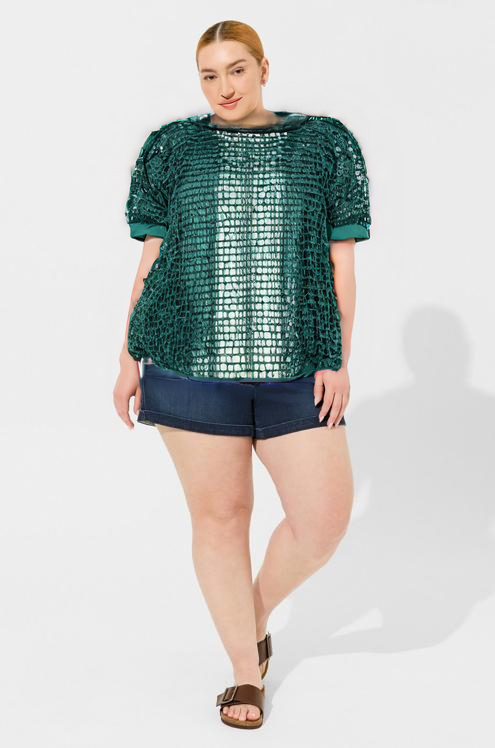
| true T: XL true B: XL | selected T: XL (-) | selected T: M () | selected B: XL (-) | selected B: XXL () | true T: M () selected B: XXL () |
 |
 |
 |
 |
 |
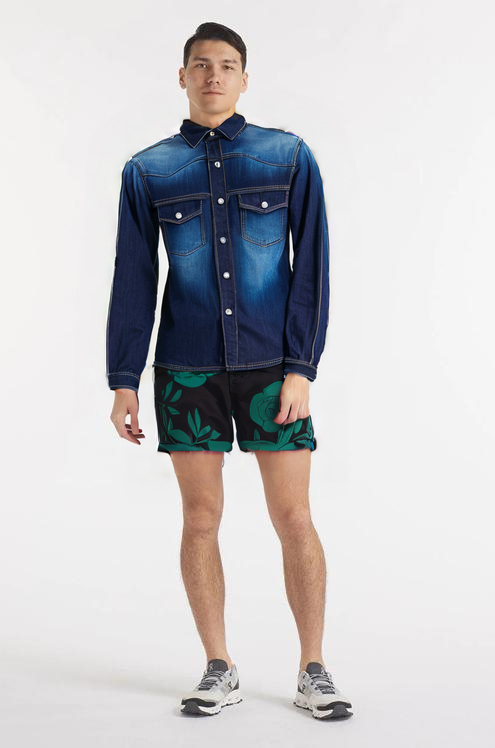 |
| true T: S true B: M | selected T: S (-) | selected T: XL () | selected B: M (-) | selected B: S () | true T: S (-) selected B: S () |
1 Introduction
With the rise of online clothing shopping due to its convenience, virtual try-on (VTO) applications have been developed to bridge the information gap often encountered by customers as they struggle to accurately estimate size and fit. VTO applications have attempted to solve this problem by providing different types of visual information [35, 46, 3, 33], using both 2D screen-based and 3D augmented and virtual reality methods. Several surveys have demonstrated varying degrees of impact that VTO has had on reducing return rates. A recent study by Vogue Businesss [4] showed that VTO experiences significantly reduce return rates, with an average decrease of 25% for brands using digital mannequin try-on services. An earlier 2021 study by Glossy [18] found that brands offering VTOs experienced 64% fewer returns compared to those that did not. For instance, Macy’s reduced its return rate to less than 2% after introducing virtual fitting rooms in 2023, while Shopify saw a 40% drop in returns due to the introduction of augmented reality (AR) VTO.
Despite these advantages, the primary reason for returns - size/fit issues, which account for 53% of returns in the US according to a 12-month survey in 2023 by Coresight Research [11], has largely been overlooked. Most VTO methods use a one-size-fits-all approach, assuming garments fit all body types the same way. This leads to visualizations that omit crucial information, failing to show users how clothing will actually fit their specific body shape.
Newer image-based VTO methods offer the potential to address the size and fit issue to help further reduce return rates. These methods transform the original garment and apply rendering techniques to match the garment with the person’s pose using advanced body segmentation and pose prediction technologies [34, 23, 14, 8, 36, 12]. These image-based methods can be less expensive to build and deploy compared to virtual fitting rooms or AR counterparts. Their potential for direct integration into current online shopping experiences is substantial, as they eliminate the need for additional hardware such as virtual/augmented reality headsets [43, 33], hardware setups [17, 44], or other wearable devices [10].
A critical limitation is that image-based methods rely on machine learning methods predominantly trained on datasets featuring models with slim figures which introduces a bias towards specific body shapes [34, 23, 14, 8, 36]. Although some systems have attempted to incorporate user measurements, such as torso-to-shoulder ratio [7], or have tried to simulate how models of varying sizes appear in garments that match their size [20], these efforts remain somewhat superficial. They do not fully capture the complex relationship between a user’s actual size and the size of the garment, nor do they account for individual preferences for tighter or looser fits. This gap underscores the need for more nuanced approaches to VTO technologies that can accommodate a broader spectrum of sizes and fit preferences.
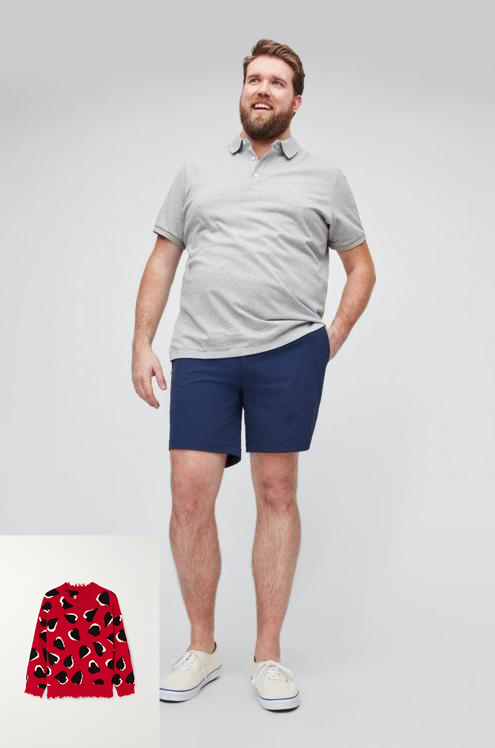
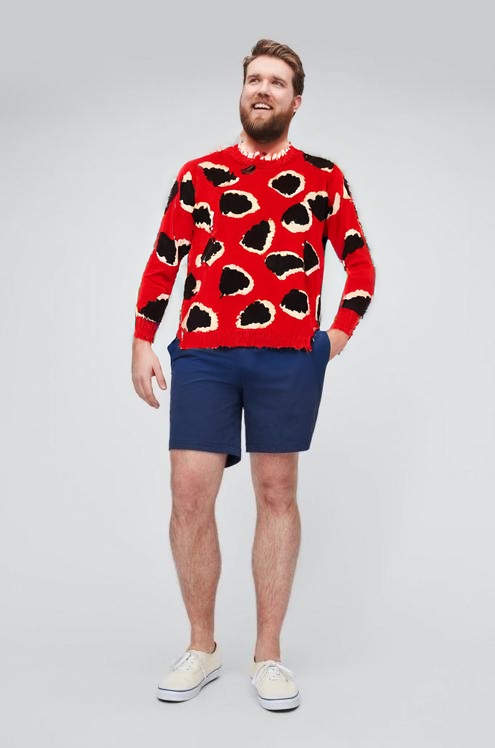
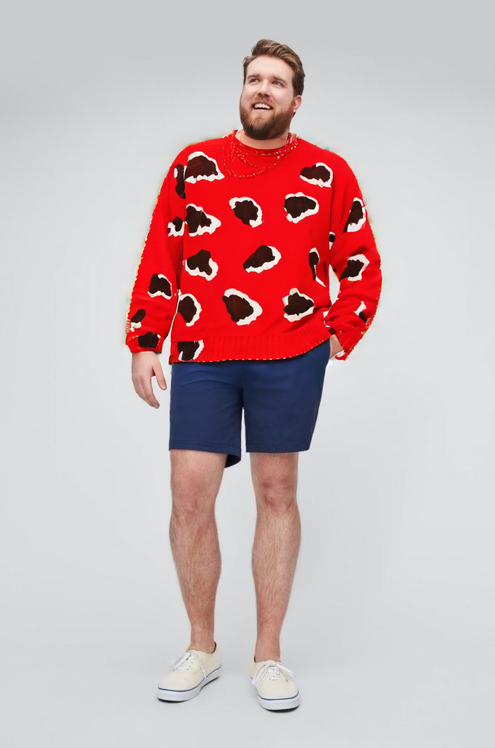
To this end, we present SiCo, a web-based image-based VTO system that allows users to visualize how a garment in different sizes will look on their body. This is the equivalent of trying on various sizes in-store where a person may like how size L fits and looks on them despite their actual size being S. Our VTO interface design mirrors popular online clothing stores, allowing users to select garments in their preferred size with the added functionality of trying-on the chosen garment on themselves. To enable the try-on functionality, users are prompted to enter their true size for a garment (e.g., T-shirt of size XS) and upload a photo of themselves or select one from a provided set of model images. The latter option allows people to preserve privacy but still have the ability to view a garment on a body shape that closely matches theirs. The uploaded image serves as the foundation for visualizing personalized VTO results, enabling users to virtually try on clothing items and see how the garment would look on them, in different sizes. Our system’s backbone incorporates Stable Diffusion [37], enhanced with an IP-Adapter [41] which takes a chosen garment image and accurately overlays it onto the user’s image. We further refine the output image generation using ControlNet [45] by leveraging the contours of the user’s body, which are extracted using DensePose [22] body segmentation from the uploaded image. This is done to avoid model bias, which otherwise results in the generation of unrealistically slim or muscular figures, most dominant in the training datasets. Overall, our system uses existing AI models to offer novel functionality. It enables users to visualize clothing on their own images, a capability not previously available in mainstream VTO applications nor explored in prior work. Our unique approach allows people to make more informed decisions about fit and size before purchasing, addressing a key challenge in online clothing shopping.
To assess the impact of SiCo on enhancing the decision-making process in online clothing shopping, we conducted a user study involving 48 participants. Each participant interacted with two out of four versions of our system: some versions included our size-controllable VTO functionality, while others offered baseline VTO functionality. Our findings reveal a strong preference for the VTO version incorporating size control. Participants reported that this personalization feature significantly improved their ability to visualize how outfits would look on them, enriched their comprehension of the garment’s appearance, and increased their confidence in making clothing decisions.
In summary, our contributions include:
-
•
The design of a size-controllable Virtual Try-On (VTO) system that enables users to adjust and control the fit of garments.
-
•
The development of a web-based interface that facilitates easy indication of size/fit preferences and supports the styling of multiple garments.
-
•
Results from a user study that indicate the positive impact of our system on user experience and decision-making related to online clothing shopping.
2 Related Work
2.1 VTO Image Datasets
VTO datasets are crucial for developing effective VTO systems. These datasets encompass various types of information, that typically includes photos of individuals wearing clothes, often in full or medium frontal views, along with additional image data. Most of these datasets contain paired images, where each photo of a person is accompanied by a corresponding image of the garment they are wearing. This pairing, seen in many datasets [34, 23, 8, 36], provides the foundational basis for VTO methods to understand the relationship between a selected garment and the desired VTO outcome. However, the requirement for paired images significantly restricts the types of samples that can be included, consequently limiting the dataset size. To address this limitation, some datasets [12] incorporate unpaired images, where the garments worn by individuals in the photos may not be individually identifiable. Several datasets [34, 14] also include photos of people in various poses and angles to enhance the diversity of human images.
VTO image datasets feature additional data, such as human landmarks, body segmentation, and clothing segmentation [23, 8, 36], which can be used to align garments with human poses to produce seamless VTO visuals. Some datasets also incorporate text descriptions or tags related to the garments, facilitating garment retrieval, outfit recommendations, and text-guided VTO processes [34, 28, 29].
Despite the wealth of information and variety these datasets offer, their limitations impact the effectiveness of VTO techniques trained on them. Many datasets [23, 14, 8, 12] exhibit a bias towards specific types of clothing, such as tops, which may hinder the generalization of VTO systems to other garment types. Additionally, a significant portion of the images in these datasets depict individuals with slender body types, potentially biasing VTO methods towards only accommodating those body types or altering the body shapes of input images to match the data. To address this limitation and promote body diversity, we propose leveraging a more versatile image generation model, such as Stable Diffusion [37], with added functionality for controlling human body contours to preserve body identity.
2.2 Image-based VTO Methods
VTO methods strive to create realistic depictions of individuals wearing selected garments. Image-based VTO techniques specifically focus on achieving this with 2D images, primarily by superimposing clothing onto human figures. Traditional VTO approaches start by parsing human images to extract markers, poses, and dense pose data using pre-trained models [5, 22]. This information is then used to adapt the target garments to align with the human body [23, 39]. Numerous studies have followed this approach, parsing input images to obtain various representations, such as human-clothing segmentation [32, 8] and clothing-agnostic person representations [24, 42, 15].
Conversely, another body of work [27, 16, 26] highlights the limitations of these methods, which largely depend on external pre-trained parser models, and advocates for a parser-free strategy. This approach means the model independently learns intrinsic human representations for garment wrapping, typically derived from methods based on parsing [16] or pre-trained garment wrapping modules [27].
However, the limited capacity of these methods’ model architectures, combined with biases in the training datasets, often compromises the quality and generalizability of the models. Recent studies [9, 21, 47, 29] have begun to exploit and train/fine-tune diffusion models [13, 38, 37] instead of the traditionally used GANs [19] to foster high-quality and more robust applications. Some of these works continue to rely on parsed information like human pose and segmentation to guide the generation process [9, 21], while others utilize only the human-garment image pair, relying on the model’s ability to synthesize high-quality results [47, 29].
Despite all these advancements, many methods utilize a generalized approach, presuming a universal fit for garments across all body types. This generalization significantly limits their effectiveness in aiding customers with important decisions related to garment sizing. For instance, Google introduced a virtual try-on feature [20] that displays results on models of different sizes but merely illustrates a standard fit, without accommodating alternative fits (oversized/cropped) that users may desire. Furthermore, existing studies that take into account specific measurements, such as the shoulder-to-shoulder ratio [7], fail to provide intuitive, actionable garment size recommendations that facilitate user decision-making. While generative models like Stable Diffusion (SD) [37] can create a wide range of images, they are not exempt from biases, including those related to race and gender [1, 6, 40], which can compromise their ability to maintain user identity in VTO outcomes. Notably, our experiments indicate that SD tends to modify user body shapes towards slimmer and more muscular representations, which could distort the authenticity of the try-on experience, making it less ideal for VTO system design. In turn, we adopt an identity preservation mechanism that condition SD outputs on the body contour of the user to maintain how user body looks. Thus, our system aims to reduce existing biases in AI models, potentially improving inclusivity. This could lead to a better online shopping experience for a more diverse group of customers.
2.3 VTO Applications
VTO has become a hot topic in the retail industry due to its vast commercial potential. This technology allows consumers to virtually see themselves in different clothing items without requiring a physical try-on, providing a more personalized shopping experience through tailor-made clothing recommendations based on a customer’s body type, style preferences, and past purchases.
While a large amount of prior work has focused on VTO for clothing try-ons, the technology has also been applied to other items such as glasses, shoes, and accessories. For example, Liu et al. [33] compared VTO using personalized animated avatars in XR (Extended Reality) with traditional online interfaces, demonstrating that XR can positively influence the shopping experience by allowing realistic garment visualization. Yuan et al. [44] built an XR application for VTO that allows users to view virtual clothes from different angles in real-time as they move. Giovanni et al. [17] used a Kinect sensor and a High-Definition (HD) camera to enhance the performance of VTO in XR. In recent years, VTO has been integrated into mobile AR (Augmented Reality) applications, such as Snapchat, allowing a broad audience to access VTO using their phones [2].
In addition to XR techniques, Chong et al. [10] designed an actuated mannequin that captured garment deformations under diverse body poses. Although these applications have boosted the VTO experience with various immersive and spatial technologies, most of them require complicated and careful hardware setups, such as AR/VR headsets, wearable devices, and data capture sensors. These setups may be time-consuming and expensive and cannot easily be integrated with existing at-home online shopping experiences. Our system overcomes these limitations by building on top of familiar web technologies, without the need for newer hardware.
3 Design Objectives
Our work addresses the size and fit issues prevalent in current VTO systems. Most existing VTO solutions employ either model images or 3D avatars, both of which have limitations. Model images often fail to accurately represent the diverse body types of users, while 3D avatars, although more customizable, can be difficult for users to interpret in terms of how well clothing would actually fit them. By focusing on these challenges, we aim to develop a more user-friendly solution that provides a better understanding of how clothing items will fit their unique body type. To devise a VTO system that enhances user decision-making in online clothing shopping, we set the following design objectives for ourselves.
Integration into current user shopping experiences (DO1) To directly enhance the current user experience in online clothing shopping, we propose designing our interface within the same medium — as a website. While there exist other mediums for VTO interfaces, such as virtual and augmented reality [33, 44, 17] and other wearables [10], each with its own advantages, these mediums represent a significant departure from the familiar online shopping environment. Not only are these hardware options still inaccessible to a large portion of the general audience, but they also introduce increased physical demands to the shopping experience, despite one of the primary appeals of online clothing shopping being its low requirement for physical effort. Therefore, we design our VTO system to be entirely web-based, enabling easy potential integration with most existing online clothing websites.
Simulating in-store fitting room experience online (DO2) Ultimately, users desire to confidently wear garments purchased online without encountering discrepancies between reality and their expectations, at the time of purchase. Therefore, VTO results should enable users to visualize themselves in the selected garments as directly as possible. Traditional online shopping websites often require users to imagine how they might appear in garments modeled by individuals with different physiques. While more websites are beginning to feature models with diverse appearances, relying on others’ photos still introduces a level of abstraction to the decision-making process. Conversely, some VTO systems utilize avatars and 3D reconstructed human geometry to overlay results. However, many of these 3D models struggle to accurately represent user appearances, creating a disconnection when users attempt to identify with the 3D avatars. To address this issue, when users first access our VTO system, we ask them to upload a recent full-body photograph of themselves. Photos not only serve as accurate visual representations of users, aiding in their identification, but also offer timely feedback on how garments will look on them in the present moment should they choose to provide a recent photo.
Ease of size indication (DO3) Size indication is a necessary and yet challenging aspect of making online clothing purchase decisions, especially as size representation can vary widely across clothing websites. For instance, many online clothing websites provide product measurements, allowing users to compare them with similar items they own or their own body measurements to determine the appropriate size. Likewise, some websites have size-recommendation tools that demand users to share a wide range of personal details like height, weight, age, bra size, waist size, and so on, before offering suggestions. However, users may be uncertain about their measurements, and obtaining accurate measurements on the spot can be challenging. Instead, we propose requesting users’ true sizes in the form of standard size labels, ranging from XXS to XXL. These labels are readily accessible and directly aligned with the garment size options users encounter during the purchasing process.
4 Interface Design
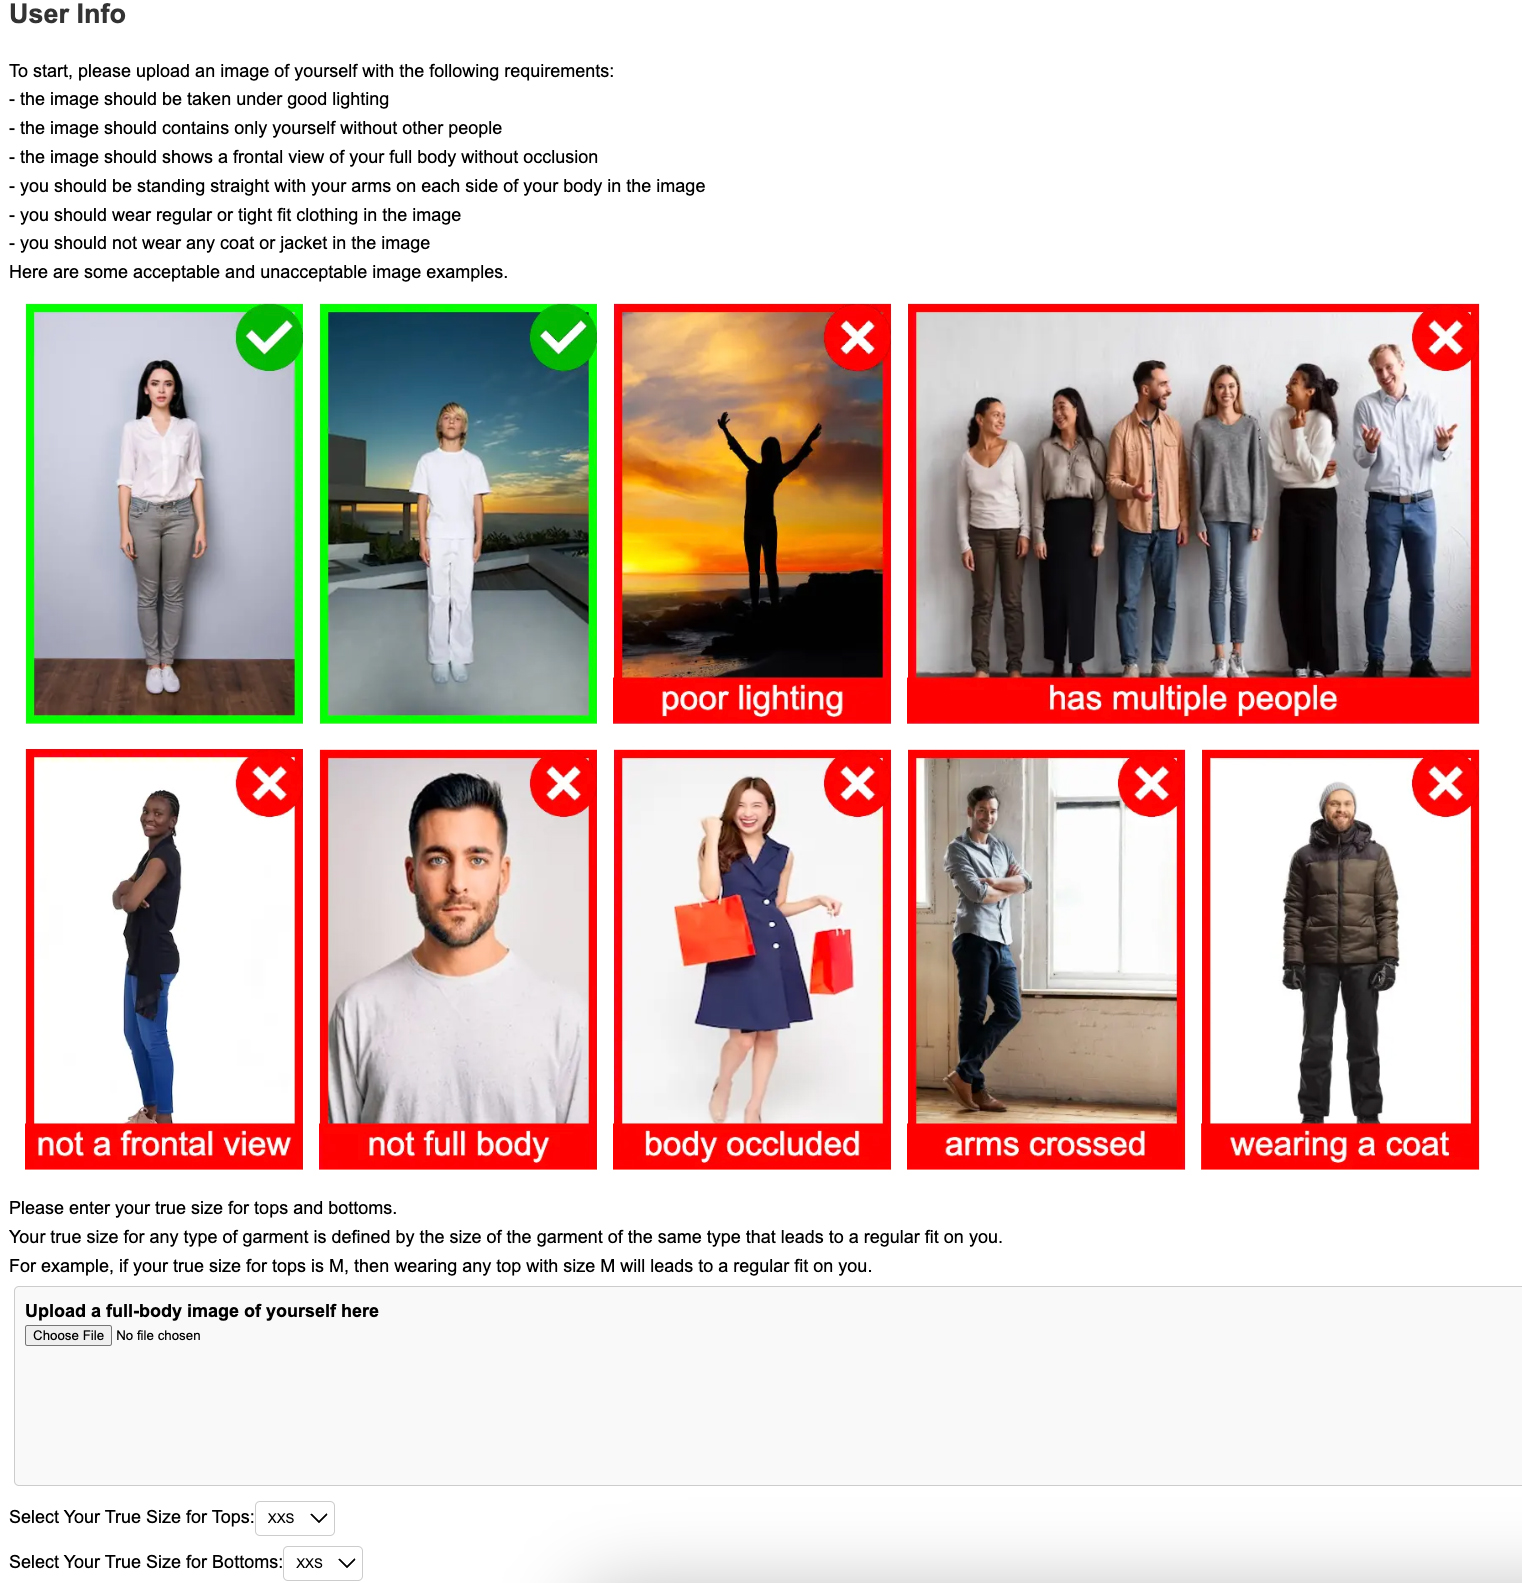
To meet above objectives, we designed a web-based interface (DO1) with two pages. The first page takes in user information, including their photos and sizes (Fig. 2). Users are prompted to upload an image of themselves (DO2) that must adhere to specific criteria outlined on the page, such as user pose, lighting conditions, the number of people permitted in the photo, the scale of the photo, and the attire users wear in the photo (regular-fit tops and bottoms rather than bulky clothing and jackets). These requirements are in place to ensure that the system’s core can accurately process the uploaded images, thereby yielding precise outcomes. Below the image uploading section, we request the user’s true size for tops and bottoms, which is defined as the size of the corresponding garment that provides a regular fit on their body, by selecting one of the seven size labels: XXS, XS, S, M, L, XL, and XXL (DO3).
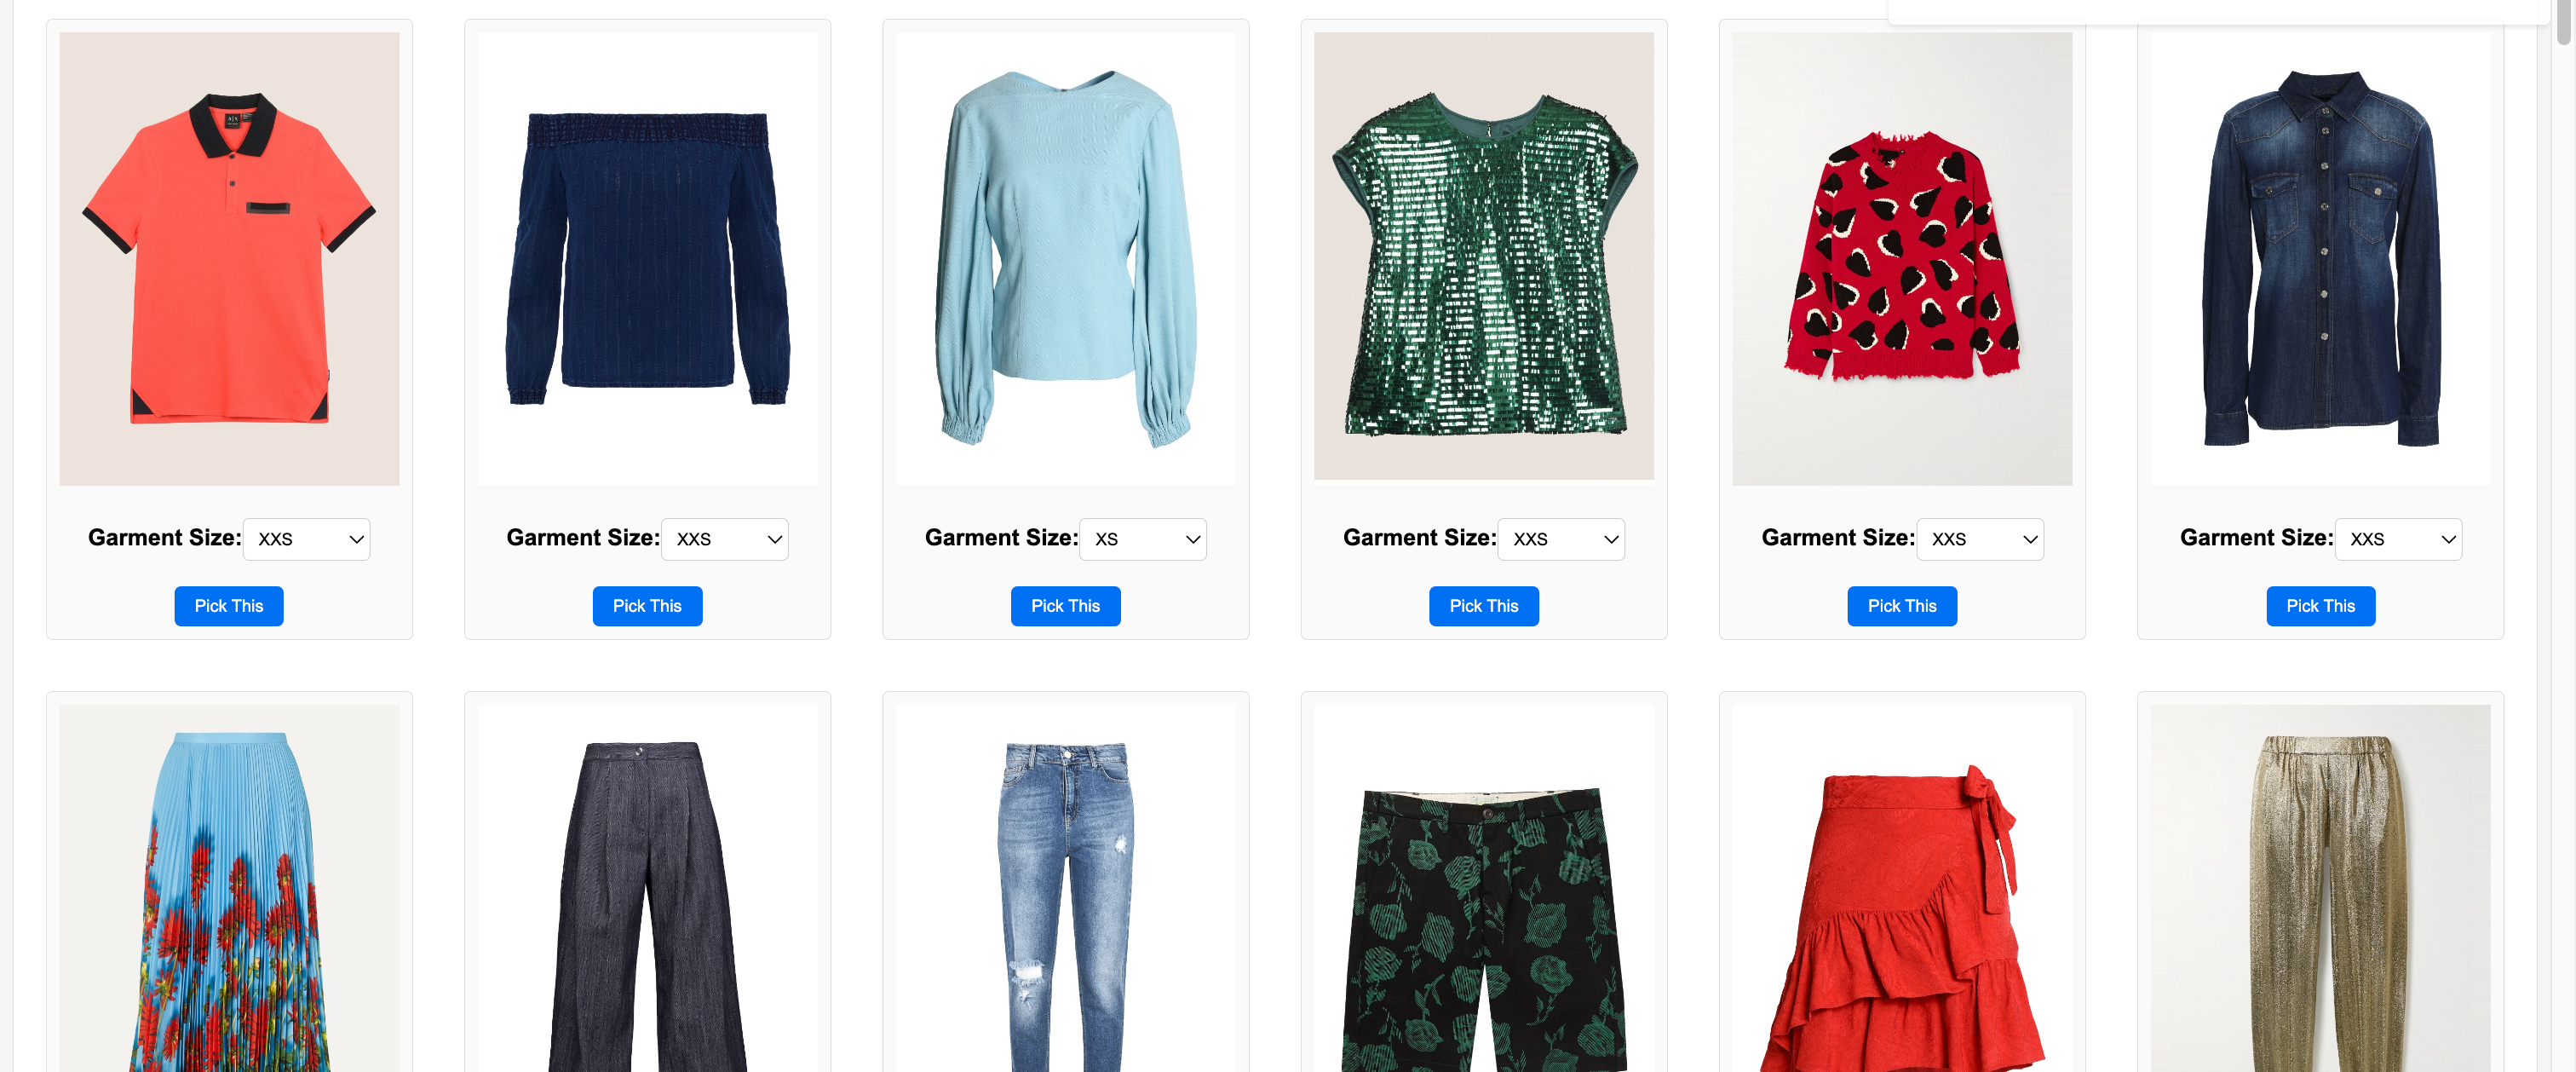


Upon providing the requested information, users proceed to the second page of the website, which is structured into two sections. The top section features a collection of garments to choose from, accompanied by a size selection option aligned with the aforementioned user true-size selection, as depicted in Fig. 3. This setup is similar to most clothing websites. Note that each garment is paired with pre-computed metadata (garment type and sleeve/leg length) and stored in our database for later processing.
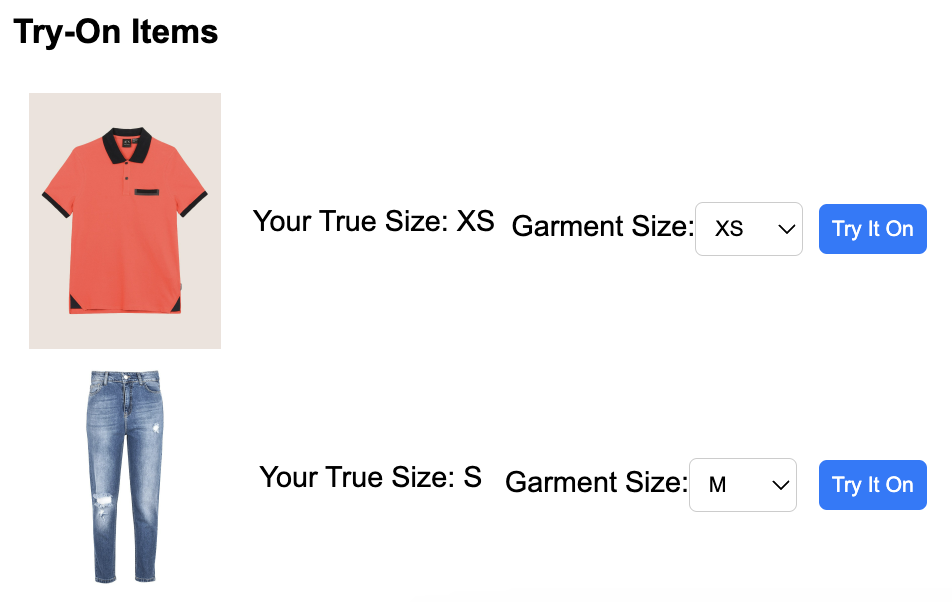
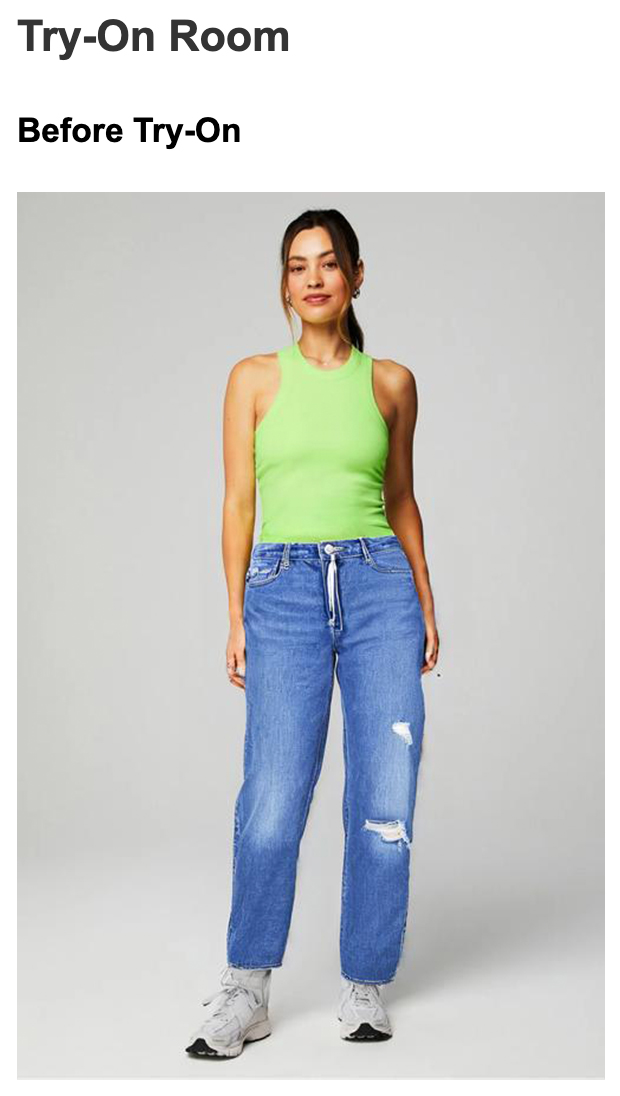
The core of the VTO experience unfolds in the subsequent subsection, which is divided into three areas: “Before Try-On,” “Try-On Results,” and “Try-On Items.” In Fig. 4, we see that the “Try-On Items” section maintains a catalog of selected garments along with the sizes chosen by the user. Crucially, the true size specified by the user earlier is also displayed alongside the selected garment size, enabling users to easily adjust their chosen size when referring to their chosen true sizes. Users can initiate the try-on process by clicking the “Try It On” button next to each garment.
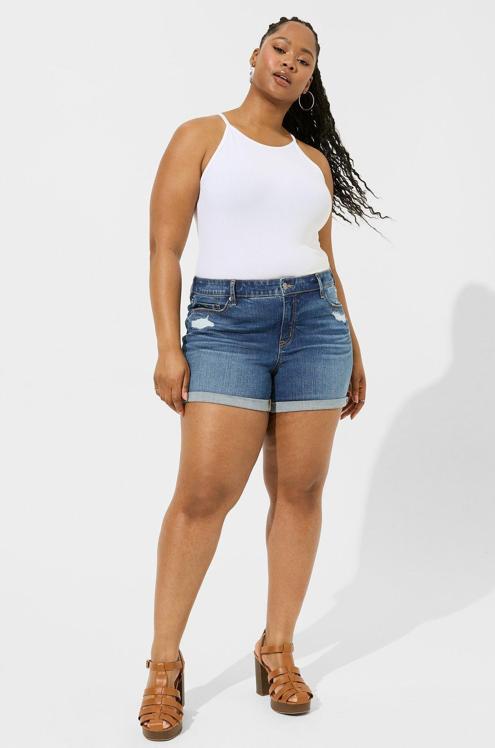
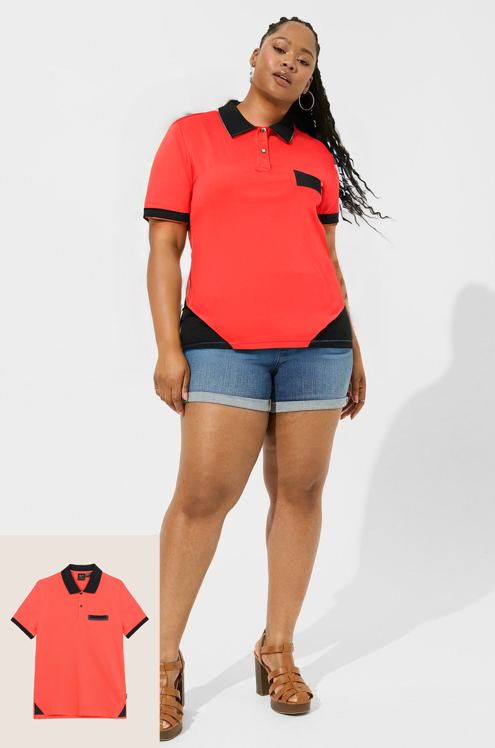
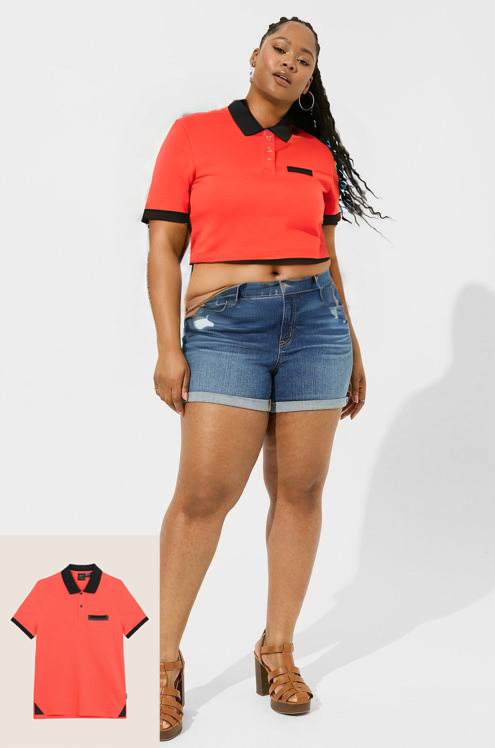
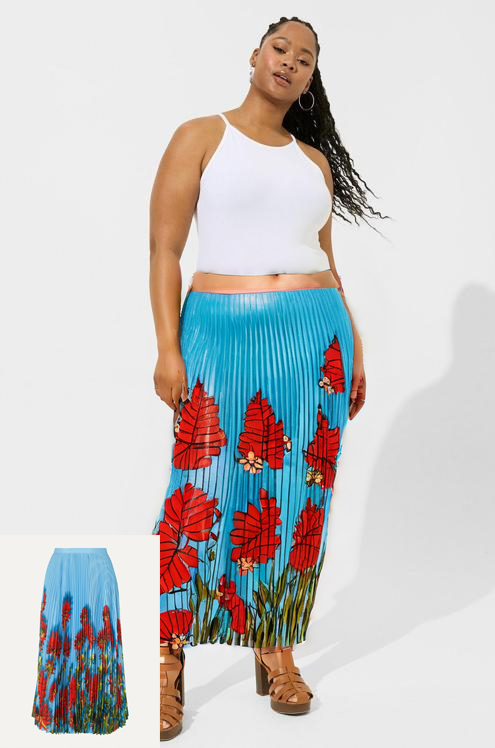
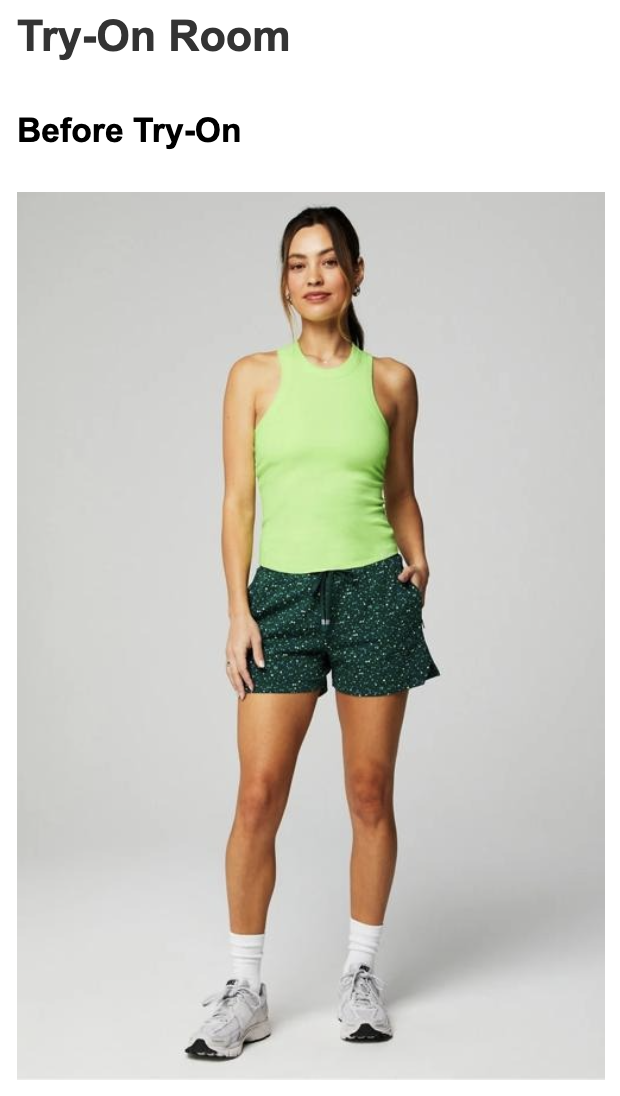
The garment selected for try-on is superimposed onto the image shown in the “Before Try-On” section, which initially displays the image uploaded by the user as shown in Fig. 5(a). The outcomes of the virtual try-ons are documented in the “Try-On Results” history, with each result featuring a “Continue From Here” button (Fig. 5(b)). By selecting this button, users can update the “Before Try-On” image (Fig. 5(c)), thereby leveraging a compounded virtual try-on functionality. This feature permits users to experiment with styling various garments together, shown in Fig. 5(d), which enhances their try-on experience.
5 System Backbone Design
All functionalities mentioned above are enabled by our backbone, which incorporates our design objectives. To minimize visual information gap between VTO visualizations and physical try-on (DO2), these visualizations must preserve the user’s identity captured in their photos. Additionally, VTO results should accurately reflect the selected garment size relative to a users’ true size to offer valuable information when selecting garment sizes (DO3). Addressing this, we recognize preserving user identity as one of the most challenging aspects of VTO, detailed in Sec. 5.1.
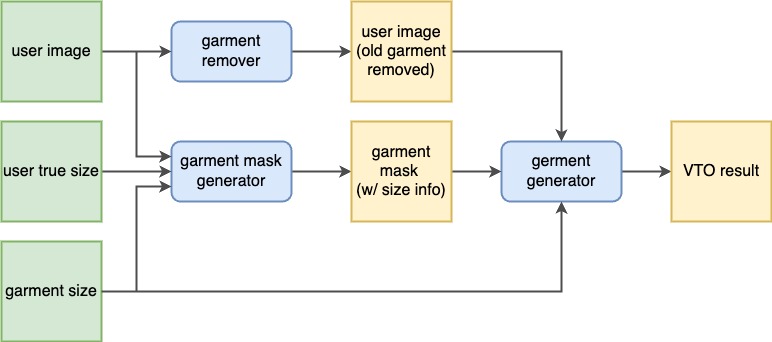
The backbone comprises, as shown in Fig. 6, an identity-preserved garment remover (Sec. 5.1), a size-controllable garment mask generator (Sec. 5.2), and a garment generator (Sec. 5.3). It utilizes the user’s self-image, the user’s true size, the selected garment, its size, as well as the pre-computed garment metadata to generate a size-controllable VTO result while preserving the user’s physical identity. We break down the process below.
5.1 Identity-Preserved Garment Remover
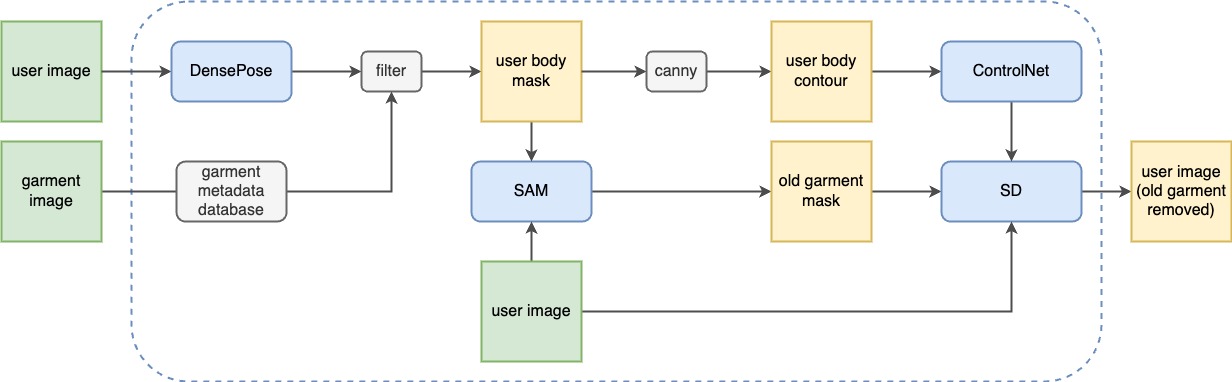
Before superimposing the selected garment onto the user’s image, we simulate an in-store experience by assuming any garments they are already wearing would be “taken off.” Thus, it is necessary to remove existing garments from the user’s photos. Specifically, we aim to remove the top or bottom before trying on a new top or bottom using our garment remover, as depicted in Fig. 7.
To do this, we first query our pre-computed garment metadata database. Using the DensePose human body segmentation model [22], we estimate the location of old garments of the same type, filtering segments to retain only the relevant ones and obtain the user’s body mask. This gives us a rough estimate of the old garment mask. To refine it further, we randomly sample four points within the mask and generate a bounding box around it. These points and the bounding box are then input into the Segment Anything (SAM) model [30] to identify objects overlapping with them.
Directly feeding the user’s self-image and the mask into a general image inpainting model presents a challenge in identity preservation. Most existing VTO-adaptable generative models are trained on human images with similar physiques, often slim and muscular, which may cause the model to generate results that diverge from the user’s appearance. To address this, we employ Stable Diffusion (SD) [37] for inpainting, guiding the generation process with a canny-edge ControlNet [45], which uses the contour (canny edge) of the previously generated user body mask as input to better preserve user specifics (DO2).
5.2 Size-Controllable Garment Mask Generator
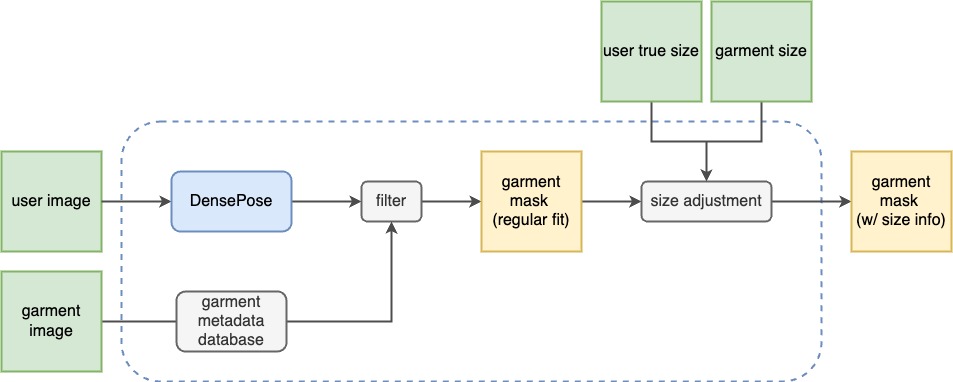
After removing the old garments, our objective is to identify the optimal placement of the target garment on their image, considering the user’s indicated size (Fig. 8). Although previous studies [23, 8, 27, 16, 26] have focused on training a garment deformation model to adjust the garment to fit the human body, these models often produce twisted and less-than-ideal outcomes for various types of garments. Recent work in diffusion-based models [9, 21, 47, 29] address this by using an extensive mask, attempting to generate both the garment and the human body simultaneously, but these models tend to modify the user’s identity due to inherent biases as previously discussed.
To mitigate this issue, we utilize previously generated human body segments, selecting relevant ones based on garment metadata (such as type and the length of sleeves/legs), to create a robust, user-body-aware mask. Specifically, we select either the top or bottom half of the torso segment for upper or lower garments, respectively. For skirts, we bridge the space between the selected left and right leg segments. We further refine the fit by applying the OpenCV dilate function, with a kernel size of 5 and a single iteration, ensuring the garment does not fit too snugly, thereby producing a mask that achieves a regular fit.
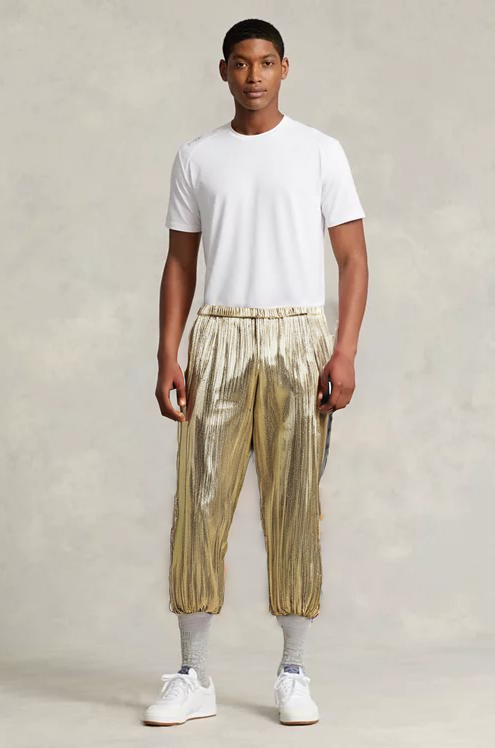
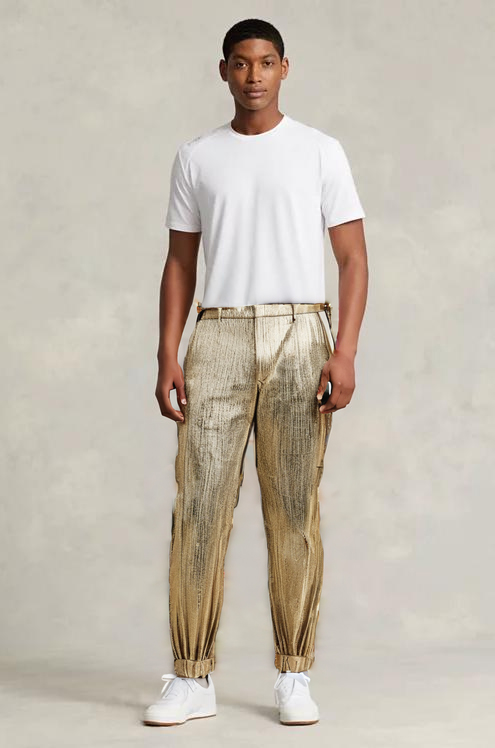
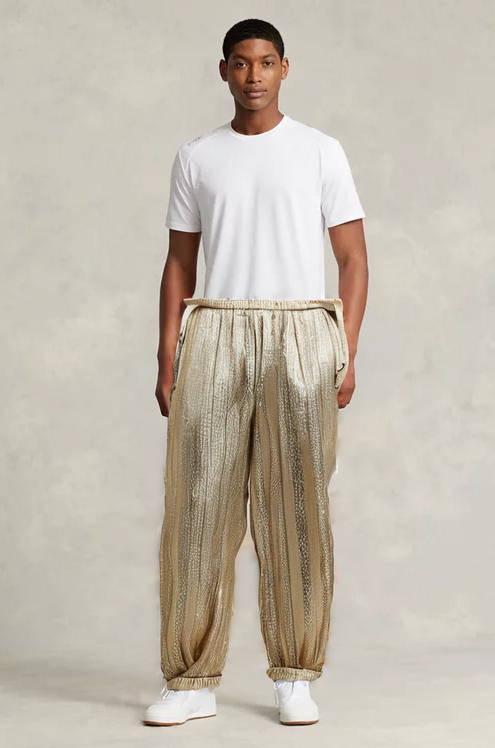
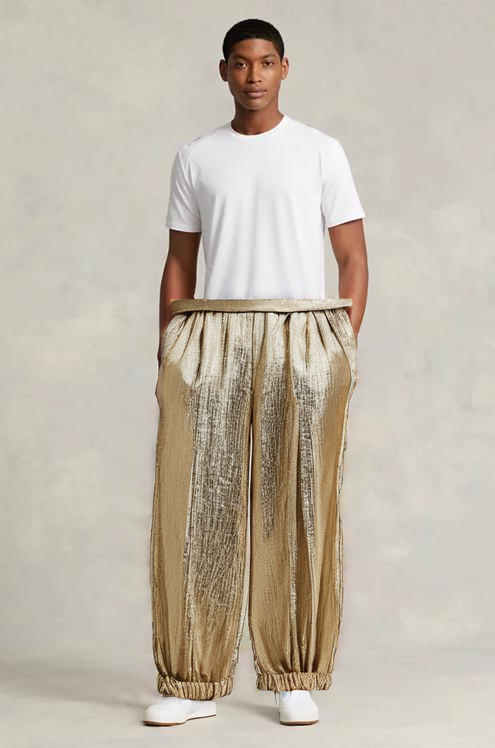
To cater to the user’s preference for garment fit, based on the true size index and the chosen garment size index , where size labels range from XXS to XXL (indexes 1 to 7), we compute the difference between them. For situations where , we increase the size of the mask by dilating it for iterations from the left, right, and bottom edges, avoiding the top to prevent the garment from appearing to levitate on the user. Conversely, when , we trim the bottom of the mask by where is the current length of the mask. In extreme cases, such as a user with a true size of XXL () selecting an XXS garment (), the mask is left blank, reflecting the impracticality of wearing such a garment.
5.3 Garment Generator
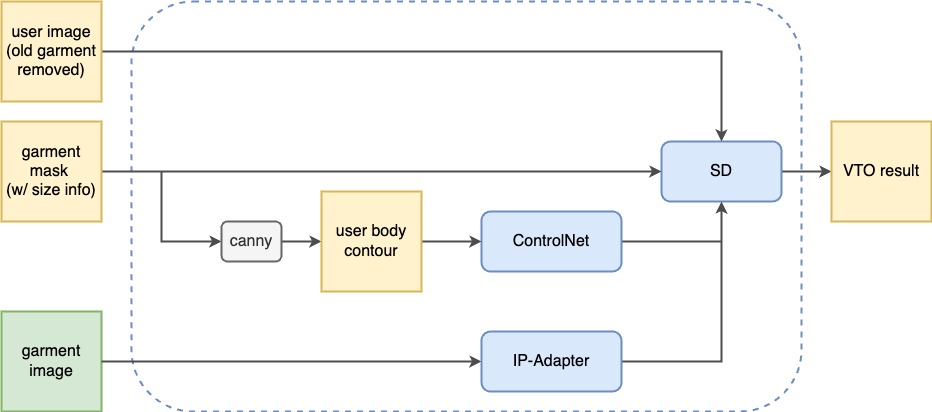
In the last stage of the system backbone, we take the previously generated user self-image from the garment remover (Fig. 7), and the garment mask that reflects the desired fit (Fig. 8) with the aim of recreating the selected garment in the masked location, where the appearance of the garment is incorporated into Stable Diffusion (SD) [37] using IP-Adapter [41]. Similar to what happens in our garment mask generator, we further process the garment mask to get its contour (canny edge) and guide the generation process using a canny-edge ControlNet [45] to maintain user identity.
We demonstrate the effect of using these contours in Fig. 10(b). As we can see, SD is prone to altering the physiques of the user to slim figures as it has been predominantly trained on that type of data (Fig. 10(c)). On the other hand, guiding the inpainting process with the contour of the garment mask better preserves user identity (Fig. 10(d)). We compared our method with other VTO baselines, as shown in Fig. 11. Our approach demonstrates superior size controllability and higher-quality results, accurately capturing the desired fit of the garment according to the user’s true size and the garment size, compared to the baselines.

| IDM VTON | |||||
 |
 |
|
|
|
|
| IDM VTON w/ mask | |||||
 |
|
|
|
|
|
| SiCo (Ours) | |||||
 |
 |
 |
 |
 |
|
| S/XXS | S/XS | S/S | S/M | S/L | |
| IDM VTON | |||||
 |
 |
|
|
|
|
| COTTON | |||||
 |
 |
 |
 |
 |
|
| SiCo (Ours) | |||||
 |
 |
 |
 |
 |
|
| XL/S | XL/M | XL/L | XL/XL | XL/XXL | |
6 Evaluation
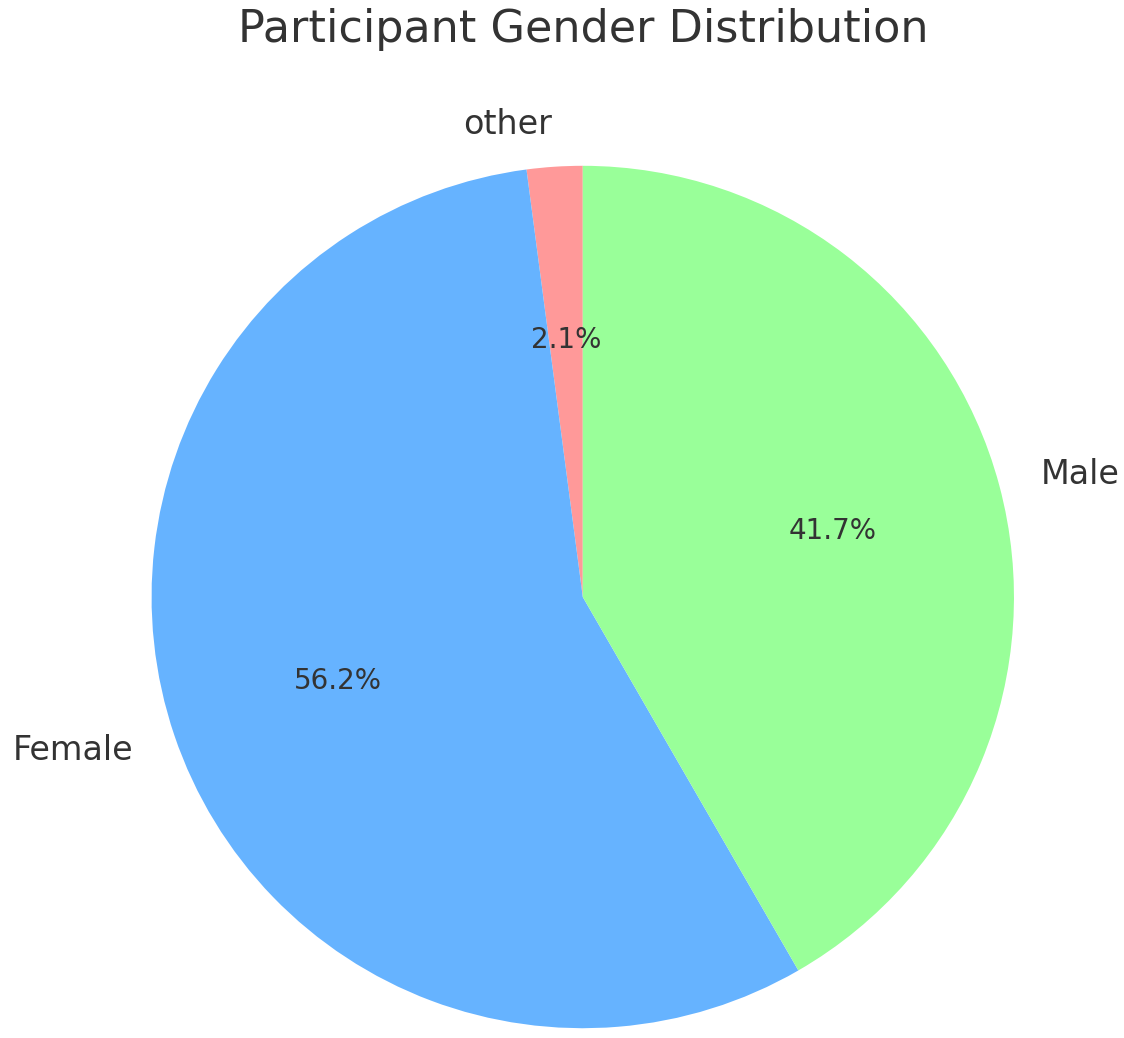
We recruited 48 participants (27 males, 20 females, one non-binary with an average age of 27.2; see supplementary for more details). The participants were a mix of college students, professional digital artists and software engineers. Our goal was to evaluate the impact of size-controllable VTO on user decision-making during online clothing shopping compared to a baseline VTO without size adjustability. Concurrently, we wanted to assess whether this feature aligns with our design objective DO3 by examining the cognitive load users report when they are asked to specify their true size and the garment size while using our size-controllable VTO. Furthermore, we were also interested in understanding how visualizing VTO outcomes using the user’s self-images, as opposed to generic garment images, affects user experience. This investigation seeks to ascertain if this approach meets our design objective DO2. Additionally, we wanted to explore user effort involved in preparing self-images for the VTO, as opposed to selecting from pre-provided model images.
To summarize, our hypotheses are as follows:
-
•
H1: The size-controllable feature in VTO will provide users with more detailed information of their selected garment, thereby facilitating their decision-making process and would be preferred over the baseline VTO without size control.
-
•
H2: Visualizing VTO results with user self-images will offer a more accurate representation of how garments look on them, thereby improving the decision-making process and would be preferred over the use of generic model images.
6.1 Apparatus
Our user study was conducted in an indoor lab space, with two distinct areas for photo capturing and website evaluation, respectively. The photo-capturing area was positioned adjacent to a wall, with a tripod-mounted iPhone SE positioned approximately two meters away, facing the wall. This setup was used to photograph participants. Meanwhile, the website evaluation area consisted of a desk equipped with a computer, a keyboard and a mouse, on which a specific page of our website was displayed for participants to interact and test.
6.2 Experiment Design
| size control? | ||
| page 1 | enter user true size for tops and bottoms | N/A |
| page 2 | 1. Pick a top with your true size 2. Try the top (with your true size) on 3. Change the garment size of the top 4. Try the top (with the changed size) on again 5. Pick a bottom with your true size 6. Try the bottom (with your true size) on 7. Change the garment size of the bottom 8. Try the bottom (with your true size) on again 9. Continue from the result in step 6 (3rd result from the top) 10. Try on the top from step 1 (with your true size) again 11. Continue from the result in step 8 (3rd result from the top) 12. Try on the top from step 3 (with a changed size) again | 1. Pick a top 2. Try the top on 3. Pick a bottom 4. Try the bottom on 5. Continue from the last result 6. Try the top from step 1 on again |
| use self-image? | ||
| page 1 | upload the photo taken at the start of the study | select one image from a set of model images displayed in the page |
| size control? | use self-image? | count | |
| A | 23 | ||
| B | 22 | ||
| C | 27 | ||
| D | 24 |
We developed a pre-study questionnaire to gather insights into participants’ prior experience with online clothing shopping which are detailed in the supplementary. Subsequently, we outlined a series of tasks for participants to undertake on our website, which has four versions as detailed in Table 2. Participants were assigned to test two versions each, of which the balanced assignment process is detailed in the supplementary. Depending on the configuration of the website version, the tasks participants were asked to perform are listed in Table 1. Specifically, we asked them to try on a top and a bottom individually as well as style them together in later steps. For the website version with the size-controllable VTO, we asked the participants to try on the same top/bottom with different sizes such that they could see the impact of size on VTO results, if any.
Following each website versio’sn evaluation, participants were asked to complete a post-task questionnaire comprised of three components: the NASA Task Load Index (TLX) questionnaire [25] with adjusted 11 gradations on the scales, a standard system usability questionnaire (SUS) in its positive version [31], and a questionnaire adapted from previous research [33] to examine how the various factors under investigation influence user decision-making and overall experience. The questionnaire items, accompanied by a five-point Likert scale ranging from “1=Strongly disagree” to “5=Strongly agree”:
-
1.
Shopping with this system was enjoyable for me.
-
2.
I gain a sense of how the outfit might look on me.
-
3.
This system helps me understand more about the appearance of the garments.
-
4.
I feel confident that the clothes I choose are suitable for me.
-
5.
This system would enhance the effectiveness of the shopping experience.
-
6.
I want to use this system when I buy clothes online in the future.
Additionally, our post-study questionnaire included a pairwise comparison version of the aforementioned questions, designed to directly contrast user experiences across the two different website versions they tried. Each question offered a choice between “the first website” and “the second website”:
-
1.
_____ is more enjoyable to use.
-
2.
_____ gives me a better sense of how the outfit might look on me.
-
3.
_____ helps me understand more about the appearance of the garments better.
-
4.
I am confident that the clothes I choose suit me with _____.
-
5.
_____ would enhance the effectiveness of the shopping experience more.
-
6.
I prefer to use _____ when I buy clothes online in the future.
| question index | label | factor = size control | factor = upload self-image | ||||
| (1) | enjoyable | chi-square | p-value | Cramer’s V | chi-square | p-value | Cramer’s V |
| \cdashline3-8 | 5.050 | 0.05 | 0.229 | 1.506 | 0.220 | 0.125 | |
| (2) | sense-look | chi-square | p-value | Cramer’s V | chi-square | p-value | Cramer’s V |
| \cdashline3-8 | 18.407 | 0.001 | 0.438 | 10.708 | 0.01 | 0.334 | |
| (3) | appearance | chi-square | p-value | Cramer’s V | chi-square | p-value | Cramer’s V |
| \cdashline3-8 | 9.391 | 0.01 | 0.313 | 0.669 | 0.413 | 0.0834 | |
| (4) | suitability | chi-square | p-value | Cramer’s V | chi-square | p-value | Cramer’s V |
| \cdashline3-8 | 12.062 | 0.001 | 0.354 | 8.199 | 0.01 | 0.292 | |
| (5) | effectiveness | chi-square | p-value | Cramer’s V | chi-square | p-value | Cramer’s V |
| \cdashline3-8 | 3.381 | 0.0660 | 0.187 | 6.024 | 0.05 | 0.250 | |
| (6) | future-use | chi-square | p-value | Cramer’s V | chi-square | p-value | Cramer’s V |
| \cdashline3-8 | 15.068 | 0.001 | 0.396 | 1.506 | 0.220 | 0.125 | |
.
6.3 Procedure
The user study lasted 30 minutes per participant and was conducted in a single session. Each participant received $10 USD for their time and participation and was approved by our local IRB. After receiving informed consent, we started by capturing a full-body photograph of each participant against the wall in our photo-capturing area. This photograph was uploaded to the computer in our website evaluation area, where the rest of the study took place. Participants completed two sets of tasks, each with a different website version. If a task required uploading an image, participants selected the photograph taken at the beginning of the study. After each task set, participants filled out a post-task questionnaire to provide immediate feedback. Once both sets of tasks were completed, participants completed a post-study questionnaire to provide a holistic view of their experience across the different website versions.
7 Results
7.1 User Experience and Decision-making
Table 2 Col. 3 provides a breakdown of the frequency with which each website version was tested.We examine participant responses to the post-study questionnaire. The chi-square values and p-values are detailed in Table 3, with values indicating statistical significance () highlighted in bold. The findings indicate that our size-controllable VTO significantly enhances user enjoyment, provides them with a clearer sense of how chosen garments appear on themselves, aids in understanding garment appearance, and boosts their confidence in selecting garments that are suitable. This leads to a strong overall preference for using our system when shopping for online clothing.
We employed Cramér’s V to quantify the strength of association between variables, interpreting values around 0.3 as indicative of moderate associations and values around 0.5 as reflecting strong associations, with corresponding values underlined in the table. Our analysis reveals a moderate to strong association between VTO with size-controllability and the improved ability to sense how clothing looks. We also noted a moderate association between VTO with size-controllability and an enhanced understanding of garment appearance as well as increased confidence in garment selection, which collectively foster a preference for using the website for future use.
Similarly, the visualization of VTO results using participant self-images also has a significantly positive impact. It enhances user perception of how selected garments will look on them, boosts confidence in making garment selections, and increases the overall effectiveness of the shopping experience. We observe a moderate association between the use of participants’ own images and an improved ability to accurately gauge the appearance of outfits, as well as a reinforcement of confidence in the suitability of their selections. Please refer to the supplementary for the corresponding contingency table and post-hoc analysis.
7.2 Task-load Index
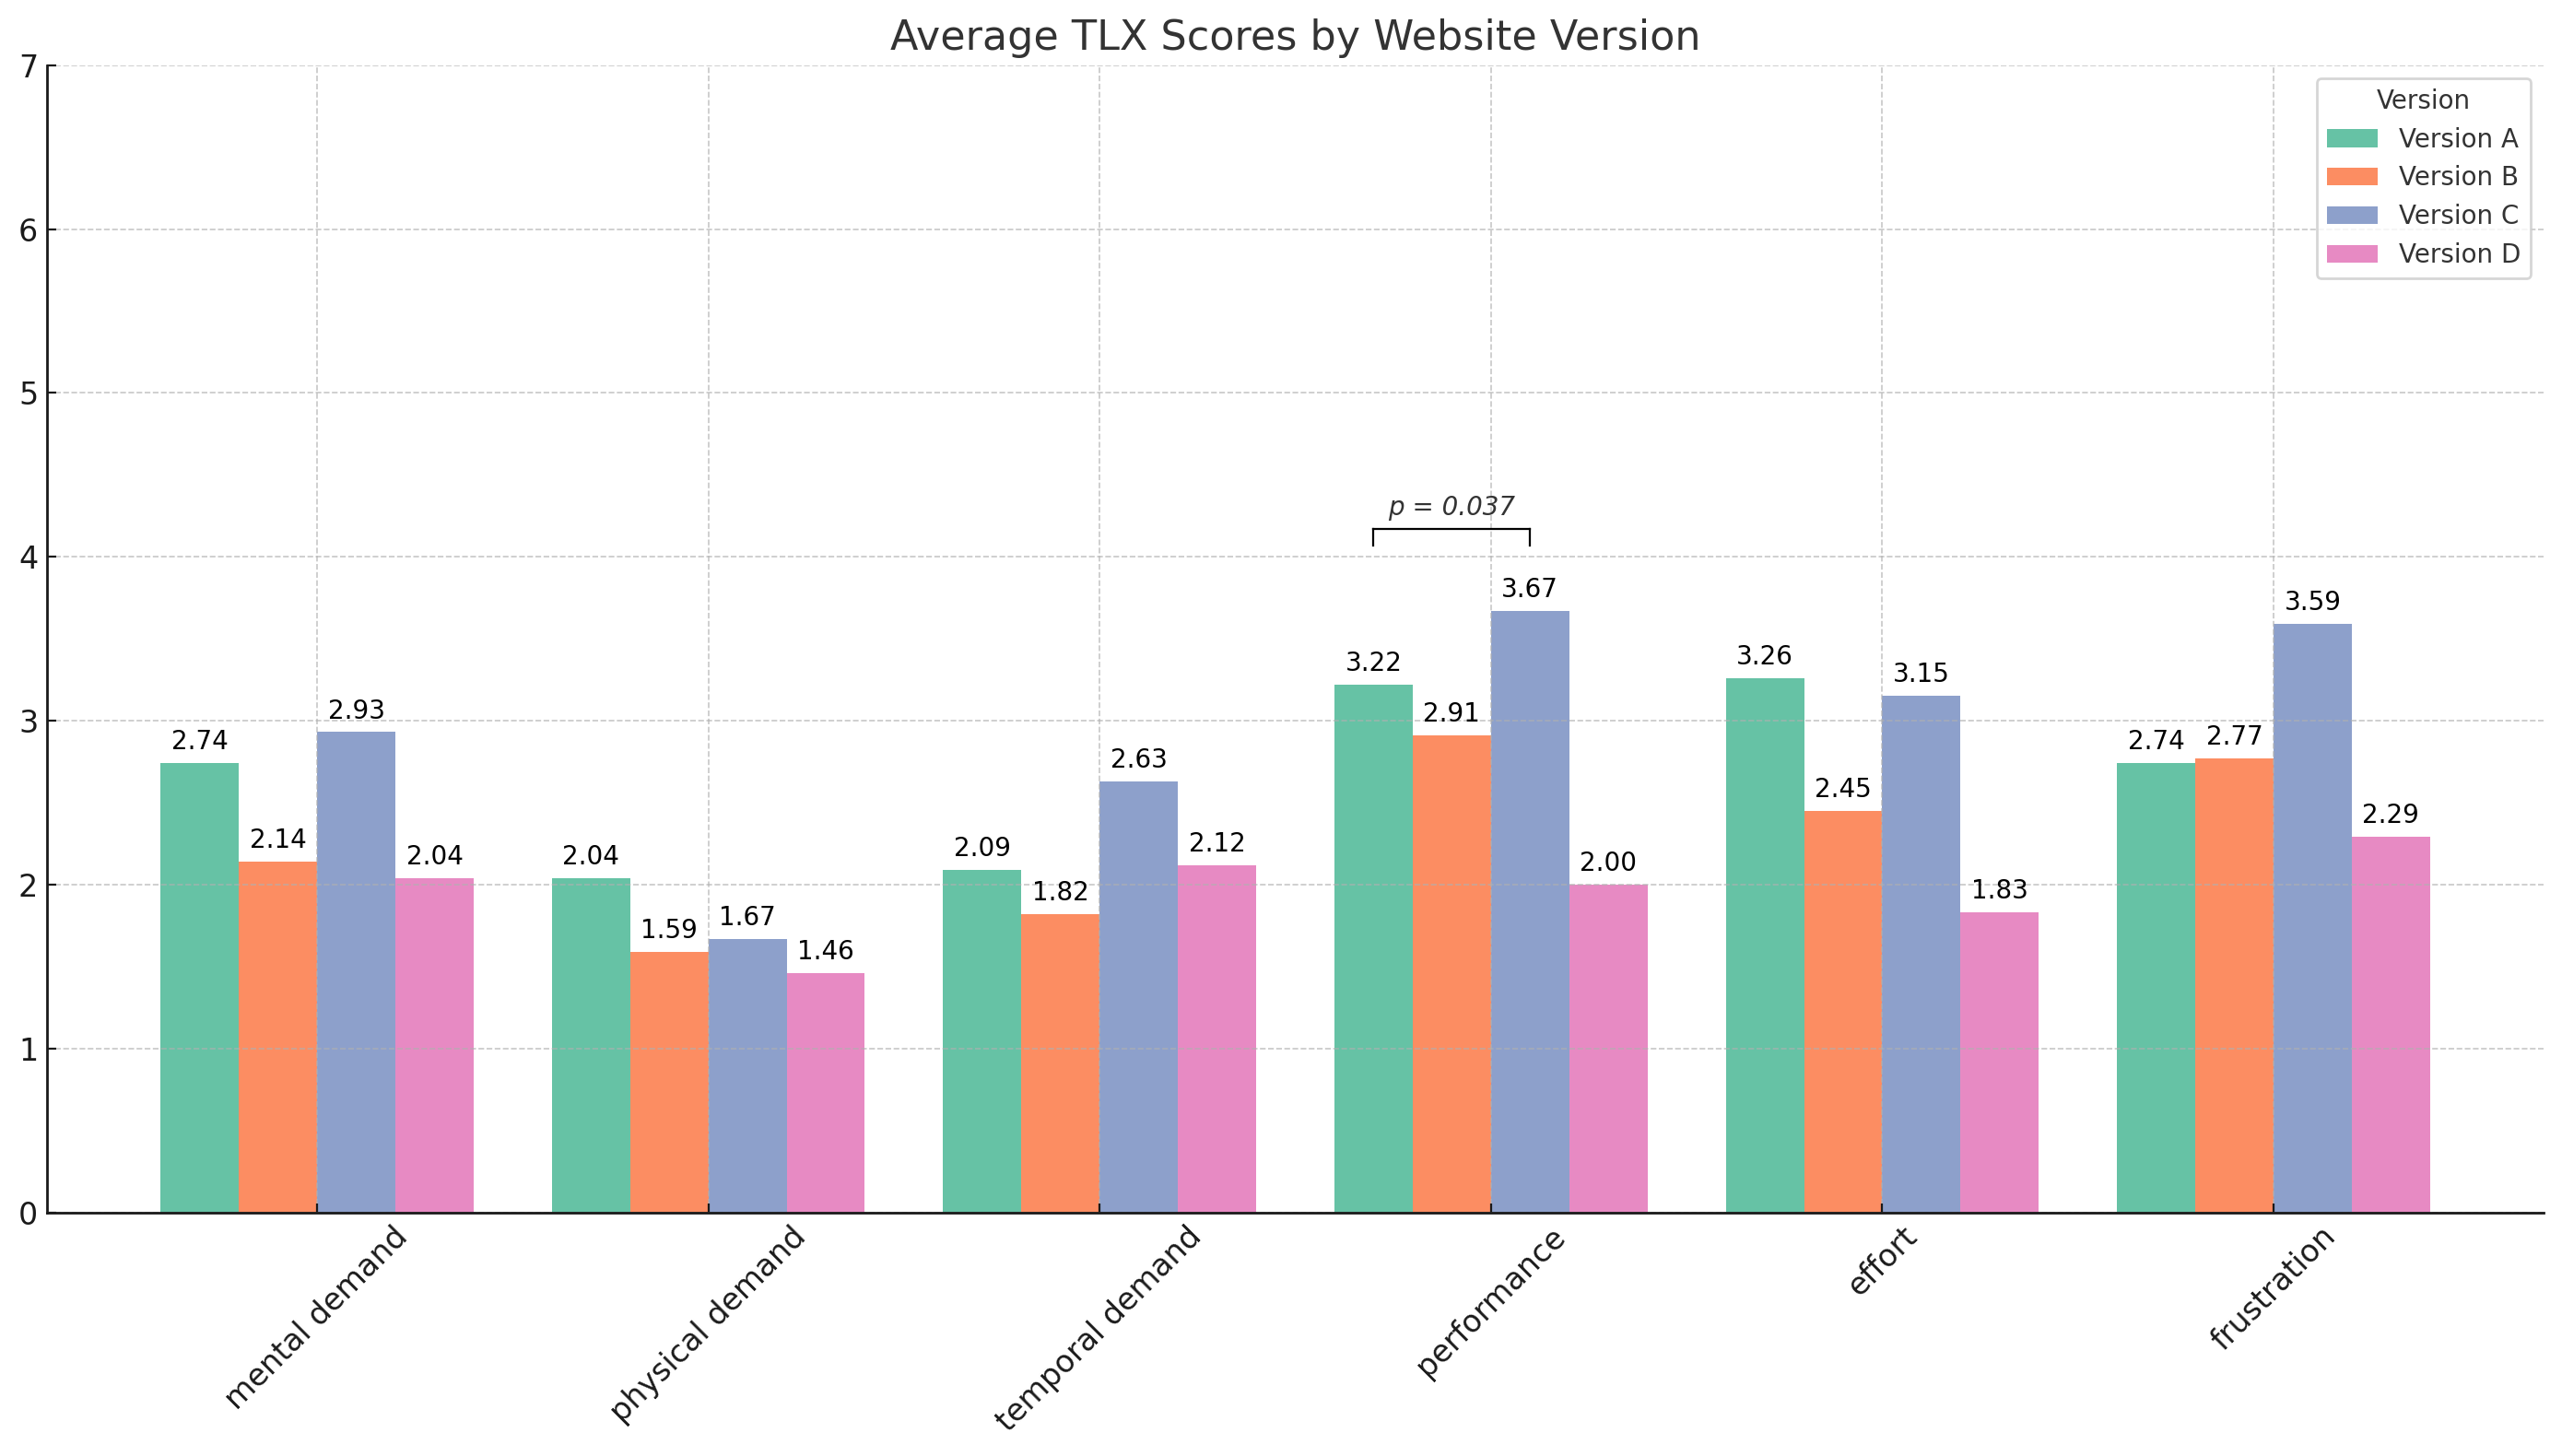
To investigate the impact of size-controllability and the use of participant self-images on cognitive load (measured using NASA TLX), we compute the average TLX scores per website version shown in Fig. 12 and conduct an aligned rank transform mixed-design ANOVA analysis. Results indicate that only the change from website version A to C shows a significant negative impact () on the TLX performance metric, suggesting that enabling size-control in VTO and/or using participant self-images to visualize VTO results did not affect task load. For more detail, please refer to the supplementary.
7.3 System Usability
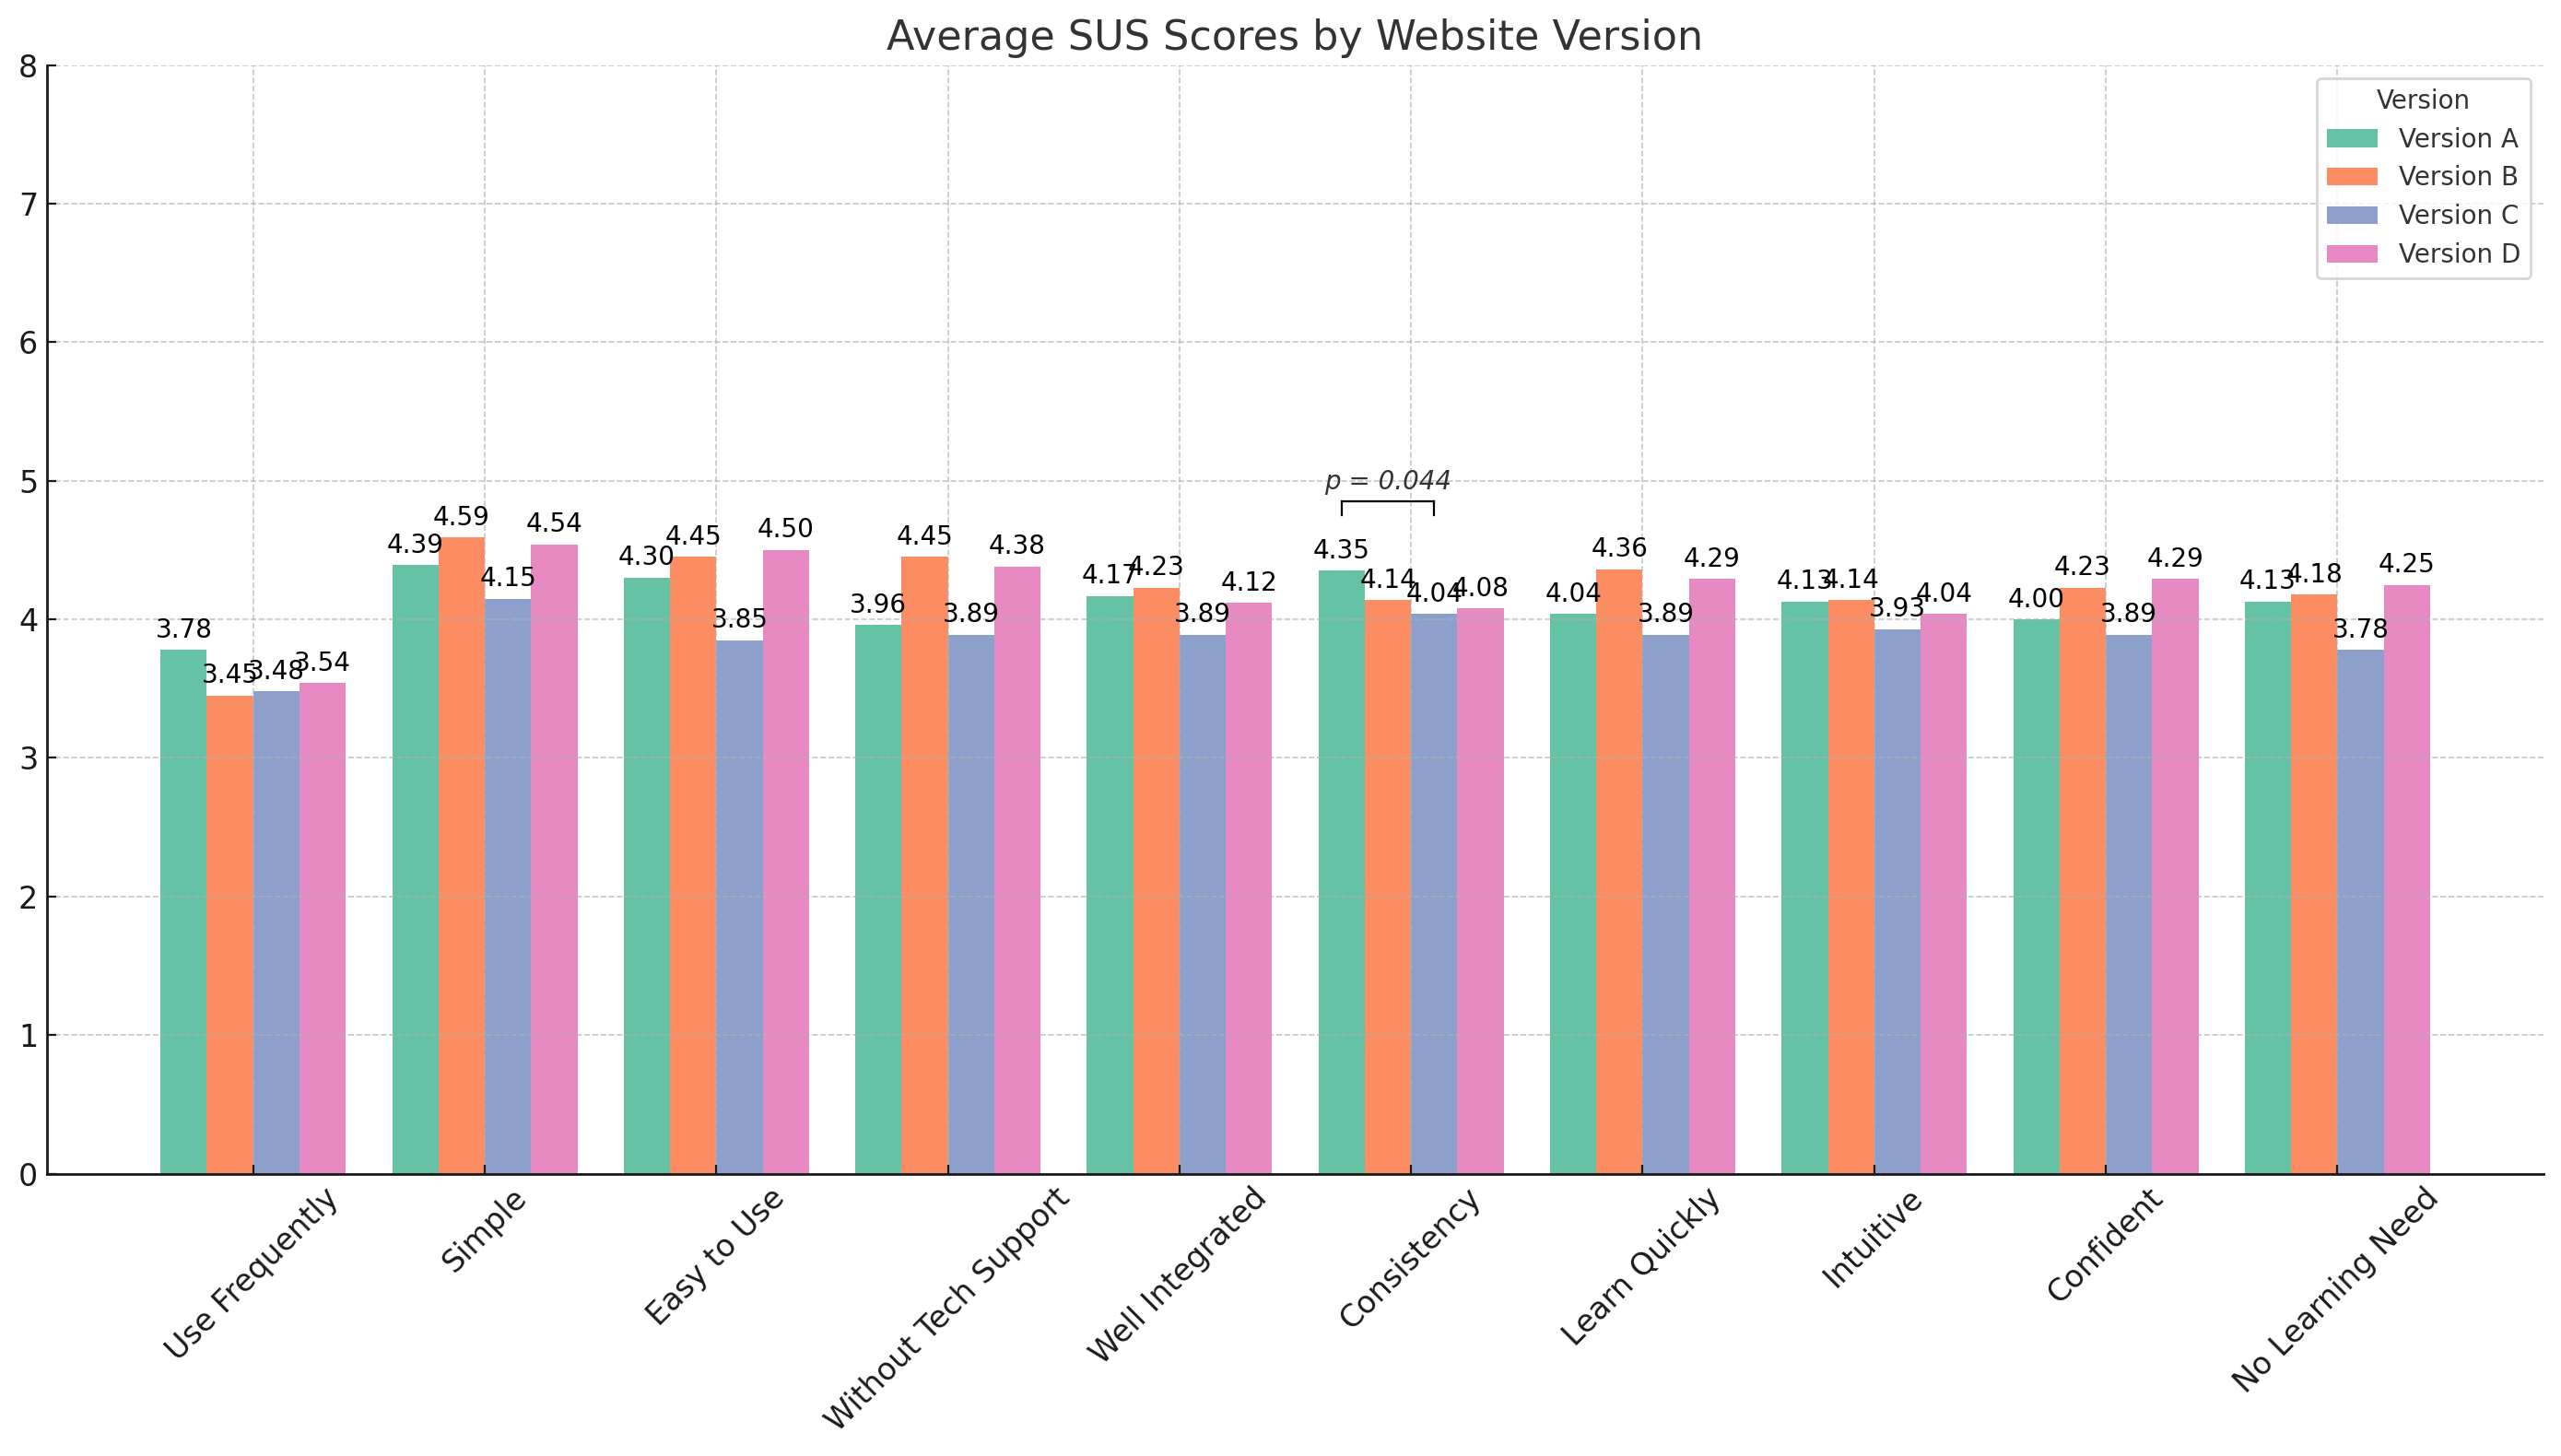
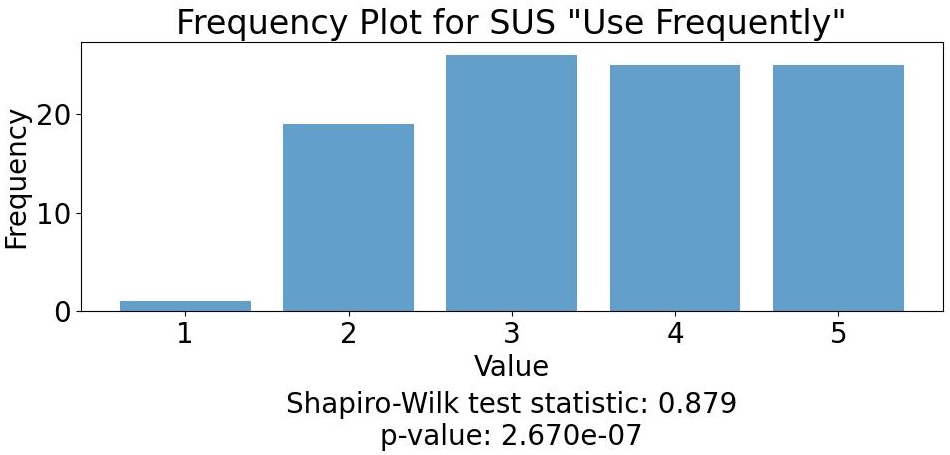
To investigate the impact of size-controllability and the use of participant self-images on system usability (measured using SUS), we computed the average SUS scores per website version shown in Fig. 13, where responses “Strongly disagree” to “Strongly agree” are mapped to scores 1-5 on a Likert scale. We conducted an ANOVA analysis where we find that only the change from website version A to version C, which used generic model images instead of self-images, showed a significant negative impact () on the SUS consistency metric. No other significant impacts were observed, suggesting that enabling size-control in VTO and/or using participant self-images to visualize VTO results did not affect system usability.
8 Discussion
Our study investigated the impact of the size-controllable feature and the ability to upload self-images for VTO on cognitive load and usability scores among participants. Each participant tested two out of four website versions (Table. 2). Participants enjoyed the size controllability feature, as it helped them visualize garments on their bodies to better understand garment appearance. This feature increased their confidence in selecting well-suited clothing items, making the VTO system an effective enhancement to their online shopping experience, with many expressing a strong inclination to use it for future purchases.
Reactions to uploading self-images were mixed. Participants appreciated seeing how clothes would look on them, aiding in determining item suitability. However, privacy concerns may have influenced their comfort level, despite assurances in the consent form. Participants might feel more at ease uploading self-images to familiar clothing websites, where they already have user profiles and other personal data store.
We observed increased cognitive load and decreased usability scores when comparing website versions A (with size-controllability and self-image upload) and C (with only size-controllability). This might be due to confusion over the photo-taking process and the resulting photo not being utilized for version C. No significant negative effects were noted in other version comparisons.
Overall, SiCo shows potential for integration into existing clothing shopping websites. It better emulates the in-person try-on experience, which could reduce clothing return rates due to size issues, lower environmental impact due to fewer returned items, increase customer satisfaction, and reduce business costs.
9 Limitations and Future Work
Despite enabling size controllability, SiCo has some limitations. Firstly, the system currently does not allow users to wear the same garment in different styles, such as unbuttoning a shirt or rolling up pant legs. Implementing this feature will require adjustments to our garment mask, which we plan to incorporate in future work. Additionally, our current system does not support layering more than two items. Although users can try on multiple top garments (e.g., a shirt and a jacket), without the ability to “unbutton” or “unzip” the jacket, the shirt underneath remains mostly hidden.
Beyond styling limitations, it is important to recognize that integrating user body contour guidance cannot completely eliminate all biases present in the generative model, Stable Diffusion. For example, biases related to skin color may persist if individuals with diverse skin tones are not adequately represented in the training dataset, potentially resulting in slight alterations to their skin color, which could be offensive to users. Addressing this issue will require re-training or fine-tuning the model using more diverse and inclusive datasets.
Lastly, despite achieving higher quality and better generality with a diffusion-based generative model, we observe drawbacks in terms of speed, with users having to wait about one minute for each VTO result. This engineering challenge can be addressed in future work by incorporating faster diffusion-based models, such as distilled models.
10 Conclusion
In this paper, we presented a web-based virtual try-on (VTO) system with a size-controllable VTO backbone, providing users with a familiar online clothing shopping environment enhanced by our VTO feature. We conducted a user study () to evaluate the effect of size controllability and the use of different images (self or generic model) on user experience and decision-making. Overall, participants showed a strong preference for the VTO feature with size adjustment. They reported that this functionality improved their ability to envision how clothes would look on them, enhanced their understanding of the garment’s appearance, and boosted their confidence in selecting garments.
References
- Aničin and Stojmenović [2022] Luka Aničin and Miloš Stojmenović. Bias analysis in stable diffusion and midjourney models. In International Conference on Intelligent Systems and Machine Learning, pages 378–388. Springer, 2022.
- Berthiaume [2022] Dan Berthiaume. New snapchat ar shopping features include virtual try-on, 2022. https://chainstoreage.com/new-snapchat-ar-shopping-features-include-virtual-try.
- Bialkova and Barr [2022] Svetlana Bialkova and Chloe Barr. Virtual try-on: How to enhance consumer experience? In 2022 IEEE conference on virtual reality and 3D user interfaces abstracts and workshops (VRW), pages 01–08. IEEE, 2022.
- Business [2024] Vogue Business. Want to reduce returns? avatars might be the answer, 2024. https://www.reuters.com/article/2011/02/22/uk-airbus-japan-idUSLNE71L03120110222/.
- Cao et al. [2017] Zhe Cao, Tomas Simon, Shih-En Wei, and Yaser Sheikh. Realtime multi-person 2d pose estimation using part affinity fields. In Proceedings of the IEEE conference on computer vision and pattern recognition, pages 7291–7299, 2017.
- Chauhan et al. [2024] Aadi Chauhan, Taran Anand, Tanisha Jauhari, Arjav Shah, Rudransh Singh, Arjun Rajaram, and Rithvik Vanga. Identifying race and gender bias in stable diffusion ai image generation. In 2024 IEEE 3rd International Conference on AI in Cybersecurity (ICAIC), pages 1–6. IEEE, 2024.
- Chen et al. [2023] Chieh-Yun Chen, Yi-Chung Chen, Hong-Han Shuai, and Wen-Huang Cheng. Size does matter: Size-aware virtual try-on via clothing-oriented transformation try-on network. In Proceedings of the IEEE/CVF International Conference on Computer Vision, pages 7513–7522, 2023.
- Choi et al. [2021] Seunghwan Choi, Sunghyun Park, Minsoo Lee, and Jaegul Choo. Viton-hd: High-resolution virtual try-on via misalignment-aware normalization. In Proceedings of the IEEE/CVF conference on computer vision and pattern recognition, pages 14131–14140, 2021.
- Choi et al. [2024] Yisol Choi, Sangkyung Kwak, Kyungmin Lee, Hyungwon Choi, and Jinwoo Shin. Improving diffusion models for virtual try-on. arXiv preprint arXiv:2403.05139, 2024.
- Chong et al. [2021] Toby Chong, I-Chao Shen, Nobuyuki Umetani, and Takeo Igarashi. Per garment capture and synthesis for real-time virtual try-on. In The 34th Annual ACM Symposium on User Interface Software and Technology, pages 457–469, 2021.
- CoreSight [2023] CoreSight. The true cost of apparel returns: Alarming return rates require loss-minimization solutions, 2023. https://coresight.com/research/the-true-cost-of-apparel-returns-alarming-return-rates-require-loss-minimization-solutions/.
- Cui et al. [2023] Aiyu Cui, Jay Mahajan, Viraj Shah, Preeti Gomathinayagam, and Svetlana Lazebnik. Street tryon: Learning in-the-wild virtual try-on from unpaired person images. arXiv preprint arXiv:2311.16094, 2023.
- Dhariwal and Nichol [2021] Prafulla Dhariwal and Alexander Nichol. Diffusion models beat GANs on image synthesis. 34:8780–8794, 2021.
- Dong et al. [2019] Haoye Dong, Xiaodan Liang, Xiaohui Shen, Bochao Wang, Hanjiang Lai, Jia Zhu, Zhiting Hu, and Jian Yin. Towards multi-pose guided virtual try-on network. In Proceedings of the IEEE/CVF international conference on computer vision, pages 9026–9035, 2019.
- Ge et al. [2021a] Chongjian Ge, Yibing Song, Yuying Ge, Han Yang, Wei Liu, and Ping Luo. Disentangled cycle consistency for highly-realistic virtual try-on. In Proceedings of the IEEE/CVF conference on computer vision and pattern recognition, pages 16928–16937, 2021a.
- Ge et al. [2021b] Yuying Ge, Yibing Song, Ruimao Zhang, Chongjian Ge, Wei Liu, and Ping Luo. Parser-free virtual try-on via distilling appearance flows. arXiv preprint arXiv:2103.04559, 2021b.
- Giovanni et al. [2012] Stevie Giovanni, Yeun Chul Choi, Jay Huang, Eng Tat Khoo, and KangKang Yin. Virtual try-on using kinect and hd camera. In Motion in Games: 5th International Conference, MIG 2012, Rennes, France, November 15-17, 2012. Proceedings 5, pages 55–65. Springer, 2012.
- Glossy [2021] Glossy. Virtual try-on is the antidote to the pandemic-fueled rise in returns, 2021. https://www.glossy.co/fashion/virtual-try-on-is-the-antidote-to-the-pandemic-fueled-rise-in-returns/.
- Goodfellow et al. [2020] Ian Goodfellow, Jean Pouget-Abadie, Mehdi Mirza, Bing Xu, David Warde-Farley, Sherjil Ozair, Aaron Courville, and Yoshua Bengio. Generative adversarial networks. Communications of the ACM, 63(11):139–144, 2020.
- Google [2023] Google. Virtually try on clothes with a new ai shopping feature, 2023. https://blog.google/products/shopping/ai-virtual-try-on-google-shopping/.
- Gou et al. [2023] Junhong Gou, Siyu Sun, Jianfu Zhang, Jianlou Si, Chen Qian, and Liqing Zhang. Taming the power of diffusion models for high-quality virtual try-on with appearance flow. In Proceedings of the 31st ACM International Conference on Multimedia, pages 7599–7607, 2023.
- Güler et al. [2018] Rıza Alp Güler, Natalia Neverova, and Iasonas Kokkinos. Densepose: Dense human pose estimation in the wild. In Proceedings of the IEEE conference on computer vision and pattern recognition, pages 7297–7306, 2018.
- Han et al. [2018] Xintong Han, Zuxuan Wu, Zhe Wu, Ruichi Yu, and Larry S Davis. Viton: An image-based virtual try-on network. In Proceedings of the IEEE conference on computer vision and pattern recognition, pages 7543–7552, 2018.
- Han et al. [2019] Xintong Han, Xiaojun Hu, Weilin Huang, and Matthew R Scott. Clothflow: A flow-based model for clothed person generation. In Proceedings of the IEEE/CVF international conference on computer vision, pages 10471–10480, 2019.
- Hart [2006] Sandra G Hart. Nasa-task load index (nasa-tlx); 20 years later. In Proceedings of the human factors and ergonomics society annual meeting, pages 904–908. Sage publications Sage CA: Los Angeles, CA, 2006.
- He et al. [2022] Sen He, Yi-Zhe Song, and Tao Xiang. Style-based global appearance flow for virtual try-on. In Proceedings of the IEEE/CVF Conference on Computer Vision and Pattern Recognition, pages 3470–3479, 2022.
- Issenhuth et al. [2020] Thibaut Issenhuth, Jérémie Mary, and Clément Calauzenes. Do not mask what you do not need to mask: a parser-free virtual try-on. In Computer Vision–ECCV 2020: 16th European Conference, Glasgow, UK, August 23–28, 2020, Proceedings, Part XX 16, pages 619–635. Springer, 2020.
- Jiang et al. [2022] Yuming Jiang, Shuai Yang, Haonan Qiu, Wayne Wu, Chen Change Loy, and Ziwei Liu. Text2human: Text-driven controllable human image generation. ACM Transactions on Graphics (TOG), 41(4):1–11, 2022.
- Kim et al. [2023] Jeongho Kim, Gyojung Gu, Minho Park, Sunghyun Park, and Jaegul Choo. Stableviton: Learning semantic correspondence with latent diffusion model for virtual try-on, 2023.
- Kirillov et al. [2023] Alexander Kirillov, Eric Mintun, Nikhila Ravi, Hanzi Mao, Chloe Rolland, Laura Gustafson, Tete Xiao, Spencer Whitehead, Alexander C Berg, Wan-Yen Lo, et al. Segment anything. In Proceedings of the IEEE/CVF International Conference on Computer Vision, pages 4015–4026, 2023.
- Lewis [2018] James R Lewis. The system usability scale: past, present, and future. International Journal of Human–Computer Interaction, 34(7):577–590, 2018.
- Li et al. [2021] Kedan Li, Min Jin Chong, Jeffrey Zhang, and Jingen Liu. Toward accurate and realistic outfits visualization with attention to details. In Proceedings of the IEEE/CVF conference on computer vision and pattern recognition, pages 15546–15555, 2021.
- Liu et al. [2020] Yuzhao Liu, Yuhan Liu, Shihui Xu, Kelvin Cheng, Soh Masuko, and Jiro Tanaka. Comparing vr-and ar-based try-on systems using personalized avatars. Electronics, 9(11):1814, 2020.
- Liu et al. [2016] Ziwei Liu, Ping Luo, Shi Qiu, Xiaogang Wang, and Xiaoou Tang. Deepfashion: Powering robust clothes recognition and retrieval with rich annotations. In Proceedings of the IEEE conference on computer vision and pattern recognition, pages 1096–1104, 2016.
- Merle et al. [2012] Aurélie Merle, Sylvain Senecal, and Anik St-Onge. Whether and how virtual try-on influences consumer responses to an apparel web site. International Journal of Electronic Commerce, 16(3):41–64, 2012.
- Morelli et al. [2022] Davide Morelli, Matteo Fincato, Marcella Cornia, Federico Landi, Fabio Cesari, and Rita Cucchiara. Dress code: high-resolution multi-category virtual try-on. In Proceedings of the IEEE/CVF Conference on Computer Vision and Pattern Recognition, pages 2231–2235, 2022.
- Rombach et al. [2022] Robin Rombach, Andreas Blattmann, Dominik Lorenz, Patrick Esser, and Björn Ommer. High-resolution image synthesis with latent diffusion models. In Proceedings of the IEEE/CVF conference on computer vision and pattern recognition, pages 10684–10695, 2022.
- Song et al. [2020] Jiaming Song, Chenlin Meng, and Stefano Ermon. Denoising diffusion implicit models. arXiv preprint arXiv:2010.02502, 2020.
- Wang et al. [2018] Bochao Wang, Huabin Zheng, Xiaodan Liang, Yimin Chen, Liang Lin, and Meng Yang. Toward characteristic-preserving image-based virtual try-on network. In Proceedings of the European conference on computer vision (ECCV), pages 589–604, 2018.
- Wu et al. [2023] Yankun Wu, Yuta Nakashima, and Noa Garcia. Stable diffusion exposed: Gender bias from prompt to image. arXiv preprint arXiv:2312.03027, 2023.
- Ye et al. [2023] Hu Ye, Jun Zhang, Sibo Liu, Xiao Han, and Wei Yang. Ip-adapter: Text compatible image prompt adapter for text-to-image diffusion models. arXiv preprint arXiv:2308.06721, 2023.
- Yu et al. [2019] Ruiyun Yu, Xiaoqi Wang, and Xiaohui Xie. Vtnfp: An image-based virtual try-on network with body and clothing feature preservation. In Proceedings of the IEEE/CVF international conference on computer vision, pages 10511–10520, 2019.
- Yuan et al. [2011] Miaolong Yuan, Ishtiaq Rasool Khan, Farzam Farbiz, Arthur Niswar, and Zhiyong Huang. A mixed reality system for virtual glasses try-on. In Proceedings of the 10th international conference on virtual reality continuum and its applications in industry, pages 363–366, 2011.
- Yuan et al. [2013] Miaolong Yuan, Ishtiaq Rasool Khan, Farzam Farbiz, Susu Yao, Arthur Niswar, and Min-Hui Foo. A mixed reality virtual clothes try-on system. IEEE Transactions on Multimedia, 15(8):1958–1968, 2013.
- Zhang et al. [2023] Lvmin Zhang, Anyi Rao, and Maneesh Agrawala. Adding conditional control to text-to-image diffusion models. In Proceedings of the IEEE/CVF International Conference on Computer Vision, pages 3836–3847, 2023.
- Zhang et al. [2019] Tingting Zhang, William Yu Chung Wang, Ling Cao, and Yan Wang. The role of virtual try-on technology in online purchase decision from consumers’ aspect. Internet Research, 29(3):529–551, 2019.
- Zhu et al. [2023] Luyang Zhu, Dawei Yang, Tyler Zhu, Fitsum Reda, William Chan, Chitwan Saharia, Mohammad Norouzi, and Ira Kemelmacher-Shlizerman. Tryondiffusion: A tale of two unets. In Proceedings of the IEEE/CVF Conference on Computer Vision and Pattern Recognition, pages 4606–4615, 2023.
Appendix
Appendix A User Body Mask Generation
For the garment remover, we estimate the location of old garments of the same type using DensePose, where we filter the segments and retain only the relevant ones to obtain the user’s body mask as detailed Table 4. This provides us with a rough estimate of the old garment mask.
| Label | top + S | top + L | pants + S | pants + L | skirt + S | skirt + L |
| upper arm | ||||||
| lower arm | ||||||
| upper leg | ||||||
| lower leg |
Appendix B Pre-Study Questionnaire Analysis
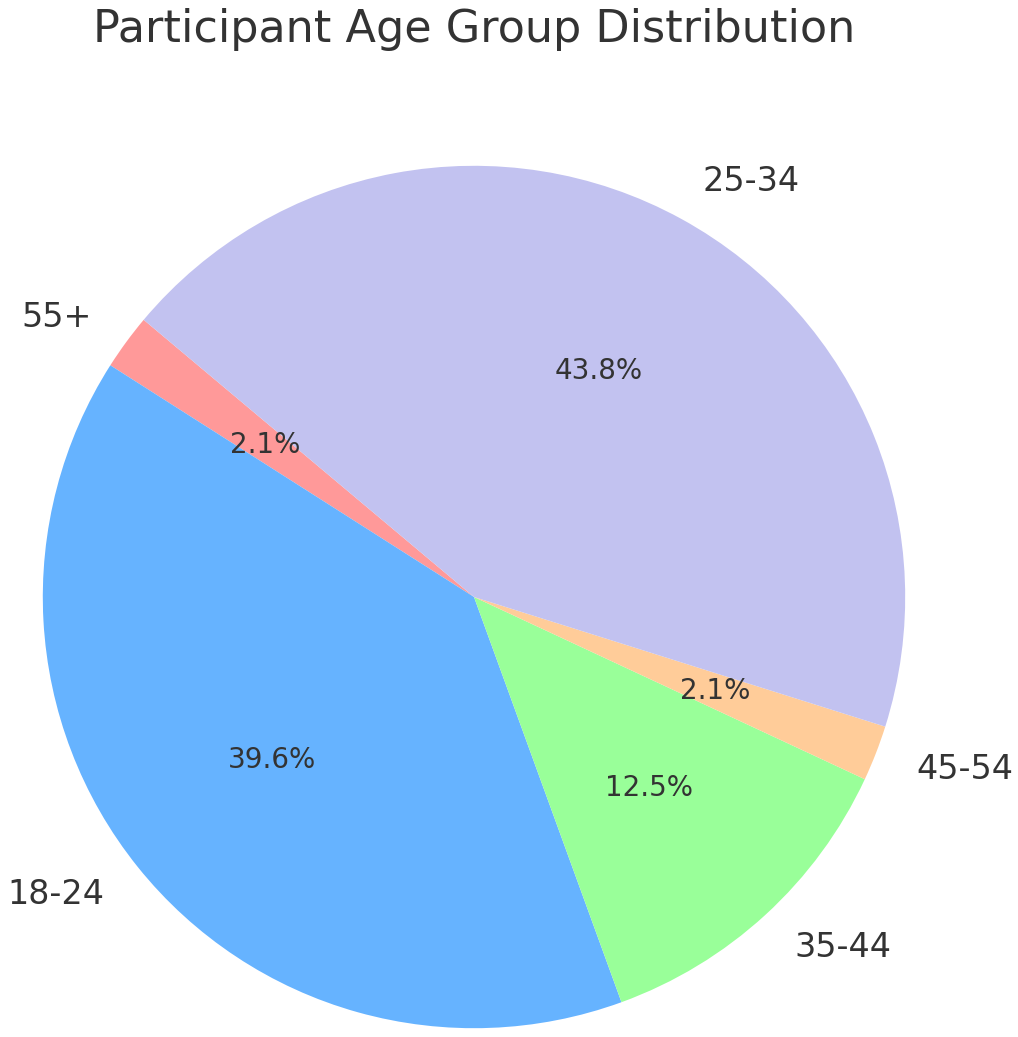
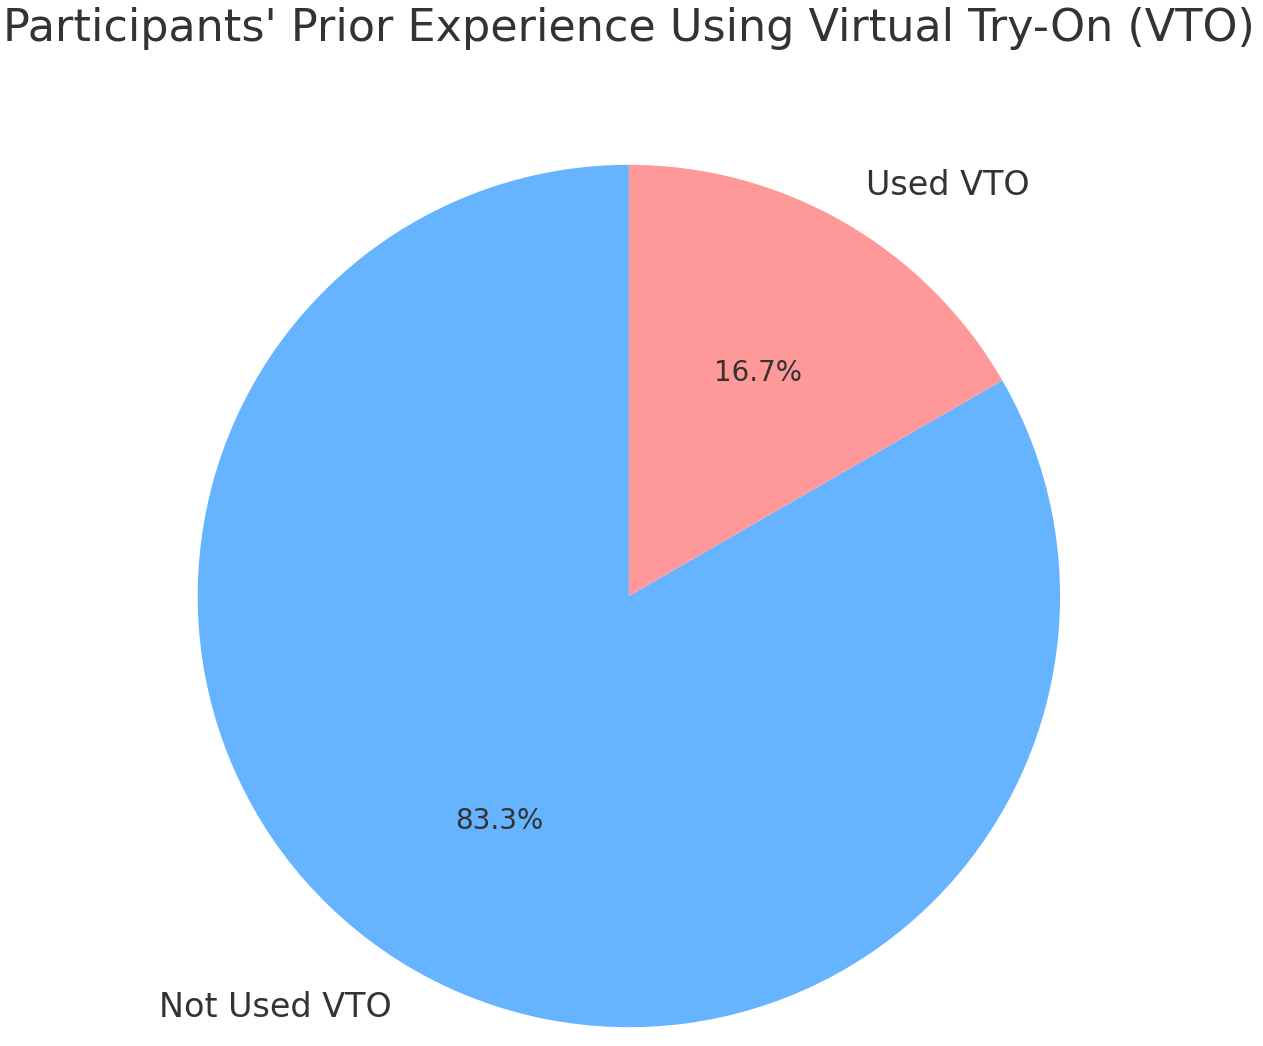
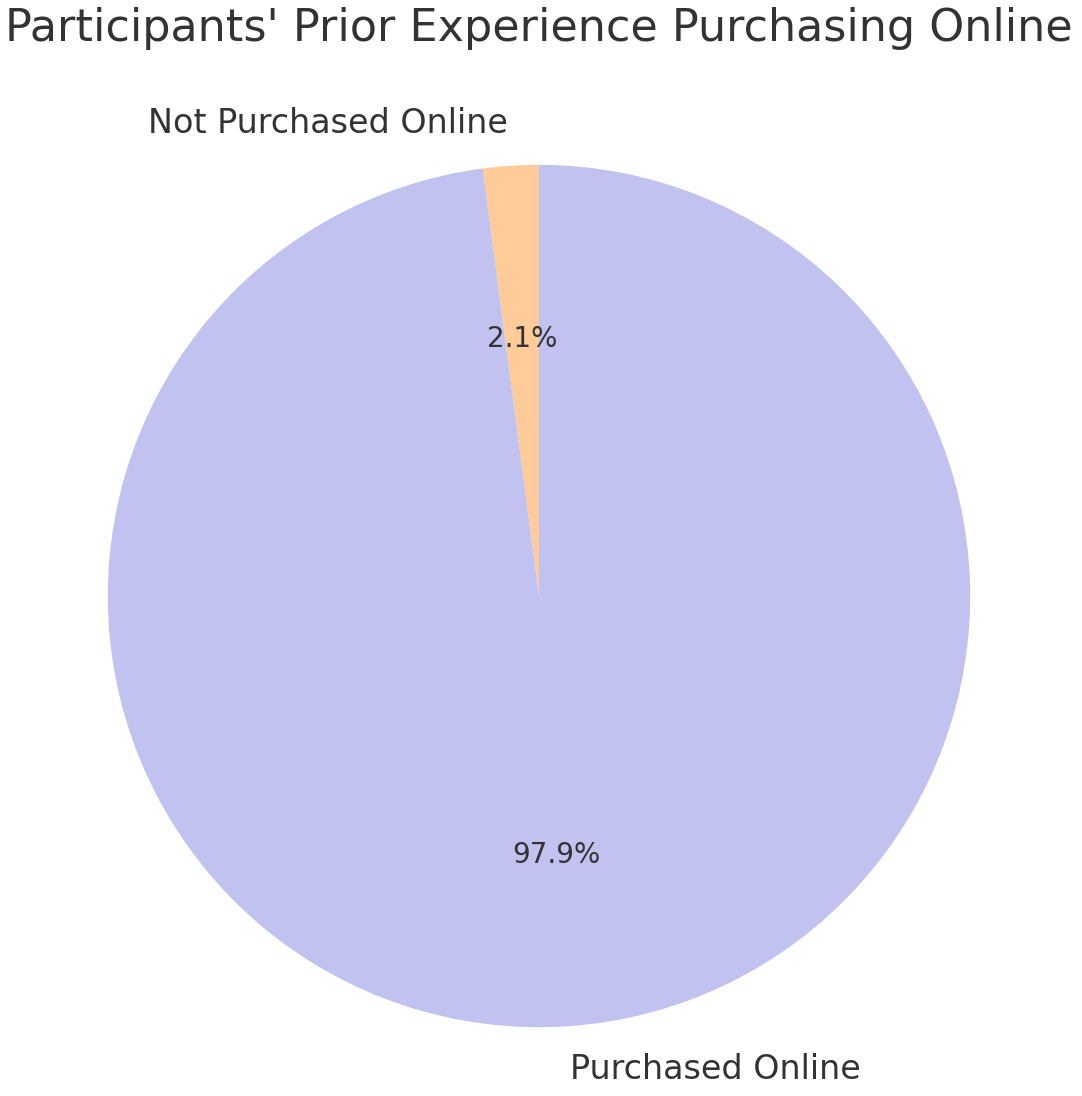
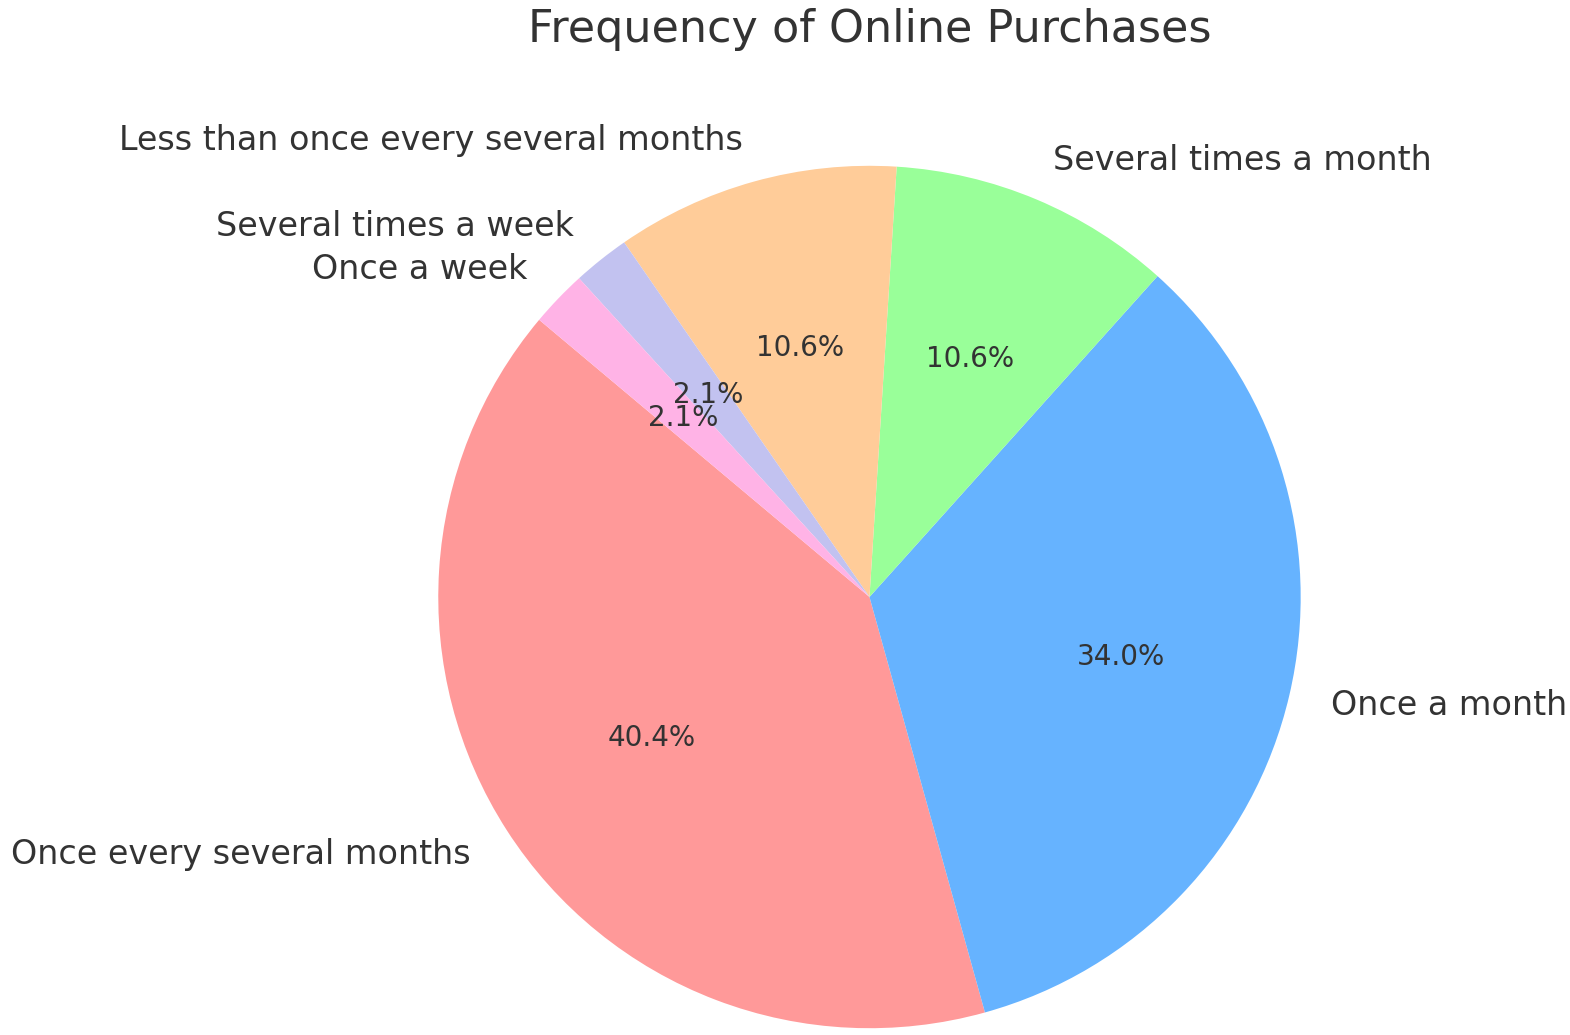
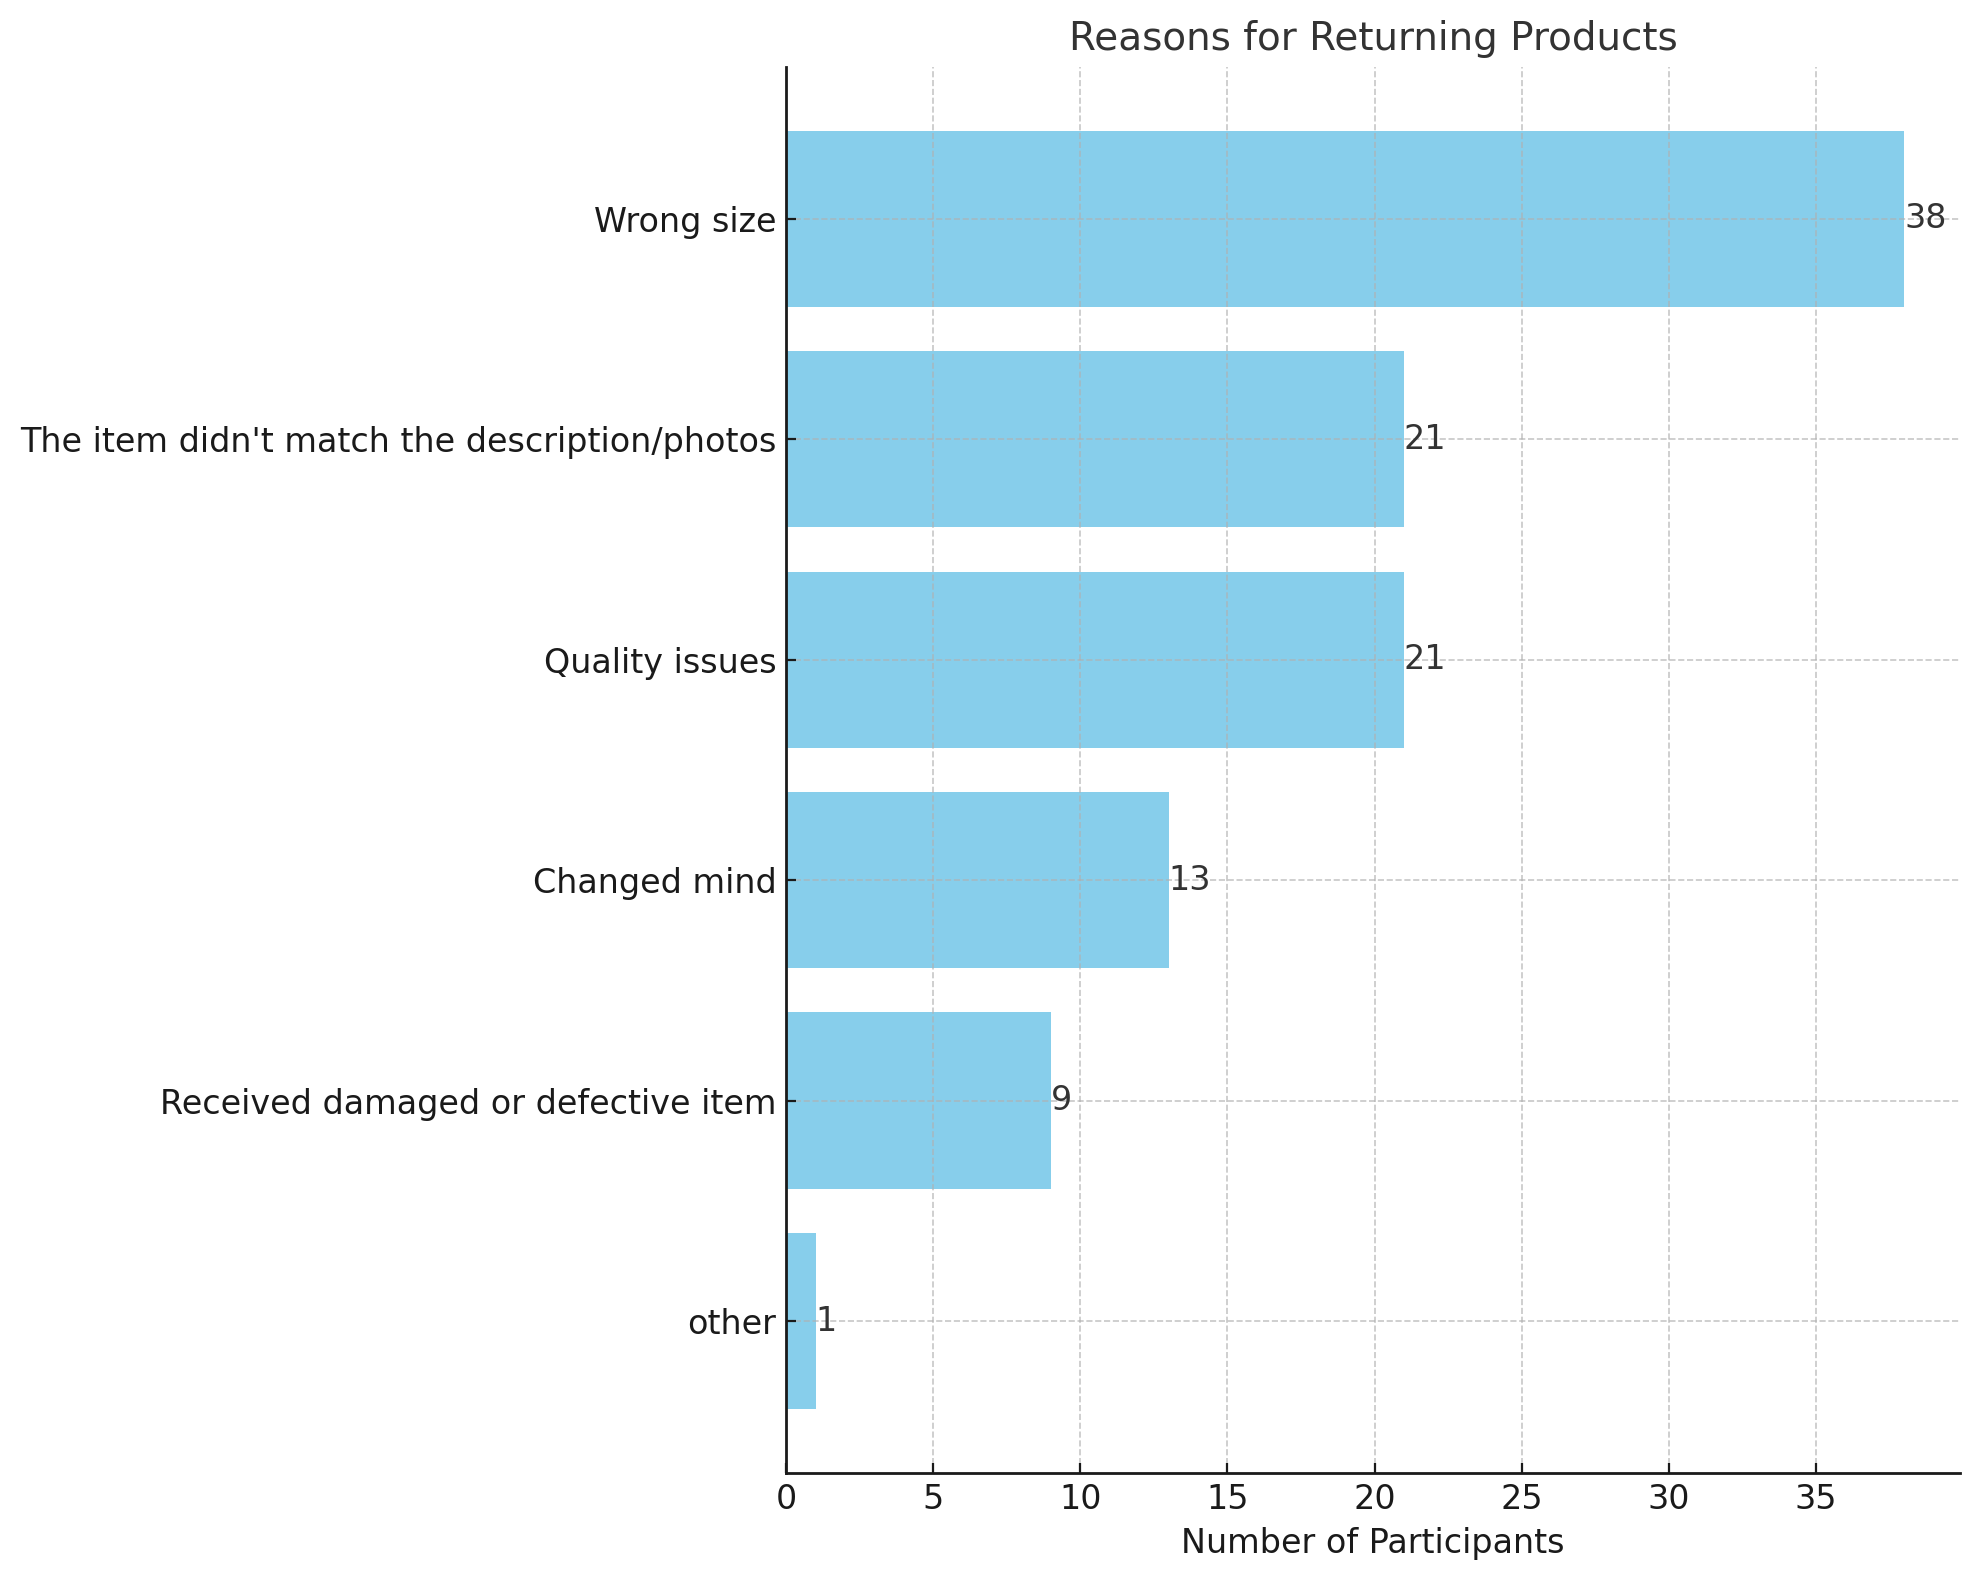
We recruited 48 participants to test SiCo, as shown in Figure 14, indicating the breakdown of responses from the pre-study questionnaire. Most people have prior online clothing purchasing experience when they shop for themselves, where the most common shopping frequency is once every several months (43.1%). Some people have prior experience using a VTO service (15.4%). Looking at prior reasons when participants returned items they had shopped online, the most common was because of the wrong size, where most participants answered yes (39 out of 48).
Each participant is assigned with two website versions to test in sequential order based on their arrival to the study. The assignment process was cyclic, starting with the first participant evaluating the versions listed under index 1 in Table 5, the second participant evaluating the versions under index 2, and so on. This pattern was repeated until the 25th participant, who circled back to test the versions under index 1, ensuring a uniform distribution of evaluations across all website versions
 |
 |
 |
 |
 |
 |
| index | index | index | ||||||
| 1 | D | A | 9 | B | C | 17 | C | D |
| 2 | A | D | 10 | B | A | 18 | C | B |
| 3 | D | A | 11 | B | C | 19 | C | D |
| 4 | A | D | 12 | B | A | 20 | C | B |
| 5 | A | C | 13 | C | A | 21 | D | C |
| 6 | A | B | 14 | B | D | 22 | D | B |
| 7 | A | C | 15 | C | A | 23 | D | C |
| 8 | A | B | 16 | B | D | 24 | D | B |
Appendix C Post-Study Questionnaire Analysis
The contingency tables comparing the use of a size-controllable Virtual Try-On (VTO) versus a baseline VTO as well as the use of the participant’s image versus a selected model image are presented in Table 6, which corresponds to Table 3. We perform chi-square post hoc analysis with adjusted residuals (Table 7) where we observe that more participants than expected (under the null hypothesis of no association) preferred the version with size-controllability VTO and using their own images for virtual try-on, respectively
| question index | label | factor = size control | factor = upload self-image | ||||
| (1) | enjoyable | factor | preferred | not preferred | factor | preferred | not preferred |
| \cdashline3-8 | included | 31 | 19 | included | 26 | 19 | |
| \cdashline3-8 | excluded | 17 | 29 | excluded | 22 | 29 | |
| (2) | sense-look | factor | preferred | not preferred | factor | preferred | not preferred |
| \cdashline3-8 | included | 36 | 14 | included | 31 | 14 | |
| \cdashline3-8 | excluded | 12 | 34 | excluded | 17 | 34 | |
| (3) | appearance | factor | preferred | not preferred | factor | preferred | not preferred |
| \cdashline3-8 | included | 33 | 17 | included | 25 | 20 | |
| \cdashline3-8 | excluded | 15 | 31 | excluded | 23 | 28 | |
| (4) | suitability | factor | preferred | not preferred | factor | preferred | not preferred |
| \cdashline3-8 | included | 34 | 16 | included | 30 | 15 | |
| \cdashline3-8 | excluded | 14 | 32 | excluded | 18 | 33 | |
| (5) | effectiveness | factor | preferred | not preferred | factor | preferred | not preferred |
| \cdashline3-8 | included | 30 | 20 | included | 29 | 16 | |
| \cdashline3-8 | excluded | 18 | 28 | excluded | 19 | 32 | |
| (6) | future-use | factor | preferred | not preferred | factor | preferred | not preferred |
| \cdashline3-8 | included | 35 | 15 | included | 26 | 19 | |
| \cdashline3-8 | excluded | 13 | 33 | excluded | 22 | 29 | |
| question index | label | factor = size control | factor = upload self-image | ||||
| (1) | enjoyable | factor | preferred | not preferred | factor | preferred | not preferred |
| \cdashline3-8 | included | 1.200 | -1.200 | included | 0.738 | -0.738 | |
| \cdashline3-8 | excluded | -1.251 | 1.251 | excluded | -0.693 | 0.693 | |
| (2) | sense-look | factor | preferred | not preferred | factor | preferred | not preferred |
| \cdashline3-8 | included | 2.200 | -2.200 | included | 1.791 | -1.791 | |
| \cdashline3-8 | excluded | -2.394 | 2.394 | excluded | -1.683 | 1.683 | |
| (3) | appearance | factor | preferred | not preferred | factor | preferred | not preferred |
| \cdashline3-8 | included | 1.600 | -1.600 | included | 1.668 | -1.668 | |
| \cdashline3-8 | excluded | -0.527 | 0.527 | excluded | -0.495 | 0.495 | |
| (4) | suitability | factor | preferred | not preferred | factor | preferred | not preferred |
| \cdashline3-8 | included | 1.800 | -1.800 | included | 1.581 | -1.581 | |
| \cdashline3-8 | excluded | -1.877 | 1.877 | excluded | -1.485 | 1.485 | |
| (5) | effectiveness | factor | preferred | not preferred | factor | preferred | not preferred |
| \cdashline3-8 | included | 1.000 | -1.000 | included | 1.370 | -1.370 | |
| \cdashline3-8 | excluded | -1.043 | 1.043 | excluded | -1.287 | 1.287 | |
| (6) | future-use | factor | preferred | not preferred | factor | preferred | not preferred |
| \cdashline3-8 | included | 2 | -2 | included | 0.738 | -0.738 | |
| \cdashline3-8 | excluded | -2.085 | 2.085 | excluded | -0.693 | 0.693 | |
 |
 |
 |
 |
 |
 |
 |
 |
 |
 |
 |
 |
 |
 |
 |
 |
Appendix D TLX Statistics Analysis
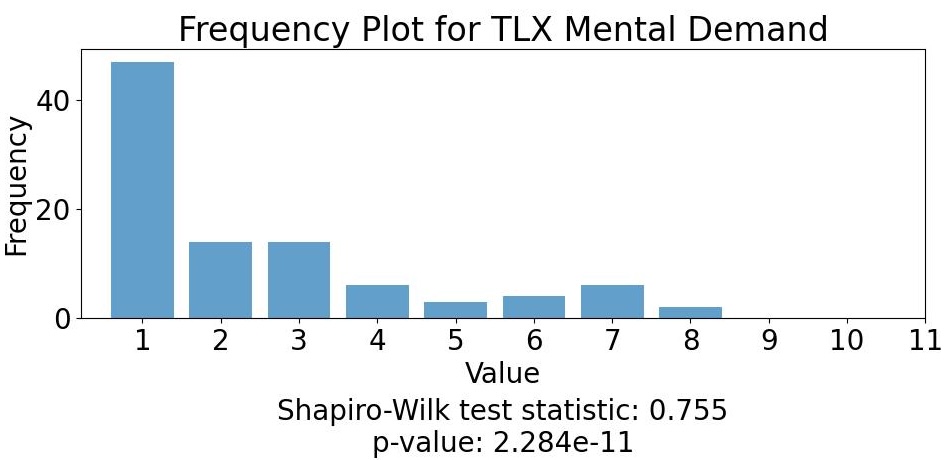
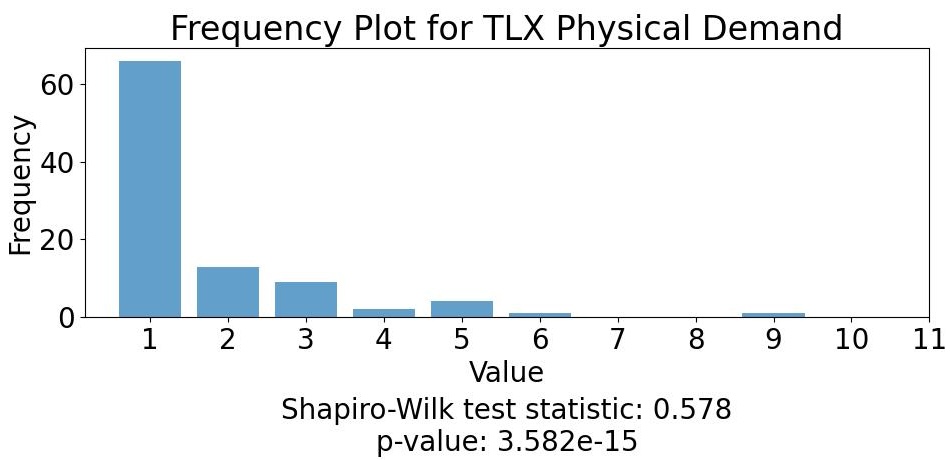
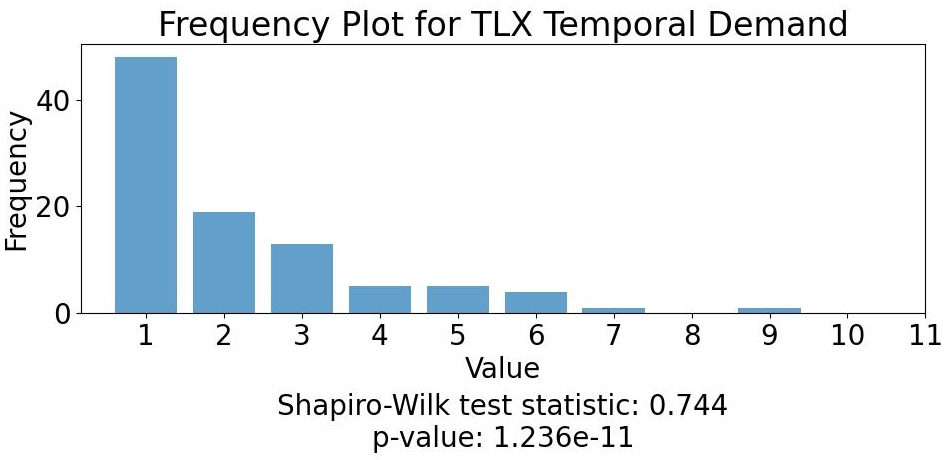
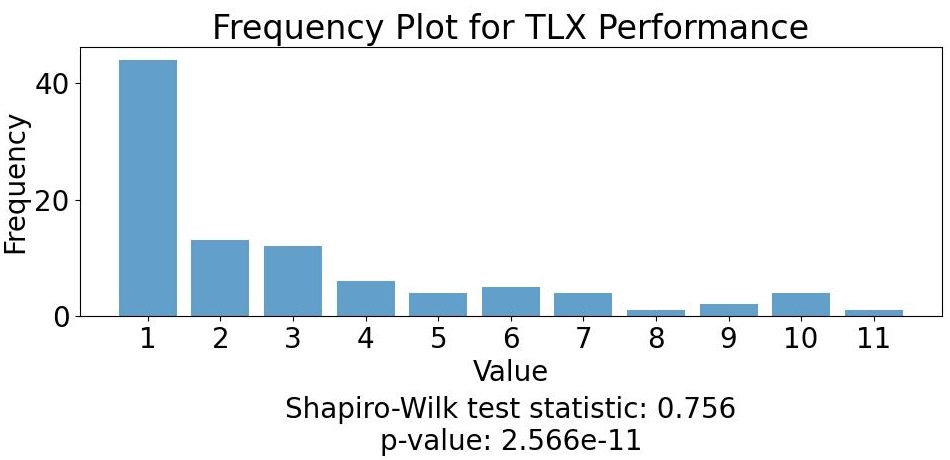
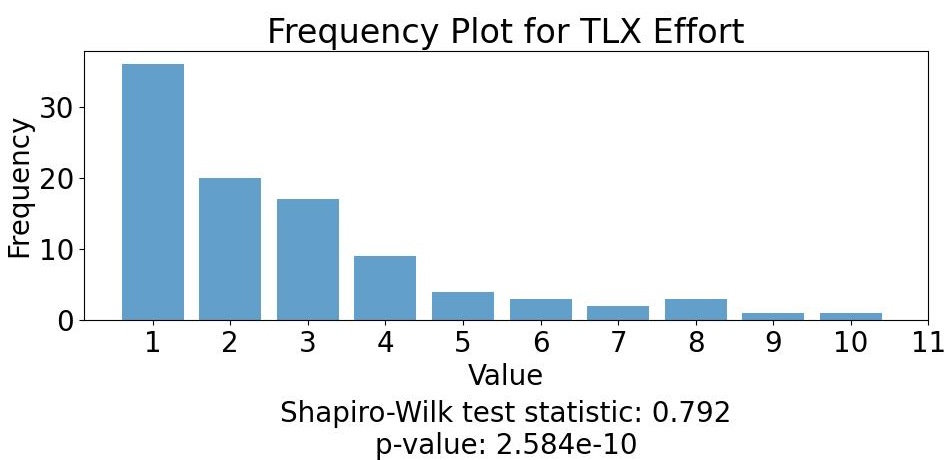
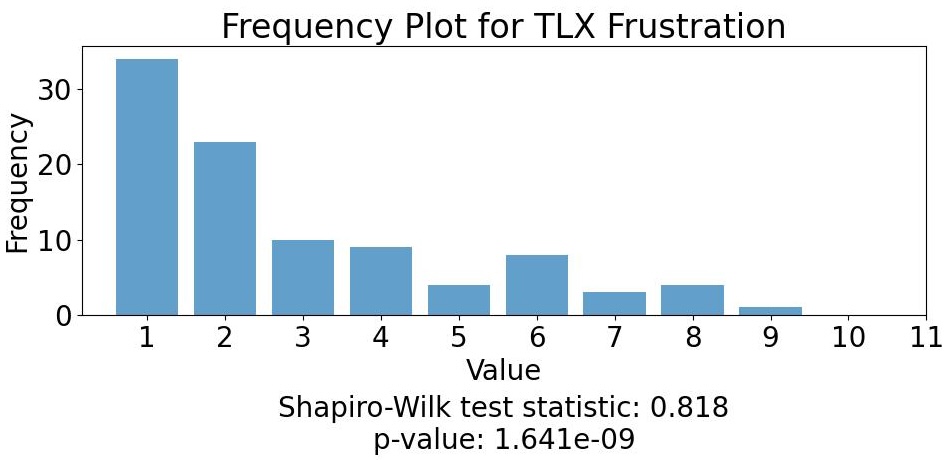
We want to investigate the impact of size-controllability and the use of participant self-images on cognitive load (measured using NASA TLX). Given that the reported scores do not adhere to a normal distribution (as indicated by Shapiro-Wilk test statistics and p-values shown below each plot in the Fig. 15), we conducted an aligned rank transform mixed-design ANOVA analysis as summarized in Tab. 8, where we present the baseline values (Intercept) for website version A and the estimated value changes with website versions B-D.
Upon examination of the z and p-values, used for indicating significance, we find that only the change from website version A to version C showed a significant negative impact () on the TLX performance metric. No other significant impacts were observed, suggesting that enabling size-control in VTO and/or using participant self-images to visualize VTO results did not affect task load.
| Coef. | Std.Err. | z | Pz | [0.025 | 0.975] | ||
| \cdashline2-8 | Intercept | 12.406 | 1.119 | 11.088 | 0.000 | 10.213 | 14.599 |
| condition[T.B] | -1.622 | 1.039 | -1.561 | 0.119 | -3.659 | 0.415 | |
| condition[T.C] | 1.624 | 1.018 | 1.595 | 0.111 | -0.371 | 3.620 | |
| Mental Demand | condition[T.D] | 0.327 | 1.068 | 0.306 | 0.759 | -1.766 | 2.420 |
| Coef. | Std.Err. | z | Pz | [0.025 | 0.975] | ||
| \cdashline2-8 | Intercept | 12.124 | 1.098 | 11.037 | 0.000 | 9.971 | 14.277 |
| condition[T.B] | -0.521 | 1.326 | -0.393 | 0.694 | -3.120 | 2.078 | |
| condition[T.C] | 1.686 | 1.289 | 1.308 | 0.191 | -0.840 | 4.212 | |
| Physical Demand | condition[T.D] | 0.378 | 1.343 | 0.281 | 0.778 | -2.255 | 3.011 |
| Coef. | Std.Err. | z | Pz | [0.025 | 0.975] | ||
| \cdashline2-8 | Intercept | 11.905 | 1.125 | 10.584 | 0.000 | 9.701 | 14.110 |
| condition[T.B] | 1.033 | 1.061 | 0.973 | 0.330 | -1.047 | 3.112 | |
| condition[T.C] | 1.026 | 1.039 | 0.987 | 0.323 | -1.011 | 3.063 | |
| Temporal Demand | condition[T.D] | 0.570 | 1.088 | 0.524 | 0.601 | -1.563 | 2.702 |
| Coef. | Std.Err. | z | Pz | [0.025 | 0.975] | ||
| \cdashline2-8 | Intercept | 11.222 | 1.216 | 9.232 | 0.000 | 8.840 | 13.605 |
| condition[T.B] | 0.497 | 1.330 | 0.374 | 0.708 | -2.109 | 3.104 | |
| condition[T.C] | 2.710 | 1.298 | 2.089 | 0.037 | 0.167 | 5.253 | |
| Performance | condition[T.D] | 1.898 | 1.363 | 1.393 | 0.164 | -0.772 | 4.569 |
| Coef. | Std.Err. | z | Pz | [0.025 | 0.975] | ||
| \cdashline2-8 | Intercept | 12.185 | 1.248 | 9.761 | 0.000 | 9.738 | 14.632 |
| condition[T.B] | -0.939 | 1.428 | -0.657 | 0.511 | -3.737 | 1.860 | |
| condition[T.C] | 1.344 | 1.392 | 0.965 | 0.334 | -1.385 | 4.073 | |
| Effort | condition[T.D] | 0.900 | 1.454 | 0.619 | 0.536 | -1.949 | 3.748 |
| Coef. | Std.Err. | z | Pz | [0.025 | 0.975] | ||
| \cdashline2-8 | Intercept | 12.248 | 1.308 | 9.363 | 0.000 | 9.684 | 14.812 |
| condition[T.B] | -0.436 | 1.573 | -0.277 | 0.782 | -3.518 | 2.646 | |
| condition[T.C] | 0.988 | 1.537 | 0.642 | 0.521 | -2.025 | 4.000 | |
| Frustration | condition[T.D] | 0.589 | 1.594 | 0.370 | 0.712 | -2.534 | 3.712 |
Appendix E SUS Statistics Analysis
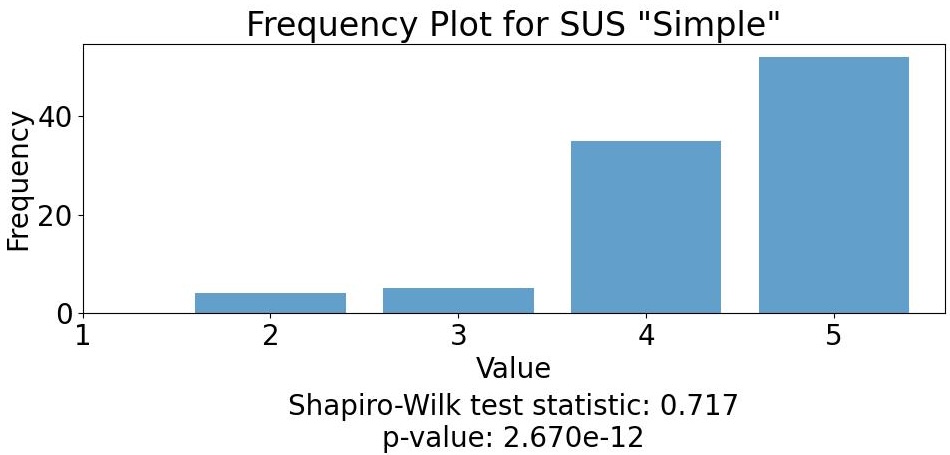
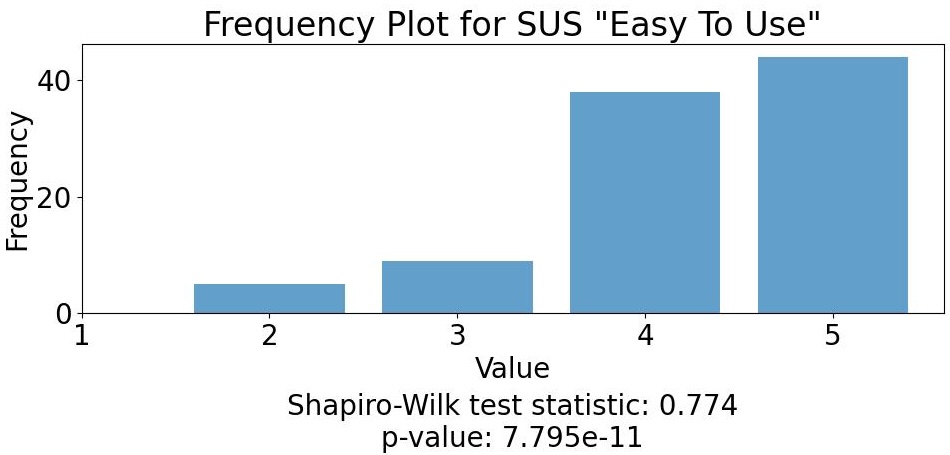
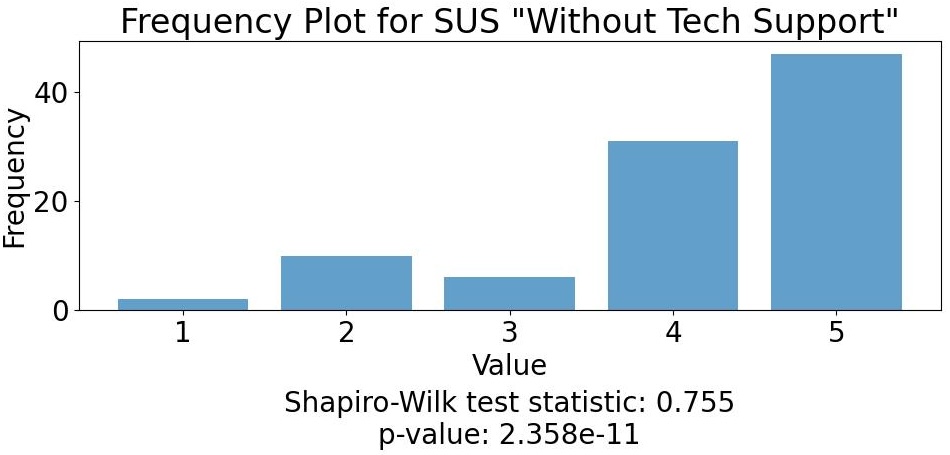
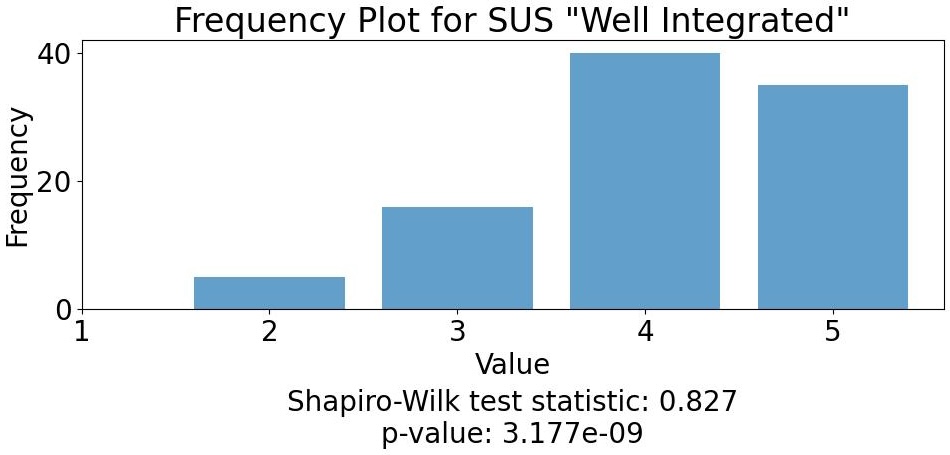
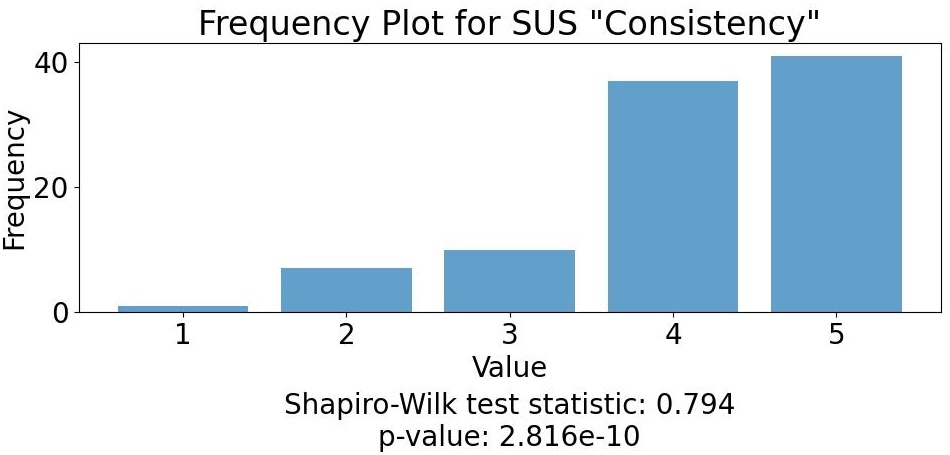
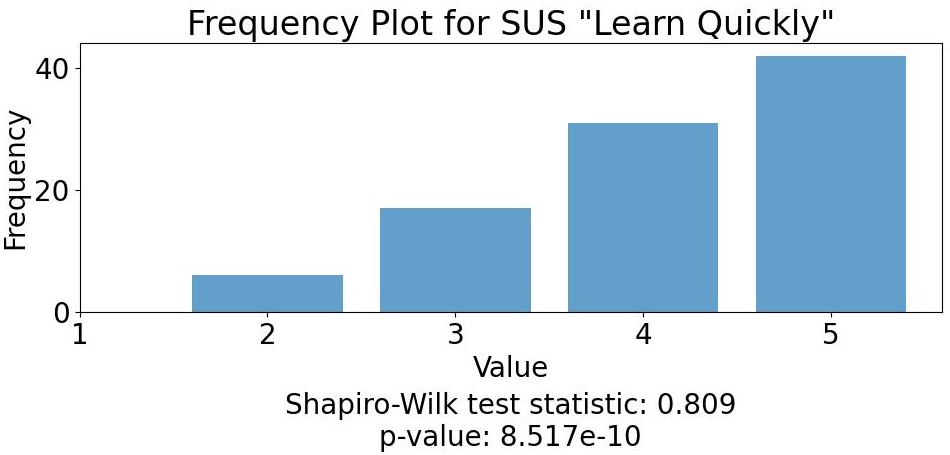
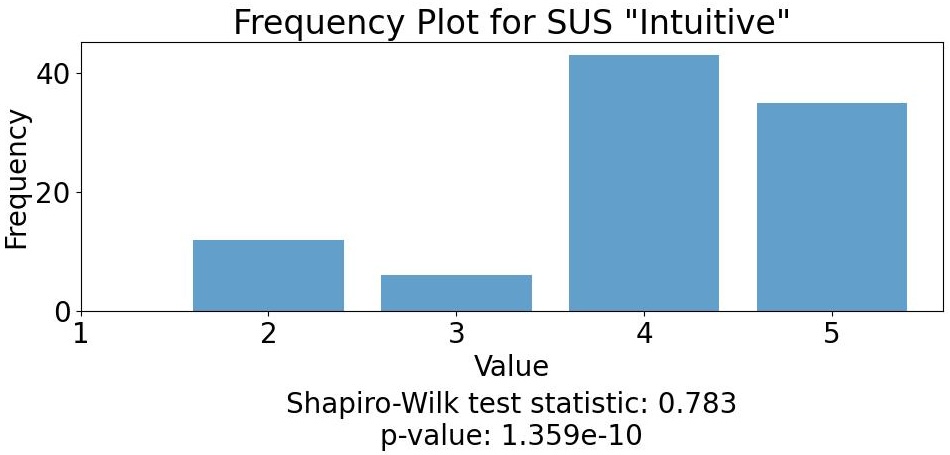
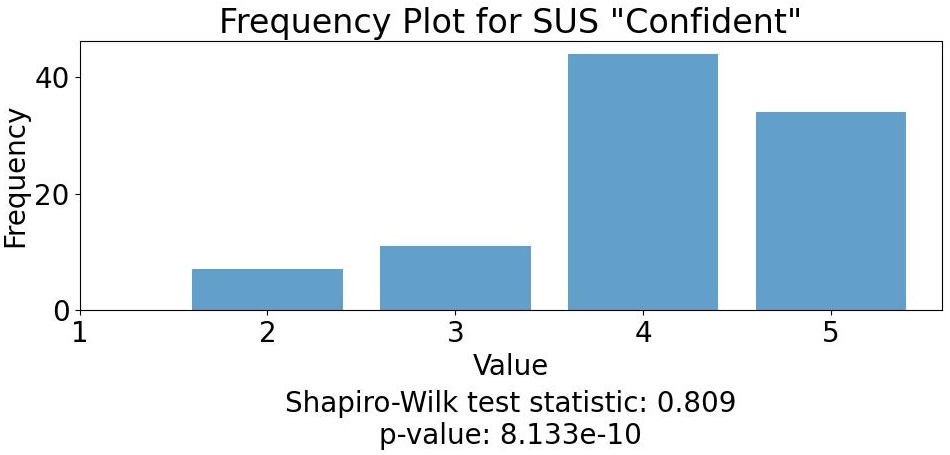
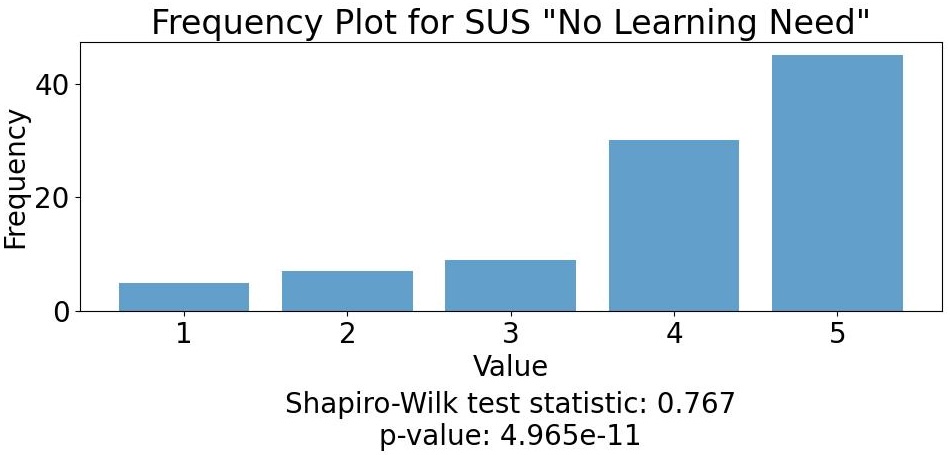
To investigate the impact of size-controllability and the use of participant self-images on system usability (measured using SUS), we conduct an aligned rank transform mixed-design ANOVA analysis. The results of this analysis are summarized in Table 9 given that the reported scores do not adhere to a normal distribution (as indicated by Shapiro-Wilk test statistics and p-values shown below each plot in Fig. 16). Here we present the baseline values (Intercept) for website version A and the estimated value changes with website versions B-D.
Upon examination of the z and p-values, used for indicating significance, we find that only the change from website version A to version C showed a significant negative impact () on the SUS consistency metric. No other significant impacts were observed, suggesting that enabling size-control in VTO and/or using participant self-images to visualize VTO results did not affect system usability.
| Coef. | Std.Err. | z | Pz | [0.025 | 0.975] | |||
| \cdashline3-9 | Intercept | 12.637 | 1.257 | 10.057 | 0.000 | 10.174 | 15.100 | |
| condition[T.B] | -1.220 | 1.408 | -0.867 | 0.386 | -3.981 | 1.540 | ||
| condition[T.C] | 1.714 | 1.372 | 1.249 | 0.212 | -0.975 | 4.403 | ||
| Use Frequently | I think that I would like to use the website frequently. | condition[T.D] | -1.065 | 1.445 | -0.737 | 0.461 | -3.898 | 1.767 |
| Coef. | Std.Err. | z | Pz | [0.025 | 0.975] | |||
| \cdashline3-9 | Intercept | 12.071 | 1.171 | 10.310 | 0.000 | 9.776 | 14.365 | |
| condition[T.B] | -0.240 | 1.363 | -0.176 | 0.860 | -2.912 | 2.432 | ||
| condition[T.C] | 1.945 | 1.327 | 1.466 | 0.143 | -0.655 | 4.546 | ||
| Simple | I found the website to be simple. | condition[T.D] | 0.041 | 1.387 | 0.030 | 0.976 | -2.677 | 2.760 |
| Coef. | Std.Err. | z | Pz | [0.025 | 0.975] | |||
| \cdashline3-9 | Intercept | 12.288 | 1.310 | 9.383 | 0.000 | 9.721 | 14.855 | |
| condition[T.B] | -1.078 | 1.716 | -0.628 | 0.530 | -4.442 | 2.286 | ||
| condition[T.C] | 1.959 | 1.645 | 1.191 | 0.234 | -1.266 | 5.184 | ||
| Easy To Use | I thought the website was easy to use. | condition[T.D] | -0.078 | 1.719 | -0.045 | 0.964 | -3.448 | 3.292 |
| Coef. | Std.Err. | z | Pz | [0.025 | 0.975] | |||
| \cdashline3-9 | Intercept | 13.079 | 1.196 | 10.935 | 0.000 | 10.735 | 15.424 | |
| condition[T.B] | -2.330 | 1.309 | -1.779 | 0.075 | -4.896 | 0.237 | ||
| condition[T.C] | 1.976 | 1.267 | 1.561 | 0.119 | -0.506 | 4.459 | ||
| Without Tech Support | I think that I could use the website without the support of a technical person. | condition[T.D] | -2.114 | 1.351 | -1.565 | 0.118 | -4.760 | 0.533 |
| Coef. | Std.Err. | z | Pz | [0.025 | 0.975] | |||
| \cdashline3-9 | Intercept | 12.618 | 1.222 | 10.327 | 0.000 | 10.224 | 15.013 | |
| condition[T.B] | -1.240 | 1.374 | -0.902 | 0.367 | -3.934 | 1.453 | ||
| condition[T.C] | 1.743 | 1.338 | 1.303 | 0.193 | -0.880 | 4.367 | ||
| Well Integrated | I found the various functions in the website were well integrated. | condition[T.D] | -1.007 | 1.410 | -0.714 | 0.475 | -3.770 | 1.756 |
| Coef. | Std.Err. | z | Pz | [0.025 | 0.975] | |||
| \cdashline3-9 | Intercept | 11.832 | 1.237 | 9.562 | 0.000 | 9.407 | 14.257 | |
| condition[T.B] | -0.632 | 1.481 | -0.427 | 0.670 | -3.535 | 2.271 | ||
| condition[T.C] | 2.921 | 1.447 | 2.019 | 0.044 | 0.085 | 5.757 | ||
| Consistency | I thought there was a lot of consistency in the website. | condition[T.D] | 0.256 | 1.502 | 0.171 | 0.864 | -2.687 | 3.200 |
| Coef. | Std.Err. | z | Pz | [0.025 | 0.975] | |||
| \cdashline3-9 | Intercept | 13.214 | 1.254 | 10.536 | 0.000 | 10.756 | 15.672 | |
| condition[T.B] | -1.539 | 1.444 | -1.066 | 0.286 | -4.370 | 1.291 | ||
| condition[T.C] | 0.711 | 1.414 | 0.503 | 0.615 | -2.061 | 3.482 | ||
| Learn Quickly | I would imagine that most people would learn to use the website very quickly. | condition[T.D] | -1.952 | 1.505 | -1.298 | 0.194 | -4.902 | 0.997 |
| Coef. | Std.Err. | z | Pz | [0.025 | 0.975] | |||
| \cdashline3-9 | Intercept | 12.424 | 1.261 | 9.849 | 0.000 | 9.951 | 14.896 | |
| condition[T.B] | -0.717 | 1.505 | -0.476 | 0.634 | -3.666 | 2.233 | ||
| condition[T.C] | 2.078 | 1.462 | 1.421 | 0.155 | -0.787 | 4.944 | ||
| Intuitive | I found the website very intuitive. | condition[T.D] | -1.083 | 1.549 | -0.700 | 0.484 | -4.119 | 1.952 |
| Coef. | Std.Err. | z | Pz | [0.025 | 0.975] | |||
| \cdashline3-9 | Intercept | 12.624 | 1.273 | 9.918 | 0.000 | 10.130 | 15.119 | |
| condition[T.B] | -1.245 | 1.543 | -0.807 | 0.420 | -4.270 | 1.780 | ||
| condition[T.C] | 2.034 | 1.493 | 1.362 | 0.173 | -0.892 | 4.960 | ||
| Confident | I felt very confident using the website. | condition[T.D] | -1.352 | 1.594 | -0.849 | 0.396 | -4.476 | 1.771 |
| Coef. | Std.Err. | z | Pz | [0.025 | 0.975] | |||
| \cdashline3-9 | Intercept | 13.199 | 1.238 | 10.663 | 0.000 | 10.773 | 15.625 | |
| condition[T.B] | -1.699 | 1.418 | -1.198 | 0.231 | -4.478 | 1.080 | ||
| condition[T.C] | 1.227 | 1.379 | 0.890 | 0.373 | -1.475 | 3.930 | ||
| No Learning Needed | I could use the website without having to learn anything new. | condition[T.D] | -2.328 | 1.486 | -1.566 | 0.117 | -5.240 | 0.585 |