Identifying influential node groups in networks with core-periphery structure
Abstract
Identifying influential spreaders is a crucial problem for practical applications in network science. The core-periphery (C-P) structure, common in many real-world networks, comprises a densely interconnected group of nodes (core) and the rest of the sparsely connected nodes subordinated to the core (periphery). Core nodes are expected to be more influential than periphery nodes generally, but recent studies suggest that this is not the case in some networks. In this work, we look for mesostructural conditions that arise when core nodes are significantly more influential than periphery nodes. In particular, we investigate the roles of the internal and external connectivity of cores in their relative influence. We observe that the internal and external connectivity of cores are broadly distributed, and the relative influence of the cores is also broadly distributed in real-world networks. Our key finding is that the internal connectivity of cores is positively correlated with their relative influence, whereas the relative influence increases up to a certain value of the external connectivity and decreases thereafter. Finally, results from the model-generated networks clarify the observations from the real-world networks. Our findings provide a structural condition for influential cores in networks and shed light on why some cores are influential and others are not.
I Introduction
Identifying influential spreaders in networks is relevant to crucial real-world problems such as capturing effective targets for vaccination or advertisement[1, 2, 3, 4]. An important problem is locating influential nodes in a network by leveraging its structure. The idea underlying structure-based identification of influential nodes is that a node’s connectivity to the rest of the network determines its ability to spread (i.e., influence). Many methods have been proposed to identify influential nodes based on structural features such as degree, betweenness, and h-index, to name a few[5, 6, 7, 8, 9, 10].
Core-periphery (C-P) structure[11, 12, 13, 14] is common in many real-world networks from the worldwide air-transportation network (WAN)[15] to the Internet[16] and underground transportation networks[17]. The core of a network is usually defined as a group of strongly connected nodes that are relatively well connected to the other part of the network. The other part, called the periphery, is a group of weakly connected nodes[11, 12, 18, 13]. For instance, the WAN comprises well-connected hub airports (core) and less connected local airports (periphery) whose destinations are normally the hub airports. By the definition of the C-P structure, core nodes are expected to have more influence than periphery nodes. A seminal study[19] suggested that where a given node is located in the spectrum between the periphery and core is more crucial than its local connectivity (i.e., the number of its nearest neighbours in the network) in terms of node influence. Other work[20, 21, 22, 23, 24, 25] has highlighted the importance of the node location in terms of its influence as well.
However, a recent study[26] has shown that core nodes are not always more influential than periphery nodes, in particular, when networks have community-like, isolated cores. Even if core nodes can have high local influence on nodes inside of the core, they can have low global influence outside of the core if the core has weak connectivity to the rest of the network. This result suggests that the influence of core nodes may depend on the internal and external connectivity of the core, and being in the core is not a sufficient condition for being an influential node. Although real-world networks exhibit a variety of the C-P structure[27, 14, 28], it is not well understood when cores are significantly more influential than their periphery.
In this study, we investigate how the influence of the core varies depending on its internal and external connectivity in real-world and model-generated networks. To do this, we consider two quantities: the internal connectivity of the core and the external connectivity of the core to the periphery. The internal connectivity quantifies how well the core nodes are connected to each other. The external connectivity quantifies how well the core nodes are connected to the periphery nodes. Our investigation of the C-P structure among 397 real-world networks shows that both internal and external connectivity are broadly distributed, indicating that the core’s relative influence in these networks may also be broadly distributed. We estimated node influence with an extensive simulation of an epidemic model on 132 real-world networks and observed that the relative influence of the cores is broadly distributed in these networks. More specifically, we observed that the cores are significantly more influential than their periphery in only 78 real-world networks. The cores of the remaining 54 networks had comparable influence to their periphery, albeit slightly higher. We observed a strong positive correlation between the internal connectivity of a core and its relative influence but an optimal behaviour between the external connectivity and the relative influence of the core, where the relative influence increases up to a certain value but decreases thereafter. Tests on the 2-block-based model network clarify the results we observed in the real-world networks. Our findings indicate when the core of a network can be significantly more influential than the periphery and suggest that, if leveraging core-periphery structure to identify influential groups of nodes, it would be helpful to first look at the internal and external connectivity of the core.
II Evaluation of C-P structure and measures of structural features
II.1 Lip algorithm
We use the Lip algorithm[29] to identify the core and periphery nodes of a given network. The algorithm is widely used[30, 31, 32, 33] for detecting the network’s C-P structure and is fast enough to identify the structure in a reasonable time.
The -shell decomposition algorithm[34], used in previous studies[19, 26, 24], assigns each node a -shell number that denotes the location of the node from the outermost periphery to the innermost core. Since the maximum shell number can differ significantly between networks, a comparison between networks is difficult. A cut-off for the shell number is also necessary to decide a partition into a core and periphery, which can cause difficulty in identifying a distinct core. To avoid the above difficulties, we use the Lip algorithm for the identification of the core and periphery.
The Lip algorithm defines a set of core nodes and a complementary set of periphery nodes. The algorithm minimises an objective function to find a core set. The objective function penalises links between two periphery nodes, while rewarding connections between two core nodes or one core node and one periphery node. The identification result from the Lip algorithm is different from other partitions based on centrality measures or other criteria[34, 8]. In the Lip algorithm, the objective function is
| (1) |
where is if there is a link between node and or otherwise. The predication function returns if the condition is true and if it is false. Thus, if a test set comprises well-connected members and the complementary set has sparsely connected members, both terms of the right-hand side of Eq. 1 are minimised. This is the key feature of the algorithm to prevent falsely investigating nodes with large degrees that have sparser interconnections between them. For instance, ten interconnected nodes whose degree is can be identified as the core, whereas a node whose degree is can not be identified as the core when its neighbours have low degree.
II.2 Structural features: link density
The characteristics of the C-P structure of a given network can be quantified by the link density in the core, in the periphery, and between the core and periphery because the main features of the C-P structure are a densely connected core, a sparsely connected periphery, and intermediate connectivity between the core and periphery. We can express the density of the core by the total number of links between core nodes() divided by the maximum capacity of the core() where denotes the number of nodes in the core. The same idea can be used for the periphery block and the block representing the external connectivity between the two partitions. Thus, we can define three link densities
| (2) |
where is the number of links in the corresponding block and is the number of nodes in the core or periphery. Since the Lip algorithm fulfils the C-P properties by identifying two groups of the dense and the sparse block, these link densities can characterize the C-P structure of networks.
However, these densities are not suitable for comparing different networks of different sizes. In this work, we define the internal connectivity as and the external connectivity as , respectively. These ratios are helpful in seeing the details of the identified C-P structure[35]. We note that the C-P structure in the ideal sense meets a criterion , while the isolated core reported in [26] can be represented when . and means the C-P structure’s clarity is not higher than a random structure such as the Erdős–Rényi random network.
III node influence and core(periphery) influence
III.1 Evaluation of node influence
We use Susceptible-Infected-Recovered(SIR) epidemic dynamics[36], a basic model for epidemic spreading, to estimate the influence of nodes in both model and real-world networks. In the SIR model, a node in a given network can be in one of three states: Susceptible, Infected, and Recovered. An infected node transmits the disease to one of its susceptible neighbours with probability and recovers spontaneously with probability . The recovered node can not be reinfected and remains recovered. The process ends when there are no infected nodes in the network. We define as the number of recovered nodes at the end of a spreading process started from node . The influence of the node is , where is the total number of nodes in the network[19, 26, 8].
Finding an influential node means that there must be differences in the influence of nodes. Therefore, finding a suitable for each network is crucial in this study. If is too large, the epidemics spread throughout the network regardless of the structure[37]. On the other hand, if is too small, only local spreading is possible, which is unsuitable for investigating a node’s ability to act as a global spreader. Accordingly, we take an infection rate that means the most influential node is expected to infect at least (denoted as ) of the network, according to previous studies[19, 26, 8].
Since there is no prior information on in general, we work with , which is the epidemic threshold from the degree-based mean-field approach[36]. It is known that there is a global epidemic if where a network’s degree-degree correlation is . Yet, the actual quantity of in real-world networks can be different from the in the networks with no correlation, and it does not necessarily coincide with . Thus, we pick from the set . The recovery rate is set to . If the initially infected node fails to infect any other nodes, then the spreading process will end immediately.
III.2 The average influence of the core and periphery
We can define the average value of influence for core and periphery(written or ) where
| (3) |
We can use to measure the relative difference in influence. We consider that if , then the core is significantly more influential than the periphery.
| Quantity | Notation |
|---|---|
| # of total nodes | |
| # of total links | |
| # of nodes in core or periphery | |
| # of links in blocks | |
| Link density of blocks | |
| Influence of node | |
| Normalised influence of node | |
| \pbox20cmAverage influence of | |
| the core or periphery | |
| internal connectivity | |
| external connectivity |
IV Generating 2-block random network model
Since real-world networks may show other structural features besides the C-P structure, we can clarify the role of the C-P structure in node influence if we consider model networks in which all other structures are random except for the controllable C-P structure. In this study, we apply a random network model with two stochastic random blocks of different link densities. This model has five parameters ) for the generated networks. We adopt the Erdős–Rényi random network[38] as the null model. We set the network size as and the core size as , where denotes the proportion of the core. After setting the sizes of blocks and the average degree of the null model, the parameters determine each block’s link density. The linking probability of two arbitrary nodes depends on those link densities. For instance, if two nodes are chosen from the core, the linking probability is equivalent to . Other cases for two chosen nodes from the periphery or one from the core and one from the periphery follow and as the linking probability, respectively. Note that the degree distributions of generated networks based on a combination of Poisson distributions differ greatly from those of real-world networks.
We investigate the relations between and in the model-generated and real-world networks to reveal the difference in influence between core and periphery nodes in networks with C-P structure.
V Data and algorithm
We picked 397 real-world networks from network collections[39, 40] that are categorised in many criteria, such as affiliation, animal interaction, and human contact, to name a few. The size of sampled networks is distributed from to , and the maximum size of the simulated real-world networks is . The average degree of networks broadly distributed from to . We remove the directions and weight of links in the considered networks to avoid too much complexity.
VI Results
VI.1 Relationship between the core’s connectivity and core influence in real-world networks
Identifying cores in networks can be helpful for finding influential nodes. However, the level of the relative influence of the identified cores may depend on their internal and external connectivity.
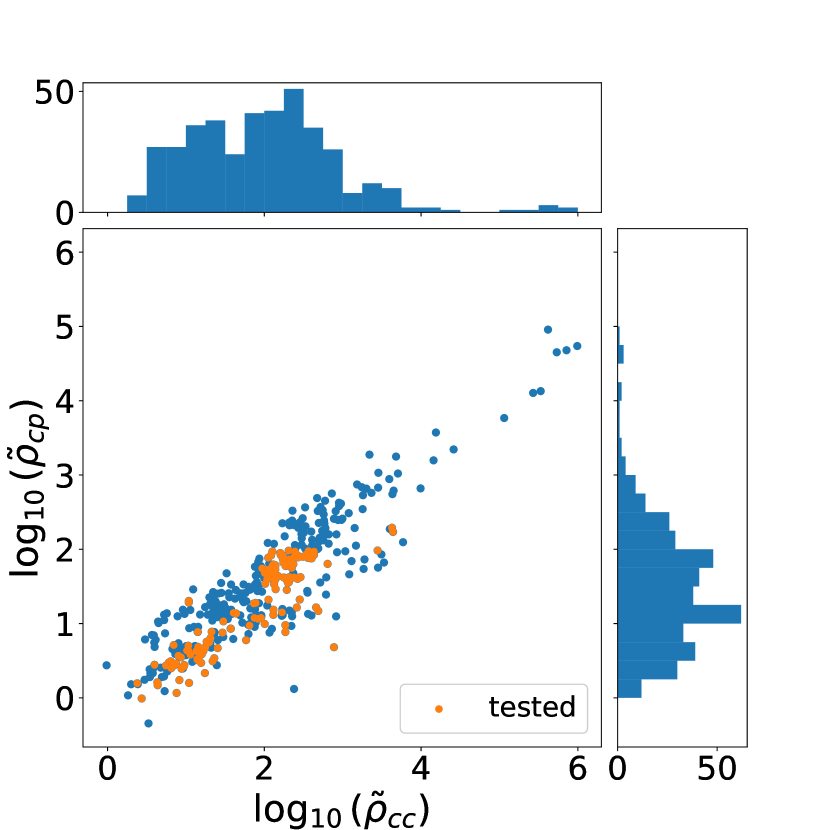
First, we investigated the internal and external connectivity of cores in real-world networks. To do this, using the Lip algorithm, we identified a core and a periphery in each of 397 real-world networks. Then, we calculated the internal and external connectivity in each of the real-world networks. Both distributions of the internal and external connectivity are broad (across several orders of magnitude), indicating a rich diversity in the C-P structure of the real-world networks.
The histograms are at the top and at the right in FIG. 1 show the distributions of the internal connectivity() and external connectivity(), respectively. They are distributed across order of magnitude from to over , and mainly placed between and .
FIG. 1 shows that is generally greater than , which means network cores are generally denser than the interconnections between partitions. However, we can see that there are some networks with . These do not have a pronounced C-P structure as the ideal definition requires . The isolated core(), observed in [26], is rarely observed in identified C-P structures with the Lip algorithm, but two networks, one of social interactions between zebras and another concerned with human social interactions, can be fitted in this category.
Second, we investigated the relationship between the two connectivities() and the relative influence of the core in real-world networks. To do this, we randomly selected 132 networks since the high computational cost of the SIR model simulations make a comprehensive test impractical.
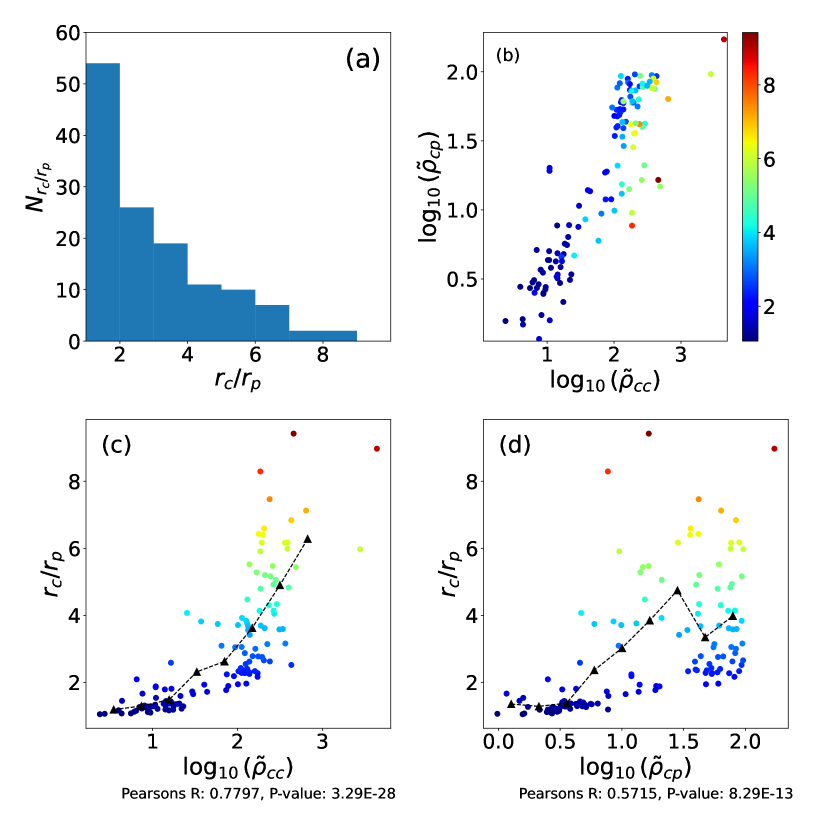
The result in FIG. 2. (a) shows a substantial number(54) of network cores are not significantly influential () than their periphery. This means that there are relatively less influential cores, which makes finding influential nodes inside the cores harder although the C-P structure exists for those networks. On the other hand, 12 networks have cores that are much more influential than their periphery (i.e., ).
FIG. 2. (b) demonstrates the increasing pattern of with and . Although networks with mainly arise when and , the increasing pattern is smooth rather than abrupt. The 12 networks with cores of most relative influence satisfy . This observation shows that the relative influence of the core can be affected by the detailed features of C-P structures rather than the existence of the C-P structures themselves.
Third, we investigated how the internal and external connectivity of the core are correlated to . To do this, we demonstrate the patterns of with the internal and external connectivity.
FIG. 2. (c) and (d) show how those two core’s connectivities affect . FIG. 2. (c) shows is positively correlated to . The role of the internal connectivity increases the influence of core nodes before the spreading process ends by providing many routes inside the core. As a consequence, most of the core members can be affected by a single core node, and their connectivity to the periphery can increase the core node’s influence further, making the core relatively more influential on average.
FIG. 2. (d) shows the relationship between and . The averaged (the dashed line with triangle markers) shows that increases with at the beginning, but it decreases where is high. A low relative influence of the cores can be expected in an isolated core[26] when is closer to or less than . However, our results show that while the relative influence of the core increases for moderate values of , this trend does not continue monotonically. Indeed, may even fall if gets too high.
However, our finding shows that a better external connectivity() does not always give a higher relative influence of the cores. High can reduce if it is large.
The Pearson’s correlations of and show that the internal and external connectivity is significantly correlated to in a statistical sense with both -values are less than . However, the correlation coefficient between and is about times larger than the coefficient between and .
VI.2 Observation on simple 2-block C-P model
We use model networks with a two-block structure to better understand the role of the internal and external connectivity of the cores. We generate model networks with fixed network size(), core size(), and link densities. We select the range of link densities that correspond to real-world data.
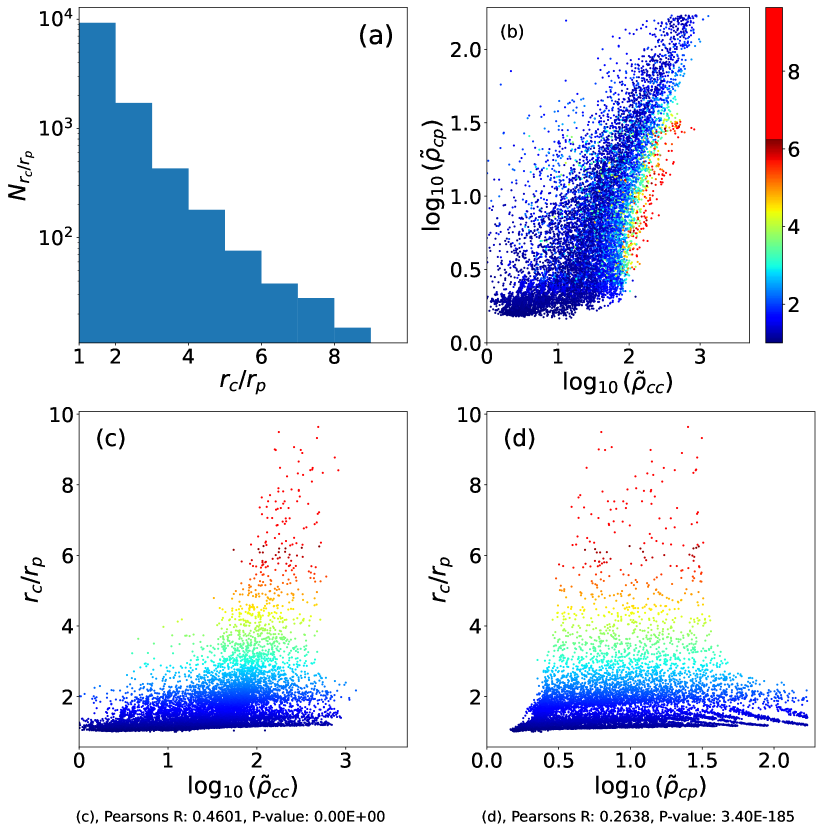
FIG. 3. (a) shows that the generated networks produce a range of from to despite the model’s simplicity. FIG. 3. (b) shows that the model generates a broader range of and than the real-world networks. Since the model can generate networks with the broader magnitudes of the relative influence() and the connectivity measures of the core, our data from the model can show the relationship between and more clearly.
As observed in the real-world networks, FIG. 3. (b) shows that higher are associated with higher . Furthermore, relatively influential cores of can be found where the ratio , , and , which indicates the relatively more influential cores can be found in the ideal core with high enough internal and external connectivity of the core. Also, the smooth change of on space supports the idea that the internal and external connectivity are correlated to the level of the relative influence of the core.
FIG. 3. (c) shows that is positively correlated to as in the real-world results. Although is more common with high , these correspond to networks with .
FIG. 3. (d) shows the optimal behaviour of on more clearly than real-world networks. We infer that increases in line with the core when the internally well-connected core exists, but not when . The trend is much clearer than for real-world networks as we can isolate the effect of (in real-world networks, both and can be large, masking the effect of the subdominant parameter). Indeed, it is very clear in this picture that very high values of bring the relative influence of the core right down.
The Pearson’s correlation coefficient for is with , and the values for are with . The higher correlation for compared with again follows the pattern seen in real-world data.
VII Discussion
This study looks to determine structural conditions for influential cores in networks in terms of the internal and external connectivity of the cores. Our findings show that those connectivities are distributed broadly in real-world networks, and they are positively correlated to the relative influence of the core. Influential cores are expected to be in ideal C-P structures, especially with relatively high internal and external connectivity of the core. Specifically the most influential cores() are observed when cores are distinctly dense() and well-connected to the periphery() in real-world, and and in simple 2-block model networks, respectively. Furthermore, investigation of the Pearson’s correlation shows that is more highly correlated to than .
Generally, finding influential core nodes may require several conditions to be satisfied. The correlations we have found reflect the fact that higher internal connectivity should increase the relative influence of the core since the quantity is directly correlated to the number of routes for spreading influence inside the core[19]. More internal spreading means a higher influence on the core nodes since they tend to have reasonably enough external connections to the periphery. A lack of external connectivity can limit the influence of the core[26], so that is also a crucial factor for the core to be relatively more influential than the periphery. But there is a caveat to this statement. If the external connectivity of the core is too high, its relative influence can decrease. The underlying reason is that higher external connectivity allows more routes between the core and periphery. Since those extra routes increase the influence of the core and periphery simultaneously, the relative difference between the influence of the core and the periphery is reduced.
The Pearson’s correlations between the relative influence of the core and each of the external and internal connectivity also support the idea that the internal connectivity is the most important factor in both the real-world and the generated networks.
In short, the clearest sign of an influential core in a network is high internal connectivity and reasonably high external connectivity, and the internal connectivity is distinctly more pronounced than the external connectivity.
In this work, we have looked at the size of the spread of an infection model to gauge influence. Further studies could investigate the influence of core in terms of infection speed since the influence of a node is not only about how far it can spread but also how quickly it can spread. Previous studies have identified more complex C-P structures, such as layered or multiple cores[27, 14, 28]. We avoid such complexity and capture just two structural features with the Lip method. Using more complicated features might help find influential nodes more accurately. For instance, in layered networks, we might think of the correlation between the core’s influence and the internal connectivity of the layered feature. An extension of the suggested approach in this study may be beneficial for finding influential nodes, particularly with non-binary partitions such as the layered C-P. And there are questions to answer if there are multiple cores[41]. For instance, is the external connectivity between two cores more crucial than the external connectivity between the cores and periphery?
Our findings provide a structural condition for influence of cores in networks and a plausible explanation of why some cores are influential and others are not. We believe that our results are helpful in identifying influential node groups in networks by leveraging structural features that are simple to calculate.
Acknowledgements.
Y.-H.E. acknowledge financial support by the National Research Foundation of Korea (NRF) grant funded by the Korea government (MSIT) (Grant No. 2020R1G1A1101950) and by the Basic Science Research Program through the National Research Foundation of Korea (NRF) funded by the Ministry of Education (Grant No. 2018R1A6A1A06024977).References
- Montes-Orozco et al. [2022] E. Montes-Orozco, R.-A. Mora-Gutiérrez, S.-G. de-los Cobos-Silva, E. A. Rincón-García, M. A. Gutiérrez-Andrade, P. Lara-Velázquez, et al., Analysis and characterization of the spread of covid-19 in mexico through complex networks and optimization approaches, Complexity 2022 (2022).
- Meng et al. [2022] X. Meng, S. Han, L. Wu, S. Si, and Z. Cai, Analysis of epidemic vaccination strategies by node importance and evolutionary game on complex networks, Reliability Engineering & System Safety 219, 108256 (2022).
- Zhang et al. [2022] Q. Zhang, X. Li, Y. Fan, and Y. Du, An sei3r information propagation control algorithm with structural hole and high influential infected nodes in social networks, Engineering Applications of Artificial Intelligence 108, 104573 (2022).
- Zareie et al. [2019] A. Zareie, A. Sheikhahmadi, and M. Jalili, Influential node ranking in social networks based on neighborhood diversity, Future Generation Computer Systems 94, 120 (2019).
- Ma et al. [2016] L.-l. Ma, C. Ma, H.-F. Zhang, and B.-H. Wang, Identifying influential spreaders in complex networks based on gravity formula, Physica A: Statistical Mechanics and its Applications 451, 205 (2016).
- Liu et al. [2016] Y. Liu, M. Tang, T. Zhou, and Y. Do, Identify influential spreaders in complex networks, the role of neighborhood, Physica A: Statistical Mechanics and its Applications 452, 289 (2016).
- Lü et al. [2016a] L. Lü, D. Chen, X.-L. Ren, Q.-M. Zhang, Y.-C. Zhang, and T. Zhou, Vital nodes identification in complex networks, Physics reports 650, 1 (2016a).
- Lü et al. [2016b] L. Lü, T. Zhou, Q.-M. Zhang, and H. E. Stanley, The h-index of a network node and its relation to degree and coreness, Nature communications 7, 1 (2016b).
- Hu et al. [2013] Q. Hu, Y. Gao, P. Ma, Y. Yin, Y. Zhang, and C. Xing, A new approach to identify influential spreaders in complex networks, in International Conference on Web-Age Information Management (Springer, 2013) pp. 99–104.
- Namtirtha et al. [2021] A. Namtirtha, A. Dutta, B. Dutta, A. Sundararajan, and Y. Simmhan, Best influential spreaders identification using network global structural properties, Scientific reports 11, 2254 (2021).
- Borgatti and Everett [2000] S. P. Borgatti and M. G. Everett, Models of core/periphery structures, Social networks 21, 375 (2000).
- Holme [2005] P. Holme, Core-periphery organization of complex networks, Physical Review E 72, 046111 (2005).
- Csermely et al. [2013] P. Csermely, A. London, L.-Y. Wu, and B. Uzzi, Structure and dynamics of core/periphery networks, Journal of Complex Networks 1, 93 (2013).
- Kojaku and Masuda [2018] S. Kojaku and N. Masuda, Core-periphery structure requires something else in the network, New Journal of Physics 20, 043012 (2018).
- Verma et al. [2014] T. Verma, N. A. Araújo, and H. J. Herrmann, Revealing the structure of the world airline network, Scientific Reports 4, 1 (2014).
- Carmi et al. [2007] S. Carmi, S. Havlin, S. Kirkpatrick, Y. Shavitt, and E. Shir, A model of internet topology using k-shell decomposition, Proceedings of the National Academy of Sciences 104, 11150 (2007).
- Lee et al. [2014] S. H. Lee, M. Cucuringu, and M. A. Porter, Density-based and transport-based core-periphery structures in networks, Physical Review E 89, 032810 (2014).
- Rombach et al. [2014] M. P. Rombach, M. A. Porter, J. H. Fowler, and P. J. Mucha, Core-periphery structure in networks, SIAM Journal on Applied mathematics 74, 167 (2014).
- Kitsak et al. [2010] M. Kitsak, L. K. Gallos, S. Havlin, F. Liljeros, L. Muchnik, H. E. Stanley, and H. A. Makse, Identification of influential spreaders in complex networks, Nature Physics 6, 888 (2010).
- Bae and Kim [2014] J. Bae and S. Kim, Identifying and ranking influential spreaders in complex networks by neighborhood coreness, Physica A: Statistical Mechanics and its Applications 395, 549 (2014).
- Liu et al. [2015a] Y. Liu, M. Tang, T. Zhou, and Y. Do, Improving the accuracy of the k-shell method by removing redundant links: From a perspective of spreading dynamics, Scientific reports 5, 1 (2015a).
- Zhang et al. [2016] J.-X. Zhang, D.-B. Chen, Q. Dong, and Z.-D. Zhao, Identifying a set of influential spreaders in complex networks, Scientific reports 6, 27823 (2016).
- Koujaku et al. [2016] S. Koujaku, I. Takigawa, M. Kudo, and H. Imai, Dense core model for cohesive subgraph discovery, Social Networks 44, 143 (2016).
- Malliaros et al. [2016] F. D. Malliaros, M.-E. G. Rossi, and M. Vazirgiannis, Locating influential nodes in complex networks, Scientific reports 6, 19307 (2016).
- Wang et al. [2017] Z. Wang, C. Du, J. Fan, and Y. Xing, Ranking influential nodes in social networks based on node position and neighborhood, Neurocomputing 260, 466 (2017).
- Liu et al. [2015b] Y. Liu, M. Tang, T. Zhou, and Y. Do, Core-like groups result in invalidation of identifying super-spreader by k-shell decomposition, Scientific Reports 5, 1 (2015b).
- Zhang et al. [2015] X. Zhang, T. Martin, and M. E. Newman, Identification of core-periphery structure in networks, Physical Review E 91, 032803 (2015).
- Gallagher et al. [2021] R. J. Gallagher, J.-G. Young, and B. F. Welles, A clarified typology of core-periphery structure in networks, Science advances 7, eabc9800 (2021).
- Lip [2011] S. Z. Lip, A fast algorithm for the discrete core/periphery bipartitioning problem, arXiv preprint arXiv:1102.5511 (2011).
- Bargigli et al. [2015] L. Bargigli, G. Di Iasio, L. Infante, F. Lillo, and F. Pierobon, The multiplex structure of interbank networks, Quantitative Finance 15, 673 (2015).
- Lux [2015] T. Lux, Emergence of a core-periphery structure in a simple dynamic model of the interbank market, Journal of Economic Dynamics and Control 52, A11 (2015).
- Barucca et al. [2016] P. Barucca, D. Tantari, and F. Lillo, Centrality metrics and localization in core-periphery networks, Journal of Statistical Mechanics: Theory and Experiment 2016, 023401 (2016).
- Karlovčec et al. [2016] M. Karlovčec, B. Lužar, and D. Mladenić, Core-periphery dynamics in collaboration networks: the case study of slovenia, Scientometrics 109, 1561 (2016).
- Alvarez-Hamelin et al. [2005] J. I. Alvarez-Hamelin, L. Dall’Asta, A. Barrat, and A. Vespignani, k-core decomposition: A tool for the visualization of large scale networks, arXiv preprint cs/0504107 (2005).
- Ureña-Carrión et al. [2023] J. Ureña-Carrión, F. Karimi, G. Íñiguez, and M. Kivelä, Assortative and preferential attachment lead to core-periphery networks, Physical Review Research 5, 043287 (2023).
- Pastor-Satorras et al. [2015] R. Pastor-Satorras, C. Castellano, P. Van Mieghem, and A. Vespignani, Epidemic processes in complex networks, Reviews of modern physics 87, 925 (2015).
- Min [2018] B. Min, Identifying an influential spreader from a single seed in complex networks via a message-passing approach, The European Physical Journal B 91, 1 (2018).
- Erdos et al. [1960] P. Erdos, A. Rényi, et al., On the evolution of random graphs, Publ. math. inst. hung. acad. sci 5, 17 (1960).
- Peixoto [2020] T. P. Peixoto, The netzschleuder network catalogue and repository (2020).
- Kunegis [2013] J. Kunegis, KONECT – The Koblenz Network Collection, in Proc. Int. Conf. on World Wide Web Companion (2013) pp. 1343–1350.
- Kojaku and Masuda [2017] S. Kojaku and N. Masuda, Finding multiple core-periphery pairs in networks, Physical Review E 96, 052313 (2017).
- Kempe et al. [2003] D. Kempe, J. Kleinberg, and É. Tardos, Maximizing the spread of influence through a social network, in Proceedings of the ninth ACM SIGKDD international conference on Knowledge discovery and data mining (2003) pp. 137–146.
- Wei et al. [2022] X. Wei, J. Zhao, S. Liu, and Y. Wang, Identifying influential spreaders in complex networks for disease spread and control, Scientific reports 12, 5550 (2022).
- Goyal et al. [2013] A. Goyal, F. Bonchi, L. V. Lakshmanan, and S. Venkatasubramanian, On minimizing budget and time in influence propagation over social networks, Social network analysis and mining 3, 179 (2013).
- Shen et al. [2021] X. Shen, S. Aliko, Y. Han, J. I. Skipper, and C. Peng, Finding core-periphery structures with node influences, IEEE Transactions on Network Science and Engineering 9, 875 (2021).
- Barabási et al. [2016] A.-L. Barabási et al., Network Science (Cambridge University Press, 2016).