Table Transformers for Imputing Textual Attributes
Abstract
Missing data in tabular dataset is a common issue as the performance of downstream tasks usually depends on the completeness of the training dataset. Previous missing data imputation methods focus on numeric and categorical columns, but we propose a novel end-to-end approach called Table Transformers for Imputing Textual Attributes (TTITA) based on the transformer to impute unstructured textual columns using other columns in the table. We conduct extensive experiments on two Amazon Reviews datasets, and our approach shows competitive performance outperforming baseline models such as recurrent neural networks and Llama2. The performance improvement is more significant when the target sequence has a longer length. Additionally, we incorporated multi-task learning to simultaneously impute for heterogeneous columns, boosting the performance for text imputation. We also qualitatively compare with ChatGPT for realistic applications.
1 Introduction
Data quality is crucial for models to make valuable inferences (Schelter et al., 2021). With automated data collection pipelines such as implicit feedback, the growing amount of data can facilitate training, but the quality of data remains a topic of interest. Specifically, datasets in the real world have missing values, and simply dropping that column from the equation is sub-optimal since many variables can have a large correlation with the target column. Moreover, dropping the entire row with missing values dismisses the other completed columns, and doing so can under-represent such populations, which harms the value of the model for those groups. Missing data is categorized into three types: missing completely at random (MCAR), missing at random (MAR), and missing not at random (MNAR). MCAR defines the situation where the absence of data is random and independent from the other variables. MAR describes when the missingness remains random but can be accounted for by other variables, and other situations fall into the MNAR category where missingness is not random. Modern practices dealing with missing data include replacing missing values with the mean, the mode (Pratama et al., 2016), some other constants, or replacing them with the predictions from another machine learning model (Alabadla et al., 2022) trained on existing data. These are suitable for numeric and categorical missing columns but not for unstructured textual columns which can be an important piece of information in many datasets such as user reviews. Many related works have attempted to solve the missing data problem (Mostafa, 2019; Khan and Hoque, 2020), but there has been little research on imputing textual columns. To fill that gap, we propose a transformer-based approach to impute unstructured text. The model takes in other heterogeneous columns in the table, including numeric, categorical, and textual inputs and encodes them into a context vector. This vector provides background information on the target column, and the entire pipeline is learned in an end-to-end fashion. Thus, our contribution can be summarized as the following:
-
•
We identified the missing data imputation problem for unstructured textual columns in tabular data. To the best of our knowledge, no prior work has addressed the task of table imputation involving unstructured textual attributes.
-
•
We proposed a transformer-based model called Table Transformers for Imputing Textual Attributes (TTITA). The model is customized to encode observed heterogeneous tabular attributes as input and decode missing textual attributes as output.
-
•
We further conduct experiments on real-world datasets to demonstrate the effectiveness of our model.
-
•
We will make TTITA open-source as a PIP package for custom applications. Code is released111https://github.com/tingruew/TTITA-Text-Imputation.
2 Related Work
The data imputation problem has been widely studied, from traditional machine learning methods to large language models (LLMs), but little research has been conducted on imputing unstructured textual data. DataWig (Biessmann et al., 2018, 2019), a working software package that motivated our work, can take numeric, categorical, and textual input columns to impute numeric or categorical columns, using embedding and fully-connected layers. Batra et al. (2022) used an ensemble strategy to impute numeric columns, while Li et al. (2021), Mattei and Frellsen (2019), and Gondara and Wang (2018) used variants of autoencoders for imputing time series, image, numeric and categorical data. Jäger et al. (2021) and Paterakis et al. (2024) compared various imputation methods for categorical and numeric columns, and Yoon et al. (2018) and Wu et al. (2023) utilized generative adversarial networks to impute numeric columns. With the recent diffusion model, DiffImpute (Wen et al., 2024), MTabGen (Villaizán-Vallelado et al., 2024), TabDDPM (Kotelnikov et al., 2023), TabCSDI (Zheng and Charoenphakdee, 2022), and Jolicoeur-Martineau et al. (2024) worked on the imputation of numeric and categorical columns. Mei et al. (2021) leveraged pre-trained language models to impute numeric and categorical columns, while Narayan et al. (2022) showed that language foundation models are able to conduct data cleaning and integration tasks and RetClean (Ahmad et al., 2023) leveraged ChatGPT to impute missing categorical data with a user-provided data lake. RPT (Tang et al., 2021) fills in missing data with transformers by concatenating all columns for a data sample into a sequence and reconstructing it. However, unstructured textual columns significantly increase the length of the input and output sequences, which poses a challenge in performance and efficiency to the denoising approach. Under the scope of these related work, our proposed approach, TTITA, tackles the text imputation problem that is highly underdeveloped and specializes in unstructured text imputation for the first time. By using a feature extractor whose output dimension is independent from the input text length, the sequence length of the input textual columns does not hinder the generation of text.
3 Proposed Method
Due to the many advantages transformer models (Vaswani et al., 2017) have and their public acceptance, we propose a transformer-based approach using other heterogeneous tabular columns as input to impute textual columns. Input columns are encoded into a context vector that is subsequently fed into the transformer decoder network for cross-attention. Being the query in cross-attention, previous tokens in the target column highlight the relevant parts of the context vector, assisting the token prediction task in the transformer decoder. TTITA has an encoder-decoder architecture where the encoder encodes the input columns and the decoder outputs the text sequence for imputation, facilitated by the cross-attention. Training on domain data exempts from the post-processing that LLMs, including ChatGPT, require for the final result, and the use of featurizers and embeddings enables flexible adjustment on the model size, making this framework adoptable for wide usage.
3.1 Input Data Encoding
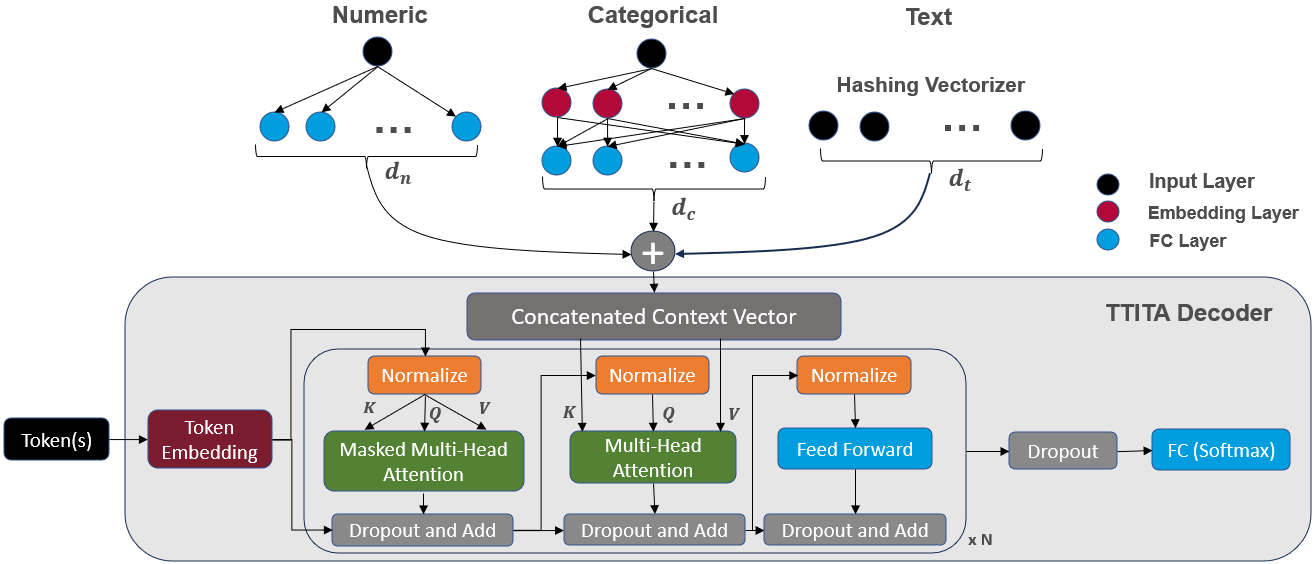
For each type of input columns, we have a different way of encoding in the neural network, as shown in Figure 1. Following DataWig (Biessmann et al., 2018, 2019), numeric input columns are encoded by a fully-connected (FC) layer of neurons, categorical input columns are connected to an embedding layer and sequentially another FC layer of neurons, and textual input columns are featurized by the hashing vectorizer from the scikit-learn package in a dimension of . This corresponds to the size of the input layer for textual columns and does not require any pre-processing of textual data. At the character level, the hashing vectorizer scans for unigrams through 5-grams. We acknowledge that, compared to data imputation, the primary focus lies in the downstream tasks, and the time cost in imputation plays a crucial role in selecting the appropriate imputation method, so we choose not to introduce additional parameters here given the presence of a transformer decoder in the model.
The latent features encoded for all input columns are concatenated into a flat context vector that is connected to the decoder network for end-to-end learning. The context vector is defined as:
| (1) |
where , , and are the latent feature encoded for numeric, categorical, and textual input columns, respectively.
The framework does not require training data to be a complete table. In the training set, missing values in numeric, categorical, and textual columns are replaced by the mean, the “missing” category, and an empty string, respectively. As opposed to removing rows with missing values from the training set, this promotes the generality of the framework at the potential expense of performance.
3.2 Decoder Model
The imputation of textual attributes is achieved by the transformer decoder part of TTITA, as shown in Figure 1. TTITA utilizes the context vector from encoding the input data to impute a textual column using the context vector as the key and value vectors. The dimension of the token embedding layer is identical to the size of the context vector. Instead of absolute positional encoding, we leverage rotary positional encoding (Su et al., 2024) to enhance the positional information of each token. We utilize RMSNorm (Zhang and Sennrich, 2019) for normalization and adopt such layers before the attention operations for better performance. The first attention mechanism draws connections to all parts of the input sequence, countering the issue of long-range dependency that recurrent neural networks have. The second multi-head attention block incorporates the context vector for cross-attention, with attention calculated as:
| (2) |
where , , and , are the query, context vector, and the size of the context vector. The Dropout and Add block applies a dropout layer and adds up the two inputs. Instead of the rectified linear unit, we select sigmoid linear unit (Hendrycks and Gimpel, 2016) as the gated activation function in the Feed Forward block which consists of two FC layers. The entire decoder layer from the first normalization to the last dropout layer and addition is repeated times before the final dropout layer and token classification.
Another advantage of transformers is the parallel computation that enables higher efficiency. During training, masking prevents foreseeing the subsequent tokens at each time step and during inference, the predicted token is concatenated with the input token(s) in an iterative fashion until the tag is predicted or when the maximum length is reached, to obtain the imputed sequence.
3.3 Multi-task Learning
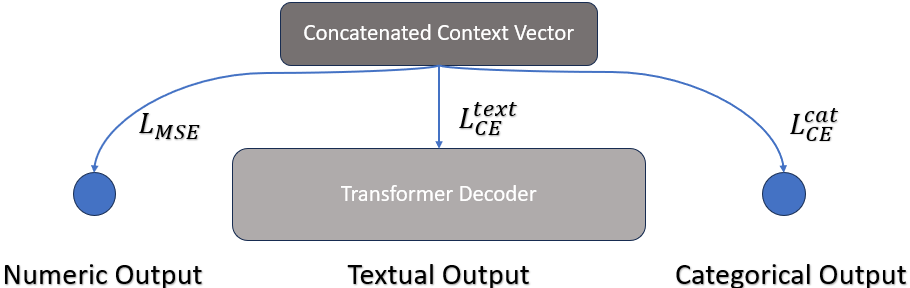
To further enhance the imputation of textual attributes, we leverage multi-task learning (Caruana, 1997) to simultaneously impute other columns in the table. These tabular columns can be numeric, categorical, or textual, in the same manner as the input columns. Multi-task learning has shown great success in computer vision (Yim et al., 2015) and natural language processing (Luong et al., 2015) by learning the representation suitable for multiple related tasks. Here, we jointly train to impute multiple columns, making an effort to enhance the context vector that provides the context for our primary goal of textual imputation. This not only enables the imputation of multiple columns at once, but also refines the context vector, providing a more comprehensive context for text imputation. We focus on the performance of text imputation as numeric and categorical imputation has been widely studied. Figure 2 illustrates the multi-task learning framework; the context vector (from the one in Figure 1) connects to different branches, one for each target column. For loss functions, we use mean squared error defined as:
| (3) |
where is the total number of instances, is the ground truth for the instance, and is the prediction for the instance for numerical target columns. For categorical columns, the loss function is the categorical cross-entropy defined as:
| (4) |
where and are the true and predicted probability for the instance to belong to the category, and is the total number of categories of the column. Similarly, textual columns follow the categorical cross-entropy loss defined as:
| (5) |
where and are the true and predicted probability for the token of the instance to belong to the token in the vocabulary, is the size of the vocabulary, is the total number of tokens for the instance, and is the total number of tokens across all instances. To simultaneously impute for a numeric, a categorical, and a textual column, we minimize the total loss defined as:
| (6) |
with the individual losses defined in Equations (3-5).
Though we visualize the framework to impute one column of each type and conduct experiments in the same way, this setup can be easily adjusted to impute any combination of numeric, categorical, and textual columns. Moreover, this enables the imputation of multiple columns at once and increases TTITA’s usability. As we replace the missing values in the input columns with default values and do not require training data to be a complete table, we lower the requirements to utilize TTITA in custom applications.
4 Experiments
4.1 Datasets
We used two datasets from Amazon Reviews (Ni et al., 2019) and one dataset on car reviews222https://huggingface.co/datasets/florentgbelidji/car-reviews. The two Amazon datasets are the software and the gift cards categories, separately, with the metadata. The software category has 459,050 rows and the gift cards category has 147,190 rows. We used the review rating, verified status, reviewer identifier, item feature, and review text to impute the review summary. Review rating is an integer on a scale of 1 to 5, verified status is binary, reviewer identifier is multi-categorical, and review text is unstructured text. Although the reviewer identifier has no missing data, the one-hot encoding representation is highly sparse, with 374,877 and 128,873 different reviewers. Since item feature in the raw data is represented in the form of a list of sequences, we concatenate each list of sequences into a single sequence. In multi-task learning, we additionally select to impute the Unix review time (numeric column) and the review’s main category (categorical column).
The car reviews dataset contains 36,984 rows and we impute the review title column with the rating (numeric), vehicle title (categorical), and review (text) columns. In multi-task learning, we additionally impute for the day of month of the review (numeric) and the reviewer name (categorical). The missing value percentages for each column and all datasets are listed in Table 1. For pre-processing, numeric columns are standardized, and categorical columns are one-hot encoded.
| Rating | Vehicle Title | Review | Review Title |
|---|---|---|---|
| 0 | 0 | 0.73% | 0.01% |
| Rating | Verified | ID | Review | Feature | Summary |
|---|---|---|---|---|---|
| 0 | 0 | 0 | 0.11% | 39.85% | 0.03% |
| Rating | Verified | ID | Review | Feature | Summary |
|---|---|---|---|---|---|
| 0 | 0 | 0 | 0.01% | 10.29% | 0.01% |
4.2 Settings
For each dataset, the standard training-validation-testing split is 81%-9%-10%, and we select the set of model weights with the lowest validation loss across 10 epochs. We adopt the “basic english” tokenizer from PyTorch and cap vocabulary size at 20,000 (Nation and Waring, 1997) for efficiency despite that any size is feasible. We use the Adam optimizer (Kingma and Ba, 2017) with an initial learning rate of 0.0004 and a batch size of 128 on a single NVIDIA V100 GPU. The decoder layer is repeated 6 times and the number of heads in the attention blocks is 4 should it be a divisor of the size of the context vector, or lower otherwise. The first FC layer in the feed forward block has an output dimension of 1024, and the dropout layers have a dropout rate of 0.1.
| Mode | KNN | LSTM | GRU | Decoder | Mistral | Llama2 | TTITA | TTITA-MTL | |
|---|---|---|---|---|---|---|---|---|---|
| METEOR | 0.0478 | 0.0318 | 0.0523 | 0.0507 | 0.0478 | 0.0904 | 0.0767 | 0.0590 | 0.0512 |
| ROUGE | 0.0969 | 0.0535 | 0.1018 | 0.1012 | 0.0969 | 0.0734 | 0.0768 | 0.1129 | 0.1008 |
| BLEU | 0.0579 | 0.0361 | 0.0627 | 0.0626 | 0.0579 | 0.0425 | 0.0606 | 0.0713 | 0.0617 |
| Mode | KNN | LSTM | GRU | Decoder | Mistral | Llama2 | TTITA | TTITA-MTL | |
|---|---|---|---|---|---|---|---|---|---|
| METEOR | 0.3613 | 0.2778 | 0.4155 | 0.4119 | 0.3613 | 0.1138 | 0.0552 | 0.4216 | 0.4255 |
| ROUGE | 0.3914 | 0.3142 | 0.4590 | 0.4639 | 0.3914 | 0.0423 | 0.0809 | 0.4769 | 0.4729 |
| BLEU | 0.3913 | 0.3020 | 0.4399 | 0.4416 | 0.3913 | 0.0249 | 0.0573 | 0.4517 | 0.4531 |
| Mode | KNN | LSTM | GRU | Decoder | Mistral | Llama2 | TTITA | TTITA-MTL | |
|---|---|---|---|---|---|---|---|---|---|
| METEOR | 0.1237 | 0.1388 | 0.1923 | 0.1953 | 0.1237 | 0.1056 | 0.0308 | 0.2080 | 0.2125 |
| ROUGE | 0.1328 | 0.1600 | 0.2257 | 0.2256 | 0.1328 | 0.0449 | 0.0551 | 0.2456 | 0.2474 |
| BLEU | 0.1323 | 0.1544 | 0.2071 | 0.2084 | 0.1323 | 0.0281 | 0.0403 | 0.2217 | 0.2255 |
| Car Dataset | Gift Cards Dataset | Software Dataset | |||||||
|---|---|---|---|---|---|---|---|---|---|
| LSTM | GRU | TTITA | LSTM | GRU | TTITA | LSTM | GRU | TTITA | |
| METEOR | 0.0085 | 0.0155 | 0.1175 | 0.0894 | 0.0814 | 0.1231 | 0.0301 | 0.0377 | 0.1029 |
| ROUGE | 0.0125 | 0.0289 | 0.1048 | 0.1433 | 0.1319 | 0.1781 | 0.0594 | 0.0675 | 0.1547 |
| BLEU | 0.0057 | 0.0099 | 0.0933 | 0.0855 | 0.0725 | 0.1265 | 0.0155 | 0.0184 | 0.0924 |
4.3 Baseline Models
Mode: We select the target sequence from the training set with the highest frequency to be the imputed text for all test instances. K Nearest Neighbor (KNN): We one-hot encode categorical columns, featurize textual columns with the hashing vectorizer, and keep numeric columns as is. The features are normalized and concatenated to represent each data sample. At inference for a test sample, we select the target sequence of the training instance that is closest to the test sample (K=1) in Euclidean distance. No training is required. LSTM (Hochreiter and Schmidhuber, 1997): The initial hidden state and cell state are initialized with the context vector and the token embedding layer has the same size. GRU (Chung et al., 2014): The initial hidden state is initialized with the context vector and the token embedding layer has the same size. Decoder: We train a transformer decoder on the target column without having other columns as input, leaving out the context vector. This examines the significance of the context vector and verifies if the target textual column is self-sufficient for imputation. The decoder follows the same hyperparameter setup as TTITA. LLMs: We inquire the llama2-7b-chat model (Llama2) (Touvron et al., 2023) and the Mistral-7B-Instruct-v0.2 model (Mistral) (Jiang et al., 2023) with the following prompt: Give me the [target column name] for a [dataset name] with the following values: A [column 1 name] of [column 1 value], a [column 2 name] of [column 2 value], …, and a [last column name] of [last column value]. Please output the [target column name] and nothing else.
4.4 Evaluation Metrics
To evaluate and compare the performance of the models above, we utilize the following evaluation metrics on the ground truth , and the imputed sequence .
METEOR (Banerjee and Lavie, 2005): We calculate the average METEOR score between all and pairs, which applies unigram matching and balances between precision and recall. Additionally, the metric takes into account how well the terms are ordered between the pair. ROUGE (Lin, 2004): We calculate the average unigram ROUGE F1 score between each and pair to quantify the level of overlapping between the target and imputed sequences. Precision captures the portion of correct tokens in while recall captures that in . The F1-score as a whole marks how well the tokens overlap between the two sequences. BLEU (Papineni et al., 2002): We calculate the average unigram BLEU score between all and pairs to quantify the percentage of matching tokens but with the brevity penalty, which penalizes when is shorter than .
5 Results and Analysis
5.1 Performance
We present the main evaluation results of all models in Table 2. TTITA outperformed all baseline models on three datasets in every metric except the METEOR score on the car reviews dataset. With multi-task learning, TTITA-MTL achieved a slight improvement in METEOR (+0.39%) and BLEU (+0.14%) scores on the gift cards dataset and similar improvement in METEOR (+0.45%), ROUGE (+0.18%), and BLEU (+0.38%) scores on the software dataset. A high score from mode imputation suggests that there is little variation among the target sequences in the gift cards dataset. Yet, TTITA is able to capture and impute the remaining diversity, demonstrating TTITA’s superior capability than mode imputation and other competitive baseline models including the LSTM and GRU. With the two top-performing models, we conduct another experiment when the imputed column has a longer sequence length, and the results are shown in Table 3. We observe that TTITA’s improvement is more evident (48% compared to 12%) when the imputed column has a longer sequence length, which corresponds to the advantages of the attention mechanism in the transformer. As another baseline model, a transformer decoder is trained on the target column without other input columns and TTITA’s better performance validates our use of the context vector.
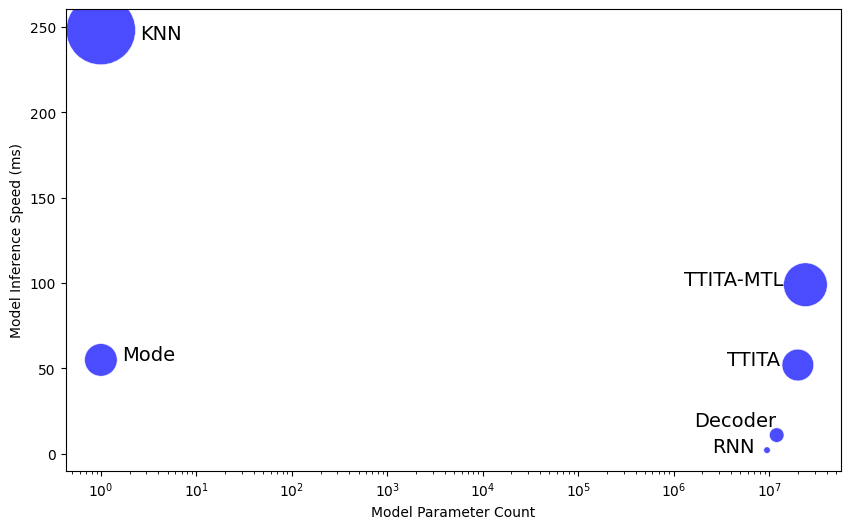
Figure 3 visualizes the comparison between model parameter count and inference speed for all models, except Mistral and Llama2 having 7 billion parameters with 24 seconds of inference time. We observe that multi-task learning doubles the inference time while TTITA is comparable to mode imputation and faster than KNN. With quadratic time complexity in the attention mechanism and the additional context vector, TTITA performs slower than LSTM and GRU, and the decoder, respectively. Nonetheless, with an average inference time of 0.05 seconds, TTITA outperformed LSTM and GRU in evaluation metrics (Table 2), and by a larger margin when the imputed column has a longer sequence length (Table 3). Additionally, we analyzed the importance of each column in Table 4. On the car reviews dataset, the review text has more importance than the rating which is equally important as the vehicle title.
5.2 Comparison to LLMs
Given the recent advances in language models and their ability in zero-shot learning, we investigate and observe that TTITA outperforms Mistral and Llama2-7b in most scenarios. Without being trained or fine-tuned on domain data, Llama2 generally suffers to impute the correct tokens. Some reviews have a long description of the product features in the Amazon datasets, and the lengthy prompt often confuses Llama2 into generating blanks. In some scenarios, the model attempts to summarize all the input columns instead of imputing the summary column. Nonetheless, when the dataset is not large enough for TTITA and multi-task learning to generalize well, LLMs can have a better performance, as we observe on the METEOR score of the car reviews dataset.
Additionally, we conduct a similar analysis on ChatGPT. With the same prompt as Llama2 and Mistral, we observe similar results: the output length is much longer than the true summary, and the generated text also included other known attributes which are unnecessary in tabular data and require further post-processing in an application setting. This aligns with the observation in (Li et al., 2023) that language models are sub-optimal with tabular tasks. The repetitiveness also shows that ChatGPT is summarizing the input columns altogether, treating it as a summarization task, but our proposed method can impute columns of any relationship. In fact, we include a few other categorical and numerical input columns to show that this concept is scalable to numerous input columns of different types. Furthermore, the review text is encoded by an untrainable featurizer, which provides much less information on its summary as opposed to sequence-to-sequence prediction. This shows that we are not optimizing the performance by treating it as a summarization task, but rather using the dataset to demonstrate TTITA’s performance. On the other hand, without being fine-tuned specifically, ChatGPT is unfamiliar with the summary text length in this dataset. Though length difference seems trivial, this can extend to other dataset-specific features that have meaningful implications in downstream tasks, such as the use of keywords suggesting a certain degree of familiarity of the subject. It is difficult for ChatGPT to impute the similar “type” of text even with prompt engineering. One can certainly provide further details on the dataset or examples for in-context learning (Dong et al., 2023), but that involves a certain degree of human intervention/intelligence, and our focus is on developing a convenient framework for text imputation that requires no extra human effort. Additionally, there exists a limit on application programming interface calls which prevents systematic usage. Though TTITA does not contain open-world knowledge and requires training, it can impute unstructured textual columns of any relationship to the input columns and generate a “similar” text with an inference time of 0.05 seconds, making it a promising candidate for realistic applications.
| No Rating | No Vehicle Title | No Review | |
|---|---|---|---|
| METEOR | 0.0536 | 0.0566 | 0.0492 |
| ROUGE | 0.1056 | 0.1031 | 0.0996 |
| BLEU | 0.0642 | 0.0654 | 0.0601 |
| Other Columns | Review Text | Summary | Prediction |
|---|---|---|---|
| Software: 1, False, A3H5P8RBJKPCAC, NaN | I bought this Blu Ray thinking that it would be a good movie to watch in HD…Will Farrell comedy with dinosaurs…This has absolutely got to be the worst movie I have seen in the last 10 years or so. It lacked humor, a plot and anything remotely appealing. I was so disappointed that Will Farrell stouped this low to make a movie that was this bad. I am going to be taking it to Movie Stop and trading it in…that is if they will even buy it. | I’d give it a zero if I could | I am very disappointed… |
| Gift Card: 5, True, AR5ZTWU7JOQXL, NaN | This was a fast easy gift for a friend who has everything. She loved it! I will use these gift cards for birthdays in the future! | Great Gift! | great gift |
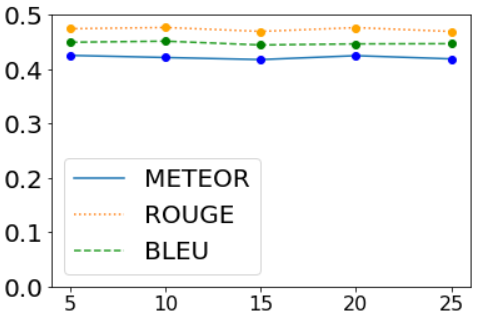
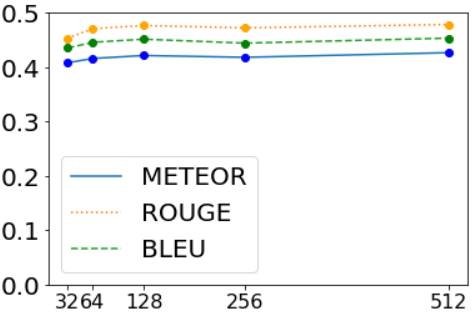
5.3 Hyperparameter Analysis
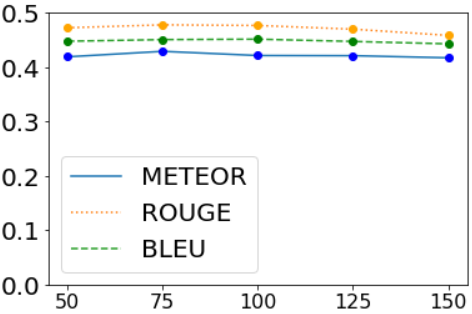
Using the gift cards dataset, we investigate in the change of model performance caused by different embedding sizes of the input columns in TTITA, as shown in Figure 4. Within a selection of [50, 75, 100, 125, 150] neurons in the FC layer for numeric input columns, the size of 100 has the best performance. Between [5, 10, 15, 20, 25] for the embedding size of categorical input columns, the size of 10 performs the best. As for the output size of the hashing vectorizer, we choose from the values of [32, 64, 128, 256, 512] and a size of 128 has one of the better performances. These hyperparameter values can be easily adjusted for the data complexity of input columns, which makes TTITA suitable for custom applications.
5.4 Qualitative Analysis
This section dives into two text sequences imputed by TTITA, as shown in Table 5. Shorter columns, including the dataset the review was from, its rating, verified status, reviewer identifier, and item features, are combined into Other Columns for better presentation of the table. The first example, from the software dataset, has low evaluation scores as the tokens do not overlap between the true and imputed sequences. However, the prediction summarizes the review well semantically. I’d give it a zero suggests that it was below expectation when the lowest rating possible is one and that the reviewer is disappointed; the word matches the strong sentiment. The second example, from the gift cards dataset, has an accurately imputed summary of great gift, except the exclamation mark. Through these examples, we observed the capability of TTITA to accurately impute textual columns both token-wise and meaning-wise.
6 Conclusion
We introduced a novel approach (TTITA) to impute unstructured textual columns given other heterogeneous tabular columns using transformers. Supported by our experiment, the use of a context vector informatively benefited the decoder in end-to-end learning. TTITA achieved better performance than recurrent neural networks and by a larger margin when the imputed column has a longer sequence length. Extensive experimented also showed superior performance over large language models such as Mistral and Llama2 and common imputation methods such as KNN and mode imputation. Additionally, we leveraged multi-task learning to enable the simultaneous imputation of multiple heterogeneous columns and improved the performance on the target textual column. A comparison against ChatGPT on this task found TTITA to be more appropriate due to the advantage of training on domain data. Designed for minimal data pre-processing and human intervention, high generality and low inference times make TTITA a good candidate for realistic applications. Future work includes multi-domain adaptation to impute tabular datasets with a distribution shift, cross-lingual imputation involving multiple languages, bias removal on the imputed text, and exploration of fine-tuning LLMs for tabular data.
References
- Ahmad et al. (2023) Mohammad Shahmeer Ahmad, Zan Ahmad Naeem, Mohamed Eltabakh, Mourad Ouzzani, and Nan Tang. 2023. Retclean: Retrieval-based data cleaning using foundation models and data lakes.
- Alabadla et al. (2022) Mustafa Alabadla, Fatimah Sidi, Iskandar Ishak, Hamidah Ibrahim, Lilly Suriani Affendey, Zafienas Che Ani, Marzanah A Jabar, Umar Ali Bukar, Navin Kumar Devaraj, Ahmad Sobri Muda, et al. 2022. Systematic review of using machine learning in imputing missing values. IEEE Access.
- Banerjee and Lavie (2005) Satanjeev Banerjee and Alon Lavie. 2005. Meteor: An automatic metric for mt evaluation with improved correlation with human judgments. In Proceedings of the acl workshop on intrinsic and extrinsic evaluation measures for machine translation and/or summarization, pages 65–72.
- Batra et al. (2022) Shivani Batra, Rohan Khurana, Mohammad Zubair Khan, Wadii Boulila, Anis Koubaa, and Prakash Srivastava. 2022. A pragmatic ensemble strategy for missing values imputation in health records. Entropy, 24(4):533.
- Biessmann et al. (2019) Felix Biessmann, Tammo Rukat, Philipp Schmidt, Prathik Naidu, Sebastian Schelter, Andrey Taptunov, Dustin Lange, and David Salinas. 2019. Datawig: Missing value imputation for tables. J. Mach. Learn. Res., 20(175):1–6.
- Biessmann et al. (2018) Felix Biessmann, David Salinas, Sebastian Schelter, Philipp Schmidt, and Dustin Lange. 2018. " deep" learning for missing value imputation in tables with non-numerical data. pages 2017–2025.
- Caruana (1997) Rich Caruana. 1997. Multitask learning. Machine learning, 28:41–75.
- Chung et al. (2014) Junyoung Chung, Caglar Gulcehre, KyungHyun Cho, and Yoshua Bengio. 2014. Empirical evaluation of gated recurrent neural networks on sequence modeling. arXiv preprint arXiv:1412.3555.
- Dong et al. (2023) Qingxiu Dong, Lei Li, Damai Dai, Ce Zheng, Zhiyong Wu, Baobao Chang, Xu Sun, Jingjing Xu, Lei Li, and Zhifang Sui. 2023. A survey on in-context learning.
- Gondara and Wang (2018) Lovedeep Gondara and Ke Wang. 2018. Mida: Multiple imputation using denoising autoencoders. In Advances in Knowledge Discovery and Data Mining: 22nd Pacific-Asia Conference, PAKDD 2018, Melbourne, VIC, Australia, June 3-6, 2018, Proceedings, Part III 22, pages 260–272. Springer.
- Hendrycks and Gimpel (2016) Dan Hendrycks and Kevin Gimpel. 2016. Gaussian error linear units (gelus). arXiv preprint arXiv:1606.08415.
- Hochreiter and Schmidhuber (1997) Sepp Hochreiter and Jürgen Schmidhuber. 1997. Long short-term memory. Neural computation, 9(8):1735–1780.
- Jäger et al. (2021) Sebastian Jäger, Arndt Allhorn, and Felix Bießmann. 2021. A benchmark for data imputation methods. Frontiers in big Data, 4:693674.
- Jiang et al. (2023) Albert Q Jiang, Alexandre Sablayrolles, Arthur Mensch, Chris Bamford, Devendra Singh Chaplot, Diego de las Casas, Florian Bressand, Gianna Lengyel, Guillaume Lample, Lucile Saulnier, et al. 2023. Mistral 7b. arXiv preprint arXiv:2310.06825.
- Jolicoeur-Martineau et al. (2024) Alexia Jolicoeur-Martineau, Kilian Fatras, and Tal Kachman. 2024. Generating and imputing tabular data via diffusion and flow-based gradient-boosted trees. In International Conference on Artificial Intelligence and Statistics, pages 1288–1296. PMLR.
- Khan and Hoque (2020) Shahidul Islam Khan and Abu Sayed Md Latiful Hoque. 2020. Sice: an improved missing data imputation technique. Journal of big Data, 7(1):1–21.
- Kingma and Ba (2017) Diederik P. Kingma and Jimmy Ba. 2017. Adam: A method for stochastic optimization.
- Kotelnikov et al. (2023) Akim Kotelnikov, Dmitry Baranchuk, Ivan Rubachev, and Artem Babenko. 2023. Tabddpm: Modelling tabular data with diffusion models. In International Conference on Machine Learning, pages 17564–17579. PMLR.
- Li et al. (2021) Junying Li, Weijie Ren, and Min Han. 2021. Variational auto-encoders based on the shift correction for imputation of specific missing in multivariate time series. Measurement, 186:110055.
- Li et al. (2023) Peng Li, Yeye He, Dror Yashar, Weiwei Cui, Song Ge, Haidong Zhang, Danielle Rifinski Fainman, Dongmei Zhang, and Surajit Chaudhuri. 2023. Table-gpt: Table-tuned gpt for diverse table tasks. arXiv preprint arXiv:2310.09263.
- Lin (2004) Chin-Yew Lin. 2004. Rouge: A package for automatic evaluation of summaries. In Text summarization branches out, pages 74–81.
- Luong et al. (2015) Minh-Thang Luong, Quoc V Le, Ilya Sutskever, Oriol Vinyals, and Lukasz Kaiser. 2015. Multi-task sequence to sequence learning. arXiv preprint arXiv:1511.06114.
- Mattei and Frellsen (2019) Pierre-Alexandre Mattei and Jes Frellsen. 2019. Miwae: Deep generative modelling and imputation of incomplete data sets. In International conference on machine learning, pages 4413–4423. PMLR.
- Mei et al. (2021) Yinan Mei, Shaoxu Song, Chenguang Fang, Haifeng Yang, Jingyun Fang, and Jiang Long. 2021. Capturing semantics for imputation with pre-trained language models. In 2021 IEEE 37th International Conference on Data Engineering (ICDE), pages 61–72. IEEE.
- Mostafa (2019) Samih M Mostafa. 2019. Imputing missing values using cumulative linear regression. CAAI Transactions on Intelligence Technology, 4(3):182–200.
- Narayan et al. (2022) Avanika Narayan, Ines Chami, Laurel Orr, Simran Arora, and Christopher Ré. 2022. Can foundation models wrangle your data?
- Nation and Waring (1997) Paul Nation and Robert Waring. 1997. Vocabulary size, text coverage and word lists. Vocabulary: Description, acquisition and pedagogy, 14(1):6–19.
- Ni et al. (2019) Jianmo Ni, Jiacheng Li, and Julian McAuley. 2019. Justifying recommendations using distantly-labeled reviews and fine-grained aspects. In Proceedings of the 2019 conference on empirical methods in natural language processing and the 9th international joint conference on natural language processing (EMNLP-IJCNLP), pages 188–197.
- Papineni et al. (2002) Kishore Papineni, Salim Roukos, Todd Ward, and Wei-Jing Zhu. 2002. Bleu: a method for automatic evaluation of machine translation. In Proceedings of the 40th annual meeting of the Association for Computational Linguistics, pages 311–318.
- Paterakis et al. (2024) George Paterakis, Stefanos Fafalios, Paulos Charonyktakis, Vassilis Christophides, and Ioannis Tsamardinos. 2024. Do we really need imputation in automl predictive modeling? ACM Transactions on Knowledge Discovery from Data.
- Pratama et al. (2016) Irfan Pratama, Adhistya Erna Permanasari, Igi Ardiyanto, and Rini Indrayani. 2016. A review of missing values handling methods on time-series data. In 2016 international conference on information technology systems and innovation (ICITSI), pages 1–6. IEEE.
- Schelter et al. (2021) Sebastian Schelter, Tammo Rukat, and Felix Biessmann. 2021. Jenga: A framework to study the impact of data errors on the predictions of machine learning models. In EDBT 2021 Industrial and Application Track.
- Su et al. (2024) Jianlin Su, Murtadha Ahmed, Yu Lu, Shengfeng Pan, Wen Bo, and Yunfeng Liu. 2024. Roformer: Enhanced transformer with rotary position embedding. Neurocomputing, 568:127063.
- Tang et al. (2021) Nan Tang, Ju Fan, Fangyi Li, Jianhong Tu, Xiaoyong Du, Guoliang Li, Sam Madden, and Mourad Ouzzani. 2021. Rpt: Relational pre-trained transformer is almost all you need towards democratizing data preparation.
- Touvron et al. (2023) Hugo Touvron, Louis Martin, Kevin Stone, Peter Albert, Amjad Almahairi, Yasmine Babaei, Nikolay Bashlykov, Soumya Batra, Prajjwal Bhargava, Shruti Bhosale, et al. 2023. Llama 2: Open foundation and fine-tuned chat models. arXiv preprint arXiv:2307.09288.
- Vaswani et al. (2017) Ashish Vaswani, Noam Shazeer, Niki Parmar, Jakob Uszkoreit, Llion Jones, Aidan N. Gomez, Lukasz Kaiser, and Illia Polosukhin. 2017. Attention is all you need.
- Villaizán-Vallelado et al. (2024) Mario Villaizán-Vallelado, Matteo Salvatori, Carlos Segura, and Ioannis Arapakis. 2024. Diffusion models for tabular data imputation and synthetic data generation. arXiv preprint arXiv:2407.02549.
- Wen et al. (2024) Yizhu Wen, Kai Yi, Jing Ke, and Yiqing Shen. 2024. Diffimpute: Tabular data imputation with denoising diffusion probabilistic model. arXiv preprint arXiv:2403.13863.
- Wu et al. (2023) Yangyang Wu, Jun Wang, Xiaoye Miao, Wenjia Wang, and Jianwei Yin. 2023. Differentiable and scalable generative adversarial models for data imputation. IEEE Transactions on Knowledge and Data Engineering.
- Yim et al. (2015) Junho Yim, Heechul Jung, ByungIn Yoo, Changkyu Choi, Dusik Park, and Junmo Kim. 2015. Rotating your face using multi-task deep neural network. In Proceedings of the IEEE conference on computer vision and pattern recognition, pages 676–684.
- Yoon et al. (2018) Jinsung Yoon, James Jordon, and Mihaela Schaar. 2018. Gain: Missing data imputation using generative adversarial nets. In International conference on machine learning, pages 5689–5698. PMLR.
- Zhang and Sennrich (2019) Biao Zhang and Rico Sennrich. 2019. Root mean square layer normalization. Advances in Neural Information Processing Systems, 32.
- Zheng and Charoenphakdee (2022) Shuhan Zheng and Nontawat Charoenphakdee. 2022. Diffusion models for missing value imputation in tabular data. arXiv preprint arXiv:2210.17128.