The Commensal Real-time ASKAP Fast Transient incoherent-sum survey
Abstract
With wide-field phased array feed technology, the Australian Square Kilometre Array Pathfinder (ASKAP) is ideally suited to search for seemingly rare radio transient sources. The Commensal Real-time ASKAP Fast Transient (CRAFT) Survey Science Project has developed instrumentation to continuously search for fast radio transients (duration 1 second) with ASKAP, with a particular focus on finding and localising Fast Radio Bursts (FRBs). Of particular interest are Fast Radio Bursts (FRBs). Since 2018, the CRAFT survey has been searching for FRBs and other fast transients by incoherently adding the intensities received by individual ASKAP antennas, and then correcting for the impact of frequency dispersion on these short-duration signals in the resultant incoherent sum (ICS) in real-time. This low-latency detection enables the triggering of voltage buffers, which facilitates the localisation of the transient source and the study spectro-polarimetric properties at high time resolution. Here we report the sample of FRBs discovered in this CRAFT/ICS survey to date. This includes FRBs that had not previously been reported: FRBs localised by ASKAP to arcsec and FRBs localised to arcmin. Of the new arcsecond-localised FRBs, we have identified and characterised host galaxies (and measured redshifts) for . The median of all measured host redshifts from the survey to date is . We summarise results from the searches, in particular those contributing to our understanding of the burst progenitors and emission mechanisms, and on the use of bursts as probes of intervening media. We conclude by foreshadowing future FRB surveys with ASKAP using a coherent detection system that is currently being commissioned. This will increase the burst detection rate by a factor of approximately ten and also distance to which ASKAP can localise FRBs.
doi:
XXXXXkeywords:
galaxies: distances and redshifts, stars: general, radio transient sourceR. M. Shannon]rshannon@swin.edu.au \alsoaffiliationSydney Institute for Astronomy, School of Physics, The University of Sydney, Camperdown, NSW 2006, Australia \alsoaffiliationJoint institute for VLBI ERIC, Oude Hoogeveensedijk 4, 7991 PD Dwingeloo, The Netherlands \alsoaffiliationAnton Pannekoek Institute for Astronomy, University of Amsterdam, Science Park 904, 1098 XH, Amsterdam, The Netherlands \alsoaffiliationAustralia Telescope National Facility, CSIRO Space & Astronomy, Box 76 Epping, NSW 1710, Australia \alsoaffiliationThe ARC Centre of Excellence for Gravitational-Wave Discovery (OzGrav) \alsoaffiliationInternational Centre for Radio Astronomy Research (ICRAR), Curtin University, Bentley, WA 6102, Australia \alsoaffiliationAstrophysics and Space Technologies Research Centre, Macquarie University, Sydney, NSW 2109, Australia \alsoaffiliationAustralia Telescope National Facility, CSIRO Space & Astronomy, Box 76 Epping, NSW 1710, Australia \alsoaffiliationThe ARC Centre of Excellence for All-Sky Astrophysics in 3 Dimensions (ASTRO 3D) \alsoaffiliation Kavli Institute for the Physics and Mathematics of the Universe (Kavli IPMU), 5-1-5 Kashiwanoha, Kashiwa, 277-8583, Japan \alsoaffiliationDivision of Science, National Astronomical Observatory of Japan, 2-21-1 Osawa, Mitaka, Tokyo 181-8588, Japan \alsoaffiliationAstrophysics and Space Technologies Research Centre, Macquarie University, Sydney, NSW 2109, Australia \alsoaffiliationAustralia Telescope National Facility, CSIRO Space & Astronomy, Box 76 Epping, NSW 1710, Australia \publisheddd Mmm YYYY
1 INTRODUCTION
Fast radio bursts (FRBs) are millisecond duration bursts of radio emission of extragalactic origin that have emerged as crucial tools for understanding fundamental physics. The study of FRBs earnestly commenced with the discovery of the fast radio burst FRB 20010724A (the Lorimer Burst, 2007Sci...318..777L) in archival Murriyang (the 64-m Parkes telescope) observations recorded with the 20-cm multibeam system 1996PASA...13..243S. The burst was exceptionally bright and had a dispersion measure (DM) well in excess of what could be accounted for by the Milky Way Galaxy ionised gas content along a high Galactic latitude line of sight. Due to the tenuousness of the intergalactic medium, the excess dispersion implied that the burst could have arisen at distances far greater than their closest analogues, pulsars 2007Sci...318..777L. After the discovery of the Lorimer Burst, progress in understanding the nature of the FRBs was slow for two reasons. Firstly, the systems capable of detecting bursts (pulsar-search systems) used single-dish telescopes, so localisations were poor. Secondly, the detection rate was low. It was only when further examples were discovered in the Murriyang High Time Resolution Universe Survey 2013Sci...341...53T that evidence tipped in favour of the bursts being astrophysical 111Other signals with similar spectro-temporal structure were discovered in Murriyang data 2011ApJ...727...18B that were subsequently identified to be radio-frequency interference produced by an observatory microwave oven 2015MNRAS.451.3933P.. The poor localisations meant it was not possible to associate an FRB to any particular source (a star, galaxy, or other object) resulting in intense debate on the cause and distance scale to fast radio bursts. FRBs continued to be discovered by Murriyang and other telescopes. However, rare and bright FRBs were shown not to be as rare with the discovery of the FRB 20150807A, which had a similar brightness to the Lorimer burst 2016Sci...354.1249R. The discovery of a second bright FRB implied that 10% of the Murriyang FRBs found to that date would have been detectable by a single 12-m antenna222The discovery also spurred on the development of the Deep Synoptic Array 10 element array 2019Natur.572..352R.
The wider field of view of smaller antennas gave hope of a reasonable detection rate. One way the field of view of a radio telescope can be widened further is through the use of multi-element receivers. The Australian Square Kilometre Array Pathfinder 2021PASA...38....9H, a 36-antenna interferometer with 12-m antennas and phased array feed (PAF) receivers capable of observing a field, is one such instrument. With a field of view a factor of greater than the Parkes multibeam system, it was realised that ASKAP would be able to detect FRBs at a rate competitive with other existing and planned facilities. When used as an interferometer, it would be capable of localising FRBs and start answering many of the confounding questions that existed about them at the time, such as the distance scale to their progenitors and their utility as a probe of the intergalactic medium 2016arXiv160505890C.
The first FRB detection systems were commissioned in 2016 by the Commensal Real-time ASKAP Fast Transient (CRAFT) Collaboration. Initial searches in 2017 and 2018 were conducted in a fly’s eye mode, pointing a sub-array typically comprising ASKAP antennas, with each in individual directions. This enabled shallow but wide field of view searches. This was also the first natural technical development towards localising FRBs. The searches were successful with the first burst found within days of observing with 8 antennas333The majority of fly’s eye searches were conducted on a separate commissioning subarray of antennas equipped with digital backend subsystems before the ASKAP hardware correlator was capable of ingesting and processing data from all antennas. 2017ApJ...841L..12B. Over the course of the next year we continued this strategy, focusing on a set of high Galactic latitude ( fields discovering FRBs 2018Natur.562..386S. This represented the first well-controlled sample of FRBs 2019PASA...36....9J, with the dense sampling of the ASKAP beams allowing for a good localisation of the bursts within the beam pattern, and a reliable estimate of burst fluence. Further all-sky 2019MNRAS.486...70B, Galactic plane 2019MNRAS.486..166Q, and Galactic latitude 2019ApJ...872L..19M searches also detected FRBs.
At the conclusion of these searches, we upgraded the ASKAP FRB search systems to enable the interferometric localisation of FRB detections. The searches operate on the incoherent sum (ICS) of intensities from all beams of all antennas (with the antennas now pointing in the same direction). Localisation is achieved by conducting low latency (sub-second) searches, which enable the triggered download of -s voltage buffers, which can be correlated, calibrated, imaged, and beamformed to localise an FRB and study its spectropolarimetric properties.
Here we summarise the results of this CRAFT/ICS survey and describe the bursts detected. The host galaxies for many of the FRBs discovered are displayed in Figures 1, 2, and 3. In Section 2, we describe the instrumentation and methods used to undertake the searches. We motivate and describe the observing strategies we undertook to find the FRB sample in Section 3 and our multi-wavelength follow up in Section 4. In Section 5, we present the fast radio bursts sample, being 43 FRBs, of which 37 have measured positions with precisions , of which 30 host galaxies have been identified. We assess survey performance in Section 6, and in Section 7 we provide a review of the main scientific findings and outcomes of the searches. In Section 8, we briefly describe the plan for new FRB search systems for ASKAP.
 |
 |
 |
 |
 |
 |
 |
 |
|
 |
 |
 |
 |
 |
 |
 |
 |
 |
 |
 |
 |
 |
 |
 |
 |
 |
 |
 |
 |
 |
 |
2 SEARCH AND LOCALISATION SYSTEMS AND METHODS
2.1 Hardware
ASKAP is located at Inyarrimanha Ilgari Bundara, the CSIRO Murchison Radio-astronomy Observatory (MRO), a site selected for having low levels of radio-frequency interference (RFI). The array comprises 36 12-m antennas. The maximum baseline length of the antennas is 6 km. Each antenna is equipped with a phased array receiving system (PAF; iet:/content/conferences/10.1049/ic.2007.0899), enabling multiple quasi-independent beams to be digitally formed on the sky. This increases the field of view of the telescope by a factor of approximately 30 over an equivalent single-element system.
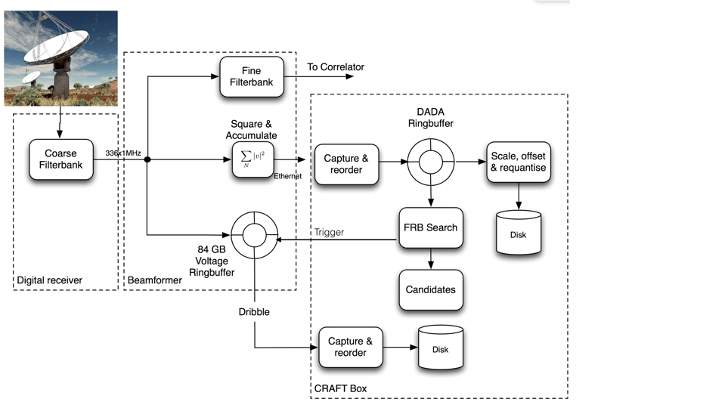
In this section, we briefly summarise aspects of the ASKAP hardware and signal path relevant to the searches described here. 2021PASA...38....9H describe the general ASKAP hardware and standard ASKAP imaging system in more detail. A schematic diagram describing the FRB search and localisation systems is found in Figure 4.
Each PAF receiver comprises dipole elements arranged in a chequerboard pattern. The signal from each dipole element is transmitted from the PAF to the MRO control building via radio frequency over fibre systems 8168641. Observing is undertaken in one of three bands (bands 1,2, and 3, with 1 being the lowest and 3 the highest). Within each band, it is possible to tune the observing frequencies best suited to the science goals. The signal from each element is then digitised and channelised in a digital receiver 6903860. The signals are channelised using an oversampled polyphase filter into coarse MHz channels by a factor of 32/27 6328788.
Digital beamformers then combine signals from the dipoles to form beams on the sky through appropriate weighting of each dipole element 1988IASSP...5....4V; 6930062. In typical survey observations, beams are produced in either square or hexagonal close pack arrangements. The separation between the beams is tailored to the goals of the observations, but varies between and , with beam separation largely guided by spacing of the frequency-dependent primary beam response, resulting in larger beam separation at lower frequencies. The beam weights are determined initially through observations of the Sun. While the weights are invalidated when certain changes to the observing system are made (e.g., changes between observing bands), they can be re-derived using an on-dish calibration solution 2021PASA...38....9H. Up until this point, the data products are common between FRB detection mode and standard ASKAP synthesis-imaging observations.
The beamformers produce two data products used by the CRAFT/ICS systems. The first is total power summed over both polarisations for each coarse channel, integrated over ms timescale, at MHz frequency resolution. These signals are broadcast over a network using unicast data protocol, and ingested by the CRAFT server where they are searched (as discussed in the next section). The second set of data products essential to the survey are voltages. Each beamformer contains random access memory that is configured in a series of ring buffers. For the searches presented here, a ring buffer is created for each beam for all of the antennas used in the searches. The voltages can currently be recorded with 1-bit, 4-bit, or 8-bit depth. For all data presented here, we have used 4-bit depth, which enables 3.1 s length voltage buffers. The relatively short buffer length necessitates a low-latency search pipeline (discussed in the next section). When the search pipeline detects a candidate FRB, the pipeline is stopped and the voltage buffers frozen. Voltages for both polarisations from the candidate beam for each antenna are then downloaded to the CRAFT server. Both data products provide a total of MHz of bandwidth, in contrast to the MHz bandwidth available from the standard ASKAP hardware correlator. Observations when the array operates in high-frequency resolution (zoom mode) observing are not compatible with the searches.
2.2 FRB Searches
The primary motivation for implementing the ICS search method is the relative ease of computation compared to array-coherent approaches. The searches require only 36 data streams, fewer than those required for the previous fly’s eye searches. Array-coherent approaches require either imaging a large number of pixels for each phased array beam, or forming a similarly large number of tied array beams. The CRAFT server ingests the integrated intensities from each polarisation for each beam. These are summed (after rescaling to ensure each stream had zero mean and the same variance) to create a pseudo total intensity, after synchronising data from each antenna beamformer to ensure temporal alignment.
Despite the MRO having low levels of nearby interference, RFI is present in the searches. The largest sources of interference are satellite interference from global navigation systems in band-2 observations and ionospheric ducting of mobile phone signals (base towers and handsets) in band 1. Data were also affected by interference associated with lightning and electrical storms (even when storms were more than km from the observatory). Real time radio frequency interference (RFI) flagging is conducted using a number of heuristics. Frequency channels with abnormally high kurtosis are set to zero, while remaining channels are normalised to a mean of zero and unit standard deviation. Impulsive RFI is removed by subtracting the frequency integrated signal at zero dispersion measure (DM). This is applied dynamically - additionally, a hard-coded list of known RFI channels is maintained, and these frequencies are zeroed for all observations.
Searches are conducted using the FREDDA code (a Fast Real-time Engine for De-Dispersing Amplitudes, 2019ascl.soft06003B; 2023MNRAS.523.5109Q), which is a graphical processing unit (GPU) implementation of a fast dispersion measure transform 2017ApJ...835...11Z. Searches for all beams can be conducted on a single GPU.
The searches produce a stream of raw candidates (time, signal-to-noise ratio, dispersion measure, width) which are broadcast over User Datagram Protocol. A burst (either RFI or a bona-fide FRB) produces candidates over a region of candidate parameter space. A density-based spatial clustering algorithm 10.5555/3001460.3001507 is used to group raw candidates. This is important as it allows RFI (which typically has the greatest S/N at low DM) to be distinguished from FRBs. To ensure that the real-time clustering algorithm was working properly, raw candidates were also inspected off-line after being clustered using a friends-of-friends algorithm 1982ApJ...257..423H. The search latency ranges from a few hundred milliseconds to a few seconds. The time resolution of searches varied over the course of the survey, between s and ms, as system performance was optimised. There is a trade-off between the number of antennas that can be ingested and the time resolution. For the majority of the searching, a time resolution of ms was chosen, which allowed the incoherent sum of intensities from 24 antennas to be formed.
2.3 Localisations
When a candidate FRB is detected, the voltage buffers are stopped and the beam-based buffers in which the burst is found are downloaded from the antenna beamformers to the CRAFT server. They are then transferred offsite for further processing. As the searches stop on the first clustered candidate above a fixed signal-to-noise (S/N) ratio this is not necessarily the in which the burst has the most significant detection. In rare cases (e.g., very bright bursts, or bursts equally spaced between multiple beams), the beam downloaded was not the beam in which the FRB had the maximum S/N ratio. Latency in the search pipeline and the short duration of the voltage buffers meant that for some FRBs the voltage buffer was of insufficient length to save the highest frequency emission. This is especially the case for the most dispersed FRBs, for which dispersed emission could extend over most of the voltage buffer. If a candidate is confirmed (through visual inspection of the search data stream), additional observations are conducted for calibration. This included an observation of a bright compact radio galaxy (PKS 1934638 or PKS 0407658) to calibrate the bandpass, and a pulsar (PSR J08344510, PSR J16444559, or PSR J20481616) as a polarisation reference. A detailed description of the calibration, localisation, and astrometric performance is presented in 2021PASA...38...50D. An end-to-end pipeline (CELEBI, The CRAFT Effortless Localisation and Enhanced Burst Inspection pipeline) processes voltage data, both to measure burst positions and produce high time resolution spectro-polarimetric data products (discussed in more detail in the next section). It is described in detail in 2023A&C....4400724S.
2.4 High time resolution spectropolarimetry
Access to the voltage data allows us to study in detail the spectro-temporal-polarimetric properties of the bursts. These studies provide insight into burst emission physics, as well as the effects of propagation through intervening ionised media, for example through the measurement of scatter broadening times and rotation measures. This was done through high time and frequency resolution imaging 2020MNRAS.497.3335D and through high time resolution beamforming 2020ApJ...891L..38C; 2023A&C....4400724S. The technique of high time resolution imaging 2020MNRAS.497.3335D did not provide the same time resolution possible through beamforming (s). It was a natural and (relatively) easily implemented extension of FRB burst localisation pipelines prior to the development of a tied array beamforming pipeline. As the upstream ASKAP digital system implements channelisation through oversampled filterbanks, it is possible to invert the MHz coarse channels of the voltage buffers to produce time series with temporal resolution as high as the Nyquist sampling rate of the digital receiving system ( ns). Using both methods, polarisation calibration was conducted by using a bright pulsar as a reference source to correct for polarisation leakage. Rotation measures can be inferred using a Bayesian methodology described in 2019Sci...365..565B.
3 SURVEY STRATEGIES
The CRAFT/ICS survey has been conducted throughout the final stages of ASKAP commissioning, the pilot surveys for the observatory-approved Survey Science Projects, and the early stages of full ASKAP survey science observations. The first searches were undertaken in one month of observing time in Aug-Sep 2018 allocated in the pursuit of the first FRB localisation with ASKAP. Efforts were largely focused on observing the high Galactic latitude () fields that were the main targets of the fly’s eye searches. These fields were chosen as they allowed constraints to be placed on burst repetition and demonstrate that detections were originating from apparently non-repeating FRBs. FRB searches benefited from not requiring data storage or processing at the Pawsey Centre, unlike other surveys. Thus FRB searches could be conducted when resources (storage or processing) at the Centre were limited.
In early searches (prior to 2020), ASKAP scheduling was not fully automated. Occasionally we would choose to observe southern circumpolar fields that could be observed at any local sidereal time, so that searches could be scheduled for many days without requiring intervention. In particular, considerable time was spent observing a field centred at R.A. and Dec. . This field was chosen because it has a relatively low Milky Way DM contribution ( pc cm-3 from the Milky Way disk; 2002astro.ph..7156C).
As ASKAP transitioned from scientific commissioning to a survey science instrument, FRB searches were more frequently run commensally with other projects. During the course of the ICS searches, these were largely pilot surveys for the main ASKAP Survey Science projects, and the observatory Rapid ASKAP Continuum Surveys (RACS, 2020PASA...37...48M).
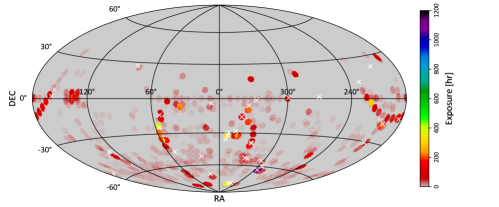
Figure 5 shows the exposure map for the survey, or the hr for which we have records through the end of 2023. The greatest exposure is near the ASKAP bandpass calibrator PKS 1934638, with approximately hr of observations and one FRB detected. Other notable fields are the Deep Investigation of Neutral Gas Origins (DINGO, 2009pra..confE..15M) fields near (R.A.,DEC.) to to ) (199-347 hr), and the aforementioned circumpolar (R.A.,DEC.) h,) field (384.5 hr). The sensitivity of the survey is discussed further in Section 6.
4 Multi-wavelength follow up
The (sub-)arcsecond positions yielded by the ICS system enabled multi-wavelength follow up of the FRB host galaxies, which was the major focus of the survey. Less emphasis was placed on identifying prompt emission temporally coincident with the detected FRBs. Below we identify the motivations and strategy employed to identify host galaxies and measure host/burst redshifts to advance FRB science.
4.1 Optical and infrared photometry
After obtaining high precision FRB burst positions, we first searched for FRB host-galaxy candidates. The FRB coordinates were first checked against available imaging archives, photometric and spectroscopic catalogues using tools such as the Data Aggregation Service (DAS) 2022SPIE12189E..2SM. While some of the lower-DM FRBs had an apparent host galaxy identified in wide-field surveys such as the Sloan Digital Sky Survey (SDSS; SDSS), the Pan-STARRS 3 survey (PS1; PS1), or the Dark Energy Camera Legacy survey (DECaLS; DECALS), the majority of ASKAP-detected FRBs had little or no reliable photometry or spectroscopy available for potential host-galaxy candidates. We therefore obtained our own multi-band photometry to both identify the host galaxies and model the host galaxy properties including total stellar mass and star formation history. Photometric observations of the host galaxies were taken predominantly using the FOcal Reducer and low dispersion Spectrograph (FORS2) instrument on the VLT 1992Msngr..67...18A; Gemini Multi Object Spectograph (GMOS-S) on Gemini-South 2004PASP..116..425H; or the Low Resolution Imaging Spectrometer (LRIS) on Keck 1994SPIE.2198..178O. Infrared imaging observations were also undertaken with the HAWK-I 2008A&A...491..941K instrument on the VLT, usually in combination with a ground layer adaptive optics module (GRAAL). Photometric data reduction strategies are described in detail elsewhere (e.g., 2020ApJ...903..152H; 2023MNRAS.525..994M; 2023ApJ...949...25G).
4.2 Host Associations
Central to establishing the redshift of an FRB is to identify its host galaxy. Our approach for the well-localised FRBs of the CRAFT/ICS survey has been to implement the Probabilistic Association of Transients to their Hosts (PATH) formalism introduced in 2021ApJ...911...95A. The PATH methodology inputs the localisation region of the FRB and the position and apparent magnitudes of all candidate galaxies within or near that region. The analysis requires prior assumptions on the probability of the host being unobserved in the image, the distribution of host galaxy magnitudes, and the offset angular separations of FRBs from the centre of the galaxy. For galaxy magnitudes, we adopt an uninformative prior that weights galaxies inversely proportional to their number density on the sky. For the separations, 2021ApJ...911...95A adopted an exponential profile with scale length equal to an angular size metric of the galaxy, specifically the semimajor_sigma parameter of the photutils software package ().
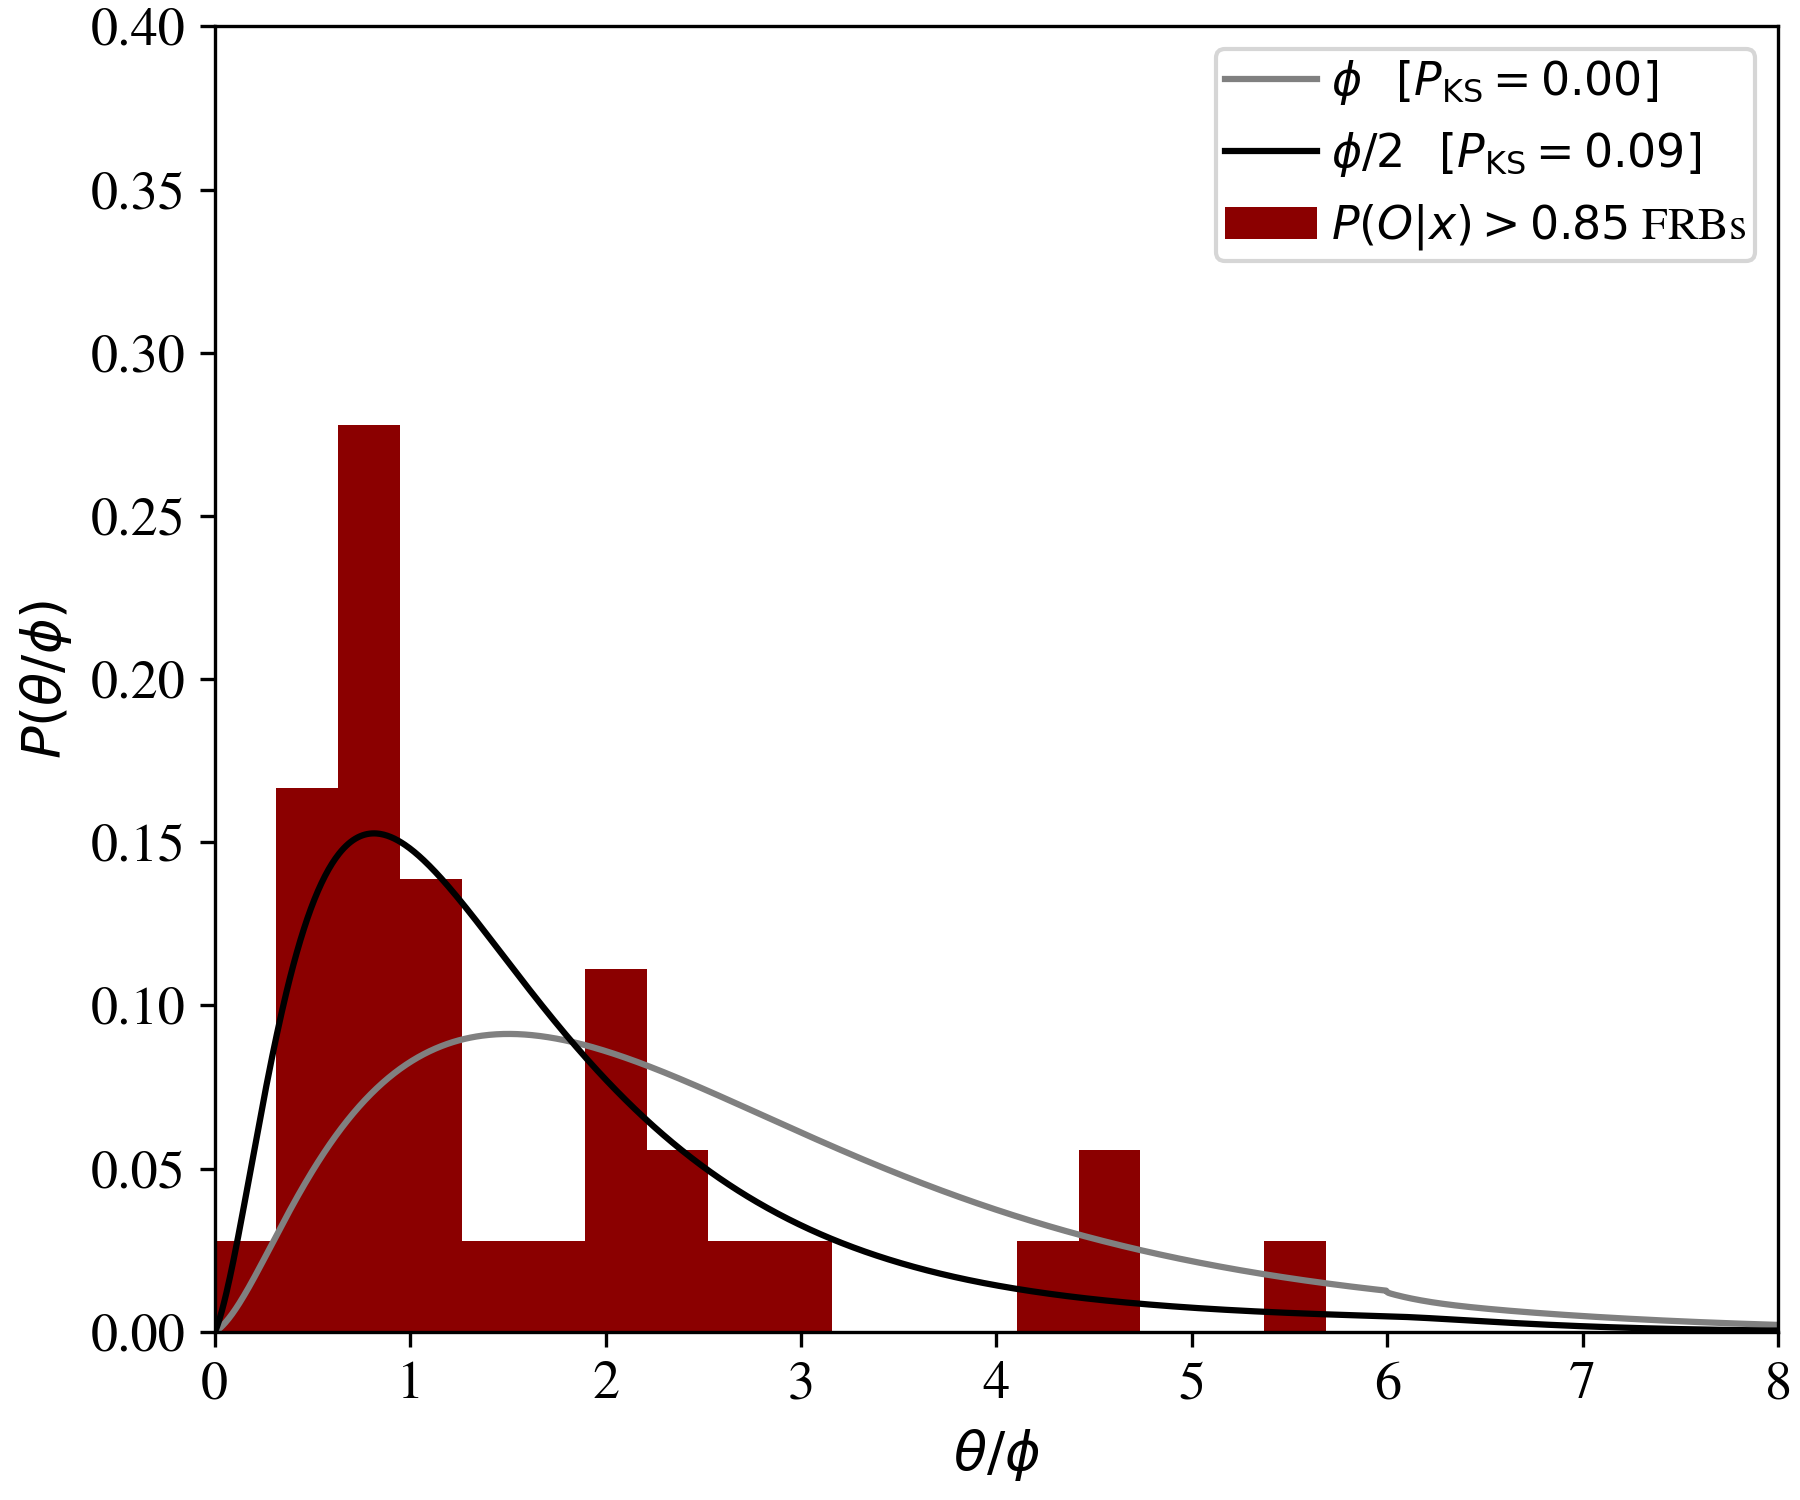
We revisit this assumption and suggest an updated formulation for this offset prior. Figure 6 shows the normalised PDF of the angular offsets relative to for 17 FRBs. This FRB sample was restricted to the subset of FRBs presented in 2022AJ....163...69B with (using their PATH analysis) and also the new FRBs presented in this manuscript with a secure association (see section 5.2). We also include the ASKAP-localised CHIME repeating source FRB 20201124A 2021ApJ...919L..23F. Approximately half of the sample shows with the remainder exhibiting a tail to .
Overplotted on the observed distribution are the exponential priors for host galaxy offset with scale lengths of and . These have been convolved with the reported uncertainties in the FRB localisations. They have also been weighted by a geometrical factor () which disfavours low offsets444We note that Figure 11 of 2021ApJ...911...95A failed to include this factor.. Clearly, the exponential with scale-length of is disfavoured while the data are reasonably well-described by the smaller scale length (). We advocate adopting this new prior for future work on FRBs with PATH, and we utilise it throughout the manuscript.
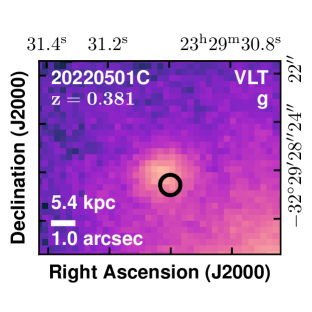
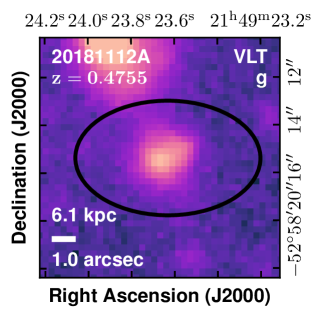
Reanalysing all of the FRBs presented in 2020ApJ...895L..37B, we find few changes in the posterior probabilities. Most of them were previously and the values increased towards 1. The only notable changes were significant increases in for FRB 20181112A and FRB 20191001A. The former FRB is associated with a which has a galaxy in the foreground 2019Sci...366..231P The latter FRB is associated with a galaxy which is separated by ” from a galaxy at a similar redshift ( 2020ApJ...901L..20B). In Tables 3 to 6 in the Appendix we present PATH probabilities for nearby host galaxies for all ASKAP-localised FRBs.
4.3 Optical spectroscopy
We obtained spectroscopic observations of the probable host galaxy candidates that lacked archival data, both to determine the redshift but also to study the global properties of the hosts. These were primarily obtained with FORS2 or X-shooter X-shooter on the VLT, or LRIS or the Deep Imaging Multi-Object Spectrograph (DEIMOS; DEIMOS) on Keck. Brighter host galaxies were observed with the Goodman Spectrograph on the Southern Astrophysical Research Telescope (SOAR, 2004SPIE.5492..331C). Spectroscopic data reduction is described in detail in 2023ApJ...949...25G, 2023ApJ...954...80G, 2023Sci...382..294R, and A. Muller et al. (in prep).
Integral field unit (IFU) and multi-object spectroscopy enabled more detailed spatially resolved studies of the host galaxies and the mapping of structure foreground to the FRB host through spectroscopic identification and characterisation of galaxies close to the line of sight. We have obtained IFU spectroscopy of some of the FRB hosts with the Multi Unit Spectroscopic Explorer on the VLT 2010SPIE.7735E..08B and with the Keck Cosmic Web Imager 2018ApJ...864...93M. Wider-field spectroscopic study of host galaxy foregrounds was also taken with the Anglo Australian Telescope’s AAOmega and two-degree field (2dF) fiber-fed multi object spectrograph 2004SPIE.5492..410S, in collaboration with the FLIMFLAM project 2022ApJ...928....9L; 2024arXiv240200505K.
4.4 Radio and high energy follow-up
We also searched for sources spatially coincident with the FRBs and their hosts across the electromagnetic spectrum.
Radio-wavelength follow-up entailed searches for persistent radio sources sometimes associated with (repeating) FRBs, extended radio continuum emission (most likely associated with star formation) and spectral lines (especially targeting the 21-cm Hydrogen hyperfine transition at decimetre wavelengths and carbon monoxide transitions at millimetre wavelengths). Observations at radio wavelengths of the FRB hosts were made with the Atacama Large Millimeter/submillimeter Array (e.g, ALMAobs), Australia Telescope Compact Array (ATCA, e.g., 2022AJ....163...69B), Jansky Very Large Array (JVLA, e.g., 2023ApJ...948...67B), and MeerKAT (e.g., Glowacki2024). Some of these observations (particularly those made with ATCA) were also used for the first FRBs discovered in order to reference radio continuum sources in images produced from the 3-second voltage dumps with the International Celestial Reference Frame. As our understanding of the astrometric precision of the 3-second images improved this was no longer necessary 2021PASA...38...50D.
We also searched for X-ray emission from a sample of our hosts using the Chandra X-ray observatory Chandra. Such emission could be associated with coincident Active Galactic Nuclei, or Ultra-luminous X-ray sources.
5 FAST RADIO BURST DISCOVERIES
To the end of April 2024, the CRAFT/ICS survey detected 43 unique sources. This includes localisation of the repeating FRB source FRB 20201124A first identified by CHIME 2021ATel14497....1C. The FRBs range in dispersion measure from pc cm-3 to 1780 pc cm-3. The median dispersion measure was 440 pc cm-3, similar to that found in the fly’s eye survey. However, notable higher DM FRBs (discussed below) were identified. Compared to the fly’s eye searches the FRBs detected were unsurprisingly fainter. The median detected burst fluence was 30 Jy ms. Burst fluences ranged from 10 to 120 Jy ms. Bursts were detected in all three of the ASKAP observing bands, in observations centred at MHz, MHz, MHz, MHz, and MHz.
Table 1 in the Appendix summarises the key properties of the FRBs. Table 2 in the Appendix lists the positions of the FRBs, derived interferometrically (where possible) and with the multi-beam localisation method 2017ApJ...841L..12B. Dedispersed dynamic spectra of the bursts from the ICS search data stream, arranged from lowest to highest dispersion measure, can be found in Figures 19 to 23 in the appendix. Even with the relatively low time and frequency resolution of the search data stream the bursts show a variety of spectral and temporal morphologies. Their high-time-resolution properties are reported elsewhere (D. Scott et al., in prep.). We explore the spectral modulation of the bursts in Section 6.9.
5.1 Previously reported FRBs
We briefly summarise the key properties of the previously published ICS FRBs, including motivation for the observations in which they were found.
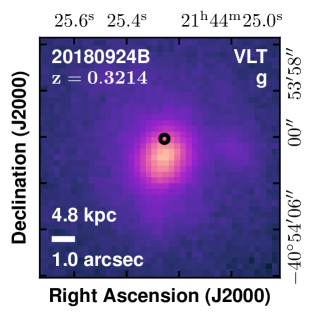
FRB 20180924B – The first FRB localised in the ICS survey was reported in 2019Sci...365..565B. It was discovered in one of the Galactic latitude fields used in the previous fly’s eye survey 2018Natur.562..386S during a dedicated time allocation from the ATNF to secure a FRB localisation. The FRB host galaxy was initially speculated to be either a lenticular or early-type spiral galaxy; however subsequent observation and analysis indicates it to be the latter type from both detailed study of the host galaxy spectral energy distribution 2023ApJ...954...80G, and high spatial resolution imaging with HST 2021ApJ...917...75M that showed the presence of spiral arms, with one of the arms coincident with the FRB localisation.
FRB 20181112A– The discovery and localisation was first reported in 2019Sci...366..231P. The FRB was discovered in one of the Galactic latitude fields used in the previous fly’s eye survey 2018Natur.562..386S.
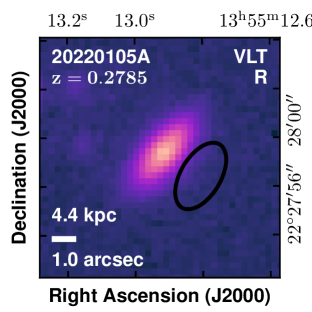
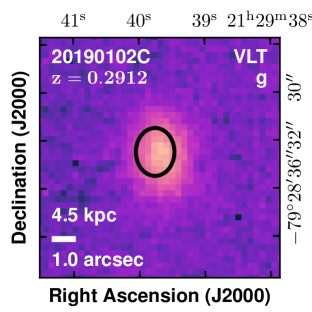
FRB 20190102C – The discovery and localisation was first reported in 2020Natur.581..391M. The FRB was discovered in the circumpolar R.A.h, Decl. field.
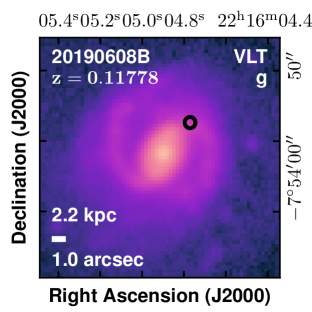
FRB 20190608B– The discovery and localisation was first reported in 2020Natur.581..391M. The FRB was found during an attempt to localise FRB 20171019A, an FRB discovered in the fly’s eye survey 2018Natur.562..386S from which repetitions had been detected with the GBT 2019ApJ...887L..30K. A high-resolution imaging and kinematic study of the host galaxy by 2021ApJ...922..173C showed the FRB to be closely associated with star formation in a spiral arm.
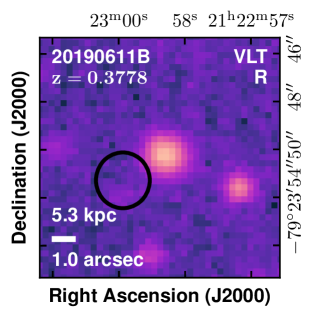
FRB 20190611B– The discovery and localisation was first reported in 2020Natur.581..391M. The FRB was discovered in the circumpolar R.A.h, Decl. field. The FRB has the largest DM deficit relative to the Macquart relation of any FRB discovered in the CRAFT/ICS survey. The veracity of the host association has been questioned based on this 2022ApJ...931...88C.
FRB 20190711A– The discovery and localisation was first reported in 2020Natur.581..391M. The FRB was discovered in the circumpolar R.A.h, Decl. field. This is the only FRB discovered in the ICS survey that has been observed to repeat in our follow-up observations 2021MNRAS.500.2525K.
FRB 20190714A– The discovery and localisation was reported in 2020ApJ...903..152H. Only one of the voltage polarisation data streams was able to be downloaded for the FRB, making polarimetric analysis of the burst properties difficult to undertake555In principle, it would be possible to estimate a magnitude of rotation measure by searching for spectral modulation of the burst consistent with rotation measure. However, FRBs also show spectral modulation that is either intrinsic to the burst emission or the result of diffractive scintillation.. The FRB was discovered in one of the Galactic latitude fields used in the previous fly’s eye survey 2018Natur.562..386S. A wide-field spectroscopic survey around the FRB 20190714A sight line Simha2023 shows a clear excess of foreground galaxy halos that contributes 2/3 of the observed extragalactic DM.
FRB 20191001A– The discovery and localisation was reported in 2020ApJ...901L..20B. The FRB was detected commensally with pilot survey observations for the Evolutionary Map of the Universe (EMU) survey science project 2021PASA...38...46N. The burst was sufficiently bright to be detected as an image-plane transient in 10-s hardware correlator visibilities666The FRB was detected during the 2019 ATNF Radio Astronomy school which many CRAFT and ASKAP team members (Ekers, Hotan, Lenc, Moss, Shannon) were attending, during which time the hardware correlator position was measured..
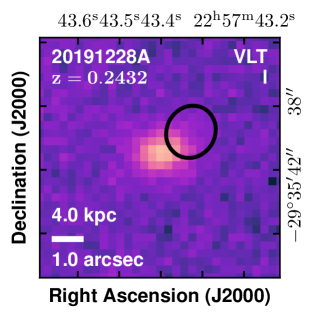
FRB 20191228A– The discovery and localisation was reported in 2022AJ....163...69B. The FRB originated just 2 arcmin from Fomalhaut ( PsA), complicating optical identification and redshift determination for the host galaxy. The FRB was discovered commsensally in observations for the DINGO survey 2023MNRAS.518.4646R targeting the GAMA-23 field.
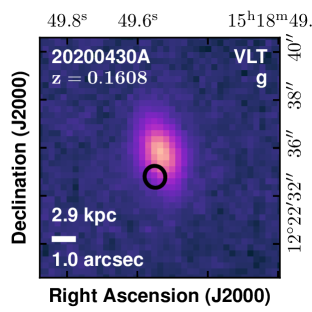
FRB 20200430A– The discovery and localisation was reported in 2020ApJ...903..152H. The FRB was detected commensally in test observations for the first low-frequency epoch of the Rapid ASKAP Continuum Survey (RACS, 2020PASA...37...48M).
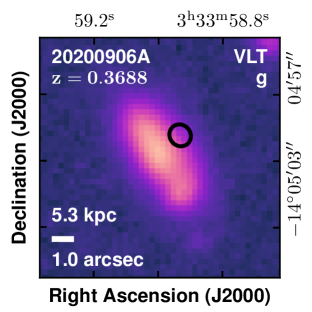
FRB 20200906A– The discovery and localisation was reported in 2022AJ....163...69B. The FRB was detected in observations searching for repetitions from FRB 20171116A, which had been detected in the ASKAP Fly’s Eye Survey 2018Natur.562..386S. It had been selected for follow up because of its relatively large pulse width, which may be correlated with being a repeating FRB 2020MNRAS.497.3076C; 2021ApJ...923....1P. Only seven antennas were recording CRAFT data during the observation. The search system would select antennas for recording based on the number of antennas that were on-source at the beginning of an observation. Occasionally, antennas would arrive on source ascynchronously, resulting in smaller subsets of antennas being used in the searches and localisation.
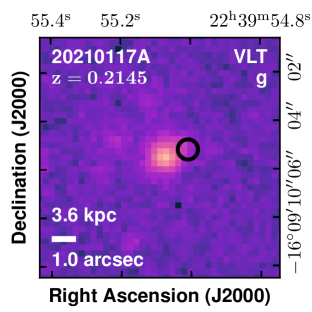
FRB 20210117A– The discovery and localisation was reported in 2023ApJ...948...67B. The FRB was detected commensally with observations for the mid-frequency RACS survey 2023PASA...40...34D. The FRB was found to be originating from a dwarf galaxy with a high host excess DM, similar to archetypal repeating sources FRBs 20121102A and 20190520B 2017Natur.541...58C; 2022Natur.606..873N.
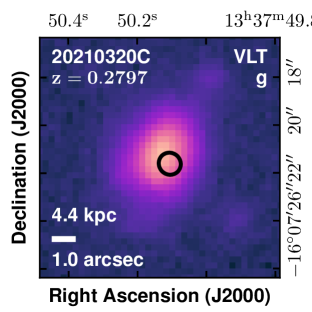
FRB 20210320C– The discovery and localisation were reported in 2022MNRAS.516.4862J and 2023ApJ...954...80G, respectively. The FRB was discovered in one of the Galactic latitude fields used in the previous fly’s eye survey 2018Natur.562..386S.
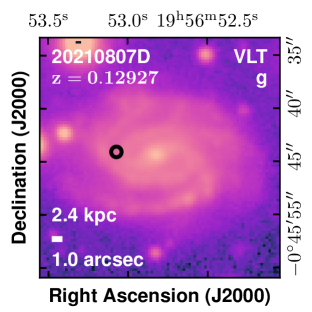
FRB 20210807D– The discovery and localisation were reported in 2022MNRAS.516.4862J and 2023ApJ...954...80G, respectively. The FRB was discovered during time-lapse photography of ASKAP being undertaken for a documentary, demonstrating the ability for the survey to be commensal with non-scientific observations. The FRB was wider than the width threshold for voltage download, but was sufficiently bright to be localised in hardware-correlator 10-s visibilities like FRB 20191001A 2021ApJ...910L..18B.
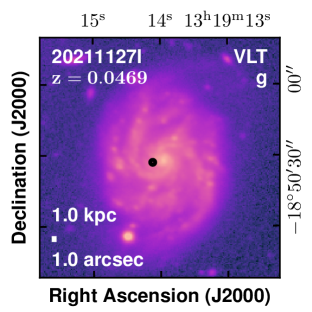
FRB 20211127I– The discovery and localisation were reported in 2022MNRAS.516.4862J and 2023ApJ...954...80G, respectively. The FRB was detected commensally in Widefield ASKAP L-band Legacy All-sky Blind Survey (WALLABY) 2020Ap&SS.365..118K pilot survey observations towards the NGC 5044 group, but is not associated with the group. 2023ApJ...949...25G present an analysis of the FRB and the commensal detection of HI from the host galaxy.
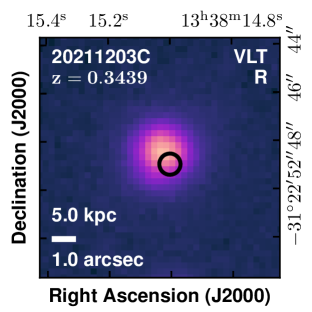
FRB 20211203C– The discovery and localisation were reported in 2022MNRAS.516.4862J and 2023ApJ...954...80G, respectively. This FRB was detected commensally in POlarisation Sky Survey of the Universe’s Magnetisation (POSSUM) 2010AAS...21547013G pilot-survey observations.
FRB 20211212A– The discovery and localisation were reported in 2022MNRAS.516.4862J and 2023ApJ...954...80G, respectively. The FRB was discovered in one of the Galactic latitude fields used in the previous fly’s eye survey 2018Natur.562..386S. This was also the first FRB detected in the ASKAP high band (at a central frequency of MHz)
FRB 20220105A– The discovery and localisation was reported in 2023ApJ...954...80G. The FRB was detected commensally with the first epoch of the RACS high band survey.
FRB 20220610A– The discovery and localisation was reported in 2023Sci...382..294R. Subsequent imaging with the Hubble Space Telescope revealed the burst originated from a compact galaxy group at redshift 2024ApJ...963L..34G. The FRB was discovered in observations attempting to identify repetitions from ASKAP-discovered (but poorly localised) FRB 20220501A (discussed further in Section 5.2.2).
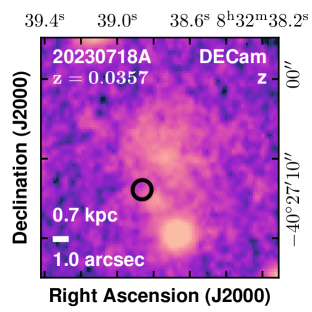
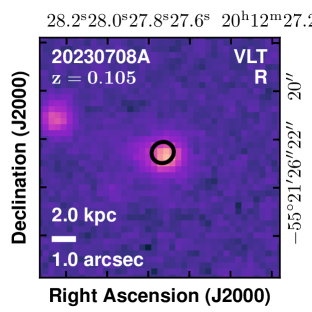
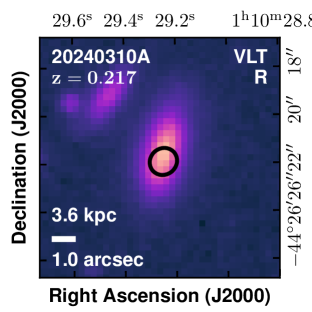
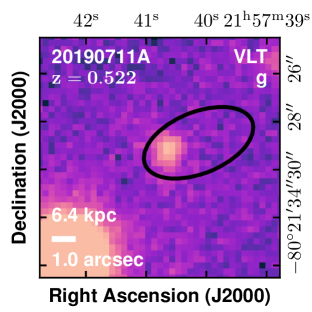
FRB 20230718A– The discovery and localisation was reported in Glowacki2024. The host galaxy was identified through 21-cm HI emission using the MeerKAT radio telescope. The FRB was detected commensally with WALLABY survey observations, but the ASKAP hardware correlator data stream had a technical error and the WALLABY spectral line data was unusable. A DECam image of the field is shown in Figure 1.
FRB 20201124A– In addition to FRBs discovered by CRAFT, we also localised one repeating FRB initially discovered by another facility. The detection and localisation of this repeating FRB source was reported in 2021ApJ...919L..23F. The FRB was first detected by CHIME. In April 2021, 2021ATel14497....1C reported an episode of increased activity from the burst source, which motivated follow up with ASKAP. In total bursts were detected by ASKAP from the source 2022MNRAS.512.3400K. The brightest of these bursts was detected with high significance (S/N ¿ 10) in 20 beams that spanned the phased array feed. As the FRB detection system triggers off the first significant candidate, voltages of the first localised burst from this source were downloaded from a beam adjacent to the primary detection.
5.1.1 FRB 20210912A
The discovery and localisation was reported in 2023MNRAS.525..994M, but unusually no host galaxy has yet been associated with the FRB despite deep imaging follow up. The FRB was discovered commsensally in observations for the Deep Investigations of Neutral Gas Origins (DINGO) survey 2023MNRAS.518.4646R. We also report new observations of this source with the Keck Cosmic Reionization Mapper (KCRM) and Keck Cosmic Web Imager (KCWI). Observations were undertaken under poor weather conditions on 17 August 2023. We obtained s exposures with KCRM and s exposures with KCWI that were usable. We carried out standard processing with the PypeIt software package 2020JOSS....5.2308P to form a spectral cube covering approximately 340–570 nm (KCRM) and 653–1030 nm (KCWI). Neither cube shows any evidence for spectral lines, and the collapsed cubes do not show any evidence for continuum emission.
5.2 New localised FRBs
We summarise the properties and localisations of a few other FRBs discovered in the ICS searches, though detailed analyses of the bursts and their host galaxies is deferred to subsequent studies.
5.2.1 FRB 20210407E
The FRB was discovered while monitoring the active repeating FRB source FRB 20201124A (2021ApJ...919L..23F; 2022MNRAS.512.3400K, Section 5.1). The burst has the highest DM ( pc cm-3) of any detected in a survey with ASKAP to date. The FRB was discovered at relatively low Galactic latitude, . The Milky Way’s disk DM contribution is 154 pc cm-3and 229 pc cm-3assuming the NE2001 2002astro.ph..7156C and YWM16 2017ApJ...835...29Y Galactic electron density models, respectively, indicating the burst is surely of extragalactic origin.
Given the high DM (suggesting a high redshift source), we searched for a host galaxy for the burst, despite relatively high extinction along the line of sight with imaging in -band with DEIMOS at Keck (Prog ID O314; PI Blanchard) and in -band with BinoSpec at the MMT 2019PASP..131g5004F (Prog ID UAO-G194-21A; PI Fong). We identify no credible source at the position of the FRB localisation to a limiting magnitude mag and mag measured in a radius aperture set by the seeing estimate. Extinction is estimated to be approximately and magnitudes along this line of sight in and band, respectively 2011ApJ...737..103S.
We have also attempted to identify the host using integral field spectroscopy in the case that the host galaxy had strong emission lines but lower levels of continuum emission. We observed FRB 20210407E with the Keck Cosmic Reionization Mapper (KCRM) and the Keck Cosmic Web Imager (KCWI) on 17 August 2023. Weather conditions were poor, but we obtained s exposures with KCRM and s exposures with KCWI. Data reduction was identical to that for FRB 20210912A, described above. Like for the aforementioned FRB, the observations should no evidence for either spectral lines or continuum emission.
We are continuing to obtain follow-up observations due to the potentially high redshift nature of the FRB. For this manuscript, however, we include the FRB without a redshift despite a precise localisation.
5.2.2 FRB 20220501C
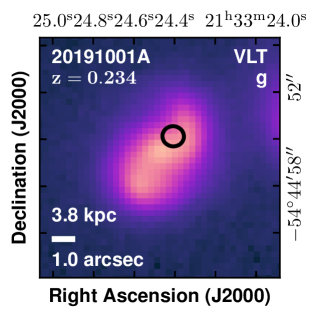
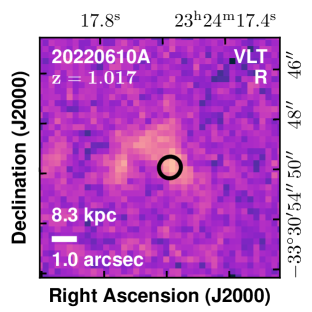
The FRB was detected in observations of the second epoch of the RACS-low survey 2020PASA...37...48M. There was no catalogued galaxy coincident with the burst position. The position is 15” from the magnitude star TYC 7514-122-1 2014AJ....148...81M. VLT FORS2 -band imaging identified a host galaxy coincident with the FRB position (Figure 2). VLT X-shooter spectroscopy of the host galaxy identified H and [O iii] lines consistent with a redshift of . The FRB showed spectro-temporal morphology similar to repeating FRBs 2019ApJ...876L..23H; 2021ApJ...923....1P. As a result, additional filler observations were scheduled to follow up the source to search for repetitions. No repetitions were found, but two other unique FRB sources were discovered in these follow up observations.
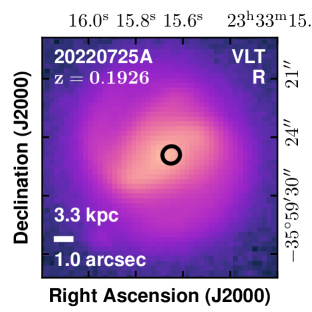
5.2.3 FRB 20220725A
The FRB was detected while monitoring the FRB 20220501C field. The FRB is coincident with the catalogued galaxy WISEA J233315.68-355925.0, which has an optical magnitude of 1990MNRAS.243..692M. VLT/FORS2 imaging of the host (Figure 2) shows spiral arm morphology common to many low redshift ASKAP/ICS FRBs. We obtained z-band imaging follow-up with SOAR (Prog ID SOAR2022B-007; PI Gordon). SOAR spectroscopy (Prog ID SOAR2022B-007; PI Gordon) identified a number of emission lines in the host spectrum, including from H, [N ii], and [S ii] consistent with a redshift of .
5.2.4 FRB 20220918A
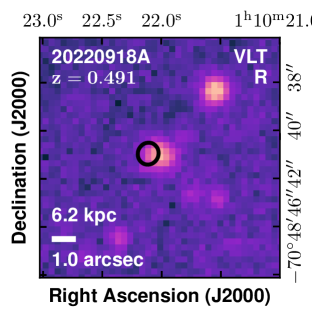
The FRB was detected during POSSUM 2010AAS...21547013G survey observations of the Large Magellanic Cloud (LMC). The burst was detected from the nominal centre of the LMC, so unlikely to originate there. There was no catalogued host galaxy coincident with the FRB position. VLT/FORS2 imaging identified a host galaxy coincident with the position as shown in Fig. 2. The host was also detected in HAWK-I -band imaging. X-shooter spectroscopy of the host galaxy shows weak H and [O iii] emission lines consistent with a redshift of .
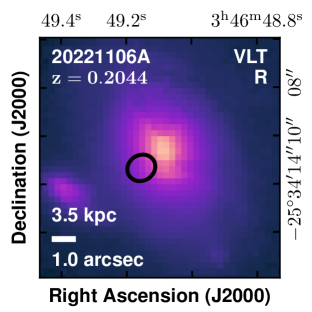
5.2.5 FRB 20221106A
The FRB was detected during filler observations of one of the fly’s eye Galactic latitude -degree fields. The FRB was coincident with the galaxy WISEA J034649.07-253411.7 which has a magnitude of 1990MNRAS.243..692M. A VLT/FORS2 image of the source is shown in Fig. 1. The galaxy was also identified in VLT/HAWK-I -band imaging, while SOAR (Prog ID SOAR2022B-007; PI Gordon) and X-shooter spectra show H, [N ii] and [S ii] emission lines consistent with a redshift of .
5.2.6 FRB 20230526A
The FRB was detected during WALLABY survey observations 2020Ap&SS.365..118K. The FRB is associated with a host galaxy identified in Dark Energy Survey data with a photometric redshift of . VLT FORS2 -band imaging identified a host galaxy coincident with the FRB position. The host was also detected in VLT/HAWK-I -band imaging (Table 7). X-shooter spectroscopy of the host galaxy showed a number of strong emission lines, including H, H, [O ii], [O iii] 5007, [N ii] and [S ii], consistent with a redshift of .
5.2.7 FRB 20230708A
The FRB was detected during EMU survey observations 2021PASA...38...46N. VLT FORS2 -band imaging identified a host galaxy coincident with the FRB position (Figure 1). The host was also detected in VLT/HAWK-I band imaging (Table 7). X-shooter spectroscopic observations of the host galaxy shows emission lines associated with H, H, [O ii], and [O iii] consistent with a redshift of .
5.2.8 FRB 20230731A
The FRB was detected during WALLABY survey observations 2020Ap&SS.365..118K. The FRB was detected at relatively low Galactic latitude . Given the dispersion measure of the FRB, it is unlikely that the host galaxy has detectable 21-cm emission in the commensal WALLABY observations. While deep optical and near-infrared imaging has been undertaken with the VLT, no host is obvious in R-band imaging. This field has a high density of stars, and all nearby objects appear point-like. Because this line-of-sight has a relatively low Galactic latitude (), Galactic extinction is expected to be high at 2011ApJ...737..103S. No galaxy is found to be coincident with the position of the FRB in a VLT/FORS2 -band image. A faint extended source is close to the FRB position in VLT/HAWK-I -band image. Spectroscopic follow up sources in the field has not been undertaken.
5.2.9 FRB 20230902A
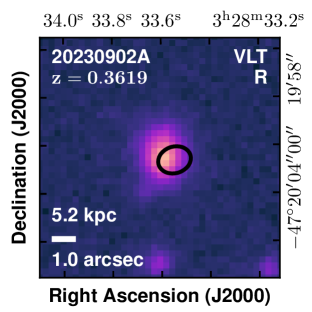
The FRB was detected during First Large Absorption Survey in HI 2022PASA...39...10A survey observations (FLASH, 2022PASA...39...10A). The host galaxy was identified in both VLT/FORS2 -band and HAWK-I band images. X-shooter spectroscopy of the host galaxy shows emission lines consistent with H, H, [O ii], [O iii] 5007, and [S ii] consistent with a redshift of .
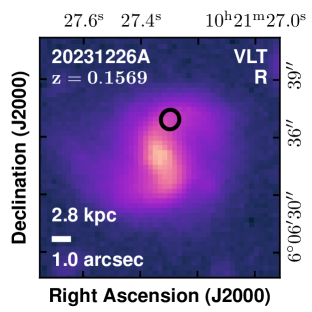
5.2.10 FRB 20231226A
The FRB was detected during a VAST 2021PASA...38...54M observation. The host galaxy was identified in Legacy Survey imaging, catalogued as WISEA J102127.29+060634.5. A VLT image of the host galaxy can be found in Figure 1. The FRB has been localised to a spiral arm in a host galaxy for which X-shooter spectroscopy shows emission from H, [O ii], [O iii] and [N ii] consistent with a redshift of .
5.2.11 FRB 20240201A
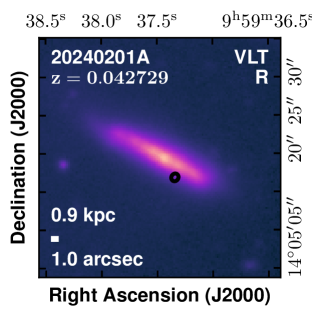
The burst was detected in filler observations of a Galactic latitude- degree field 2018Natur.562..386S. The FRB is coincident with the galaxy WISEA J095937.44140519.4. A VLT image of the host galaxy is presented in Figure 1. The galaxy has been spectroscopically observed in the Sloan Digital Sky Survey and has a catalogued redshift of 2017ApJS..233...25A.
5.2.12 FRB 20240208A
The FRB was detected in filler observations of a Galactic latitude- degree field 2018Natur.562..386S. Optical observations have not yet been undertaken. The FRB appears to be coincident (separation ) with the galaxy SDSS J103654.96005712.2 which has a -band magnitude of and a photometric redshift of SDSS.
5.2.13 FRB 20240210A
The FRB was detected in filler observations of a Galactic latitude- degree field 2018Natur.562..386S, close to a null of the ASKAP primary beam. As a result the fluence of the burst reported is likely underestimated, as our correction for primary beam assumes a Gaussian shape. The burst has been localised to a spiral arm of the Seyfert 1 galaxy WISEA J003506.47281619.1, with a redshift from the Southern Sky Redshift Survey of 1998AJ....116....1D.
5.2.14 FRB 20240304A
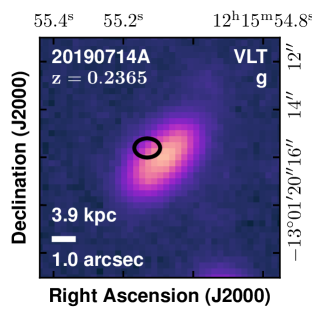
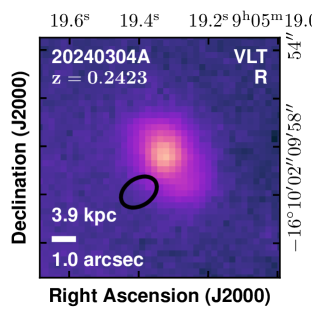
The FRB was detected commensally with EMU. VLT/FORS2 imaging has been taken and a host galaxy identified (See Figure 3). Spectroscopic observations have not yet been attempted.
5.2.15 FRB 20240310A
The FRB was detected in an EMU survey observation. Optical imaging has been taken with VLT/FORS2, allowing a host to be identified (see Figure 2). X-shooter observations of the host show H, [O ii], [O iii], [N II], and [S ii] lines at a redshift of .
5.2.16 FRB 20240318A
This FRB was discovered in an observation of the third epoch of RACS-low 2020PASA...37...48M. Optical follow up of the burst has not yet been undertaken. However the FRB appears to be coincident (separation ) with the galaxy WISEA J100134.45373659.7 which has a -band magnitude of and a photometric redshift of SDSS.
5.3 Poorly localised FRBs
During the ICS searches we detected a sub sample of FRBs for which we were unable to obtain interferometric positions. This was usually due to the absence of a voltage download. Fortunately, in one case (FRB 20210807D), as noted above, the burst was sufficiently bright to be detected in commensal image-plane 10-s images. This was not possible for other bursts because they were either too faint or the hardware correlator was not recording data (as was the case in the filler observing mode). Nonetheless, the bursts represent detections with the ICS search pipeline so should be considered when modelling the FRB population.
FRB 20200627A was detected in a filler observation in a field targeting the fly’s eye FRB 20180131A 2018Natur.562..386S. The burst width exceeded that for the threshold for downloading voltages.
FRB 20210214A was detected during a pulsar check observation of PSR B003107. During pulsar check observations voltage downloading is disabled. While the majority of these were of two pulsars in the Galactic plane, PSR B083345 and PSR B164145 (being high DM so having more stable flux density in the ASKAP bands as they are less affected by diffractive scintillation), PSR B003107 was observed when the others were not visible.
FRB 20210809C was detected commensally with time-lapse filming of the array for a documentary, as was the case for FRB 20210807D. As with FRB 2020627A the burst duration was too long to trigger a voltage download. However, the burst was insufficiently bright to be detected in 10-s visibilities.
FRB 20220531A was detected during a bandpass calibration observation for the hardware correlator visibilities. The array switched observing bands without having a voltage calibration observation conducted777The array switched frequencies immediately after the voltage download which destructively altered the delays and phases in the signal path; as a result, standard bandpass calibration was not possible.. It may potentially be possible to calibrate the data using PKS 1934638 as an off-axis calibrator, but this has not been attempted.
FRB 20230521A was detected during FLASH survey observations. This was the first FRB detected in the lowest frequency band used by ASKAP (the central frequency is set to MHz). The burst width failed to meet the criteria for voltage download. The burst was confirmed in routine inspection of FRB candidates.
FRB 20231006A was detected during a bandpass observation. Only a subset of the voltages for the FRB were downloaded (for a subset of antennas and a single polarisation), as voltage downloads stopped at the end of the short scan. No attempt has been made to further localise this FRB.
6 SURVEY PERFORMANCE
Given the commensal nature of the survey, we assess detection rates as a function of changing observation parameters. Through to the end of 2023 (MJD 60309), ASKAP has observed in ICS mode for a total of hr, for an average on-sky efficiency of . As a commensal survey, this has resulted in a variety of pointing directions and frequency configurations. Full logging information was available only for hr of this, due to an early logging error. This corresponds to the latter 30 FRBs detected until the end of 2023. Furthermore, the current version (‘v3’; 28 FRBs) of the FREDDA FRB detection algorithm has been used only from April 2020 — the initial version (‘v1’; 7 FRBs) had slightly reduced sensitivity to high-DM FRBs, while ‘v2’ (2 FRBs) had a bug that reported incorrect S/N values Hoffmann2024. Therefore, some analyses below will be applied to a subset of the data. This will be noted in each case.
6.1 Survey detection rates
Given the commensal nature of a large portion of the survey it is important to assess how detection rates depending on the nature of the underlying observing programs which observed over a wide range of Galactic latitudes across the entire available ASKAP band.
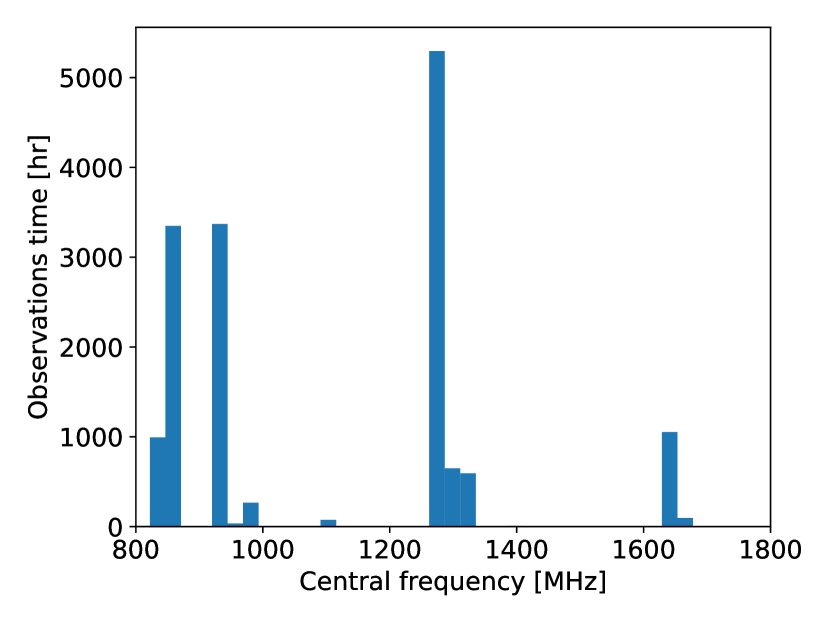
When assessing the detection rate, it is important to consider the range of central frequencies of the observations. Figure 7 shows the distribution of survey times per central frequency. Nominally, we classify observations into three categories: 900 MHz ( GHz), 1.3 GHz (1 GHz GHz), and 1.6 GHz ( GHz), reflecting the three bands used for ASKAP observing. While the Fly’s Eye survey was conducted exclusively at 1.3 GHz, the ICS survey was conducted at a range of frequencies — many of the ASKAP survey projects have chosen to observe at lower frequencies to avoid interference from global navigation system satellites.
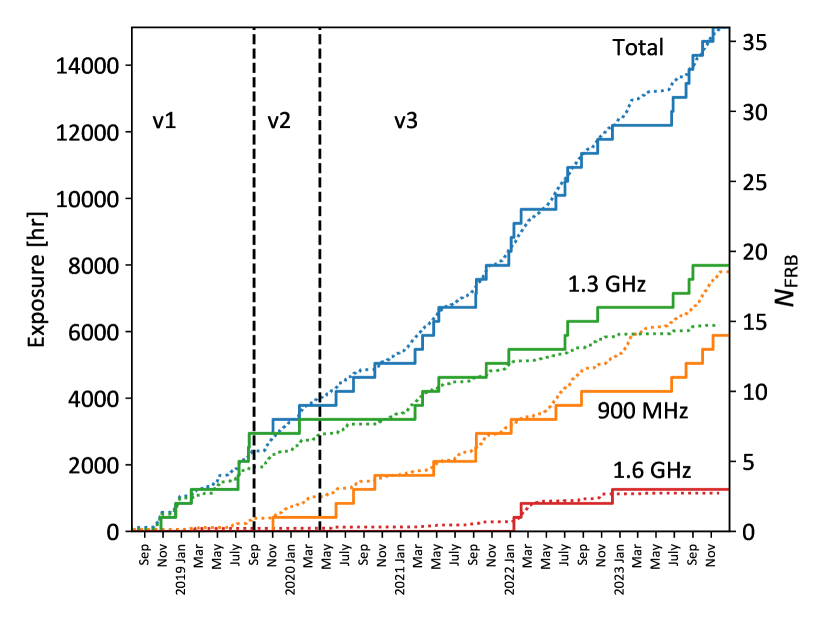
The cumulative detection rate is plotted against observation hours in Figure 8. ASKAP ICS observations have detected, on average, one FRB per 414 hr, with the rates in each of the three frequency bands being once per 533 hr, 326 hr, and 383 hr for 900 MHz, 1.3 GHz, and 1.6 GHz respectively. These rates are lower than expected when compared to that found during observations in Fly’s Eye mode (2018Natur.562..386S; 2019PASA...36....9J, 20 FRBs in 1274.6 days, i.e. one FRB per hr;). The sensitivity in ICS mode is expected to scale as with the number of antennas, and hence the rate should vary as , assuming a Euclidian distribution of bursts. For antennas being used simultaneously, this implies a rate of once per 137 hr, i.e. 2.5 times higher than the 1.3 GHz ICS rate. The cause of this deficit is so far unexplained.
6.2 Modelling frequency dependence
We model the frequency-dependence of the detection rate to be
| (1) |
where describes the dependence on the observing system, the dependence on the beam shape, on the effective width, and the factor represents the intrinsic dependence of the FRB rate on observation frequency with the rate index . In all cases, we assume a Euclidean dependence of the rate on the detection threshold, i.e. (see Section 6.4). The term , reflecting the frequency-dependent system temperature from 2021PASA...38....9H. is the ‘footprint’ term, calculated as
| (2) |
for the beam values calculated as the envelope over 36 Gaussian beams (in either a hexagonal ’closepack 36’ or ‘square 6x6’ configuration, with pitch angles varying from 0.72∘–1.1∘), full width half maximum of , (where is the wavelength of the emission and in the -m antenna diameter) and peak amplitude depending on offset from boresight according to 2021PASA...38....9H, where is the wavelength . The ‘width factor’, , is due to the effective width (and hence the threshold: ) of FRBs changing with sampling time, FRB intrinsic width, degree of scatter broadening, and dispersion measure smearing; the latter two of which are frequency-dependent. This is calculated using the measured properties of FRBs in the high time resolution sample of (D. R. Scott, et al. in prep.), and the effective width according to Cordes_McLaughlin_2003. is the number of antennas used in the observation, such that sensitivity scales as , and thus rate as .
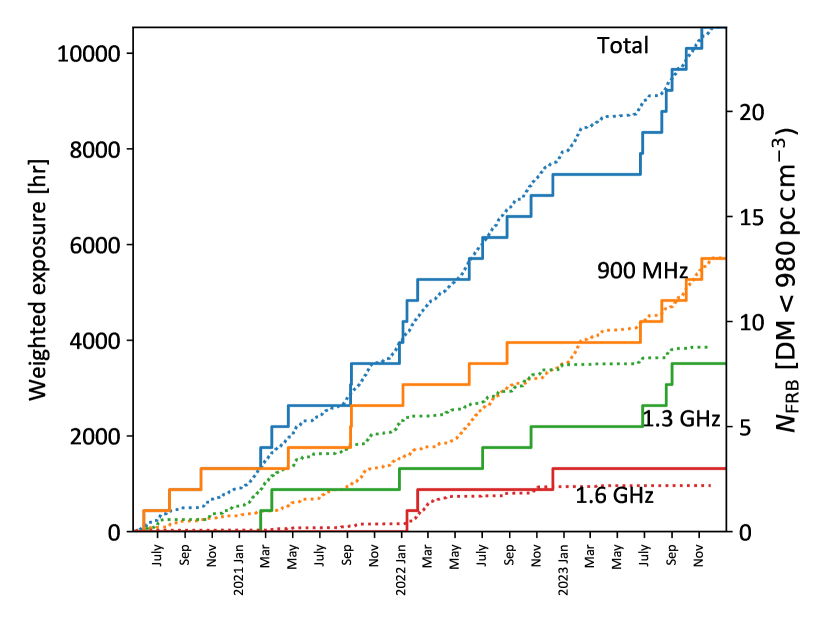
We compare the cumulative integral of Eq. 1 against FRB detections during the stable ‘v3’ period in Figure 9, assuming no intrinsic rate dependence (). To account for high-DM FRBs being undetectable in low-frequency observations due to only 4096 DM samples being searched, we remove all FRBs with a DM above 980 pc cm-3. The rates predicted by Eq. 1 are re-scaled to have an average of unity, i.e. they convert real hours into weighted hours. The result is that the total number of detected FRBs closely matches the expected number in each frequency band, i.e. we see no evidence for an intrinsic rate dependence.
Our study of the spectral behaviour of 23 Fly’s Eye FRBs 2019ApJ...872L..19M suggested that, on average, spectral fluence . However, as we note in 2022MNRAS.509.4775J, biases due to beam shape would revise this to should FRBs have extremely narrow bandwidths. Varying , and comparing the relative to predicted rates between the low and mid bands, produces . Thus our observations cannot yet constrain the spectral dependence of FRBs.
The modelling of Eq. 1 also predicts that the ASKAP configuration in Fly’s Eye mode was — when excluding the factor — 33% more efficient at detecting FRBs than the average ICS observation, and 22% more efficient than ICS 1.3 GHz observations. Allowing for this, the expected rate for ICS 1.3 GHz observations becomes one per 167 hr, i.e. the observed rate of once per 326 hr is a factor of below expectation.
6.3 Galactic latitude dependence
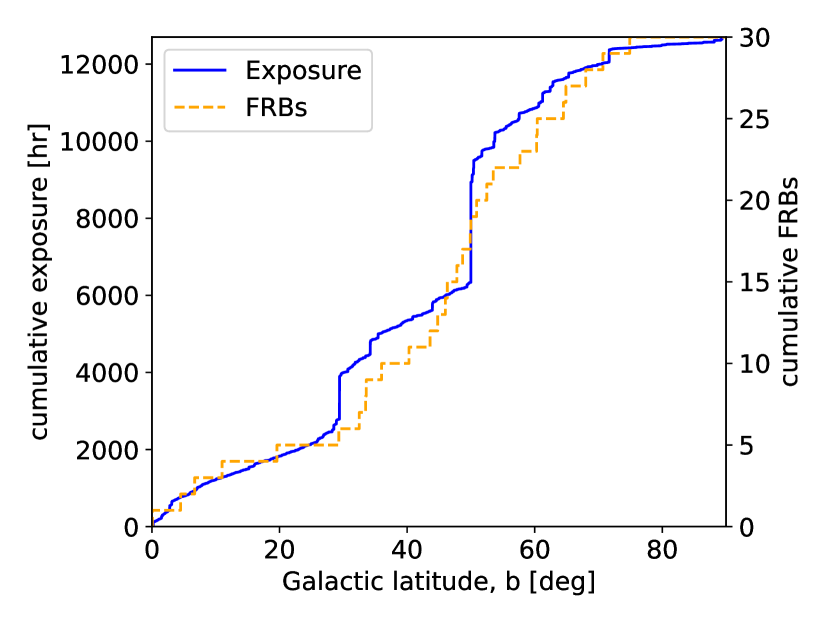
During the initial Murriyang surveys that established FRBs as a class of astrophysical transient, there were suggestions of a deficit of FRBs at mid-to-low Galactic latitudes 2014ApJ...789L..26P, which was speculated to be due to interstellar scintillation 2015MNRAS.451.3278M. Analysis after further detections did not find evidence for a strong effect 2018MNRAS.475.1427B. In Figure 10 we compare Galactic latitude coverage against the 30 FRB detections for which we have logging data. We find no significant evidence for a latitude-dependent event rate, so discount this as an explanation for the rate deficit.
6.4 Source counts analysis
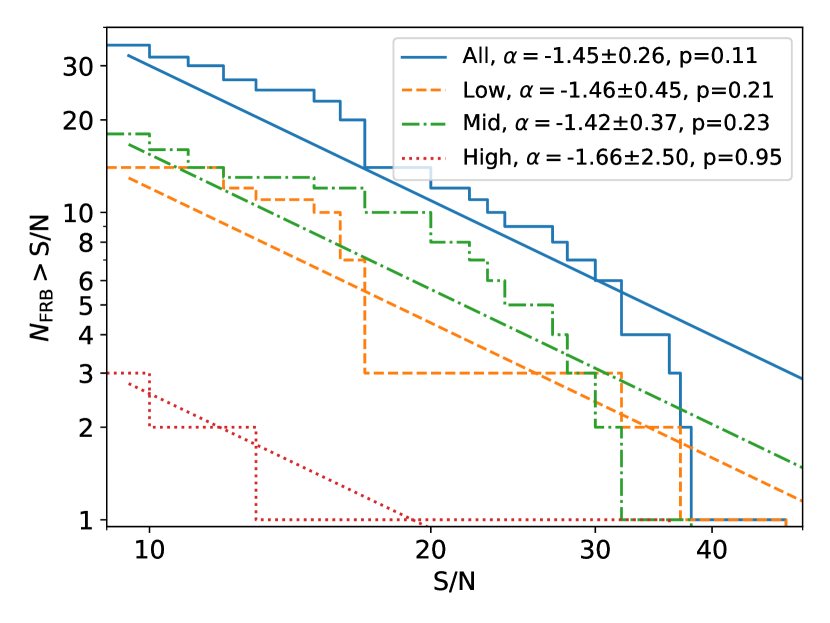
The FRBs detected in the fly’s eye survey have been shown to have a S/N distribution consistent with the Euclidean expectation of James2019. Figure 11 shows this distribution for all ASKAP ICS FRBs, excluding those two discovered during the period when FREDDA returned incorrect S/N values. Using the method of 1970ApJ...162..405C to estimate the power-law index for all FRBs produces , which becomes when correcting for the expected bias. This suggests that if the source counts distribution does indeed flatten, as predicted by Macquart2018b and potentially observed in Murriyang James2019 and MeerKATJankowski2023 data, this occurs below the detection threshold of CRAFT ICS observations.
The observed source counts distribution is also a good diagnostic tool for biases in the search pipeline: human vetting and/or RFI mitigation algorithms may reject candidates that are close to the nominal detection threshold, or well above it Macquart2018a. We have performed Kolmogorov-Smirnov tests kolmogorov; smirnov for consistency with a pure power-law on ICS FRBs, with p-values quoted in Figure 11, and find no strong statistical evidence for a deviation. The same conclusion is reached when dividing the sample into FRBs detected in low, medium, and high frequency ranges.
There is some evidence however for a reduced number of FRBs in the regime, and a deficit of FRBs with very high S/N, but this is not conclusive. Fitting to all FRBs with S/N¿14 increases the expected total number of FRBs by a factor of 1.40, i.e. a lack of S/N FRBs cannot explain the deficit found in Section 6.1. Equivalently, scaling up the observed ICS rate at 1.3 GHz by 1.4 to one FRB per 250 days, and comparing this rate to the fly’s eye rate, implies a source-counts slope of . Yet fitting to Figure 11 for S/N produces . In other words, a change in source-counts slope would also require our detection pipeline to miss high-S/N FRBs, or otherwise reduce the S/N of those detected.
6.5 Non-linearities in detection
Analysis of the source-counts slope using S/N assumes a linear relation between FRB fluence and S/N James2019. There are several possible causes of non-linearities in our detection system, which could feasibly reduce the S/N of high-S/N events, which we consider below.
The FREDDA detection algorithm normalises channelised power according to the mean and standard deviation of each ‘block’ of 256 samples, approximately ms in duration. However, this normalisation is applied to data in a subsequent block, which means that a bright FRB cannot influence its own S/N estimates. Similarly, a check on the kurtosis of each channel to remove RFI is also applied to subsequent blocks. The only possible effect then would be for an extremely bright FRB to exceed the 8-bit dynamic range of the ICS data at detection. The RMS of each time–frequency scintle is typically set to 16 digital units (d.u.), meaning that the peak S/N of a narrow FRB, with 128 d.u. of power in all frequency channels, would be of , above which the system response must be less-than-linear. FRBs will always be DM-smeared in time, which increases the S/N threshold beyond which the system becomes non-linear; while scintillation and narrow effective bandwidths will decrease the threshold, due to individual scintles exceeding 128 d.u. We estimate scintillated, low-DM FRBs to suffer non-linear effects for S/N, where is the FRB bandwidth. However, such FRBs will only have their S/N reduced; they will not be missed, and could be readily identified in offline analysis. We have not detected any such FRBs yet in our sample.
We also observe that ASKAP beams typically overlap near the half-power points. Hence, any FRB with very high S/N, even if vetoed by some unforeseen part of the system, would be detected by adjacent beams, similarly to one burst from FRB 20201124A 2022MNRAS.512.3400K.
The final possible cause of detection biases we consider is in the anti-RFI candidate vetting script that parses raw candidates, and determines whether or not to trigger the system. This has been developed by using ASKAP FRBs detected in Fly’s Eye mode 2018Natur.562..386S, and in theory could introduce a S/N-dependent bias. However, no such bias was observed during tests. Therefore, if the observed deviations (at moderate significance) from a pure power-law in S/N are real, we cannot explain their origin with known systematic effects.
6.6 Elevation dependence
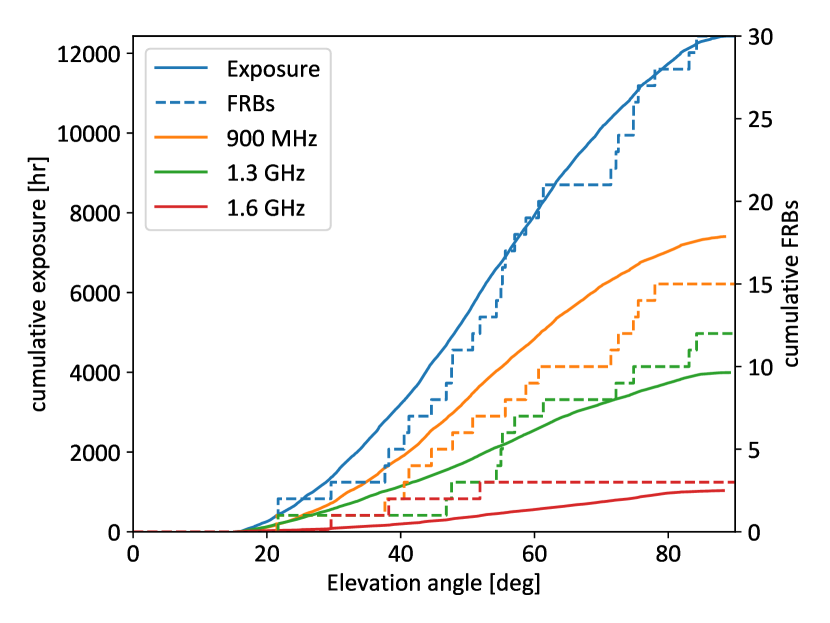
The effect of RFI on FRB detection rates is expected to be elevation-dependent, as RFI sources — particularly those on the horizon — move in and out of ASKAP’s sensitivity pattern. Figure 12 plots the elevation dependence of FRB rates against the total exposure (approximated by the boresight elevation at scan start) for which we have records. We find no evidence for an elevation-dependence to the FRB detection rate.
6.7 Assessing fly’s eye localisation
The capability to localise FRBs to arcsecond positions also enables us to examine the localisation and fluence measurements presented in the fly’s eye surveys. For the fly’s eye surveys, we leveraged the multiple-beam detections to improve on FRB localisation and to better determine FRB fluence. The algorithm, described in 2017ApJ...841L..12B, used the relative signal-to-noise ratios of detections in multiple beams to determine the location of the burst position on the focal plane. The algorithm marginalised over uncertainties in beam shape, gain, and position when determining burst position and brightness, and uncertainties on the parameters. It utilised Bayesian inference, and the maximum a-posteriori parameters and their uncertainties were derived from posterior samples calculated from a nested sampling algorithm 2009MNRAS.398.1601F.
We assess the position performance using a test:
| (3) |
where is the vector difference between the interferometric and multi-beam positions and is a covariance matrix parameterising the uncertainty in the multi-beam position. We assume the position uncertainty as determined using the multi-beam method to be a bivariate Gaussian, parameterised by the variance in right ascension and declination, and their covariance. These were calculated directly from the posterior samples. We do not account for uncertainty in the interferometrically derived position as it is typically a factor of smaller than that of the multi-beam-derived position. In Figure 13, we show the cumulative distribution function of the values, and compare to the expected distribution with two degrees of freedom. We find modest disagreement between the measurements and the expected distribution, with a Kolmogorov Smirnov test reporting a probability of that the distributions agree. This can be attributed to a few outlying burst localisations (). FRB 20240201A was found to originate in a null of the primary beam. The beam model used in the multi-beam localisation method assumes a Gaussian beam so does not include nulls or side lobes. FRB 20210320C originated from an outer edge beam, which is also significantly non-Gaussian. The origin of the large disagreement between the interferometric and multi-beam positions observed for FRB 20230902A is unclear; however it was the only FRB localised at the lowest standard ASKAP central observing frequency ( MHz). It is likely that at the lowest frequencies the ASKAP beams deviate greatest from Gaussian shape. We find that if we increase the size of the uncertainties by (which would reduce the by a factor of approximately ), the reported probability from the K-S test would increase to .

6.8 Burst positions within beams
Figure 14 shows the relative position of the FRB positions relative to the primary beam for the FRBs for which we obtained interferometric localisation. We have assumed a beam of full width at half power (FWHP) following 2016PASA...33...42M. The number of bursts increases radially, matching the relative area which scales with the square of radial distance. It then decreases at larger radius. The inner beams are spaced at distances typically smaller than the FWHP. There is a population of bursts localised well outside the half power point of the primary beam. These bursts were predominantly discovered in the outer beams of the PAF. Future image-plane ASKAP detection systems (discussed below) have a more limited field of view, so are potentially not sensitive to these side-lobe detections.

6.9 Burst modulation
Many of the ASKAP FRBs show spectral modulation: intensity variation in frequency that could either be diffractive scintillation or intrinsic to the emission mechanism. This was identified in the fly’s eye survey2018Natur.562..386S. We investigated if there is any correlation between modulation and dispersion measure using the FRBs in the search data stream. We choose to investigate modulation and dispersion measure to consider both the fly’s eye and ICS FRBs. We calculate the spectral modulation index to be
| (4) |
where is the variance on pulse and is the variance of (thermal) noise measured in a segment of data of equal temporal duration close to the FRB. While FRBs with DM pc cm-3show a variety of spectral modulation, those with DM pc cm-3show little spectral modulation. It is possible that spectral modulation is being quenched at higher DM. Studies of a larger sample of bursts in higher spectral and time resolution (such as using data products derived from the CELEBI pipeline) are required to assess this effect.

7 SCIENTIFIC OUTCOMES OF THE ICS SURVEY
At the commencement of the ICS searches one of the key questions was the distance scale to FRBs. The first results of the survey demonstrated that most FRBs do indeed originate from cosmological (gigaparsec-scale) distances. Since then, the study of FRBs can be broadly bifurcated into answering two questions:
-
1.
What causes FRBs?
-
2.
How can FRBs be used as cosmological tools?
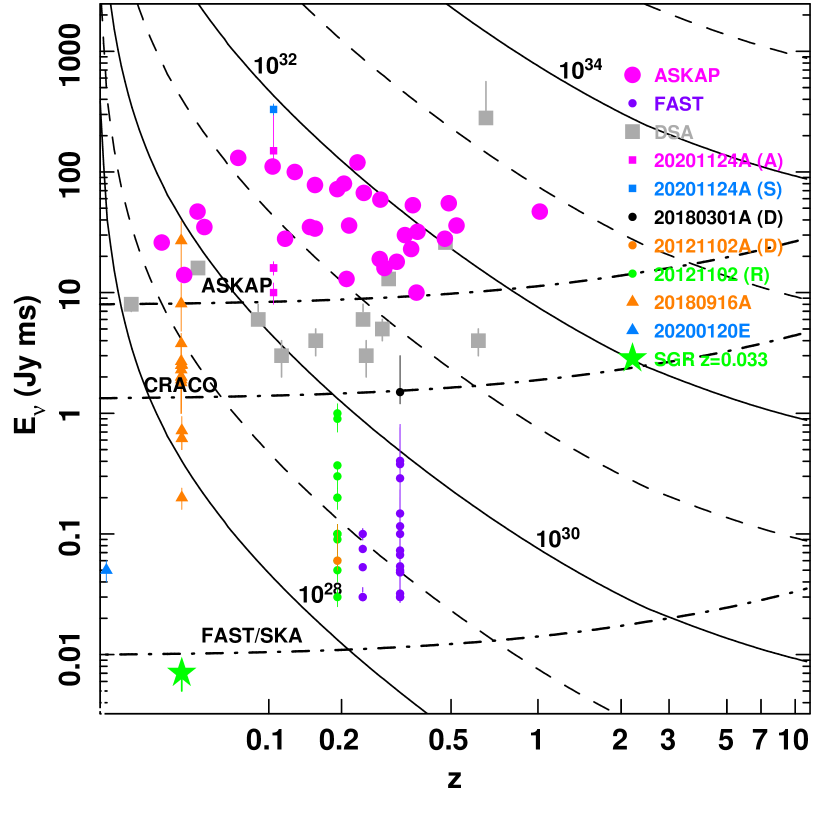
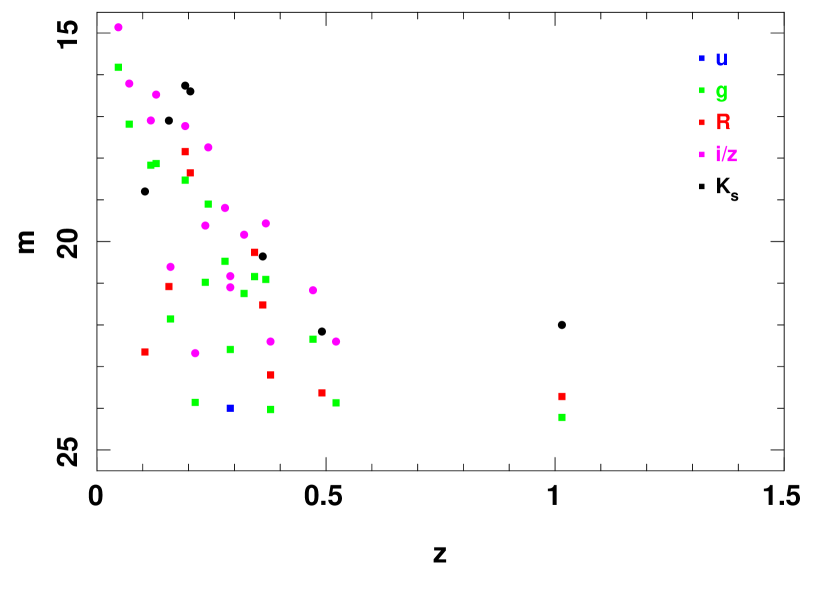
Accumulating a population of localised FRBs is essential in answering both these questions. To determine what causes FRBs, it is necessary to identify the host galaxy and the FRB environments. The ICS searches have delivered the first substantial sample of 1 arcsecond-localised FRBs, including the first large sample of localised one-off FRBs. Figure 16 shows the redshift-fluence distribution of the FRBs discovered in the ASKAP surveys, and compares them to other FRBs localised to host galaxies.
7.1 FRB host galaxies
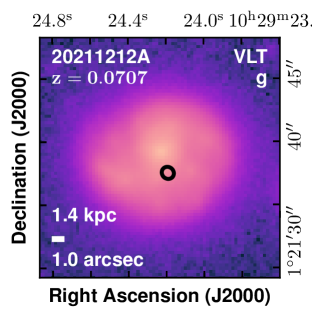
By virtue of delivering the largest sample of localised FRBs in its era, the CRAFT/ICS survey has provided a great opportunity to understand the demography of FRB host galaxies and the attribution of FRBs to potential progenitor populations. Figures 1 to 3 show images of the sub sample of our FRB host galaxies observed primarily with the Very Large Telescope (VLT), arranged in increasing redshift. Updated photometry for a sub sample of FRBs observed with the VLT is presented in Table 7. A plot showing the multi-band photometry as a function of redshift for this sub sample is shown in Figure 17.
Over the course of the survey, we undertook a series of studies investigating the properties of FRB hosts. 2020ApJ...895L..37B and 2020ApJ...903..152H conducted the first demographic studies of FRB host galaxies, finding them to be largely late-type star forming galaxies. 2022AJ....163...69B extended the analysis to include a larger sample of FRBs and compared the properties of the hosts of apparently one-off FRBs with those of repeating sources. The sample size is insufficient to distinguish any difference between the repeating and non-repeating sources. 2023ApJ...954...80G undertook detailed modelling of host galaxy spectral energy distributions to assess the star formation histories of nearly all our FRB hosts identified prior to the beginning of 2022. From these studies it is now clear that the host galaxies of one-off bursts are markedly different from that of the first repeating FRB 20121102A which was found to originate in a metal-poor dwarf galaxy 2017ApJ...834L...7T.
The high angular resolution afforded by ASKAP-detected FRBs can exceed that easily obtained on the ground with natural seeing, warranting further follow up with the Hubble Space Telescope (HST). In 2021ApJ...917...75M we presented the analysis of seven ASKAP localised FRBs (and one localised by the European VLBI Network, EVN), and showed that most of the bursts were located near spiral arm features in their hosts. This implies that many FRB sources are associated with active star formation and young stellar populations. This was only possible because of the combination of the high precision ASKAP positions and the high resolution HST images. 2023arXiv231201578W used laser guide star adaptive optics with the Gemini South telescope to undertake a similar assessment of a further five ASKAP FRB host galaxies. This provides support for the origin of FRB emission from young neutron stars, with the notable exception of the repeating CHIME FRB source 20200120E which has been localised to a globular cluster in the halo of M81 2021arXiv210511445K.
Very few of the host galaxies showed continuum radio emission. No unresolved persistent radio emission has been identified coincident with any of the bursts discovered by ASKAP (e.g., 2019Sci...365..565B; 2020ApJ...895L..37B) despite sensitive observations. However only one of the FRBs in the sample (FRB 20190711A) has been found to repeat, and originated at a redshift of . Diffuse emission attributed to star formation was observed for two host galaxies. Hydrogen and carbon-monoxide line emission was also detected for the host galaxies of three FRBs (FRBs 20230718A and 20180924B, 2023ApJ...949...25G; ALMAobs; Glowacki2024).
7.2 Burst-emission physics
Access to the voltage buffers allowed us for the first time to study ASKAP-detected FRBs both at time resolutions much shorter than ms, and with full polarisation. This enabled improved insight into burst emission physics and the properties of intervening material along the line of sight. 2020ApJ...891L..38C demonstrated the power of using the voltage buffers to form a tied-array beam time series at the position of the bursts. What appeared at low time resolution to be a single pulse in FRB 20181112A was in fact four distinct bursts, with each showing different pulse morphologies and polarimetric properties. 2020MNRAS.497.3335D used high time resolution imaging on a larger sample of ASKAP bursts, uncovering a diversity of polarimetric properties and morphologies. While some bursts were obviously scatter-broadened, many had multiple components with varying levels of linear and circular polarisation, including variations in both across pulses. This was in contrast to previous studies of repeating FRB sources which in general showed high degrees of linear polarisation, constant linear polarisation position angles, and less evidence for circular polarisation.
The spectropolarimetry enabled searches for conventional and generalised Faraday rotation, and spectral depolarisation. The searches showed that most of the detected FRBs had low rotation measures (RMs) rad m-2 2023ApJ...954..179M, in contrast to the first repeating FRB which has a high RM 2018Natur.553..182M. Similarly, constraints on spectral depolarisation suggest that the scattering media foreground to the ASKAP FRB sample are less magnetoionically active compared to that of repeating FRB sources 2024MNRAS.527.4285U; 2023Sci...382..294R.
7.3 FRB repetitions
One of the fundamental (but potentially unproveable) questions about FRBs is whether they all (eventually) repeat. This uncertainty stems from the observational limitations and the stochastic nature observed in the repetition rates across the FRB population. In self-conducted follow up within the fly’s eye survey, which spanned thousands of hours, none of the FRBs were found to repeat 2018Natur.562..386S. Initial studies of the first repeating FRB 20121102A suggested a steeper luminosity function, highlighting the importance of using more sensitive radio telescopes for such investigations 2017ApJ...850...76L; 2018ApJ...861L...1C.
The presence of repetitions excludes cataclysmic progenitor models for producing some FRB emission. The large volumetric rate of repeating FRBs is also inconsistent with cataclysmic progenitor models 2019NatAs...3..928R.
Throughout the ICS survey, we have conducted an extensive monitoring program to search for repeat bursts from detected FRBs. This has been executed using some of the world largest single-dish radio telescopes, providing unprecedented time resolution (20–80 s) and frequency coverage ( as large as 3 GHz bandwidth). Follow-up campaigns were conducted with the 110-m Robert C. Byrd Green Bank Telescope (GBT) using the L-band and the 800 MHz receivers 2015ursi.confE...4P, and the Murriyang telescope using the 20-cm multi-beam 1996PASA...13..243S and the ultra wide-bandwidth low (UWL) receiving systems 2020PASA...37...12H. The GBT allowed us to monitor FRB sources in the northern sky (Decl. ¿ ) with higher sensitivity than Murriyang. The Murriyang telescope, equipped with the UWL receiver, offered unparalleled frequency coverage from 704 to 4032 MHz, unique among the existing facilities. Additionally, we searched for repetitions using the Five hundred meter Aperture Spherical radio Telescope (FAST) for the source FRB 20171019A. It is pertinent to note that the majority of the ICS-detected FRBs are at southern declinations, not visible from FAST. Searches for repetitions were also undertaken with ASKAP through filler observations. These included repeated observations of the latitude-50 fields, targeted monitoring of FRB sources known to repeat, and specific targeting of ASKAP-detected FRBs exhibiting properties similar to known repeaters, notably the ‘sad-trombone’ pulse morphology 2019ApJ...876L..23H.
In this monitoring program, we collected a total of 1070 hours of high-resolution data using the GBT and Murriyang. We monitored 42 FRB sources, with an average observation time of 25 hours per source. This included 26 FRBs detected in the Fly’s Eye Survey and 15 sources detected in the ICS survey (up to March 2021). We also included the prolific repeater FRB 20201124A in our monitoring campaign to study its polarization properties. The bulk of our follow-up time, totaling 568 hours, was spent with the Parkes/UWL. We followed a standard search methodology, as described in 2021MNRAS.500.2525K.
Our efforts yielded several notable findings. We detected faint repetitions from one of the brightest FRBs found in the fly’s eye survey, FRB 20171019A, using the GBT 2019ApJ...887L..30K. Additionally, we discovered an extremely narrow-band repeat burst from FRB 20190711A, with a spectral occupancy of only 2021MNRAS.500.2525K. Furthermore, using the ASKAP/ICS and the Parkes/UWL, we observed multiple bursts from FRB 20201124A during a period of heightened activity, which included significant circularly polarized emission in one of the bursts, a phenomenon not previously observed in repeating FRBs 2022MNRAS.512.3400K.
Among the 41 ASKAP-detected sources we monitored, only two showed definitive evidence of repetition. The remaining sources did not display any clear signs of repeat activity during our follow-up observations, suggesting either longer inactivity periods or that their repeat bursts are too faint to be detected with current generation of radio telescopes.
We have also used the lack of repetition observed in ASKAP FRB searches and follow up to show that the number density of very strong repeaters must be less than 27 Gpc-3 with 95% confidence 2019MNRAS.486.5934J, and in follow-up observations to limit their repetition rates James2020a. In particular, we have shown that if the likely nearest FRB detected in CRAFT observations (Mahony2018, FRB 20171020, detected in Fly’s Eye mode; ) does repeat, its repetition rate must be less than 0.011 bursts per day above erg LeeWaddell2023. We have also used these measurements, under the assumption that all FRBs do repeat, to derive an FRB rate distribution with James2020b. This has been shown by James2023 to be consistent with observations of both repeating and apparently one-off FRBs by the CHIME/FRB Collaboration CHIME_catalog1_2021.
7.4 Population modelling
The distribution of FRB DMs, redshifts, and luminosities is a function of three factors: the properties of the FRB population (e.g., the intrinsic FRB luminosity function, source evolution, and DM contribution of host galaxies); cosmological parameters such as the Hubble Constant and the baryonic content ; and properties of the detecting instrument, in particular its total sensitivity, beamshape, and DM-dependent biases Macquart2018a; Macquart2018b; Connor2019. Due to ICS FRBs having accurate measurements of all three properties, they have been used in a number of ways to constrain both cosmological and FRB population parameters.
A statistical relationship between FRB DM and luminosity was first established by 2018Natur.562..386S using FRBs detected by Murriyang and ASKAP in fly’s eye mode, and further modelled by Arcus2020. The zDM code has subsequently been developed by the CRAFT and F4 Collaborations to model the redshift, DM, and fluence distribution of FRBs 2022MNRAS.509.4775J, as well as cosmological parameters (see Section 7.5). Using primarily ICS FRBs, it has found evidence for source evolution consistent with the star formation rate, a burst fluence (luminosity) distribution consistent with a power-law with differential slope with 2022MNRAS.516.4862J, and a characteristic maximum FRB energy of erg, assuming a 1 GHz emission bandwidth 2023Sci...382..294R.
These studies have also prompted investigations into possible biases in FREDDA, with 2023MNRAS.523.5109Q and Hoffmann2024 identifying deviations from the DM-dependent sensitivity predicted by Cordes_McLaughlin_2003. When excluding FRB 20191128A from parameter estimation analysis (due to the aforementioned version 2 of FREDDA which detected it reporting incorrect values) however, these deviations result in a very small systematic error on parameter estimates, e.g. of 0.2 km s-1 Mpc-1 for , which is small compared to the statistical errors in the current FRB sample.
7.5 Intergalactic and circumgalactic media
As a large sample of FRBs began to be amassed, it became clear that the burst dispersion measure is correlated with redshift. We first identified this trend by comparing high-fluence FRBs detected in fly’s eye mode with lower-fluence FRBs detected by Murriyang 2018Natur.562..386S. This provided, for the first time, the opportunity to measure the baryon density in the nearby low-redshift () Universe. While is well-measured at high redshift from Big Bang nucleosynthesis, at low redshift nearly 50% of the baryons were undetected in optical and X-ray searches, but thought to reside in the diffuse IGM. The use of extragalactic radio bursts to detect this gas had been suggested as far back as 1965 1965PhRvL..14.1007H; 1973Natur.246..415G, and quantitative predictions based on CDM cosmology in the context of gamma-ray bursts had been made Ioka2003; Inoue2004. However, it was the late Jean-Pierre Macquart who had most strongly espoused using ASKAP to detect FRBs and find these missing baryons as early as 2008, leading to CRAFT being formalised as an ASKAP survey science project in 2009 2010PASA...27..272M.
With a sample of just seven FRBs, we were able to measure the entirety of the baryon content of the Universe 2020Natur.581..391M and resolve the missing baryon problem. The relation between FRB dispersion measure and redshift is now referred to as the ‘Macquart Relation’ in honour of Jean-Pierre Macquart’s key contribution. The technique was extended, first to estimate the Hubble constant (2022MNRAS.516.4862J, km s-1 Mpc-1;), and then to assess fluctuations in the Macquart relation about its mean, which is related to feedback processes 2023arXiv230507022B.
Our discoveries have also enabled us to uniquely probe circumgalactic media, the similarly diffuse media in galaxy haloes that is difficult to study, but which plays an important role in galaxy formation and evolution. The second FRB we localised (FRB 20181112A) was observed to pass through the halo of an intervening galaxy 2019Sci...366..231P. Using the resultant limits on pulse broadening and Faraday rotation, we constrained the turbulence and magnetisation in this galaxy halo. 2020ApJ...901..134S investigated in detail the foreground galaxies towards FRB 20190608B, and 2021ApJ...921..134S undertook a similar analysis towards FRB 20180924B. We have also been working with the FLIMFLAM collaboration 2022ApJ...928....9L to detect galaxy halos along the sightlines to FRBs, with first results on ASKAP FRBs presented in 2024arXiv240200505K.
Figure 18 shows the Macquart relation for the FRBs detected in the ICS survey. The dispersion measure of the FRBs has been corrected for the Milky Way contribution using a model for the Milky Way disk 2002astro.ph..7156C, a Milky Way halo contribution assumed to be 50 pc cm-3, and a host galaxy contribution of 50 pc cm-3. This is compared to expectations (median, and 90% range, and mean) for using the model of 2020Natur.581..391M with km s-1 Mpc-1 and fluctuation parameter . Our FRBs fluctuate significantly about the expectation value given by the relation. Two FRBs lie significantly below the minimum expectation, which we take as evidence of very small host contributions, under-fluctuations in Milky Way contributions, or a combination of the two. In the future it might be possible to use host galaxy or host environment properties to ascertain if DM excesses are local to the burst and tune FRB studies for studies of extragalactic matter. Several FRBs lie significantly above the relation, notably FRB 20210117A, the excess DM of which is attributable to the local environment of the FRB 2023ApJ...948...67B; Simha2023. For a given observed DM, measured redshifts vary by at least a factor of two, which cautions against relying on the redshift inferred by the Macquart relation for modelling purposes. We note that all well-localised ICS FRBs with pc cm-3 have firm host galaxy identifications, while at larger DMs, host galaxy identification becomes redshift-dependent (2023MNRAS.525..994M, e.g. FRB 20210912A;). This introduces potential biases when using high-DM data which must be accounted for in population models 2022MNRAS.516.4862J; 2023MNRAS.523.5006J.
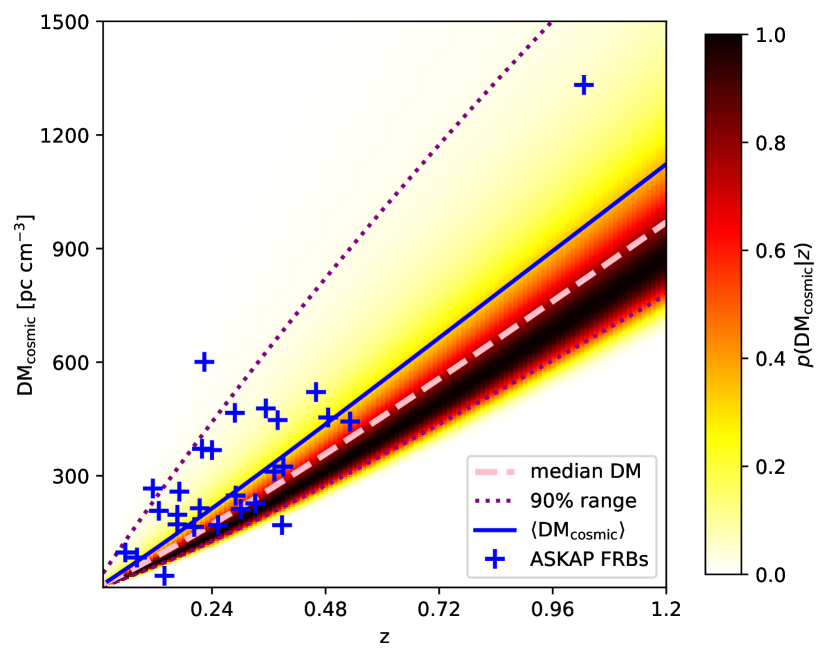
8 FUTURE ASKAP FRB SURVEYS
The incoherent searches were a computationally cheap extension to existing ASKAP data-recording systems intended for radio-interferometric imaging on s time scales. The searches could be conducted on a single GPU, but at the cost of reduced sensitivity relative to array coherent searches by factor . This reduction in sensitivity provides the opportunity to undertake searches with higher yields with ASKAP by commissioning a new FRB detector. Assuming FRBs are a non-evolving population in a Euclidean Universe, we would expect the detection rate to increase by a factor of . Coherent surveys are also likely to be able to access a population of FRBs at higher redshift. A coherent FRB search system (the CRAFT Coherent backend, CRACO) is in the final stages of being scientifically commissioned. The system has started detecting FRBs in offline and real-time searches. Additionally, coherent image plane searches are potentially more sensitive to long duration transients, which decorrelate interference and antenna-based gain variations. New classes of long-duration transients of both Galactic 2022Natur.601..526H; 2024arXiv240612352D and extraGalactic origin 2021arXiv210708463T have been identified. However, the coherent search system will have a smaller field of view so will not be sensitive to FRBs in the outskirts of the primary beam or the side lobes. This will affect FRB detection rates in the outer beams. Even when it is operational we expect to continue with the incoherent sum searches to cross-validate both detectors. The CRACO detector will share the current voltage download system with the ICS detector, delivering high precision astrometry and high time resolution spectro-polarimetry.
These new searches will complement those of other FRB localisation facilities currently operational or planned for the near future. FRB searches with MeerKAT Jankowski2023 and in the future with the SKA probe a narrower field of view at higher sensitivity while sharing access to the southern sky. In the northern hemisphere, outrigger stations on continental-length baselines are being commissioned for the CHIME 2024arXiv240207898L. This will provide the opportunity to localise FRBs to as good as tens of milliarcsecond precision. The DSA-110 interferometer 2019MNRAS.489..919K located at Owens Valley Radio Observatory is the most comparable facility to CRACO in terms of sensitivity. ASKAP will deliver positions with precision a factor of two greater than DSA-110, increasing the reliability of host-galaxy association and enabling more detailed investigations of host galaxy environments.
9 CONCLUSION
The ASKAP incoherent sum survey has demonstrated the importance and significance of localising a population of fast radio bursts.
The survey showed that there is a significant population of FRBs at , largely in star forming galaxies, with many originating coincident with spiral arms. The discoveries will continue to be used to study the structure of the intergalactic medium and the cosmology of the Universe. The survey motivates further surveys for larger populations of FRBs, and FRBs at higher redshift. We have recently started one such survey with ASKAP using new instrumentation, which will increase the burst detection rate and extend our reach in the Universe.
We are grateful to the ASKAP engineering and operations team for their assistance in developing fast radio burst instrumentation for the telescope and supporting the survey. This work uses data obtained from Inyarrimanha Ilgari Bundara / the CSIRO Murchison Radio-astronomy Observatory. We acknowledge the Wajarri Yamaji People as the Traditional Owners and native title holders of the Observatory site. CSIRO’s ASKAP radio telescope is part of the Australia Telescope National Facility (https://ror.org/05qajvd42). Operation of ASKAP is funded by the Australian Government with support from the National Collaborative Research Infrastructure Strategy. ASKAP uses the resources of the Pawsey Supercomputing Research Centre. Establishment of ASKAP, Inyarrimanha Ilgari Bundara, the CSIRO Murchison Radio-astronomy Observatory and the Pawsey Supercomputing Research Centre are initiatives of the Australian Government, with support from the Government of Western Australia and the Science and Industry Endowment Fund. Murriyang, the Parkes radio telescope, is part of the Australia Telescope National Facility (https://ror.org/05qajvd42) which is funded by the Australian Government for operation as a National Facility managed by CSIRO. We acknowledge the Wiradjuri people as the Traditional Owners of the Parkes Observatory site. The Australia Telescope Compact Array is part of the Australia Telescope National Facility (https://ror.org/05qajvd42) which is funded by the Australian Government for operation as a National Facility managed by CSIRO. We acknowledge the Gomeroi people as the Traditional Owners of the Paul Wild Observatory site. The Green Bank Observatory is a facility of the National Science Foundation operated under cooperative agreement by Associated Universities, Inc.
Part of this work was performed on the OzSTAR national facility at Swinburne University of Technology. The OzSTAR program receives funding in part from the Astronomy National Collaborative Research Infrastructure Strategy (NCRIS) allocation provided by the Australian Government, and from the Victorian Higher Education State Investment Fund (VHESIF) provided by the Victorian Government.
Based on observations made with ESO Telescopes at the La Silla Paranal Observatory under programme IDs 0103.A-0101, 105.204W, and 108.21ZF.
Some of the data presented herein were obtained at Keck Observatory, which is operated as a scientific partnership among the California Institute of Technology, the University of California, and the National Aeronautics and Space Administration. The Observatory was made possible by the generous financial support of the W. M. Keck Foundation. The authors wish to recognize and acknowledge the very significant cultural role and reverence that the summit of Maunakea has always had within the Native Hawaiian community. We are most fortunate to have the opportunity to conduct observations from this mountain. We thank Jeff Cooke for assistance with Keck observations.
Some of the observations reported here were obtained at the MMT Observatory, a joint facility of the University of Arizona and the Smithsonian Institution.
W. M. Keck Observatory and MMT Observatory access was supported by Northwestern University and the Center for Interdisciplinary Exploration and Research in Astrophysics (CIERA).
RMS, PAU, and YW acknowledge support through Australian Research Council Future Fellowship FT 190100155. RMS, ATD, and AJ acknowledge support through Australian Research Council Discovery Project DP 220102305. MG and CWJ acknowledge support from the Australian Government through the Australian Research Council Discovery Project DP210102103. SB is supported by a Dutch Research Council (NWO) Veni Fellowship (VI.Veni.212.058). KG acknowledges support through Australian Research Council Discovery Project DP200102243. JXP, AM, ACG, WF, and NT as members of the Fast and Fortunate for FRB Follow-up (F4) team, acknowledge support from NSF grants AST-1911140, AST-1910471 and AST-2206490. ACG, WF, and the Fong Group at Northwestern acknowledges support by the National Science Foundation under grant Nos. AST-1909358, AST-2308182 and CAREER grant No. AST-2047919. WF gratefully acknowledges support by the David and Lucile Packard Foundation, the Alfred P. Sloan Foundation, and the Research Corporation for Science Advancement through Cottrell Scholar Award #28284. Parts of this work were undertaken with support from Australian Research Council Laureate Fellowship FL150100148 and Centre of Excellence CE170100004.
Appendix A FRB properties
Table 1 lists the key properties of the FRBs discovered in the ICS survey. Table 2 lists FRB astrometry, derived interferometrically where possible and using the multi-beam localisation method 2017ApJ...841L..12B. For most of the interferometrically localised FRBs we have reported updated positions derived using the CELEBI pipeline 2023A&C....4400724S. For the the earliest-discovered FRBs (2018094B, 20181112A, 20190102C, 20190608B, 20190611B, and 20190714A), we use positions reported in 2021PASA...38...50D. These FRBs had dedicated astrometric campaigns with the Australian Telescope Compact Array.
| FRB | UTC | DM | DMMW | S/N | |||||
|---|---|---|---|---|---|---|---|---|---|
| (TNS) | (MHz) | (pc cm-3) | (pc cm-3) | (ms) | (Jy ms) | ||||
| 20180924B | 2018-09-24 16:23:12.561 | 1297.5 | 24 | 362.4(2) | 41 | 0.3214 | 21.1 | 2.6 | 18.4(9) |
| 20181112A | 2018-11-12 17:31:16.099 | 1297.5 | 12 | 589.0(3) | 40 | 0.4755 | 19.3 | 3.5 | 28(2) |
| 20190102C | 2019-01-02 05:38:44.002 | 1271.5 | 23 | 364.5(3) | 57 | 0.2912 | 14.0 | 2.6 | 16.0(9) |
| 20190608B | 2019-06-08 22:48:13.367 | 1271.5 | 25 | 339.5(5) | 37 | 0.1178 | 16.1 | 8.6 | 28(2) |
| 20190611B | 2019-06-11 05:45:43.417 | 1271.5 | 25 | 322.2(2) | 57 | 0.3778 | 9.3 | 3.5 | 10(1) |
| 20190711A | 2019-07-11 01:53:41.689 | 1271.5 | 29 | 594.6(5) | 57 | 0.522 | 23.8 | 10.4 | 36(2) |
| 20190714A | 2019-07-14 05:37:13.606 | 1271.5 | 28 | 504.7(3) | 39 | 0.2365 | 10.7 | 3.5 | 13(1) |
| 20191001A | 2019-10-01 16:55:37.237 | 920.5 | 30 | 506.92(4) | 44 | 0.234 | 62.0 | 10.4 | 120(2) |
| 20191228A | 2019-12-28 09:16:18.091 | 1271.5 | 28 | 297.5(5) | 33 | 0.2432 | 22.9 | 17.3 | 67(3) |
| 20200430A | 2020-04-30 15:49:50.041 | 863.5 | 26 | 380.1(2) | 27 | 0.1608 | 16.0 | 13.8 | 35(2) |
| 20200627A | 2020-06-27 19:23:42.754 | 920.5 | 31 | 294(1) | 40 | n/a | 10.8 | 31.1 | 28(3) |
| 20200906A | 2020-09-06 21:40:53.600 | 863.5 | 7 | 577.8(2) | 36 | 0.3688 | 16.1 | 5.2 | 53(3) |
| 20210117A | 2021-01-17 07:51:22.297 | 1271.5 | 25 | 730(1) | 34 | 0.2145 | 27.1 | 5.9 | 36(1) |
| 20210214G | 2021-02-14 05:12:39.696 | 1271.5 | 26 | 398.3(7) | 32 | n/a | 11.6 | 4.7 | 13(3) |
| 20210320C | 2021-03-20 18:38:08.508 | 863.5 | 24 | 384.8(3) | 42 | 0.2797 | 15.3 | 6.9 | 59(4) |
| 20210407E | 2021-04-07 11:20:56.806 | 1271.5 | 24 | 1785.3(3) | 154 | n/h | 19.1 | 9.5 | 36(2) |
| 20210807D | 2021-08-07 15:48:10.256 | 920.5 | 23 | 251.9(2) | 121 | 0.1293 | 47.1 | 17.7 | 100(3) |
| 20210809C | 2021-08-09 10:03:02.954 | 920.5 | 23 | 651.5(3) | 190 | n/a | 16.8 | 23.6 | 45(3) |
| 20210912A | 2021-09-12 13:30:05.680 | 1271.5 | 23 | 1234.5(2) | 31 | n/h | 31.7 | 7.1 | 70(2) |
| 20211127I | 2021-11-27 00:03:51.573 | 1271.5 | 24 | 234.83(8) | 43 | 0.0469 | 37.9 | 3.5 | 35(1) |
| 20211203C | 2021-12-03 02:21:35.468 | 920.5 | 24 | 636.2(4) | 63 | 0.3439 | 14.2 | 16.5 | 30(2) |
| 20211212A | 2021-12-12 19:32:07.768 | 1631.5 | 24 | 206(5) | 27 | 0.0707 | 12.8 | 5.9 | 131(7) |
| 20220105A | 2022-01-05 00:19:18.668 | 1631.5 | 22 | 583(2) | 22 | 0.2785 | 9.8 | 5.9 | 19(2) |
| 20220501C | 2022-05-01 02:11:10.943 | 864.5 | 23 | 449.5(2) | 31 | 0.381 | 16.1 | 9.5 | 32(2) |
| 20220531A | 2022-05-31 16:34:14.274 | 1271.5 | 23 | 727(2) | 70 | n/a | 9.7 | 10.6 | |
| 20220610A | 2022-06-10 22:26:44.313 | 1271.5 | 22 | 1458.1(2) | 31 | 1.015 | 29.8 | 8.3 | 47(2) |
| 20220725A | 2022-07-25 21:54:53.609 | 920.5 | 25 | 290.4(3) | 31 | 0.1926 | 12.7 | 8.3 | 72(6) |
| 20220918A | 2022-09-18 17:33:33.933 | 1271.5 | 25 | 656.8(4) | 41 | 0.491 | 26.4 | 9.5 | 55(2) |
| 20221106A | 2022-11-06 21:27:34.504 | 1631.5 | 21 | 343.8(8) | 35 | 0.2044 | 35.1 | 8.3 | 80(2) |
| 20230521A | 2023-05-21 02:38:08.482 | 831.5 | 23 | 640.2(5) | 42 | n/a | 15.2 | 16.5 | 34(1) |
| 20230526A | 2023-05-26 23:29:47.094 | 1271.5 | 22 | 361.4(2) | 50 | 0.1570 | 22.1 | 4.7 | 34(1) |
| 20230708A | 2023-07-08 15:32:46.979 | 920.5 | 23 | 411.51(5) | 50 | 0.105 | 31.5 | 23.6 | 111(4) |
| 20230718A | 2023-07-18 07:02:08.041 | 1271.5 | 22 | 477.0(5) | 396 | 0.035 | 10.9 | 3.5 | 14(1) |
| 20230731A | 2023-07-31 05:28:41.587 | 1271.5 | 25 | 701.1(3) | 547 | p | 16.6 | 3.5 | 25(1) |
| 20230902A | 2023-09-02 00:48:51.836 | 832.5 | 22 | 440.1(1) | 34 | 0.3619 | 11.8 | 5.9 | 23(2) |
| 20231006A | 2023-10-06 08:14:45.849 | 863.5 | 24 | 509.7(2) | 68 | n/a | 15.2 | 8.3 | 25(1) |
| 20231226A | 2023-12-26 18:46:19.997 | 863.5 | 22 | 329.9(1) | 145 | 0.1569 | 36.7 | 11.8 | 78(3) |
| 20240201A | 2024-02-08 20:00:54.246 | 920.5 | 24 | 374.5(2) | 38 | 0.042729 | 13.9 | 9.5 | 47(3) |
| 20240208A | 2024-02-08 20:00:54.246 | 863.5 | 14 | 260.2(3) | 98 | p | 12.1 | 7.1 | 37(3) |
| 20240210A | 2024-02-10 08:20:02.510 | 863.5 | 23 | 283.73(5) | 31 | 0.023686 | 11.6 | 9.5 | 26(2) |
| 20240304A | 2024-03-04 17:44:55.155 | 863.5 | 24 | 652.6(5) | 30 | p | 12.3 | 11.8 | 34(2) |
| 20240310A | 2024-03-10 07:38:50 | 920.5 | 25 | 601.8(2) | 36 | 0.1270 | 19.1 | 7.1 | 35(2) |
| 20240318A | 2024-03-18 15:14:19.454 | 920.5 | 23 | 256.4(3) | 37 | p | 13.2 | 4.7 | 15(1) |
| FRB | DM | (I) | (I) | (M) | (M) | ||||||||
|---|---|---|---|---|---|---|---|---|---|---|---|---|---|
| (TNS) | (pc cm-3) | (J2000) | (”) | (”) | (”) | (”) | (∘) | (J2000) | (’) | (’) | |||
| 20180924B | 362.4(2) | 0.3214 | 21:44:25.26 | 40:54:00.1 | 0.16 | 0.16 | - | - | - | 21:44:25.5 | 40:54:23 | 3 | 3 |
| 20181112A | 589.0(3) | 0.4755 | 21:49:23.63 | 52:58:15.4 | 3.8 | 2.4 | - | - | - | 21:49:06.4 | 53:17:44 | 9 | 7 |
| 20190102C | 364.5(3) | 0.2912 | 21:29:39.76 | 79:28:32.5 | 0.79 | 0.9 | - | - | - | 21:30:43.3 | 79:29:47 | 3 | 3 |
| 20190608B | 339.5(5) | 0.1178 | 22:16:04.77 | 07:53:53.7 | 0.33 | 0.3 | - | - | - | 22:16:17.0 | 07:53:47 | 3 | 2 |
| 20190611B | 322.2(2) | 0.3778 | 21:22:58.94 | 79:23:51.3 | 1.1 | 1.1 | - | - | - | 21:23:46.5 | 79:21:28 | 3 | 3 |
| 20190711A | 594.6(5) | 0.522 | 21:57:40.13 | 80:21:28.9 | 2.28 | 1.49 | 2.41 | 1.28 | 68.0 | 21:56:06.4 | 80:23:27 | 2 | 2 |
| 20190714A | 504.7(3) | 0.2365 | 12:15:55.13 | 13:01:15.6 | 0.52 | 0.38 | - | - | - | 12:15:36.5 | 13:00:44 | 3 | 2 |
| 20191001A | 506.92(4) | 0.234 | 21:33:24.41 | 54:44:53.9 | 0.46 | 0.43 | 0.46 | 0.43 | 81.9 | 21:32:27.6 | 54:43:20 | 7 | 5 |
| 20191228A | 297.5(5) | 0.2432 | 22:57:43.33 | 29:35:38.8 | 0.78 | 0.82 | 0.84 | 0.76 | 29.3 | 22:56:53.3 | 29:46:10 | 9 | 14 |
| 20200430A | 380.1(2) | 0.1608 | 15:18:49.55 | +12:22:34.8 | 0.43 | 0.46 | 0.46 | 0.43 | 17.2 | 15:18:41.0 | 12:20:23 | 3 | 3 |
| 20200627A | 294(1) | n/a | - | - | - | - | - | - | - | 21:46:47.0 | 39:29:05.0 | 3 | 3 |
| 20200906A | 577.8(2) | 0.3688 | 03:33:58.93 | 14:04:58.8 | 0.49 | 0.49 | 0.51 | 0.47 | 39.0 | 03:34:36.9 | 14:03:33 | 5 | 6 |
| 20210117A | 730(1) | 0.2145 | 22:39:55.01 | 16:09:05.2 | 0.42 | 0.42 | 0.418 | 0.417 | 73.1 | 22:39:36.0 | 16:11:25 | 6 | 11 |
| 20210214G | 398.3(7) | n/a | - | - | - | - | - | - | - | 00:27:43.2 | 05:49:56 | 3 | 4 |
| 20210320C | 384.8(3) | 0.2797 | 13:37:50.10 | 16:07:21.6 | 0.46 | 0.46 | 0.47 | 0.45 | 43.7 | 13:37:16.8 | 15:24:37 | 9 | 9 |
| 20210407E | 1785.3(3) | n/h | 05:14:36.23 | +27:03:29.7 | 0.7 | 0.76 | 0.89 | 0.53 | 39.6 | 05:14:46.3 | 27:04:12 | 4 | 4 |
| 20210807D | 251.9(2) | 0.1293 | 19:56:53.07 | 00:45:44.1 | 0.6 | 0.6 | - | - | - | 19:56:49.0 | 00:48:51 | 2 | 2 |
| 20210809C | 651.5(3) | n/a | - | - | - | - | - | - | - | 18:04:37.7 | 01:19:44 | 3 | 3 |
| 20210912A | 1234.5(2) | n/h | 23:23:10.44 | 30:24:20.1 | 0.44 | 0.43 | 0.44 | 0.43 | 66.2 | 23:24:40.3 | 30:29:33 | 9 | 5 |
| 20211127I | 234.83(8) | 0.0469 | 13:19:14.12 | 18:50:16.5 | 0.51 | 0.51 | 0.51 | 0.51 | 65.1 | 13:19:09.5 | 18:49:28 | 3 | 2 |
| 20211203C | 636.2(4) | 0.3439 | 13:38:15.00 | 31:22:49.0 | 0.44 | 0.44 | 0.44 | 0.44 | 80.7 | 13:37:52.8 | 31:22:04 | 3 | 3 |
| 20211212A | 206(5) | 0.0707 | 10:29:24.19 | +01:21:37.6 | 0.48 | 0.48 | 0.50 | 0.46 | 45.6 | 10:30:40.7 | 01:40:37 | 5 | 4 |
| 20220105A | 583(2) | 0.2785 | 13:55:12.81 | +22:27:58.4 | 1.05 | 1.37 | 1.51 | 0.82 | 30.5 | 13:54:51.4 | 22:29:20 | 11 | 7 |
| 20220501C | 449.5(2) | 0.381 | 23:29:31.00 | 32:29:26.6 | 0.42 | 0.42 | 0.42 | 0.42 | 66.8 | 23:29:46.8 | 32:27:41 | 3 | 3 |
| 20220531A | 727(2) | n/a | - | - | - | - | - | - | - | 19:38:50.2 | 60:17:48 | 10 | 20 |
| 20220610A | 1458.1(2) | 1.016 | 23:24:17.58 | 33:30:49.9 | 0.44 | 0.44 | 0.45 | 0.43 | 53.6 | 23:24:04.4 | 33:30:39 | 3 | 3 |
| 20220725A | 290.4(3) | 0.1926 | 23:33:15.65 | 35:59:24.9 | 0.46 | 0.45 | 0.46 | 0.44 | 56.1 | 23:33:32.1 | 36:07:51 | 10 | 21 |
| 20220918A | 656.8(4) | 0.491 | 01:10:22.11 | 70:48:41.0 | 0.43 | 0.45 | 0.46 | 0.43 | 20.4 | 01:10:57.9 | 70:47:06 | 2 | 2 |
| 20221106A | 343.8(8) | 0.2044 | 03:46:49.15 | 25:34:11.3 | 0.58 | 0.55 | 0.60 | 0.53 | 58.1 | 03:46:38.1 | 25:39:45 | 3 | 3 |
| 20230521A | 640.2(5) | n/a | - | - | - | - | - | - | - | 21:51:00.3 | 02:23:10 | 3 | 4 |
| 20230526A | 361.4(2) | 0.1570 | 01:28:55.83 | 52:43:02.4 | 0.43 | 0.42 | 0.43 | 0.42 | 65.3 | 01:29:27.5 | 52:46:08 | 2 | 2 |
| 20230708A | 411.51(5) | 0.105 | 20:12:27.73 | 55:21:22.6 | 0.46 | 0.44 | 0.467 | 0.433 | 63.2 | 20:12:56.9 | 55:22:59 | 2 | 2 |
| 20230718A | 477.0(5) | 0.035 | 08:32:38.86 | 40:27:07.0 | 0.60 | 0.61 | 0.61 | 0.60 | 20.4 | 08:30:27.1 | 41:00:13 | 18 | 18 |
| 20230731A | 701.1(3) | p | 11:38:24.35 | 56:47:56.6 | 0.55 | 0.56 | 0.56 | 0.55 | 42.6 | 11:38:40.1 | 56:58:19 | 3 | 14 |
| 20230902A | 440.1(1) | 0.3619 | 03:28:33.55 | 47:20:00.6 | 0.68 | 0.57 | 0.69 | 0.55 | 72.3 | 03:29:28.1 | 47:33:46 | 4 | 6 |
| 20231006A | 509.7(2) | n/a | - | - | - | - | - | - | - | 19:44:00.8 | 64:38:56 | 3 | 3 |
| 20231226A | 329.9(1) | 0.1569 | 10:21:27.30 | +06:06:36.9 | 0.48 | 0.51 | 0.511 | 0.479 | 13.2 | 10:21:07.6 | 06:07:46 | 7 | 3 |
| 20240201A | 374.5(2) | 0.042729 | 09:59:37.34 | +14:05:16.9 | 0.48 | 0.51 | 0.52 | 0.46 | 30.0 | 10:01:49.1 | 13:54:49 | 7 | 5 |
| 20240208A | 260.2(3) | p | 10:36:55.11 | 00:57:16.0 | 0.9 | 1.60 | 1.59 | 0.55 | 6.5 | 10:36:46.5 | 00:33:50 | 4 | 10 |
| 20240210A | 283.73(5) | 0.023686 | 00:35:07.10 | 28:16:14.7 | 0.53 | 0.51 | 0.55 | 0.49 | 54.1 | 00:39:55.0 | 27:39:35 | 14 | 7 |
| 20240304A | 652.6(5) | p | 09:05:19.40 | 16:09:59.9 | 0.75 | 0.65 | 0.81 | 0.56 | 57.0 | 09:05:19.3 | 16:13:42 | 7 | 10 |
| 20240310A | 601.8(2) | 0.1270 | 01:10:29.25 | 44:26:21.9 | 0.57 | 0.57 | 0.59 | 0.55 | 48.6 | 01:10:57.7 | 44:24:05 | 3 | 5 |
| 20240318A | 256.4(3) | p | 10:01:34.36 | +37:36:58.9 | 0.54 | 0.79 | 0.82 | 0.50 | 19.3 | 10:01:50.6 | 37:36:49 | 3 | 3 |
Appendix B FRB dynamic spectra
Figures 19 to 23 show the dedispersed dynamic spectra of the FRBs discovered in the ICS survey. The bursts have been arranged in order of increasing dispersion measure. The FRBs are labelled by their internal names.
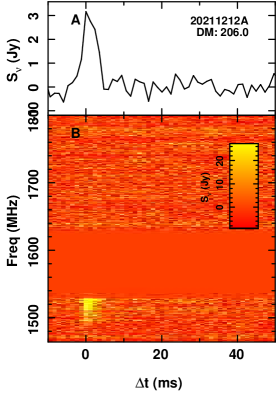 |
 |
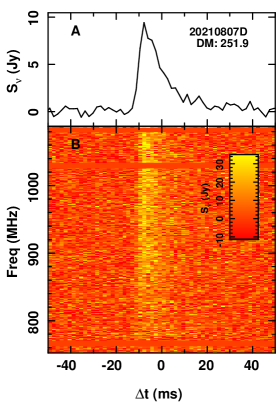 |
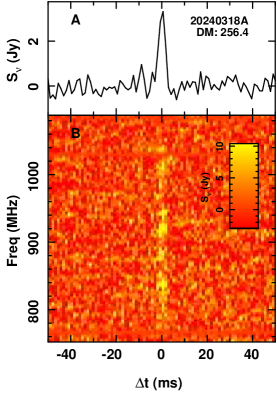 |
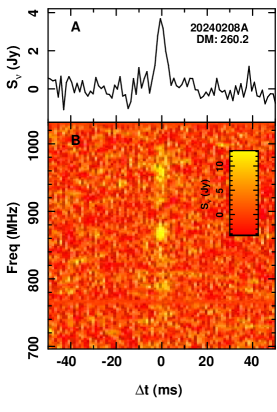 |
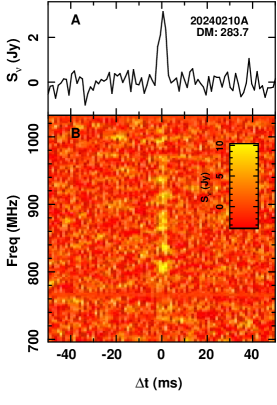 |
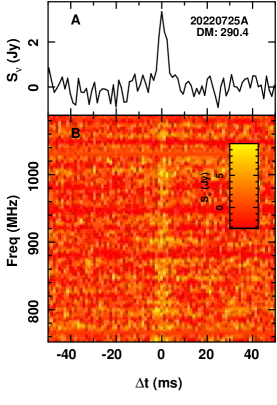 |
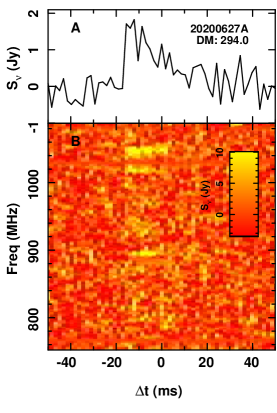 |
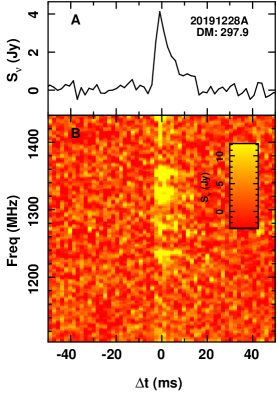 |
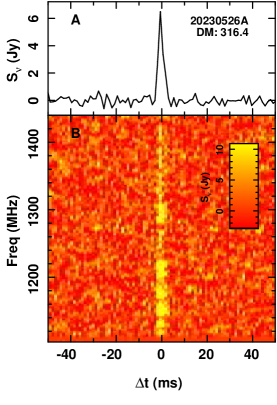 |
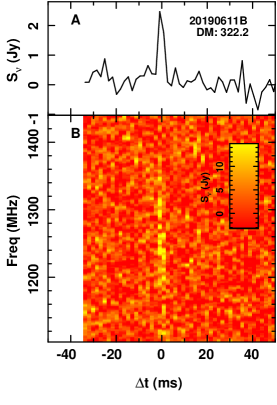 |
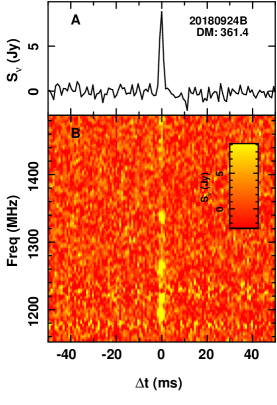 |
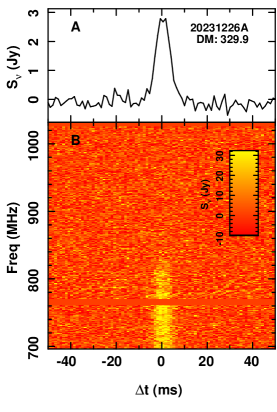 |
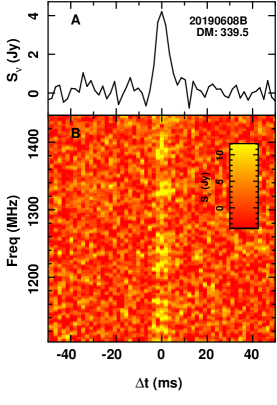 |
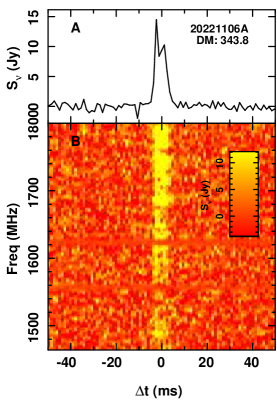 |
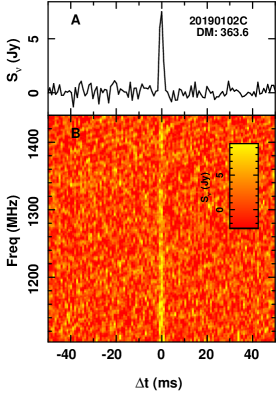 |
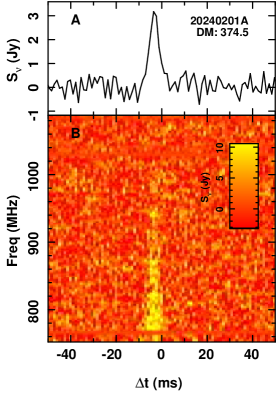 |
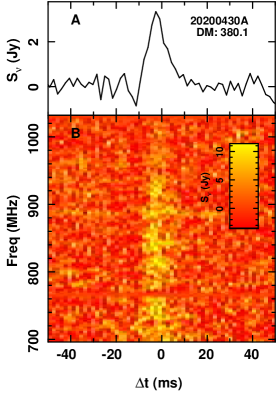 |
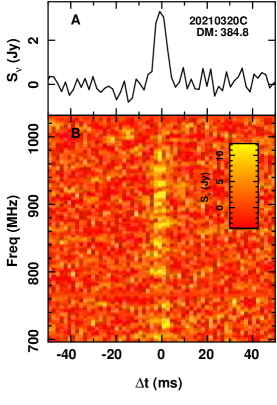 |
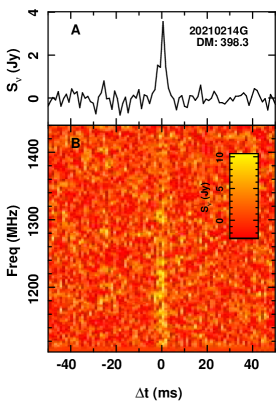 |
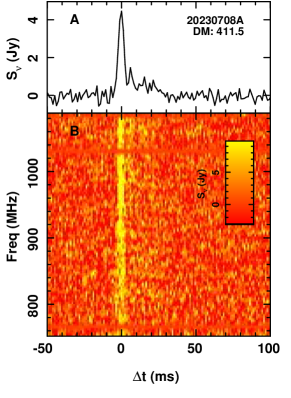 |
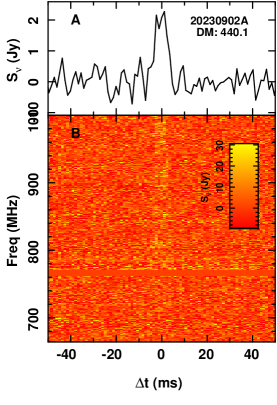 |
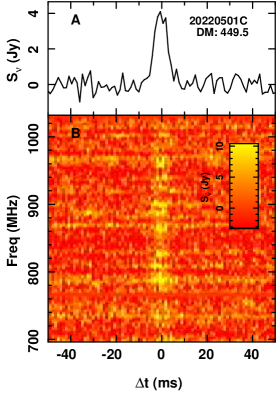 |
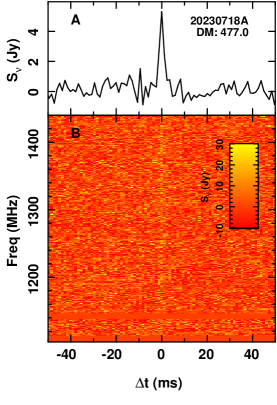 |
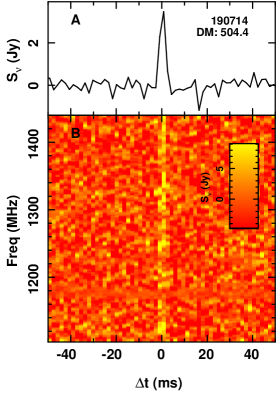 |
 |
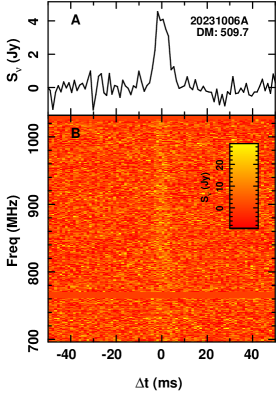 |
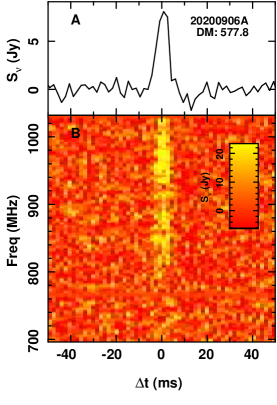 |
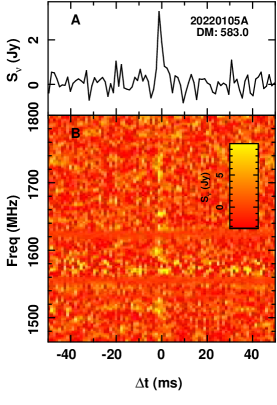 |
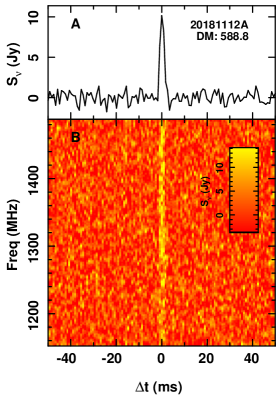 |
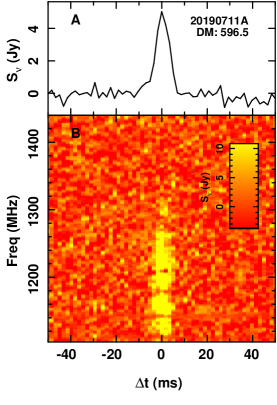 |
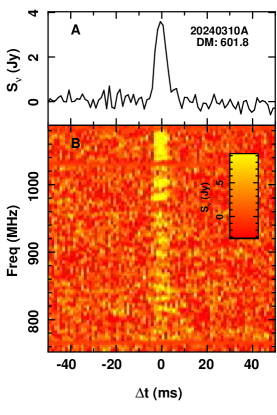 |
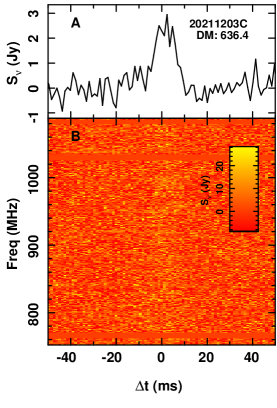 |
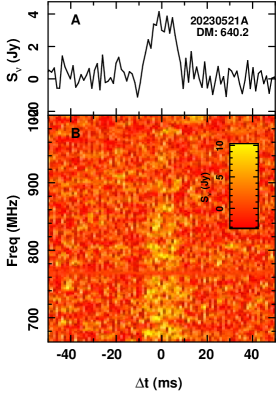 |
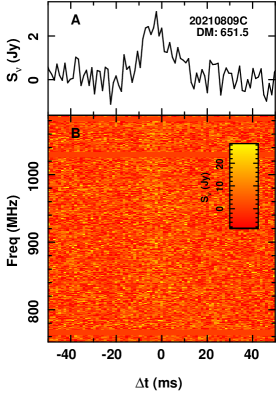 |
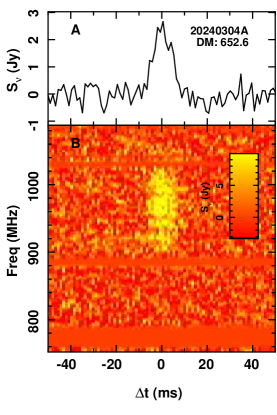 |
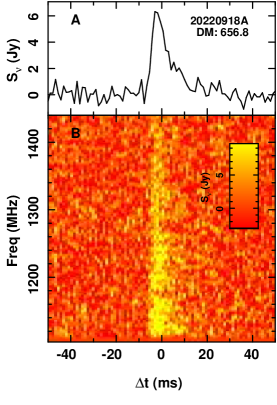 |
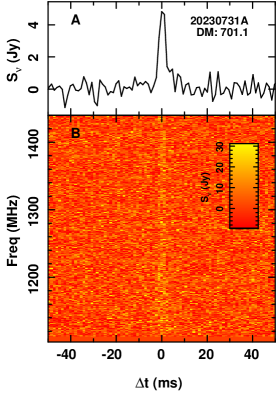 |
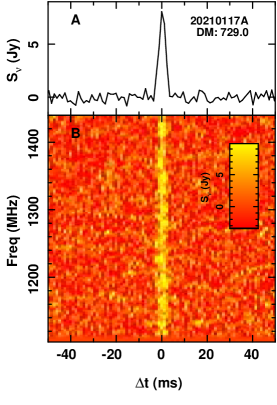 |
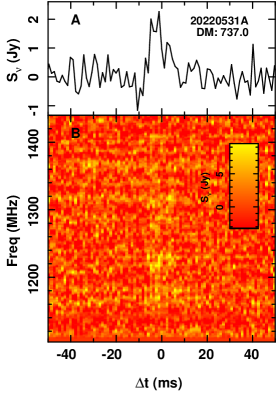 |
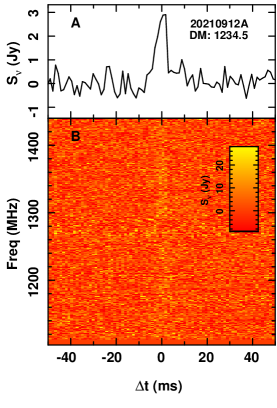 |
 |
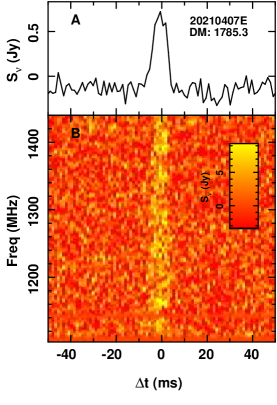 |
Appendix C Host galaxy associations and optical photometry
Tables 3 to 6 present the PATH 2021ApJ...911...95A probabilities of host-galaxy associations for ASKAP-localised FRBs.
Table 7 presented photometry of the FRB host galaxies obtained with VLT/FORS2 and VLT/HAWK-I imaging.
| RAcand | Deccand | mag | ||||
|---|---|---|---|---|---|---|
| (deg) | (deg) | (′′) | (′′) | |||
| FRB20180924B: P(U)=0.0, P(U—x)=0.0000 | ||||||
| 326.1052 | 0.70 | 1.01 | 19.97 | 0.9772 | 1.0000 | |
| 326.1062 | 3.80 | 0.35 | 25.36 | 0.0089 | 0.0000 | |
| 326.1017 | 9.60 | 0.31 | 24.77 | 0.0138 | 0.0000 | |
| FRB20181112A: P(U)=0.0, P(U—x)=0.0000 | ||||||
| 327.3486 | 0.40 | 0.81 | 21.47 | 0.0852 | 0.6164 | |
| 327.3496 | 5.47 | 1.21 | 19.18 | 0.8562 | 0.3820 | |
| 327.3484 | 6.96 | 0.72 | 22.06 | 0.0498 | 0.0017 | |
| 327.3466 | 7.29 | 0.43 | 24.10 | 0.0088 | 0.0000 | |
| FRB20190102C: P(U)=0.0, P(U—x)=-0.0000 | ||||||
| 322.4152 | 0.35 | 0.99 | 21.12 | 0.7835 | 1.0000 | |
| 322.4176 | 6.36 | 0.56 | 22.76 | 0.1761 | 0.0000 | |
| 322.4223 | 4.40 | 0.27 | 25.53 | 0.0197 | 0.0000 | |
| 322.4080 | 5.94 | 0.28 | 25.47 | 0.0207 | 0.0000 | |
| FRB20190608B: P(U)=0.0, P(U—x)=0.0000 | ||||||
| 334.0204 | 2.87 | 1.66 | 17.15 | 0.9941 | 1.0000 | |
| 334.0186 | 4.69 | 0.27 | 24.56 | 0.0007 | 0.0000 | |
| 334.0187 | 6.27 | 0.26 | 24.84 | 0.0006 | 0.0000 | |
| 334.0188 | 9.17 | 0.44 | 22.33 | 0.0046 | 0.0000 | |
| FRB20190611B: P(U)=0.0, P(U—x)=0.0000 | ||||||
| 320.7428 | 2.11 | 0.49 | 23.32 | 0.3345 | 0.9819 | |
| 320.7438 | 3.44 | 0.29 | 25.62 | 0.0569 | 0.0159 | |
| 320.7537 | 5.53 | 0.62 | 25.00 | 0.0894 | 0.0012 | |
| 320.7381 | 4.95 | 0.38 | 24.42 | 0.1389 | 0.0010 | |
| 320.7569 | 9.30 | 0.58 | 24.22 | 0.1612 | 0.0000 | |
| 320.7343 | 8.70 | 0.36 | 24.72 | 0.1100 | 0.0000 | |
| 320.7409 | 9.67 | 0.35 | 26.58 | 0.0295 | 0.0000 | |
| 320.7319 | 9.31 | 0.31 | 26.05 | 0.0422 | 0.0000 | |
| 320.7364 | 9.92 | 0.38 | 26.23 | 0.0373 | 0.0000 | |
| FRB20190711A: P(U)=0.0, P(U—x)=0.0000 | ||||||
| 329.4195 | 0.45 | 0.46 | 23.19 | 0.0055 | 1.0000 | |
| 329.4265 | 6.65 | 0.55 | 17.95 | 0.9931 | 0.0000 | |
| 329.4195 | 5.26 | 0.27 | 24.91 | 0.0014 | 0.0000 | |
| FRB20190714A: P(U)=0.0, P(U—x)=0.0000 | ||||||
| 183.9795 | 0.81 | 0.93 | 19.56 | 0.7996 | 1.0000 | |
| 183.9797 | 6.50 | 0.59 | 23.97 | 0.0137 | 0.0000 | |
| 183.9788 | 7.17 | 0.59 | 21.30 | 0.1405 | 0.0000 | |
| 183.9797 | 6.60 | 0.29 | 24.39 | 0.0099 | 0.0000 | |
| 183.9795 | 8.39 | 0.48 | 22.80 | 0.0363 | 0.0000 | |
| FRB20191001A: P(U)=0.0, P(U—x)=0.0000 | ||||||
| 323.3519 | 1.21 | 1.35 | 17.81 | 0.5081 | 0.9790 | |
| 323.3486 | 6.67 | 1.45 | 17.83 | 0.4919 | 0.0210 | |
| FRB20191228A: P(U)=0.0, P(U—x)=0.0000 | ||||||
| 344.4308 | 1.49 | 0.31 | 22.53 | 0.0104 | 1.0000 | |
| 344.4306 | 6.92 | 0.34 | 18.32 | 0.6907 | 0.0000 | |
| 344.4328 | 9.48 | 0.34 | 20.49 | 0.0698 | 0.0000 | |
| 344.4324 | 9.68 | 0.27 | 19.33 | 0.2290 | 0.0000 | |
| FRB20200430A: P(U)=0.0, P(U—x)=0.0000 | ||||||
| 229.7064 | 0.51 | 0.69 | 20.68 | 0.9639 | 1.0000 | |
| 229.7087 | 8.83 | 0.33 | 24.43 | 0.0361 | 0.0000 | |
| RAcand | Deccand | mag | ||||
|---|---|---|---|---|---|---|
| (deg) | (deg) | (′′) | (′′) | |||
| FRB20200906A: P(U)=0.0, P(U—x)=0.0000 | ||||||
| 53.4958 | 1.26 | 1.45 | 19.57 | 0.9694 | 1.0000 | |
| 53.4959 | 8.04 | 0.42 | 24.78 | 0.0091 | 0.0000 | |
| 53.4944 | 7.98 | 0.46 | 23.67 | 0.0215 | 0.0000 | |
| FRB20201124A: P(U)=0.0, P(U—x)=0.0000 | ||||||
| 77.0145 | 0.71 | 0.94 | 19.52 | 1.0000 | 1.0000 | |
| FRB20210117A: P(U)=0.0, P(U—x)=0.0000 | ||||||
| 339.9795 | 0.94 | 0.51 | 22.95 | 0.5786 | 1.0000 | |
| 339.9799 | 4.51 | 0.26 | 24.71 | 0.1403 | 0.0000 | |
| 339.9794 | 8.94 | 0.51 | 23.82 | 0.2811 | 0.0000 | |
| FRB20210320C: P(U)=0.0, P(U—x)=0.0000 | ||||||
| 204.4589 | 0.46 | 1.02 | 19.23 | 0.9146 | 0.9992 | |
| 204.4580 | 3.64 | 0.61 | 22.13 | 0.0529 | 0.0008 | |
| 204.4583 | 3.79 | 0.49 | 23.49 | 0.0164 | 0.0000 | |
| 204.4608 | 8.44 | 0.26 | 24.73 | 0.0062 | 0.0000 | |
| 204.4586 | 8.59 | 0.25 | 25.58 | 0.0033 | 0.0000 | |
| 204.4612 | 9.61 | 0.31 | 24.64 | 0.0066 | 0.0000 | |
| FRB20210807D: P(U)=0.0, P(U—x)=0.0000 | ||||||
| 299.2201 | 4.83 | 2.32 | 17.35 | 0.7572 | 1.0000 | |
| 299.2225 | 4.35 | 0.29 | 20.59 | 0.0227 | 0.0000 | |
| 299.2194 | 8.32 | 0.86 | 20.69 | 0.0205 | 0.0000 | |
| 299.2233 | 6.80 | 0.33 | 18.53 | 0.1962 | 0.0000 | |
| 299.2228 | 8.77 | 0.20 | 22.60 | 0.0035 | 0.0000 | |
| FRB20211127I: P(U)=0.0, P(U—x)=0.0000 | ||||||
| 199.8089 | 5.41 | 0.34 | 21.73 | 0.1656 | 1.0000 | |
| 199.8109 | 7.04 | 0.48 | 21.17 | 0.2806 | 0.0000 | |
| 199.8114 | 9.44 | 0.41 | 20.76 | 0.4137 | 0.0000 | |
| 199.8060 | 9.83 | 0.35 | 21.91 | 0.1401 | 0.0000 | |
| FRB20211203C: P(U)=0.0, P(U—x)=0.0000 | ||||||
| 204.5626 | 0.57 | 0.57 | 20.29 | 0.8243 | 1.0000 | |
| 204.5625 | 4.82 | 0.64 | 24.46 | 0.0205 | 0.0000 | |
| 204.5611 | 7.75 | 0.58 | 24.47 | 0.0204 | 0.0000 | |
| 204.5652 | 9.39 | 0.66 | 22.52 | 0.1014 | 0.0000 | |
| 204.5628 | 7.00 | 0.25 | 25.16 | 0.0121 | 0.0000 | |
| 204.5648 | 7.13 | 0.27 | 26.11 | 0.0062 | 0.0000 | |
| 204.5634 | 7.74 | 0.28 | 26.72 | 0.0041 | 0.0000 | |
| 204.5602 | 9.96 | 0.28 | 25.30 | 0.0110 | 0.0000 | |
| FRB20211212A: P(U)=0.0, P(U—x)=0.0000 | ||||||
| 157.3509 | 1.46 | 2.72 | 16.21 | 1.0000 | 1.0000 | |
| FRB20220105A: P(U)=0.0, P(U—x)=0.0000 | ||||||
| 208.8038 | 1.81 | 0.90 | 21.53 | 0.5694 | 1.0000 | |
| 208.8022 | 6.69 | 0.35 | 26.09 | 0.0143 | 0.0000 | |
| 208.8048 | 5.02 | 0.28 | 26.18 | 0.0135 | 0.0000 | |
| 208.8049 | 6.29 | 0.37 | 25.58 | 0.0204 | 0.0000 | |
| 208.8056 | 8.17 | 0.25 | 26.95 | 0.0081 | 0.0000 | |
| 208.8057 | 8.69 | 0.65 | 22.54 | 0.2281 | 0.0000 | |
| 208.8017 | 7.99 | 0.47 | 24.94 | 0.0324 | 0.0000 | |
| 208.8057 | 7.94 | 0.32 | 25.36 | 0.0239 | 0.0000 | |
| 208.8013 | 8.54 | 0.56 | 24.21 | 0.0567 | 0.0000 | |
| 208.8010 | 8.36 | 0.38 | 24.91 | 0.0332 | 0.0000 | |
| RAcand | Deccand | mag | ||||
|---|---|---|---|---|---|---|
| (deg) | (deg) | (′′) | (′′) | |||
| FRB20220501C: P(U)=0.0, P(U—x)=0.0000 | ||||||
| 352.3792 | 0.17 | 0.90 | 20.57 | 1.0000 | 1.0000 | |
| FRB20220610A: P(U)=0.0, P(U—x)=0.0000 | ||||||
| 351.0735 | 0.73 | 0.99 | 23.99 | 0.2812 | 1.0000 | |
| 351.0729 | 6.32 | 0.88 | 25.84 | 0.0707 | 0.0000 | |
| 351.0748 | 4.74 | 0.42 | 26.61 | 0.0419 | 0.0000 | |
| 351.0725 | 7.42 | 0.44 | 24.86 | 0.1442 | 0.0000 | |
| 351.0706 | 8.14 | 0.37 | 26.85 | 0.0361 | 0.0000 | |
| 351.0762 | 8.79 | 0.46 | 24.41 | 0.2030 | 0.0000 | |
| 351.0756 | 8.25 | 0.38 | 25.70 | 0.0778 | 0.0000 | |
| 351.0727 | 9.90 | 0.47 | 25.38 | 0.0981 | 0.0000 | |
| 351.0756 | 9.41 | 0.32 | 26.44 | 0.0471 | 0.0000 | |
| FRB20220725A: P(U)=0.0, P(U—x)=0.0000 | ||||||
| 353.3154 | 0.46 | 1.77 | 17.83 | 0.9977 | 1.0000 | |
| 353.3163 | 9.16 | 0.64 | 24.63 | 0.0015 | 0.0000 | |
| 353.3119 | 9.84 | 0.39 | 25.52 | 0.0008 | 0.0000 | |
| FRB20220918A: P(U)=0.0, P(U—x)=0.0000 | ||||||
| 17.5917 | 0.49 | 0.45 | 23.60 | 0.0770 | 0.9965 | |
| 17.5901 | 3.02 | 0.56 | 25.34 | 0.0201 | 0.0035 | |
| 17.5898 | 3.80 | 0.32 | 23.71 | 0.0704 | 0.0000 | |
| 17.5932 | 3.74 | 0.26 | 25.73 | 0.0152 | 0.0000 | |
| 17.5888 | 7.09 | 0.46 | 26.13 | 0.0116 | 0.0000 | |
| 17.5916 | 9.05 | 0.63 | 25.44 | 0.0187 | 0.0000 | |
| 17.6002 | 9.56 | 0.75 | 23.02 | 0.1245 | 0.0000 | |
| 17.5935 | 7.40 | 0.26 | 25.88 | 0.0137 | 0.0000 | |
| 17.5974 | 8.90 | 0.47 | 21.77 | 0.3760 | 0.0000 | |
| 17.5957 | 7.32 | 0.23 | 26.10 | 0.0118 | 0.0000 | |
| 17.5895 | 9.76 | 0.52 | 23.96 | 0.0577 | 0.0000 | |
| 17.5844 | 9.49 | 0.46 | 24.65 | 0.0336 | 0.0000 | |
| 17.5887 | 9.43 | 0.35 | 22.81 | 0.1492 | 0.0000 | |
| 17.5865 | 9.83 | 0.31 | 25.32 | 0.0204 | 0.0000 | |
| FRB20221106A: P(U)=0.0, P(U—x)=0.0000 | ||||||
| 56.7045 | 1.33 | 2.50 | 18.34 | 0.9446 | 0.9708 | |
| 56.7057 | 3.24 | 1.07 | 21.07 | 0.0554 | 0.0292 | |
| FRB20230526A: P(U)=0.0, P(U—x)=0.0000 | ||||||
| 22.2326 | 0.51 | 0.78 | 21.15 | 0.5445 | 0.9970 | |
| 22.2311 | 5.52 | 0.95 | 21.49 | 0.3952 | 0.0030 | |
| 22.2299 | 8.93 | 0.55 | 24.31 | 0.0353 | 0.0000 | |
| 22.2323 | 8.17 | 0.30 | 24.76 | 0.0250 | 0.0000 | |
| FRB20230708A: P(U)=0.0, P(U—x)=-0.0000 | ||||||
| 303.1155 | 0.14 | 0.58 | 22.73 | 0.0873 | 1.0000 | |
| 303.1165 | 2.59 | 0.26 | 26.70 | 0.0043 | 0.0000 | |
| 303.1177 | 4.62 | 0.41 | 23.74 | 0.0374 | 0.0000 | |
| 303.1111 | 9.11 | 0.96 | 20.35 | 0.8053 | 0.0000 | |
| 303.1185 | 9.97 | 0.56 | 23.18 | 0.0594 | 0.0000 | |
| 303.1174 | 8.49 | 0.27 | 26.13 | 0.0063 | 0.0000 | |
| RAcand | Deccand | mag | ||||
|---|---|---|---|---|---|---|
| (deg) | (deg) | (′′) | (′′) | |||
| FRB20230731A: P(U)=0.0, P(U—x)=0.0000 | ||||||
| 174.6026 | 2.30 | 0.28 | 20.62 | 0.0833 | 1.0000 | |
| 174.5999 | 5.01 | 0.29 | 20.57 | 0.0878 | 0.0000 | |
| 174.5994 | 5.85 | 0.39 | 19.88 | 0.1751 | 0.0000 | |
| 174.6019 | 5.44 | 0.29 | 20.67 | 0.0793 | 0.0000 | |
| 174.5974 | 7.98 | 0.68 | 20.15 | 0.1331 | 0.0000 | |
| 174.5974 | 8.38 | 0.64 | 20.08 | 0.1427 | 0.0000 | |
| 174.6059 | 8.75 | 0.38 | 19.84 | 0.1820 | 0.0000 | |
| 174.6025 | 8.83 | 0.29 | 20.65 | 0.0806 | 0.0000 | |
| 174.6059 | 8.93 | 0.22 | 21.49 | 0.0361 | 0.0000 | |
| FRB20230902A: P(U)=0.0, P(U—x)=0.0000 | ||||||
| 52.1400 | 0.54 | 0.68 | 21.52 | 0.6517 | 1.0000 | |
| 52.1401 | 4.35 | 0.38 | 24.36 | 0.0575 | 0.0000 | |
| 52.1382 | 5.98 | 0.41 | 24.82 | 0.0405 | 0.0000 | |
| 52.1413 | 7.99 | 0.65 | 23.17 | 0.1512 | 0.0000 | |
| 52.1431 | 8.61 | 0.60 | 24.19 | 0.0658 | 0.0000 | |
| 52.1428 | 8.61 | 0.31 | 26.75 | 0.0105 | 0.0000 | |
| 52.1432 | 8.73 | 0.32 | 25.61 | 0.0228 | 0.0000 | |
| FRB20231226A: P(U)=0.0, P(U—x)=0.0000 | ||||||
| 155.3639 | 1.99 | 1.79 | 19.01 | 0.9394 | 1.0000 | |
| 155.3619 | 7.05 | 0.61 | 22.03 | 0.0469 | 0.0000 | |
| 155.3640 | 7.14 | 0.33 | 25.75 | 0.0024 | 0.0000 | |
| 155.3630 | 8.43 | 0.43 | 25.10 | 0.0038 | 0.0000 | |
| 155.3628 | 7.47 | 0.24 | 26.39 | 0.0015 | 0.0000 | |
| 155.3652 | 9.16 | 0.52 | 24.48 | 0.0060 | 0.0000 | |
| FRB20240201A: P(U)=0.0, P(U—x)=0.0000 | ||||||
| 149.9072 | 6.25 | 0.72 | 26.17 | 1.0000 | 1.0000 | |
| FRB20240210A: P(U)=0.0, P(U—x)=0.0000 | ||||||
| 8.7770 | 9.42 | 6.42 | 15.13 | 0.8425 | 1.0000 | |
| 8.7840 | 17.80 | 2.62 | 22.04 | 0.0004 | 0.0000 | |
| 8.7779 | 17.27 | 1.59 | 20.43 | 0.0018 | 0.0000 | |
| FRB20240304A: P(U)=0.0, P(U—x)=0.0000 | ||||||
| 136.3305 | 1.84 | 0.97 | 21.08 | 1.0000 | 1.0000 | |
| FRB20240310A: P(U)=0.0, P(U—x)=0.0000 | ||||||
| 17.6219 | 0.39 | 1.06 | 20.16 | 0.7637 | 0.9884 | |
| 17.6228 | 3.65 | 0.93 | 21.80 | 0.1565 | 0.0116 | |
| 17.6230 | 5.67 | 0.61 | 25.28 | 0.0090 | 0.0000 | |
| 17.6241 | 5.61 | 0.49 | 23.86 | 0.0266 | 0.0000 | |
| 17.6206 | 5.44 | 0.30 | 26.59 | 0.0036 | 0.0000 | |
| 17.6210 | 6.39 | 0.34 | 26.16 | 0.0049 | 0.0000 | |
| 17.6190 | 8.85 | 0.55 | 24.69 | 0.0139 | 0.0000 | |
| 17.6242 | 8.75 | 0.37 | 25.64 | 0.0070 | 0.0000 | |
| 17.6237 | 7.96 | 0.31 | 26.01 | 0.0054 | 0.0000 | |
| 17.6251 | 9.51 | 0.35 | 25.22 | 0.0094 | 0.0000 | |
| FORS2 | HAWK-I | |||||||
|---|---|---|---|---|---|---|---|---|
| FRB | ||||||||
| FRB 20180924B | – | – | – | – | – | – | ||
| FRB 20181112A | – | – | – | – | – | – | ||
| FRB 20190102C | – | – | – | – | ||||
| FRB 20190608B | – | – | – | – | – | – | ||
| FRB 20190611B | – | – | – | – | – | |||
| FRB 20190711A | – | – | – | – | – | – | ||
| FRB 20190714A | – | – | – | – | – | – | ||
| FRB 20191001A | – | – | – | – | – | – | ||
| FRB 20191228A | – | – | – | – | – | – | ||
| FRB 20200430A | – | – | – | – | – | – | ||
| FRB 20200906A | – | – | – | – | – | – | ||
| FRB 20210117A | – | – | – | |||||
| FRB 20210320C | – | – | – | – | – | – | ||
| FRB 20210807D | – | – | – | – | – | – | ||
| FRB 20211127I | – | – | – | – | – | – | ||
| FRB 20211203C | – | – | – | – | – | – | ||
| FRB 20211212A | – | – | – | – | – | – | ||
| FRB 20220105A | – | – | – | – | – | – | ||
| FRB 20220501C | – | – | – | – | – | – | ||
| FRB 20220610A | – | – | – | – | ||||
| FRB 20220725A | – | – | – | – | ||||
| FRB 20220918A | – | – | – | – | – | – | ||
| FRB 20221106A | – | – | – | – | – | – | ||
| FRB 20230526A | – | – | – | – | – | – | ||
| FRB 20230708A | – | – | – | – | – | – | ||
| FRB 20230902A | – | – | – | – | – | – | ||
| FRB 20231226A | – | – | – | – | – | – | ||
| FRB 20240201A | – | – | – | – | – | – | ||
| FRB 20240304A | – | – | – | – | – | – | ||
| FRB 20240310A | – | – | – | – | – | – | – | |