Constructing Per-Shot Bitrate Ladders using Visual Information Fidelity
Abstract
Video service providers need their delivery systems to be able to adapt to network conditions, user preferences, display settings, and other factors. HTTP Adaptive Streaming (HAS) provides numerous options that allow dynamic switching between different video representations to simultaneously enhance bandwidth consumption and users’ streaming experiences. Fixed bitrate ladders as employed in the past are limited in their ability to deliver high-quality visual experiences while minimizing bitrate budgets. Adaptive video streaming allows for the construction of bitrate ladders that deliver perceptually optimized visual quality to viewers under bandwidth constraints. Two common approaches to adaptation are per-title encoding and per-shot encoding. The former involves encoding each program, movie, or other content in a manner that is perceptually- and bandwidth-optimized for that content but is otherwise fixed. The latter is a more granular approach that optimizes the encoding parameters for each scene or shot (however defined) of a video content. Per-shot video encoding, as pioneered by Netflix, encodes on a per-shot basis using the Dynamic Optimizer (DO) [1]. Under the control of the VMAF perceptual video quality prediction engine, the DO delivers high-quality videos to millions of viewers at considerably reduced bitrates than per-title or fixed bitrate ladder encoding. A variety of per-title and per-shot encoding techniques have been recently proposed that seek to reduce computational overhead and to construct optimal bitrate ladders more efficiently using low-level features extracted from source videos. Here we develop a perceptually optimized method of constructing optimal per-shot bitrate and quality ladders, using an ensemble of low-level features and Visual Information Fidelity (VIF) features extracted from different scales and subbands. We compare the performance of our model, which we call VIF-ladder, against other content-adaptive bitrate ladder prediction methods, counterparts of them that we designed to construct quality ladders, a fixed bitrate ladder, and bitrate ladders constructed via exhaustive encoding using Bjontegaard delta metrics.
Index Terms:
Adaptive Streaming, Bitrate Ladder Construction, Video Processing, Gaussian Mixture ModelsI Introduction
A recent report on video streaming [2] stated that as of 2024, video constitutes about 74% of mobile traffic, and is predicted to increase more than 80% by 2029. While there is a noticeable increase in user-generated content (UGC) uploaded to social media platforms, the majority of video traffic can be attributed to Video-on-Demand (VoD) services offered by Netflix, Meta, YouTube, Prime Video, and others. VoD service providers deliver videos to users that are scaled and/or compressed based on their display settings, network conditions, device capabilities, available bandwidth, and buffer state. Video service providers invest substantial resources towards optimizing video compression and delivery pipelines both to decrease video transmission costs and to enhance end-user satisfaction.
In recent years, HTTP Adaptive Streaming has emerged as an effective and popular standard for video content delivery, and HTTP Live Streaming (HLS) bitrate ladders [3] have become widely adopted go-to ways of adaptive bitrate streaming of all kinds of video content. HLS [3], also known as ‘one-size-fits-all’ is designed to allow adaptation to various video characteristics and network conditions. It allows the selection of different sets of video encoding parameters, based on network conditions and user preferences, to ensure a high Quality of Experience (QoE) when displayed. However, a disadvantage of HLS [3] is that the encoding settings remain the same, independent of changes in the video content, thereby not guaranteeing an optimal bitrate ladder for a given video.
Recently introduced content-optimized per-shot encoding techniques [4, 5, 6] provide bitrate savings and better QoE than existing fixed bitrate ladders (HLS). Per-shot encoding techniques achieve optimal encoding by constructing a convex hull on each shot of the video. Each video title to be streamed is partitioned into shorter scenes or shots of relatively shorter durations which are encoded independently of one another. Generally, shots consist of frames that are relatively homogenous in content, hence suitable for encoding using locally fixed parameters. Each shot is encoded multiple times using a variety of bitrate-optimized encoding parameters, usually under a perceptual quality criterion, to construct a convex hull. The convex hull is where an encoding point reaches Pareto efficiency: it consists of optimal bitrate-resolutions pairs that display the highest perceptual quality at each of a set of typical bitrates. Given the extensive space of encoding settings, including spatial resolutions, bitrates, QPs or CRFs, codecs, etc, each shot is compressed under a quality criterion such as SSIM [7] multiple times when constructing the convex hull, which requires a significant amount of resources and time.
For example, assuming a single shot, and given a specific video codec, a set of resolutions, and bitrates, constructing a Pareto-front requires performing compression and quality estimation times. To achieve optimal performance on transmission of a single diverse video containing multiple shots/scenes, the convex hull construction needs to be repeated many times. This, in the context of per-shot encoding, which necessitates the construction of a convex hull on each individual shot, the terms ‘shot’ and ‘video’ along with ‘convex hull’ and ‘Pareto front’ will be used interchangeably throughout.
Considering the above, we present content-gnostic techniques for predicting optimal bitrate and quality ladders for various adaptive streaming services. Our proposed methods extract features from uncompressed videos at their original resolution without any compression or quality estimation, and use machine learning models to predict the quality or bitrate of a compressed video at a given resolution and bitrate or quality, respectively. With these predicted quality or bitrate values, we construct a suitable bitrate or quality ladder that yields performance comparable to a reference bitrate ladder for a given video. The reference bitrate ladder of a video is sampled from the Pareto front, which is constructed by exhaustive encoding of the video at different resolutions and rate control settings. Our proposed methods offer a distinct advantage in terms of reduced complexity, as compared to the compute-intensive process involved in constructing a reference bitrate ladder.
I-A Contributions
In preliminary work [8] presented in the conference paper, we experimented with features drawn from Visual Information Fidelity (VIF) [9] to predict the quality of videos compressed by libx265, given resolution and bitrate. We utilized multiple VIF feature sets extracted from different scales and subbands of a video to predict per-shot bitrate ladders. We extracted bitrate and VMAF scores from videos, compressed using libx265 with medium preset, across eight different spatial resolutions and 33 different CRFs, to train an Extra-Trees regressor to predict the VMAF scores of compressed videos based on VIF features, bitrate, width, and height. We later used the regressor to create a per-shot bitrate ladder for a given video. We have since greatly expanded this preliminary work, making the following new contributions:
-
•
We study the effectiveness of our previous quality prediction models under specific quality constraints.
-
•
Similar to quality prediction models, we develop bitrate prediction models using the same VIF features to construct per-shot quality ladders.
-
•
We study the performance of an ensemble of low-level features and VIF feature sets on predicting the quality and bitrate of compressed videos, and subsequently, on predicting per-shot bitrate and quality ladders, respectively.
-
•
Furthermore, we compare the effectiveness of our techniques against popular content-adaptive bitrate ladder construction methods. We also design counterparts of these existing models, configured to instead predict quality ladders. These models are also included in our comparative study.
-
•
Finally, we report the performance of the compared models against standard methods, including fixed bitrate ladders and reference bitrate ladders constructed by exhaustive encoding.
I-B Paper Organization
The rest of the paper is organized in the following structure. In Section II, we discuss previous work related to the construction of per-shot bitrate ladders. Section III discusses the dataset and experimental settings we used in our simulations. We study the efficacy of combining quality-aware VIF feature sets with content-aware low-level features in Section IV. In Section V, we discuss the experimental comparisons with prior methods, as well as against their designed quality ladder predictive counterparts, and correction techniques. The paper concludes in Section VI along with future directions of research.
II Related Work
As discussed in the Introduction, although a fixed bitrate ladder is designed considering various video characteristics, network conditions, resolutions, and bitrates, it is still content-independent. Despite the noteworthy performance of these ‘one-size-fits-all’ fixed bitrate ladders across a broad spectrum of videos, optimization of the encoding settings at the shot level makes it possible to further enhance the Quality of Experience (QoE) while also achieving bitrate savings. The per-shot encoding framework introduced by Netflix [4, 6, 5] performs search in encoding parameter space to determine optimal encoding settings for each shot. Over the past few years, a variety of techniques have been introduced to facilitate the construction of per-shot bitrate ladders, towards reducing reliance on exhaustive encoding methods.
For example, the authors of [10], modeled PSNR as a linear function of bitrate. They extracted features including gray-level co-occurrence matrices (GLCM), temporal coherence (TC) measures, and normalized cross-correlation (NCC) to predict the coefficients of the linear function using a support vector regressor (SVR). The same authors extended their work in [11] by considering a bigger feature set and by investigating the ability of various parametric functions to fit Rate-Quality (RQ) curves. They concluded that although third-degree polynomials fit rate-quality (RQ) curves well, an exponential function was able to achieve better BD rate savings with less complexity. In [12] and [13], the authors constructed optimal Rate-PSNR curves using cross-over points. At each cross-over point, switching from a lower resolution to a higher resolution occurs given increases in bitrate. The authors modeled cross-over points between two resolutions as a pair of QPs, with a single QP defined at each resolution. Low-level features like GLCM and TC are used to predict cross-over QPs. The authors in [14] used ‘knee-points’ to construct optimal Rate-VMAF curves. The knee points were defined as QPs where a rate-quality curve has the highest curvature. They used features like the GLCM and NCC to predict the knee QPs. Instead of modeling cross-over points as QPs, the authors in [15] modeled cross-over points as bitrates. They experimented with shallow machine learning models like Extra-Trees regressor, XGBoost, and Gaussian Process regression, using features like GLCM, TC, SI, TI, and CF along with semantic-aware deep learning models like ResNet50 and VGG16, to predict cross-over bitrates between consecutive resolutions. They found the Extra-Trees regressor to perform the best.
In [16], the authors modeled VMAF of a compressed video as a linear regression of bitrate and DCT-based texture energy features. They reported a good correlation against VMAF scores with the coefficients of the linear regression being allowed to vary with resolution. The authors later used this quality prediction model to construct per-shot bitrate ladders. The same authors extended their work in [17] by predicting VMAF, CRFs, and JND thresholds on compressed videos using the same DCT-based energy features, luminescence, and bitrate. The number of predicted encoding settings was further reduced during bitrate ladder construction using JND thresholds predicted using GLCM features, bitstream features, etc. The authors in [18] combined a classifier that predicts optimal resolution with a regressor that predicts cross-over bitrates, to create an ensemble aggregator that constructs bitrate ladders. The authors also used low-level spatio-temporal features like GLCM and TC. Instead of designing models to construct optimal Pareto-fronts, the authors of [19] used deep learning models to predict points on the Pareto-Front, by modeling the problem as a multi-label classification problem. The authors deployed a deep learning model with Conv-GRU units to extract spatio-temporal features on the videos before compression. Techniques like incremental learning to achieve tractable memory footprints, and transfer learning to analyze wide ranges of content complexities were used to augment training of their deep learning models.
In earlier preliminary work [8], we trained an Extra-Trees regressor on multiple Visual Information Fidelity (VIF) [9] feature sets extracted over different scales and subbands of source videos. In addition to the VIF features, we used metadata like bitrates, and the widths, and heights of the compressed videos to predict the VMAF of the corresponding compressed videos. We used these models to construct per-shot bitrate ladders. One advantage of using VIF feature sets is that they are readily available when using widely deployed full-reference (FR) quality estimation model VMAF.
III Dataset and Experimental Settings
III-A Dataset
Our video data was drawn from the BVT-100 4K dataset used in [12],[13]. This dataset consists of video sequences derived from various public sources including Netflix Chimera [20], Ultra Video Group [21], Harmonic Inc. [22], SJTU [23], and AWS Elemental [24]. All of the video sequences were converted to 4:2:0 chroma subsampling, spatially cropped to UHD (38402160 pixels), and temporally clipped to 64 frames. Each video was constrained to contain a single scene (without scene cuts). The majority of the test videos have frame rates of 60 fps and bit depths of 10 bits/pixel of luma and chroma. Fig. 1 shows sample frames of the videos comprising in the dataset.

III-B Experiment Settings
We used ffmpeg to perform compression and quality estimation. The videos were compressed using the libx265 codec with the medium preset. We used VMAF [25] to predict the perceptual qualities of the compressed videos. VMAF has been shown to exhibit higher correlations with human judgments than PSNR. We computed VMAF after upscaling the compressed video to its original resolution (38402160). We used the Lanczos interpolation to conduct spatial upscaling and downscaling (from 2160p). We considered eight different resolutions ranging from 2160p to 288p: 38402160, 25601440, 19201080, 1280720, 960540, 768432, 640360, and 512288 all of which have aspect ratio of about 16 9. We implemented constant-quality encoding by adjusting CRFs, aiming to maintain consistent visual quality while maximizing compression efficiency. We sampled libx265 CRF values ranging from 15 to 45 (inclusive).
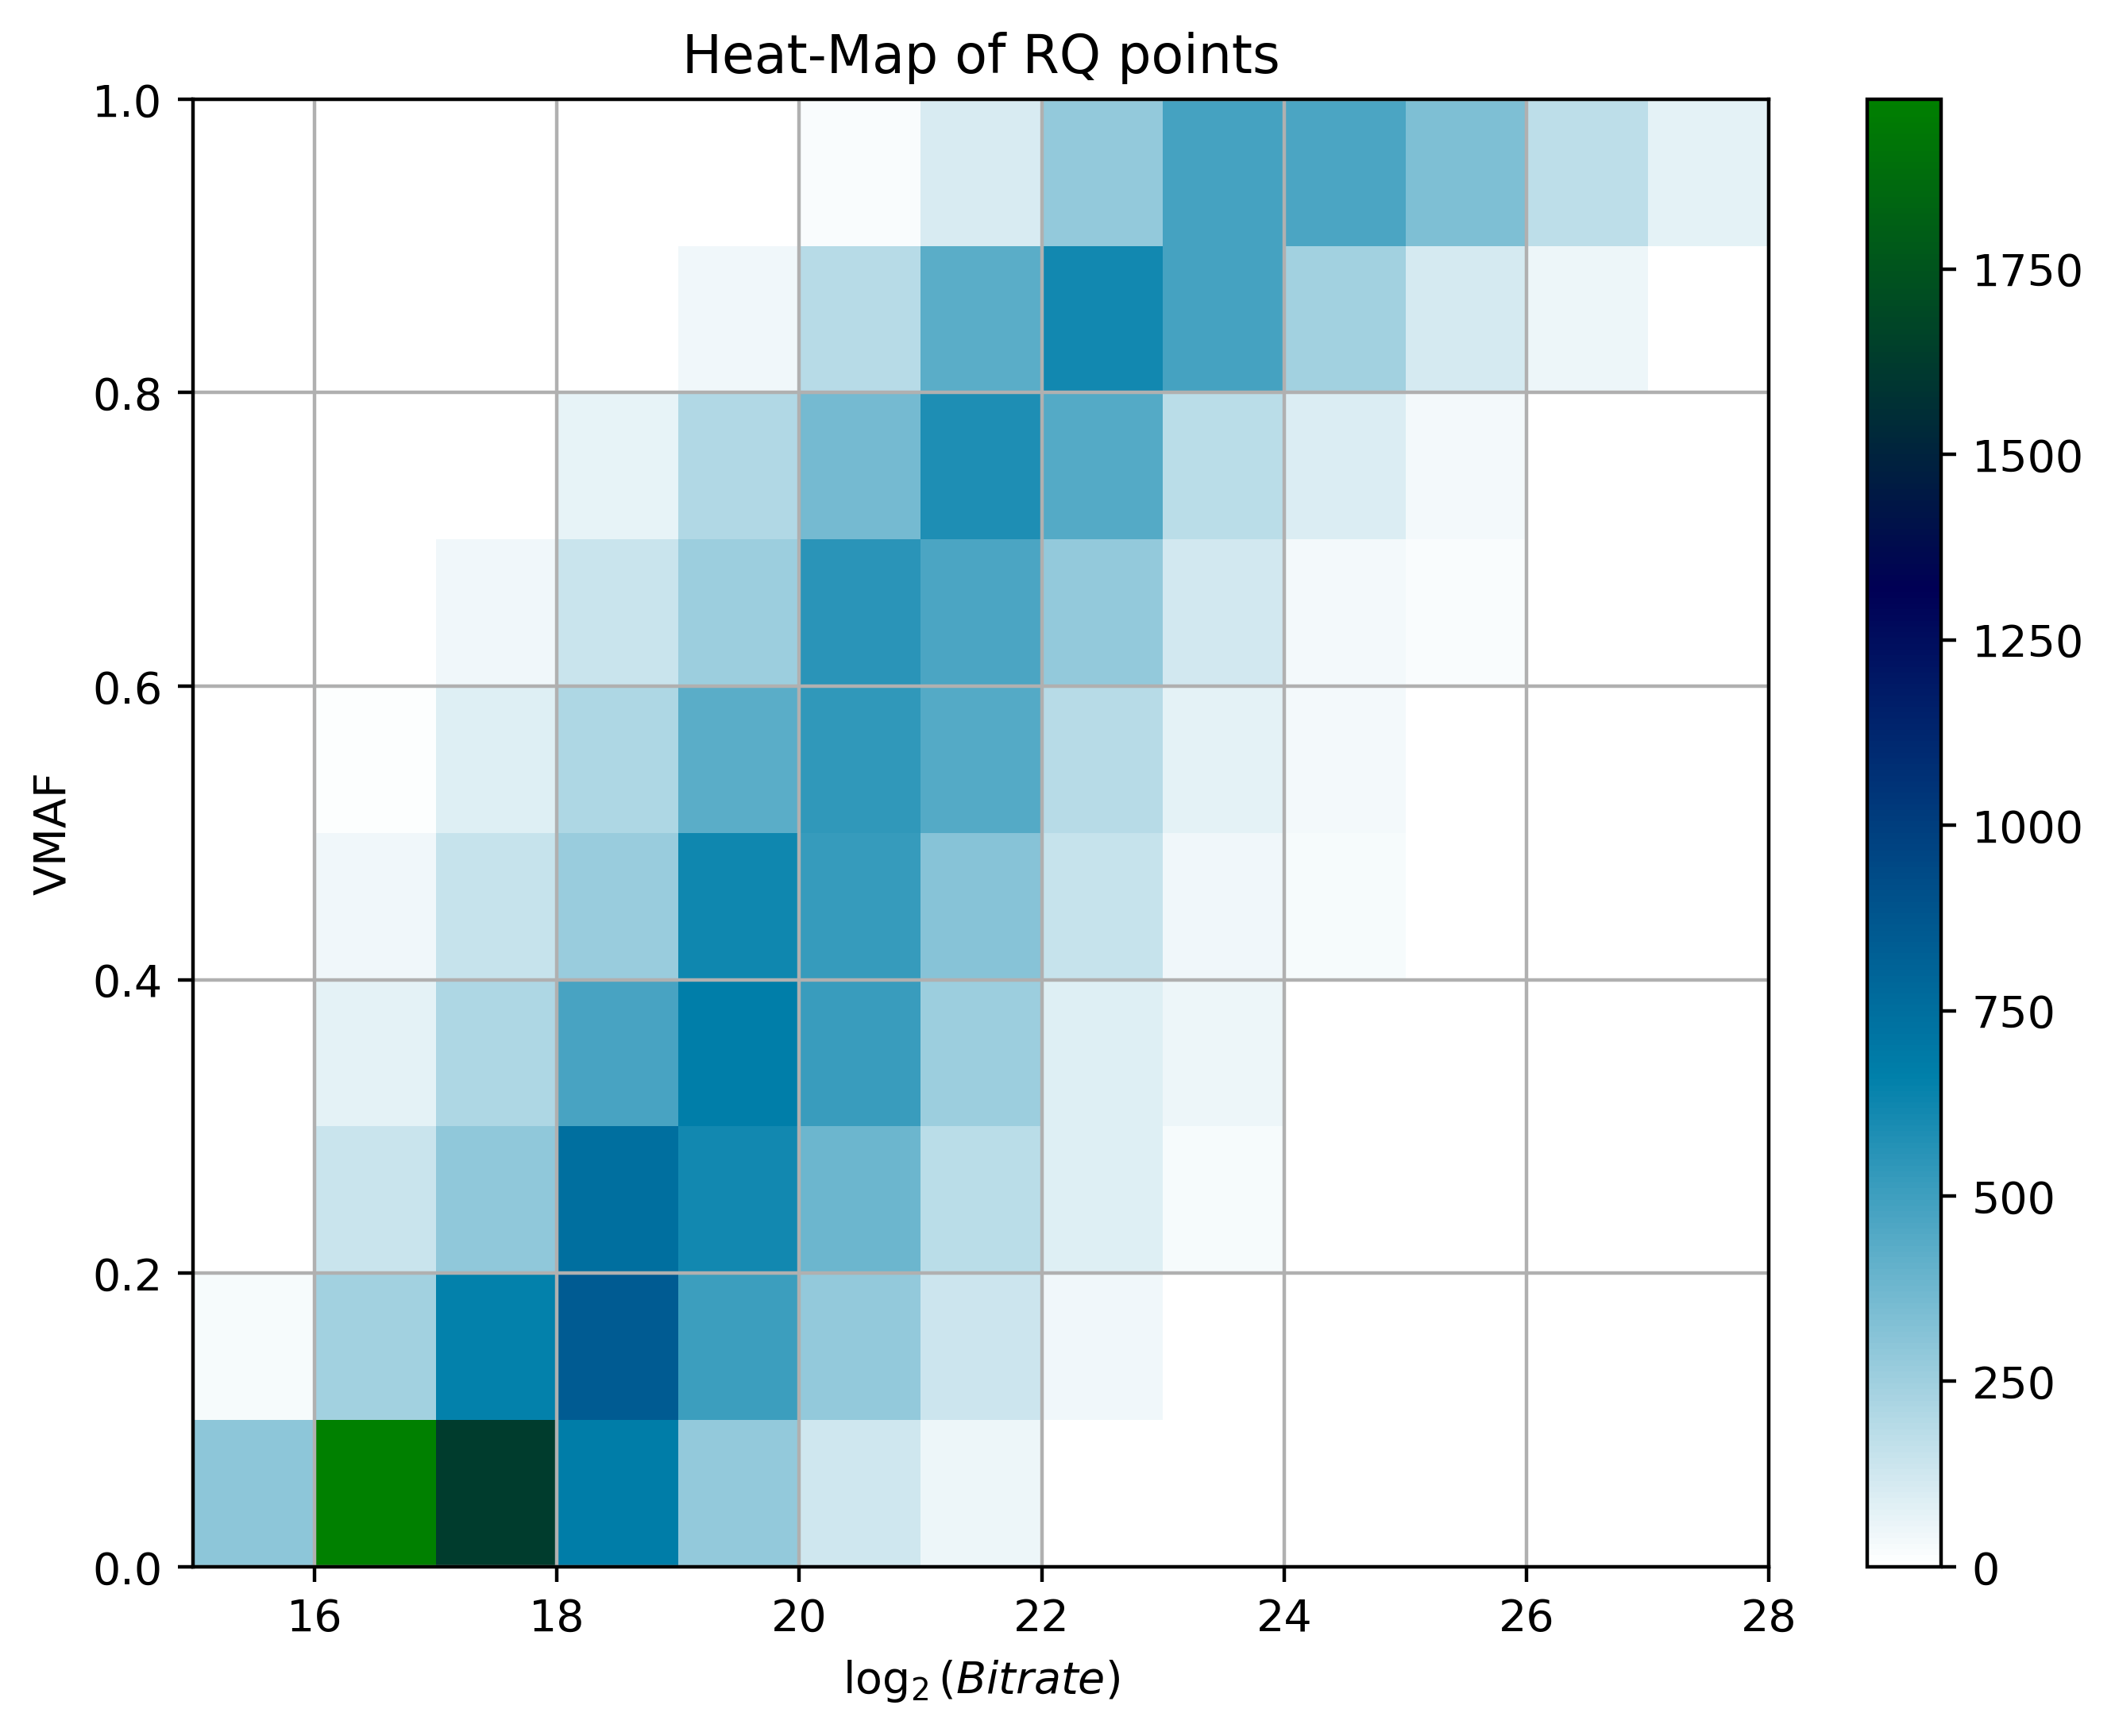
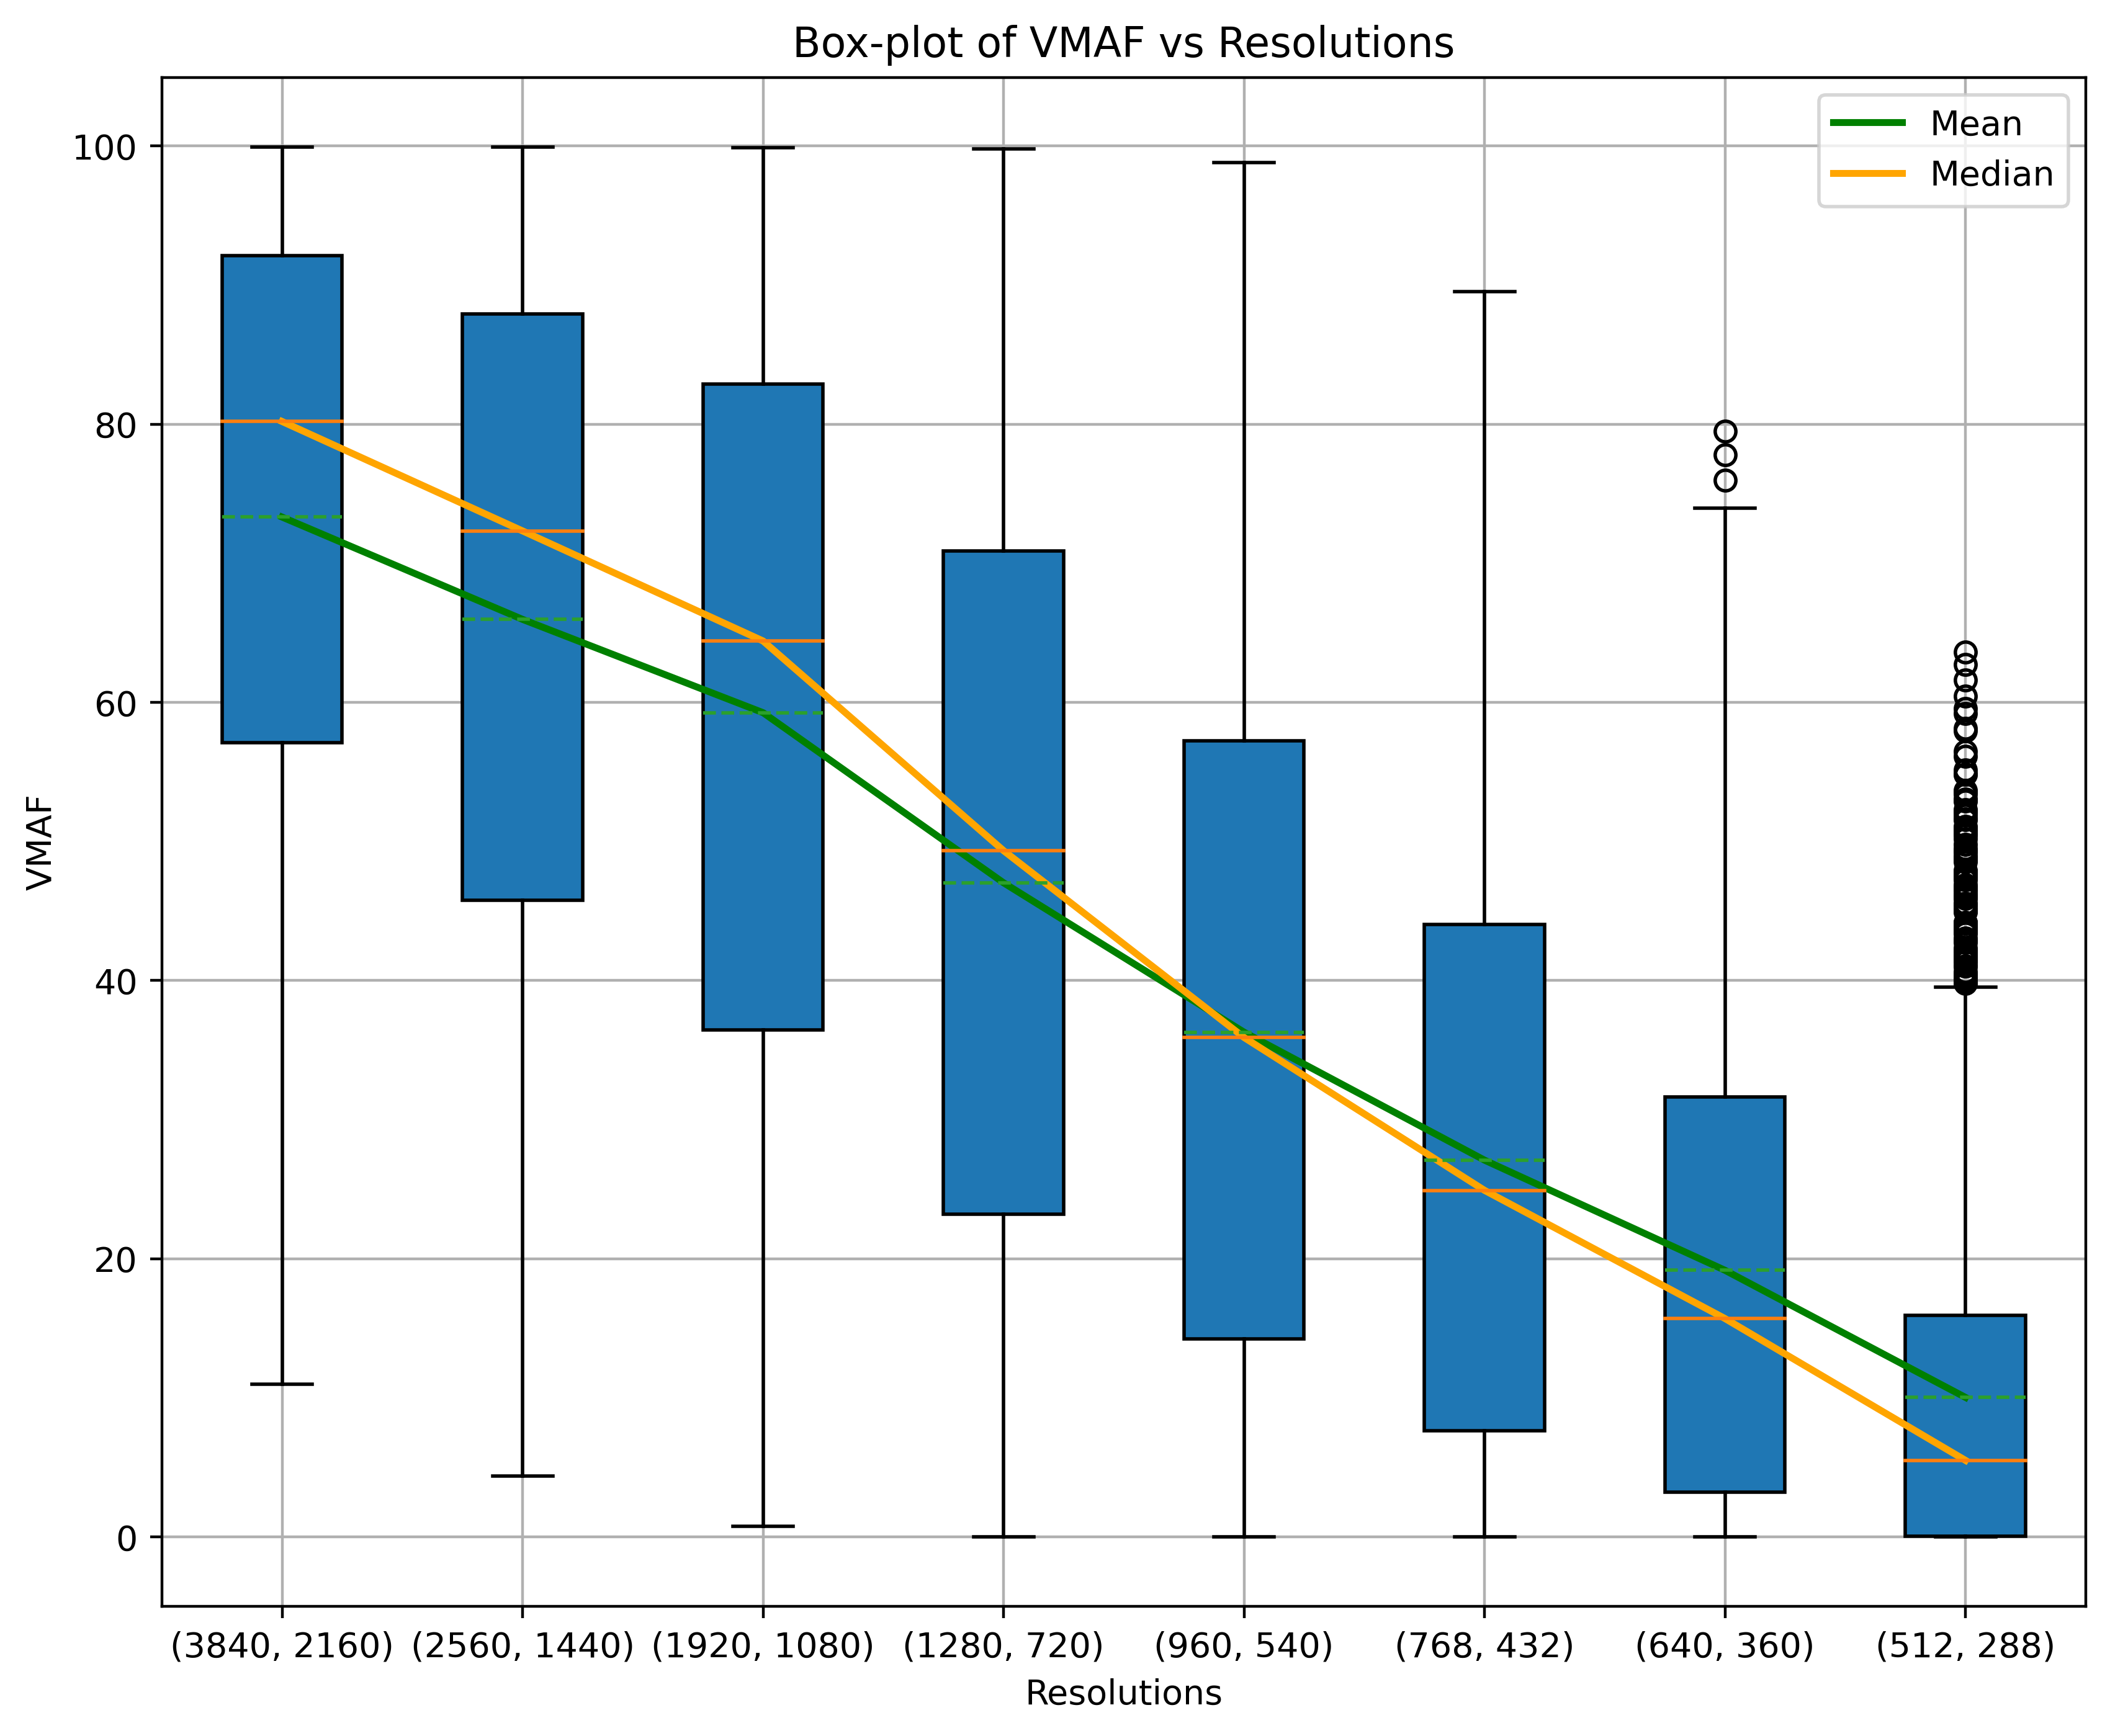
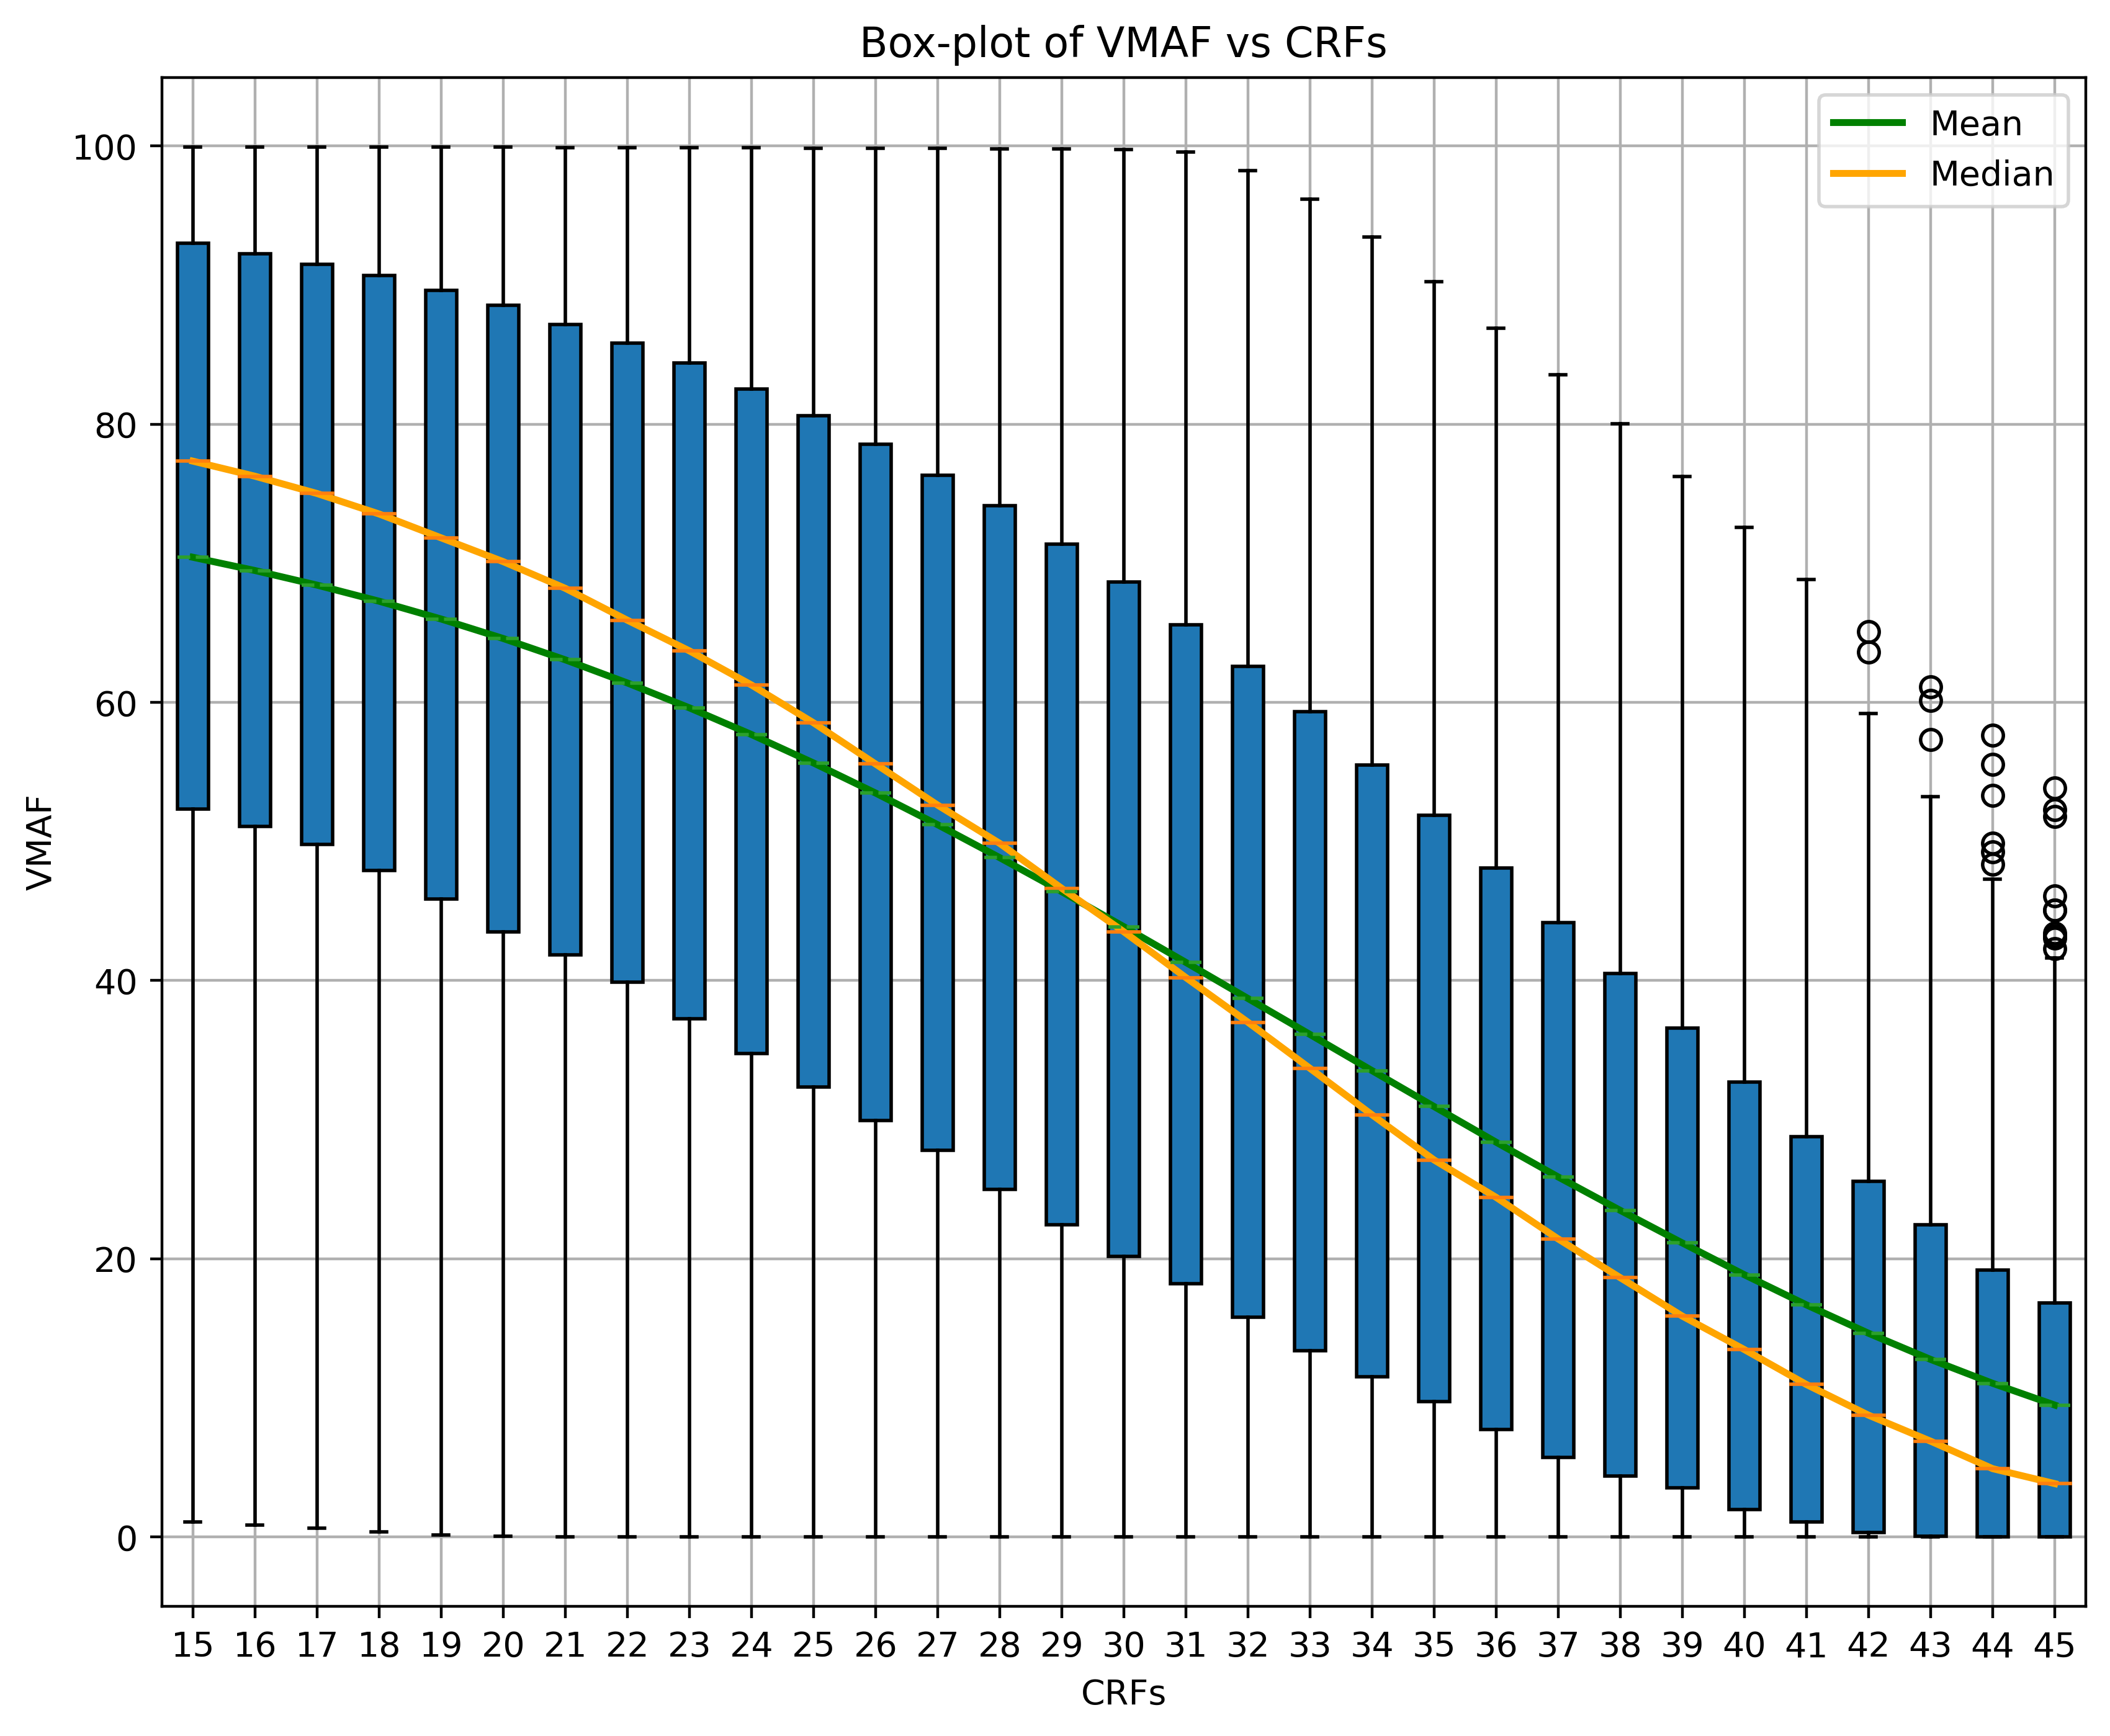
To understand the distributions of rate-quality points for various bitrate and VMAF ranges, we plotted a heat map of rate-quality points for all videos compressed using the initial set of 8 resolutions and 31 CRFs, as shown in Fig. 2(a). To further investigate the role of each considered resolution and CRF, we plotted box plots of the distribution of VMAF for each resolution and CRF pair, as shown in Fig. 2(b) and Fig. 2(c), respectively. It may be observed that the distribution of VMAF scores was negatively skewed for higher resolutions and smaller CRFs, while VMAF scores are positively skewed for lower resolutions and larger CRFs. The majority of the rate-quality points at resolutions 640360 and 512288 and CRFs greater than 41 yielded VMAF scores less than 15. From the curves of median and mean in Fig. 2(c), it may also be observed that for large and small CRF values, the relative changes of the distribution of VMAF scores were slowly decreasing, with the relative change being the highest at intermediate CRFs.
Considering these factors, we focused our study on rate-quality points falling within a VMAF score range of 15 to 95 (inclusive). This range excludes VMAF regions where the quality change was either imperceptible, or the perceptual quality of the video was insufficient to allow for a satisfactory visual experience. This adjustment helps to mitigate dataset bias, given that a significant proportion of RQ points have low VMAF scores, as depicted in Fig. 2(a). It also leads to imbalances in the training dataset, due to the varying number of points that meet the considered constraints across videos. We used the following experimental settings throughout:
-
•
Codec, Preset: libx265, medium
-
•
Resolutions: 38402160, 25601440, 19201080, 1280720, 960540, and 768432
-
•
CRFs: 16 to 35 (inclusive), 35 to 41 (inclusive) with a skip of 2
-
•
Constraints: 15 VMAF 95
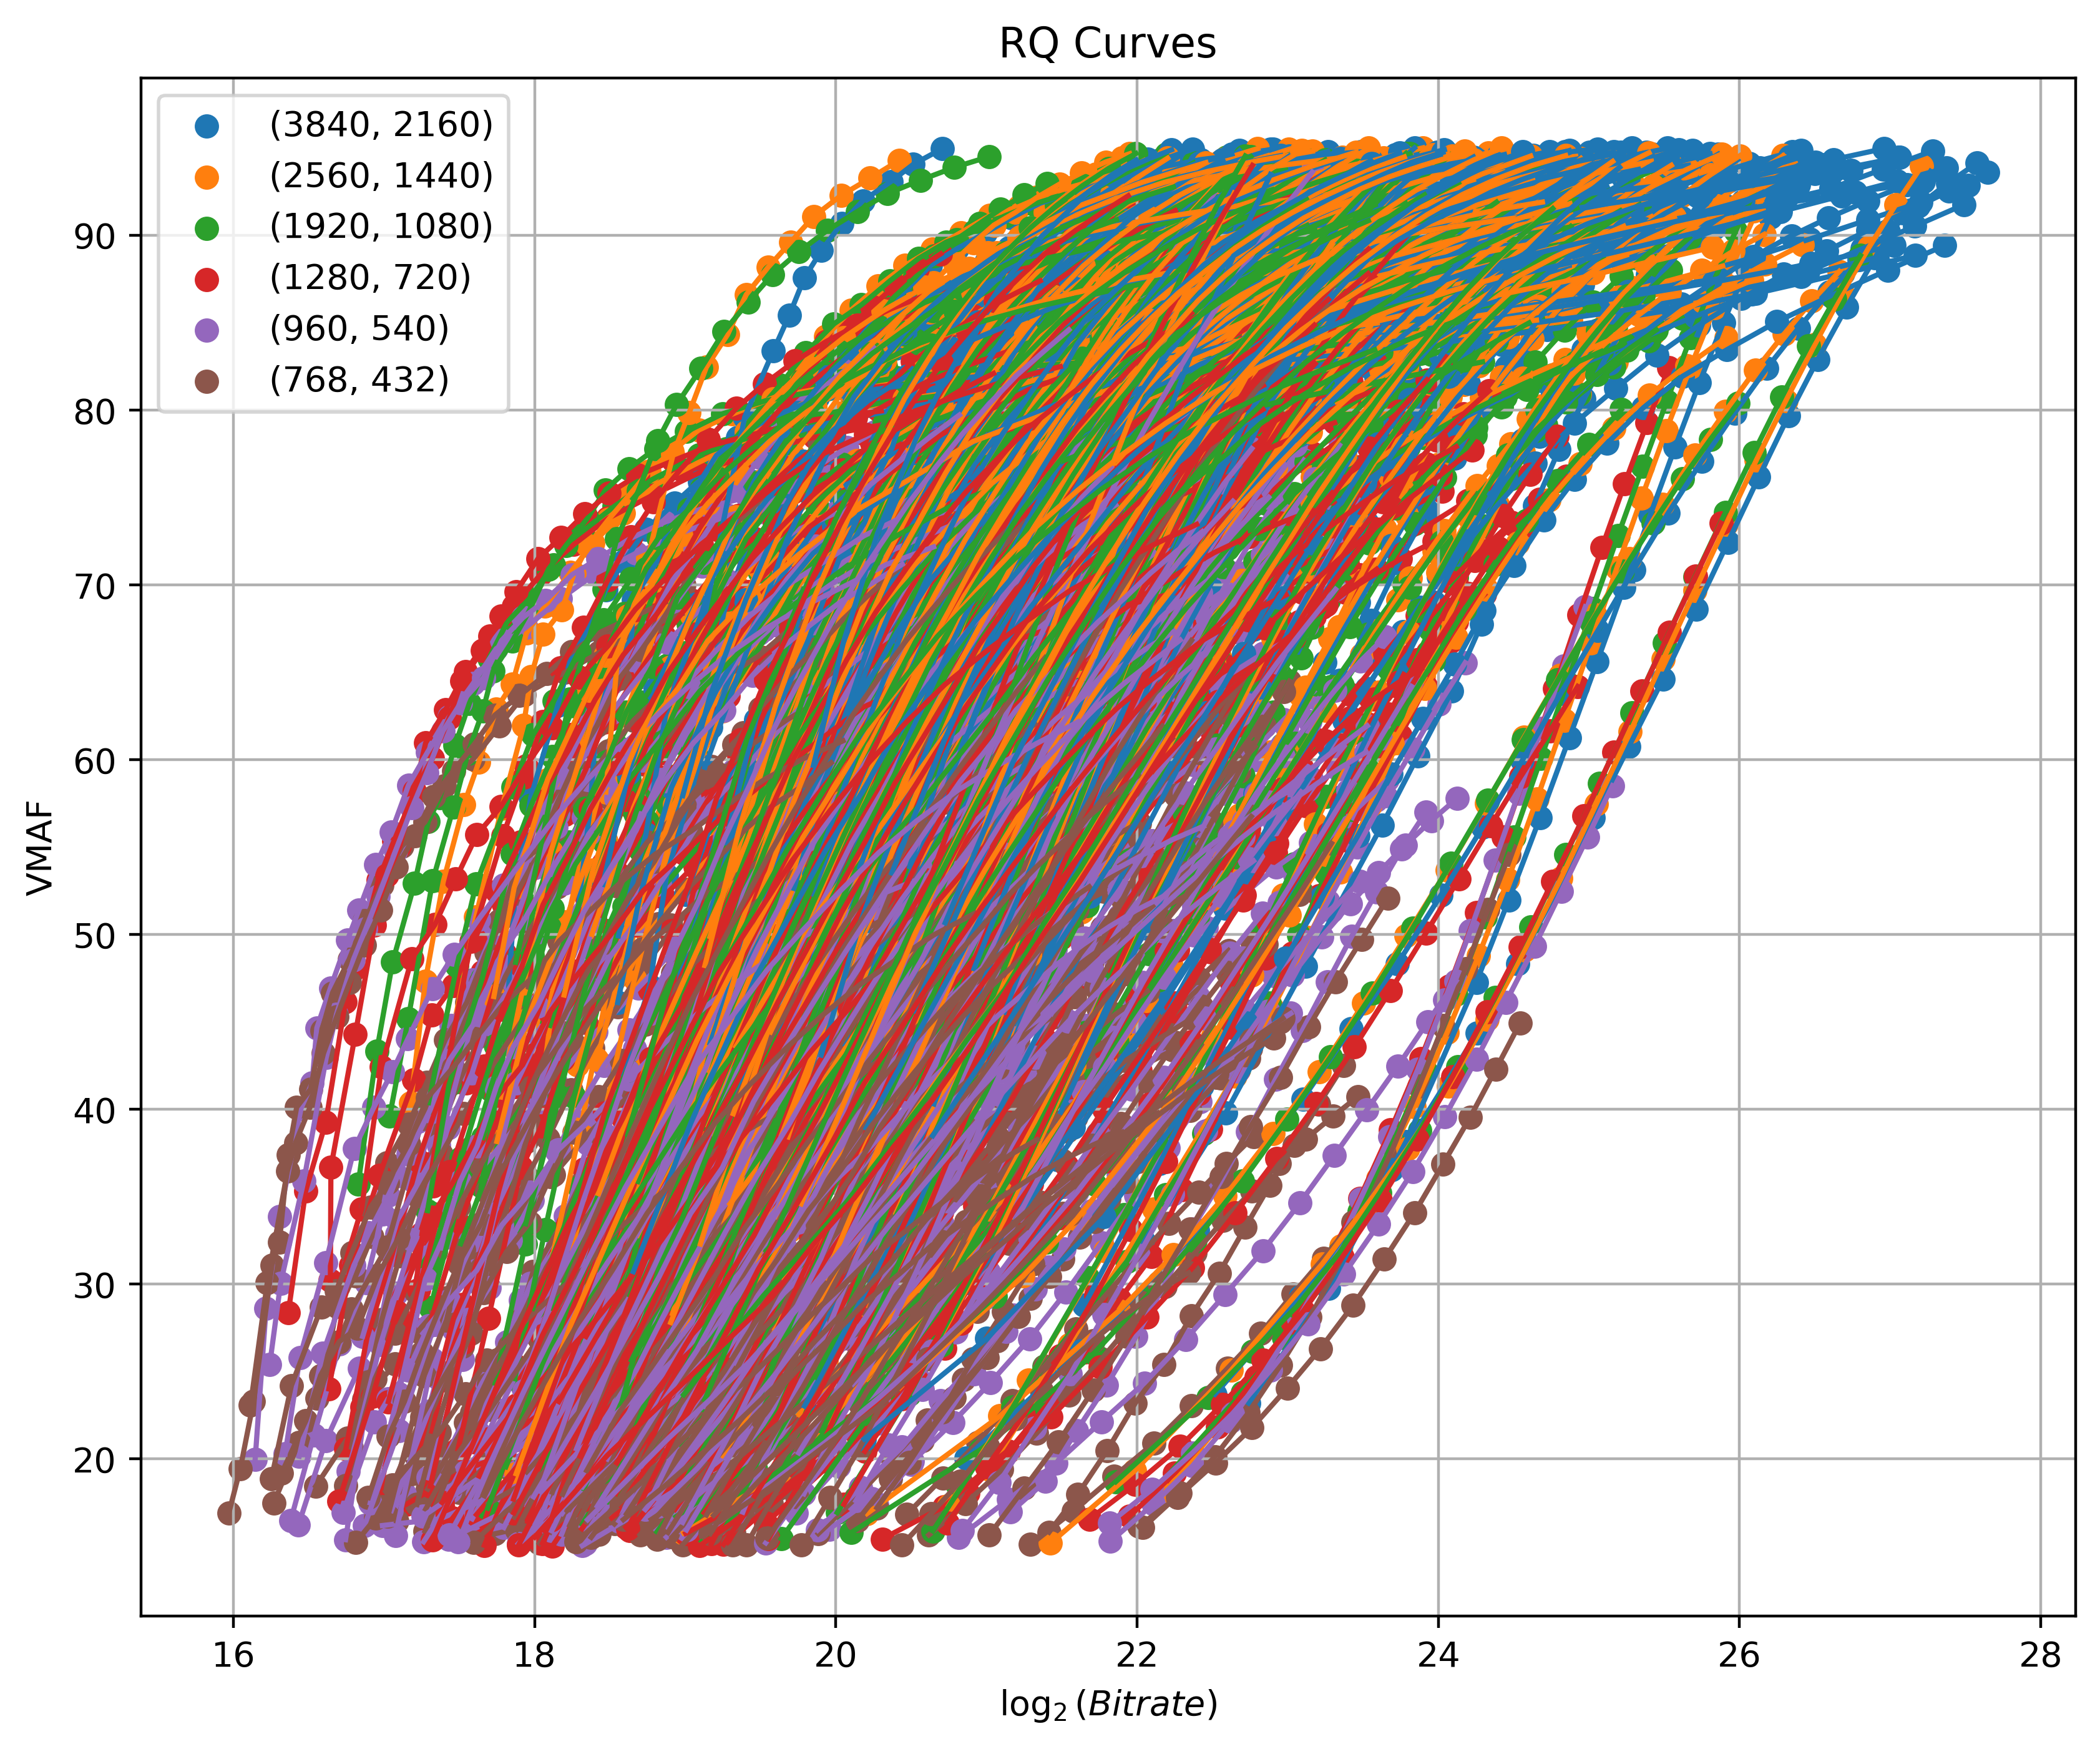
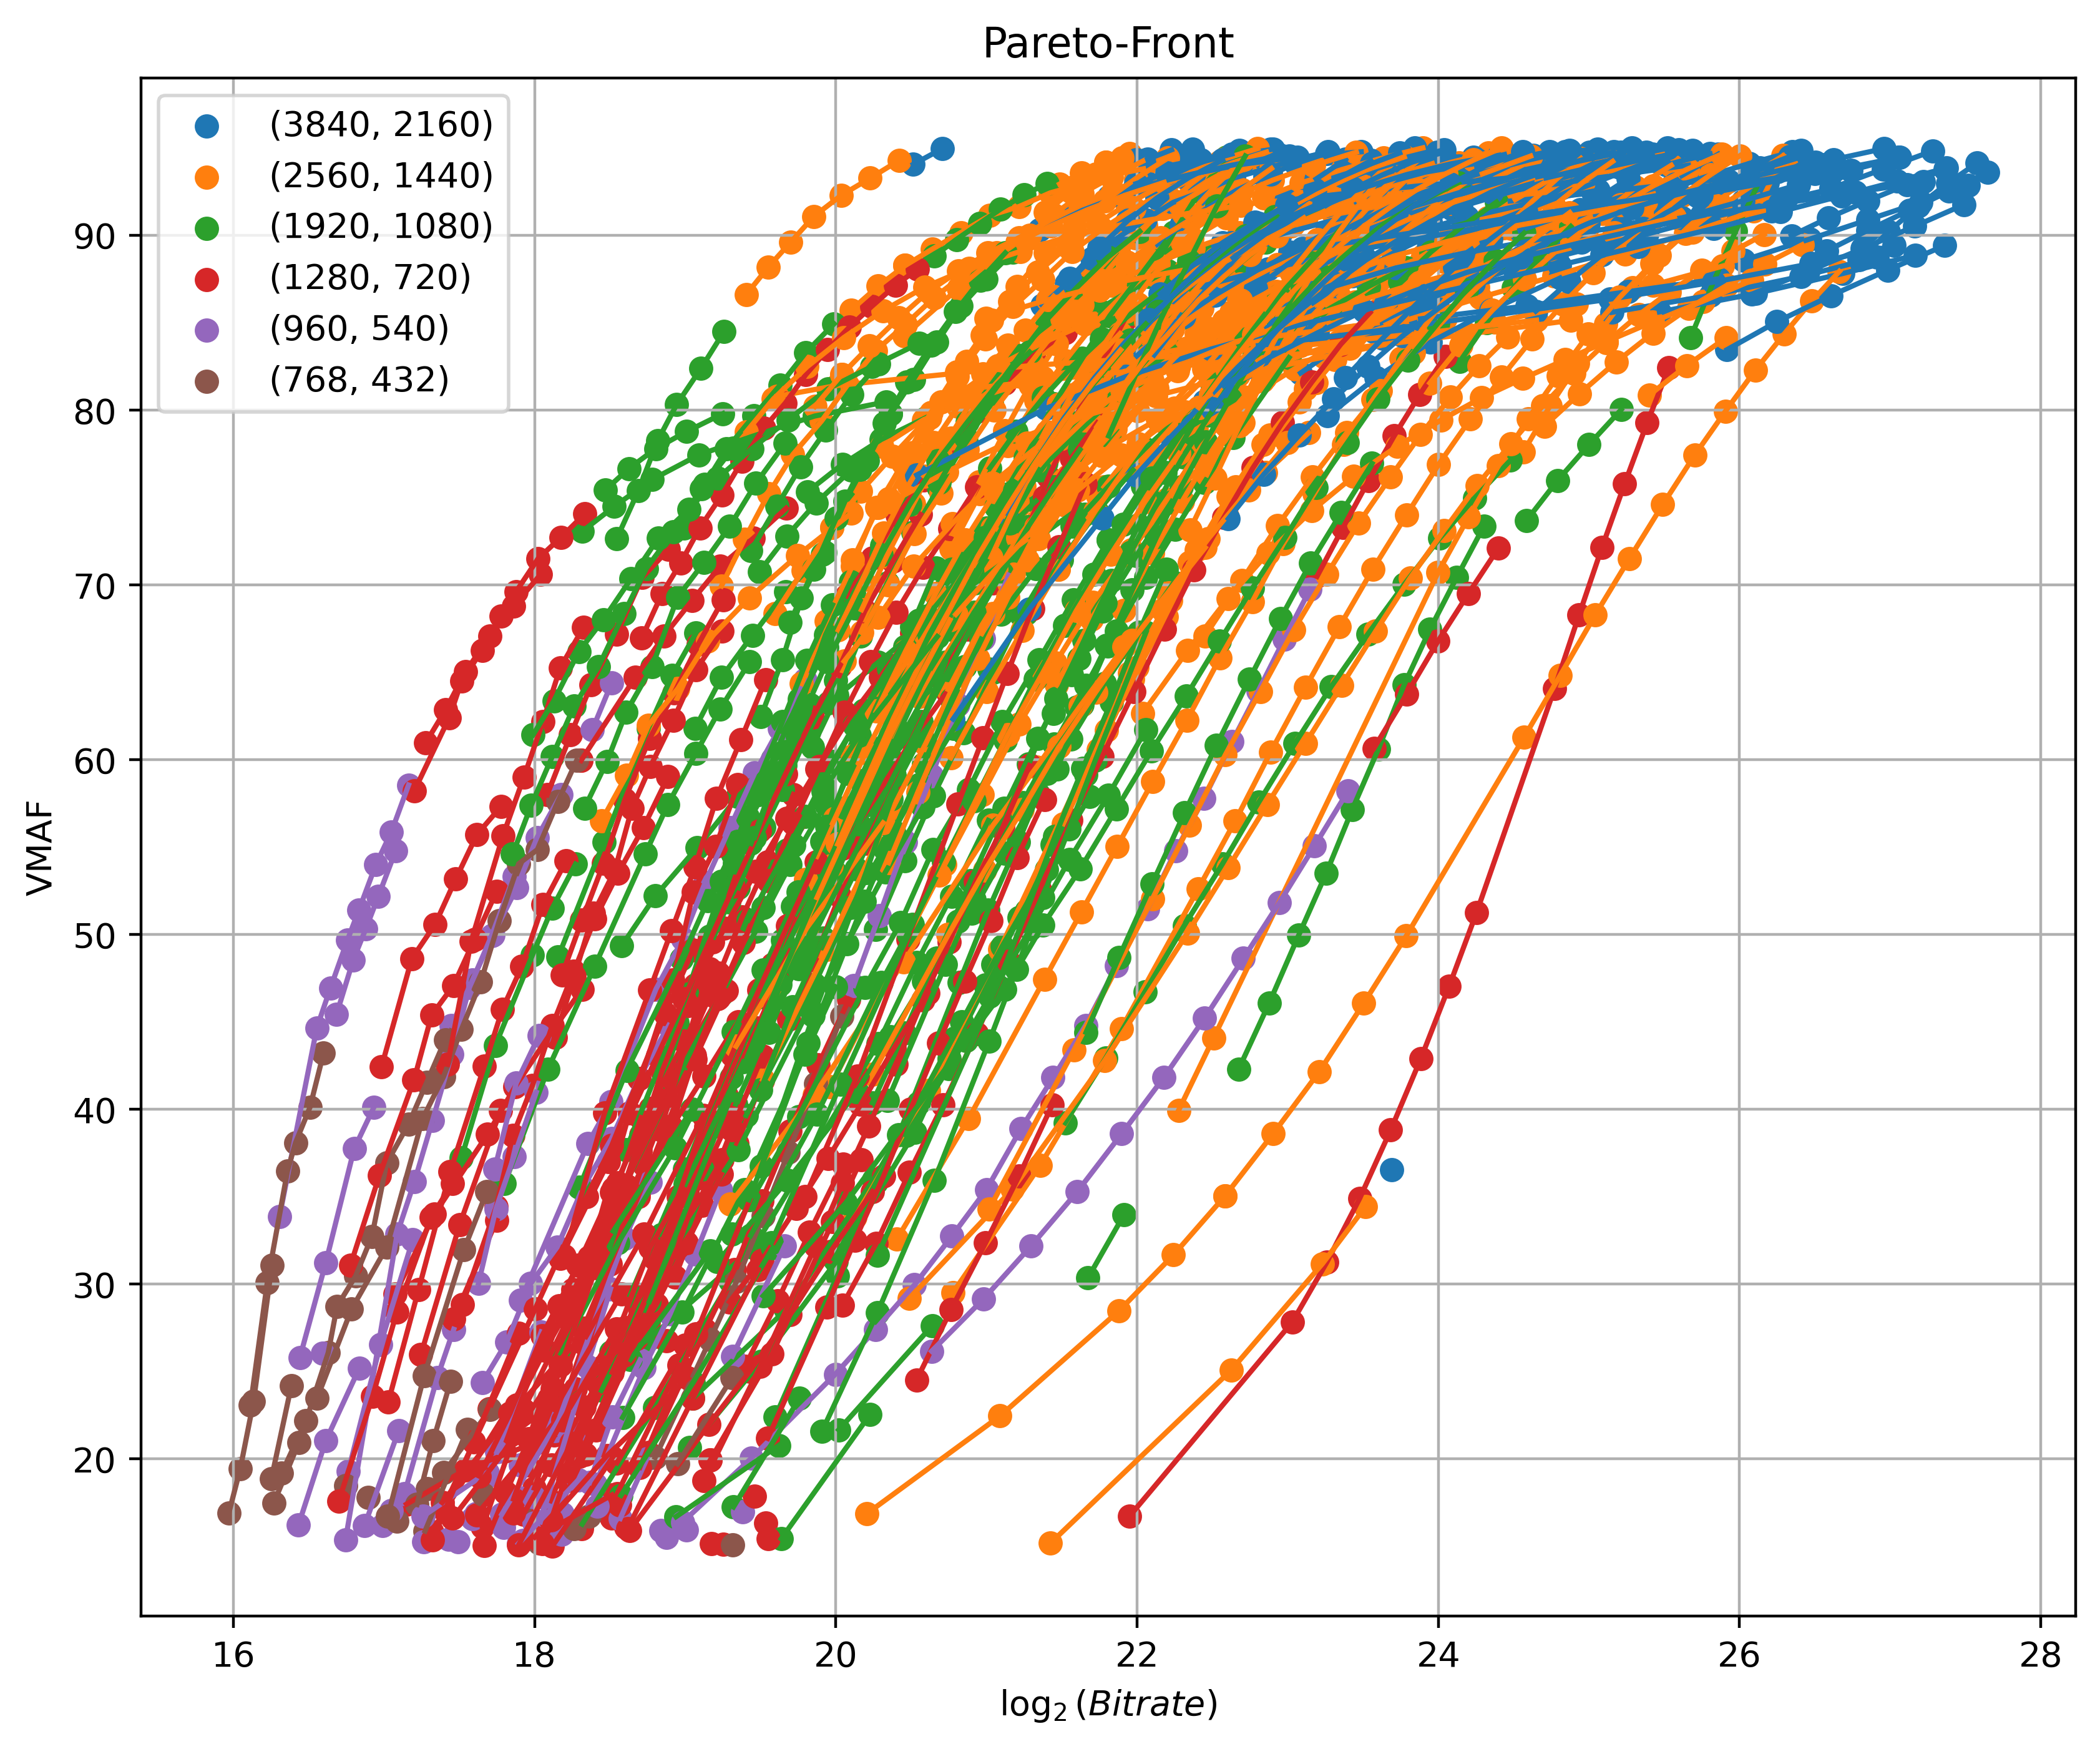
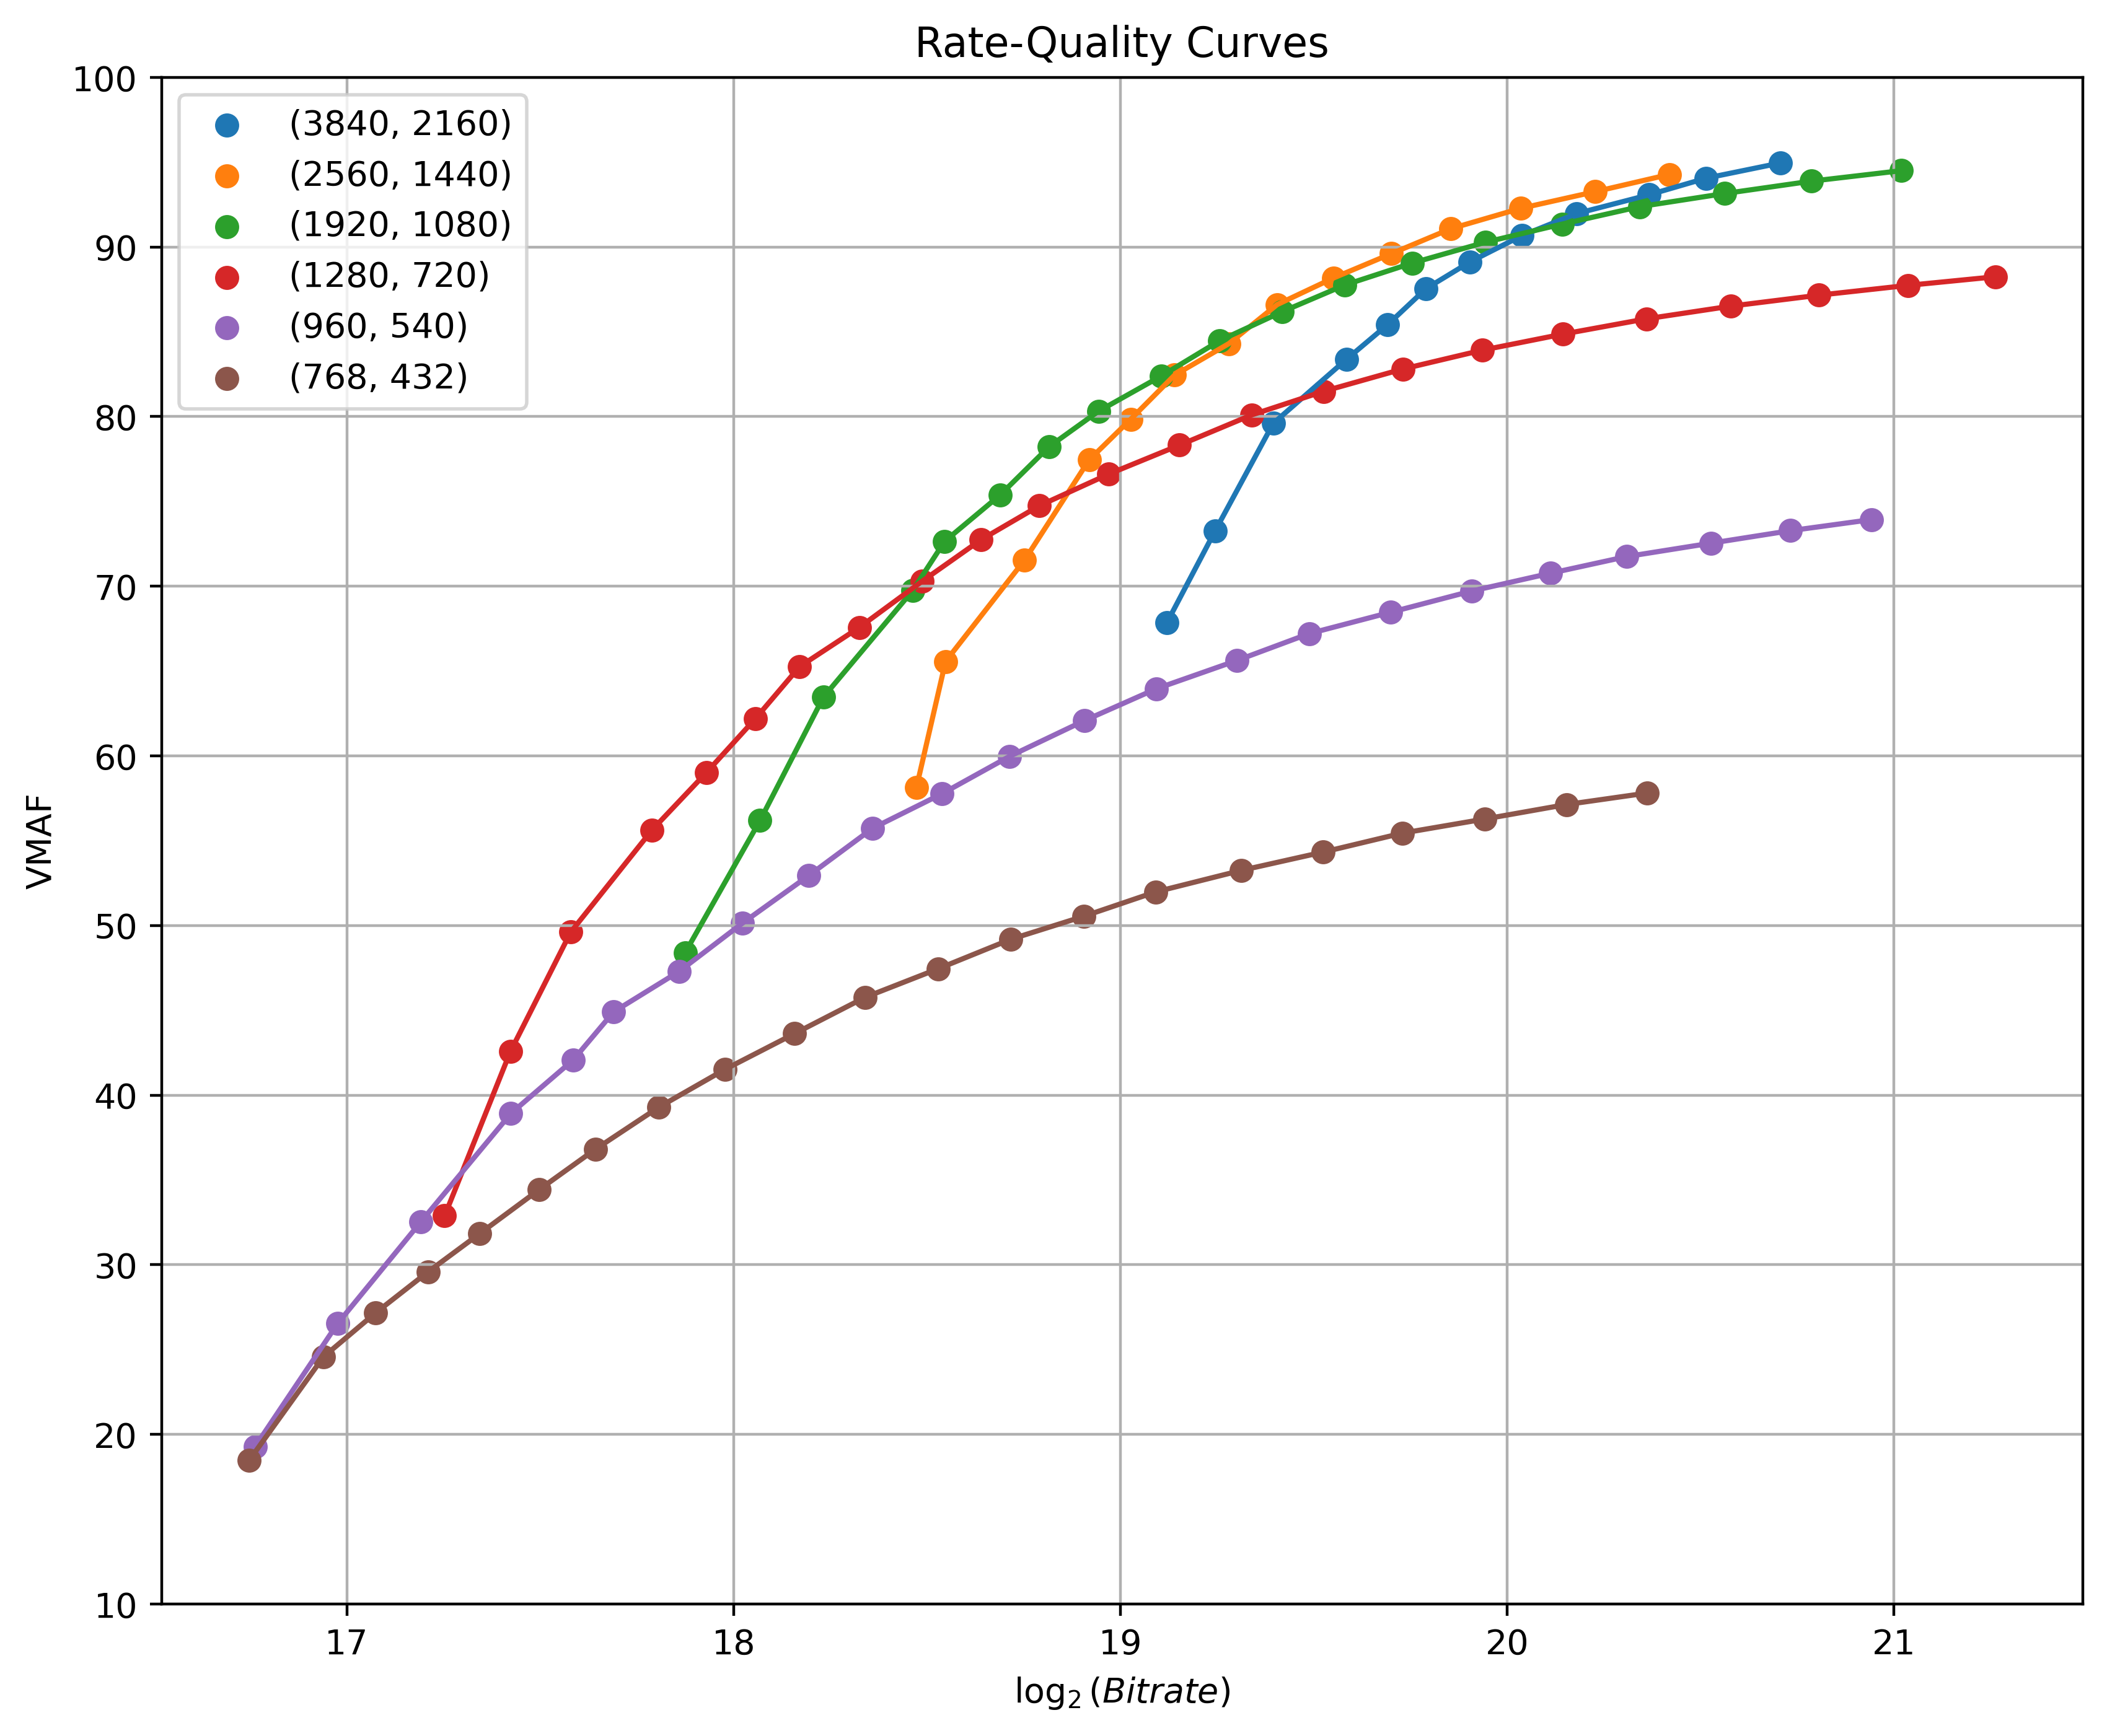
Fig. 3 shows the RQ curves and Pareto-Fronts constructed using exhaustive encoding of all the videos in the dataset using the experimental settings given above. One may observe great diversity among the RQ curves of videos having different resolutions, with different convexities, ranges of bitrates, and quality scores. The Pareto-fronts also display notable variety across resolutions and bitrates.
IV Method
Next, we describe the quality-aware perceptual (VIF) features and content-aware low-level features that we use to build our models.
IV-A VIF Feature Sets
Visual Multimethod Assessment Fusion (VMAF) [25] is a widely used full-reference video quality assessment (VQA) model that has demonstrated excellent correlations against human judgments of video quality. VMAF uses a Support Vector regressor (SVR) model to fuse spatial features from VIF [9], the Detail Loss Metric (DLM) [26], and a simple temporal frame-difference feature computed as the average absolute luminance differences between adjacent frames. VIF [9] is a full-reference image quality assessment (IQA) that predicts the information that could ideally be extracted by visual neurons from the reference image relative to the loss of information from distortion. It uses a Gaussian scale mixture image model expressed in the wavelet domain. VIF features are defined as follows:
| (1) | |||
| (2) |
| (3) | |||
| (4) | |||
| (5) |
where is a random field (RF) representing a subband of the reference image, is a RF of positive scalars, and is a Gaussian RF having mean zero and covariance . and are M-dimensional vectors and is independent of when . is the output of the neural model and models noise and uncertainty in the wavelet domain as a multivariate Gaussian having mean zero and covariance . represents the information that could ideally be extracted from a particular subband in the image. is a realization of on a particular reference image, which can be thought of as model parameters associated with it. Matrix factorization of (5) yields:
| (6) |
We calculate all the above features over four scales, each having two subbands, using . We consider to represent mutual information along the eigenvector of the subband at the scale, where , , and :
| (7) | |||
| (8) | |||
| (9) |
The above features , , and are VIF features at each scale, subband, and along the direction of eigenvector, respectively. Since VIF only captures spatial characteristics, similar to VMAF, we also compute the mean absolute luminance component difference between consecutive frames. As additional temporal features, we apply the same VIF features on differences between the luminance components of consecutive frames, as was done in [27]. Table I shows the nine different feature sets used in our experiments, where represents the luminance component of the frame of a source video, and is the difference between luminance components of adjacent frames. We temporally pool each VIF feature by calculating their means.
| Notation for VIF feature set | Features | No.of Features |
|---|---|---|
| 4 | ||
| 8 | ||
| 72 | ||
| , | 5 | |
| , | 9 | |
| , | 73 | |
| , , | 9 | |
| , , | 17 | |
| , , | 145 |
IV-B Low-Level Features
As discussed in Section II, prior models often employ low-level features like gray-level co-occurrence matrices (GLCM), measures of temporal coherence (TC), normalized cross-correlations (NCC) and other content-sensitive features when modeling RQ-curves and predicting optimal ladder parameters. Traditional spatial information (SI) and temporal information (TI) defined by simple spatial or temporal differencing, respectively, have commonly been used to measure video complexity. However, other authors [28], [29], have shown that chrominance features and DCT-based texture energy features proved more effective when modeling RQ characteristics.
Our study incorporates features derived from an array of prior work on video coding, to develop a comprehensive set of low-level features. We utilize GLCM and TC features, as in [10, 11, 12, 13, 14, 15], and SI, TI, CTI, CF, and CI as employed in [28]. We also compute DCT-based texture energy features as introduced in [16, 29], and extended to chroma components in [17].
The authors of [16], devised a bitrate dependent feature that combines spatial and temporal energy features of luminance: , ( is spatial energy, is temporal energy, and is bitrate) which they used to predict VMAF scores. In addition to the aforementioned feature, we compute features extending computation on the same features expressed on chroma components. Table II shows the list of features we deploy in our work where is gray-level co-occurrence matrix, is measure of temporal coherence, is luminance, and are chroma components, , , are spatial energy components, , , are temporal energy components, , , are luminescence components, is bitrate, and is quality. operation denotes spatial feature pooling and denotes temporal feature pooling.
| Feature | Formula | No.of Features |
|---|---|---|
| GLCM | , , , where GLCM is calculated on blocks of size (64,64), and | 32 |
| TC | where and | 8 |
| SI | where and | 8 |
| TI | where and | 8 |
| CTI | where and | 8 |
| CF | where | 4 |
| CI | , where , and | 16 |
| DCT-Texture | , , , , , , , , where | 9 |
| Bitrate-DCT-Texture | , , where | 3 |
| VMAF-DCT-Texture | , , , where | 3 |
V Experiments and Results
We constructed the experimental dataset by compressing all of the videos using all the encoding settings mentioned in Section III. We divided the dataset into non-overlapping training, validation, and test datasets containing 70, 10, and 20 videos respectively. We ensured that there were no video titles shared between these sets to avoid content learning. The videos in the validation and test datasets were considered together during evaluation, thereby yielding a larger sample size, and these videos were not part of the training data.
In all the experiments, we considered bitrates sampled on a logarithmic scale of base 2, and scaled the VMAF scores by a factor of 100, ensuring they fell within the range of [0,1]. We trained multiple regressors, including Extra-Trees, XG-Boost, and RandomForests, on each task in our experiments. Machine learning models were trained separately on each feature set/approach. We found that the Extra-Trees regressor consistently delivered the best results on all our feature sets on almost every task.
A bitrate ladder contains steps of bitrate and the corresponding optimal resolution for encoding at that bitrate step. When constructing the bitrate ladders, we selected the following bitrates (in kbps): 500, 1000, 2000, 3000, 4000, 5000, 6000, 7000, 8000, 9000, 10500, 12000, 15000. Similarly, a quality ladder contains quality steps based on which full-reference quality model is employed and the corresponding optimal resolution for encoding at that quality step. When constructing quality ladders, we selected the following VMAF score increments: 25, 35, 45, 50, 55, 60, 65, 70, 75, 80, 85, 90, 92.5.
| Notation for low-level feature set | Features | No.of Features |
|---|---|---|
| GLCM, TC, SI, TI, CTI, CF, CI, DCT-Texture | 93 | |
| GLCM, TC, SI, TI, CTI, CF, CI, DCT-Texture, Bitrate-DCT-Texture | 96 | |
| GLCM, TC, SI, TI, CTI, CF, CI, DCT-Texture, VMAF-DCT-Texture | 96 |
V-A Predicting Cross-Over Bitrates or VMAF using Low-Level Features
Cross-over points between two resolutions are characterized as intersection points on the RQ curves, marking transitions from a lower to a higher resolution that offers superior quality. This intersection is defined either by a pair of QPs [12, 13], one for each resolution, or by the corresponding bitrate to that intersection [15, 18]. These cross-over points are predicted by extracting features from uncompressed videos, and are then used to construct per-shot bitrate ladders.
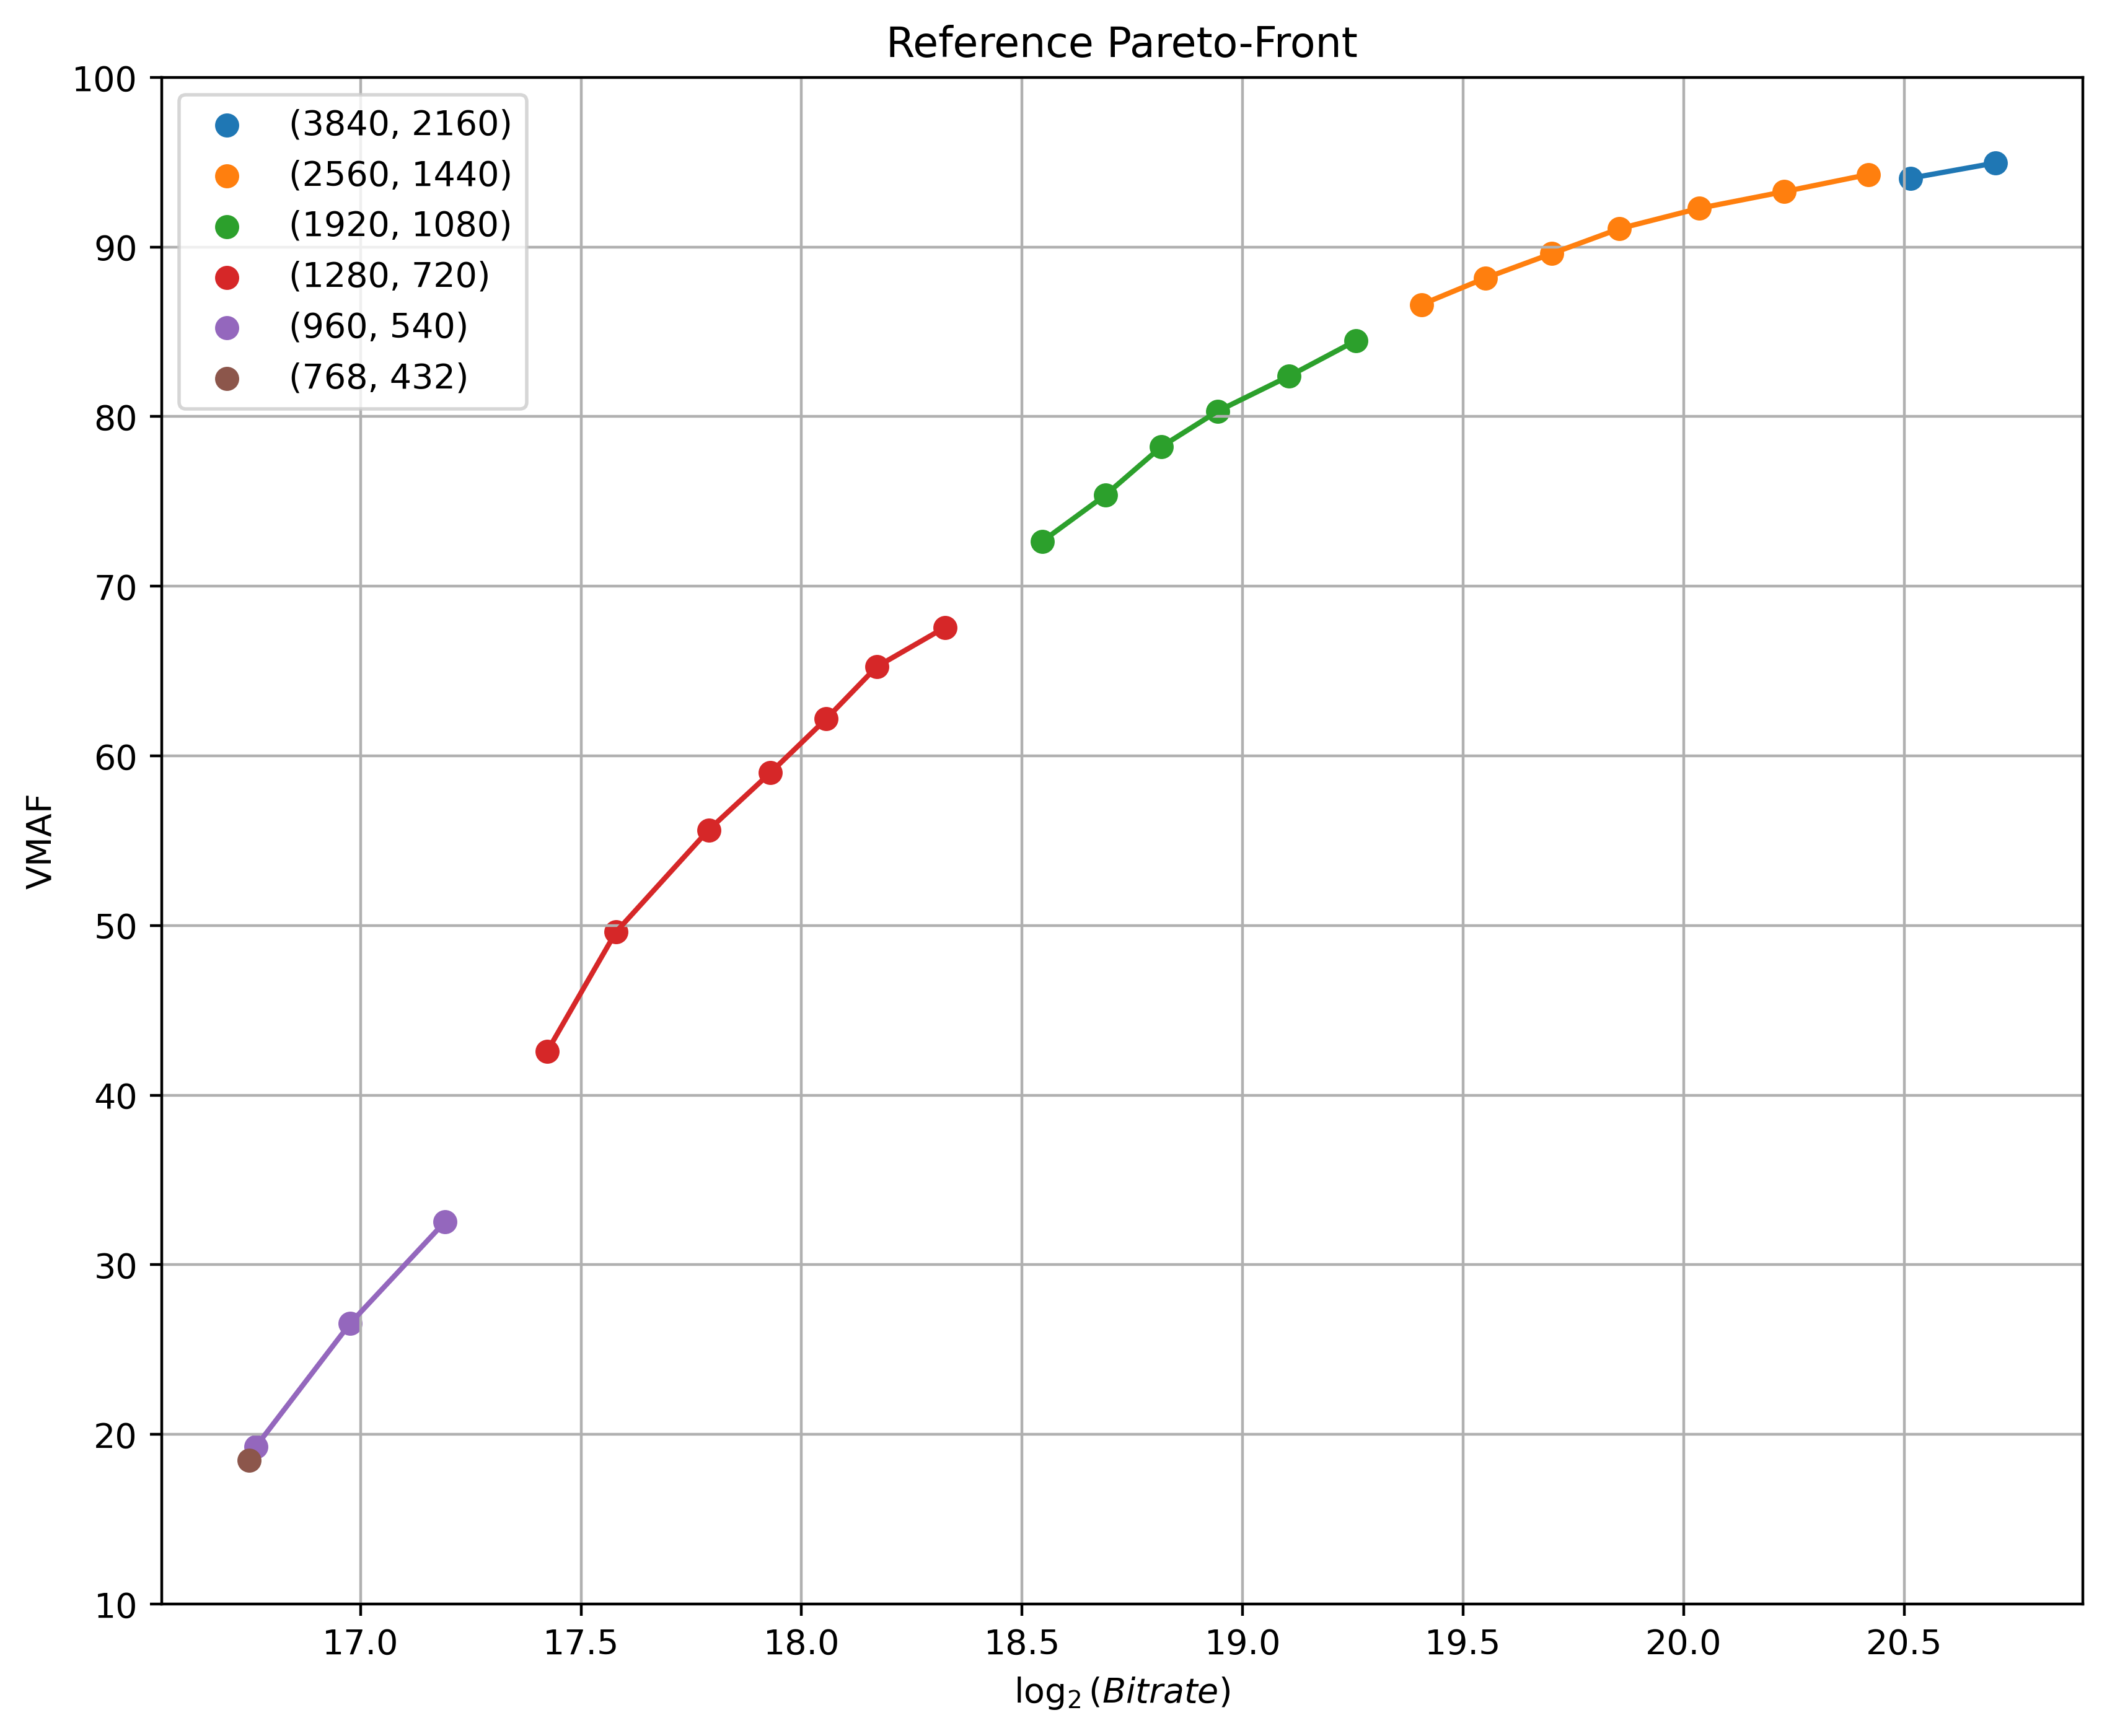
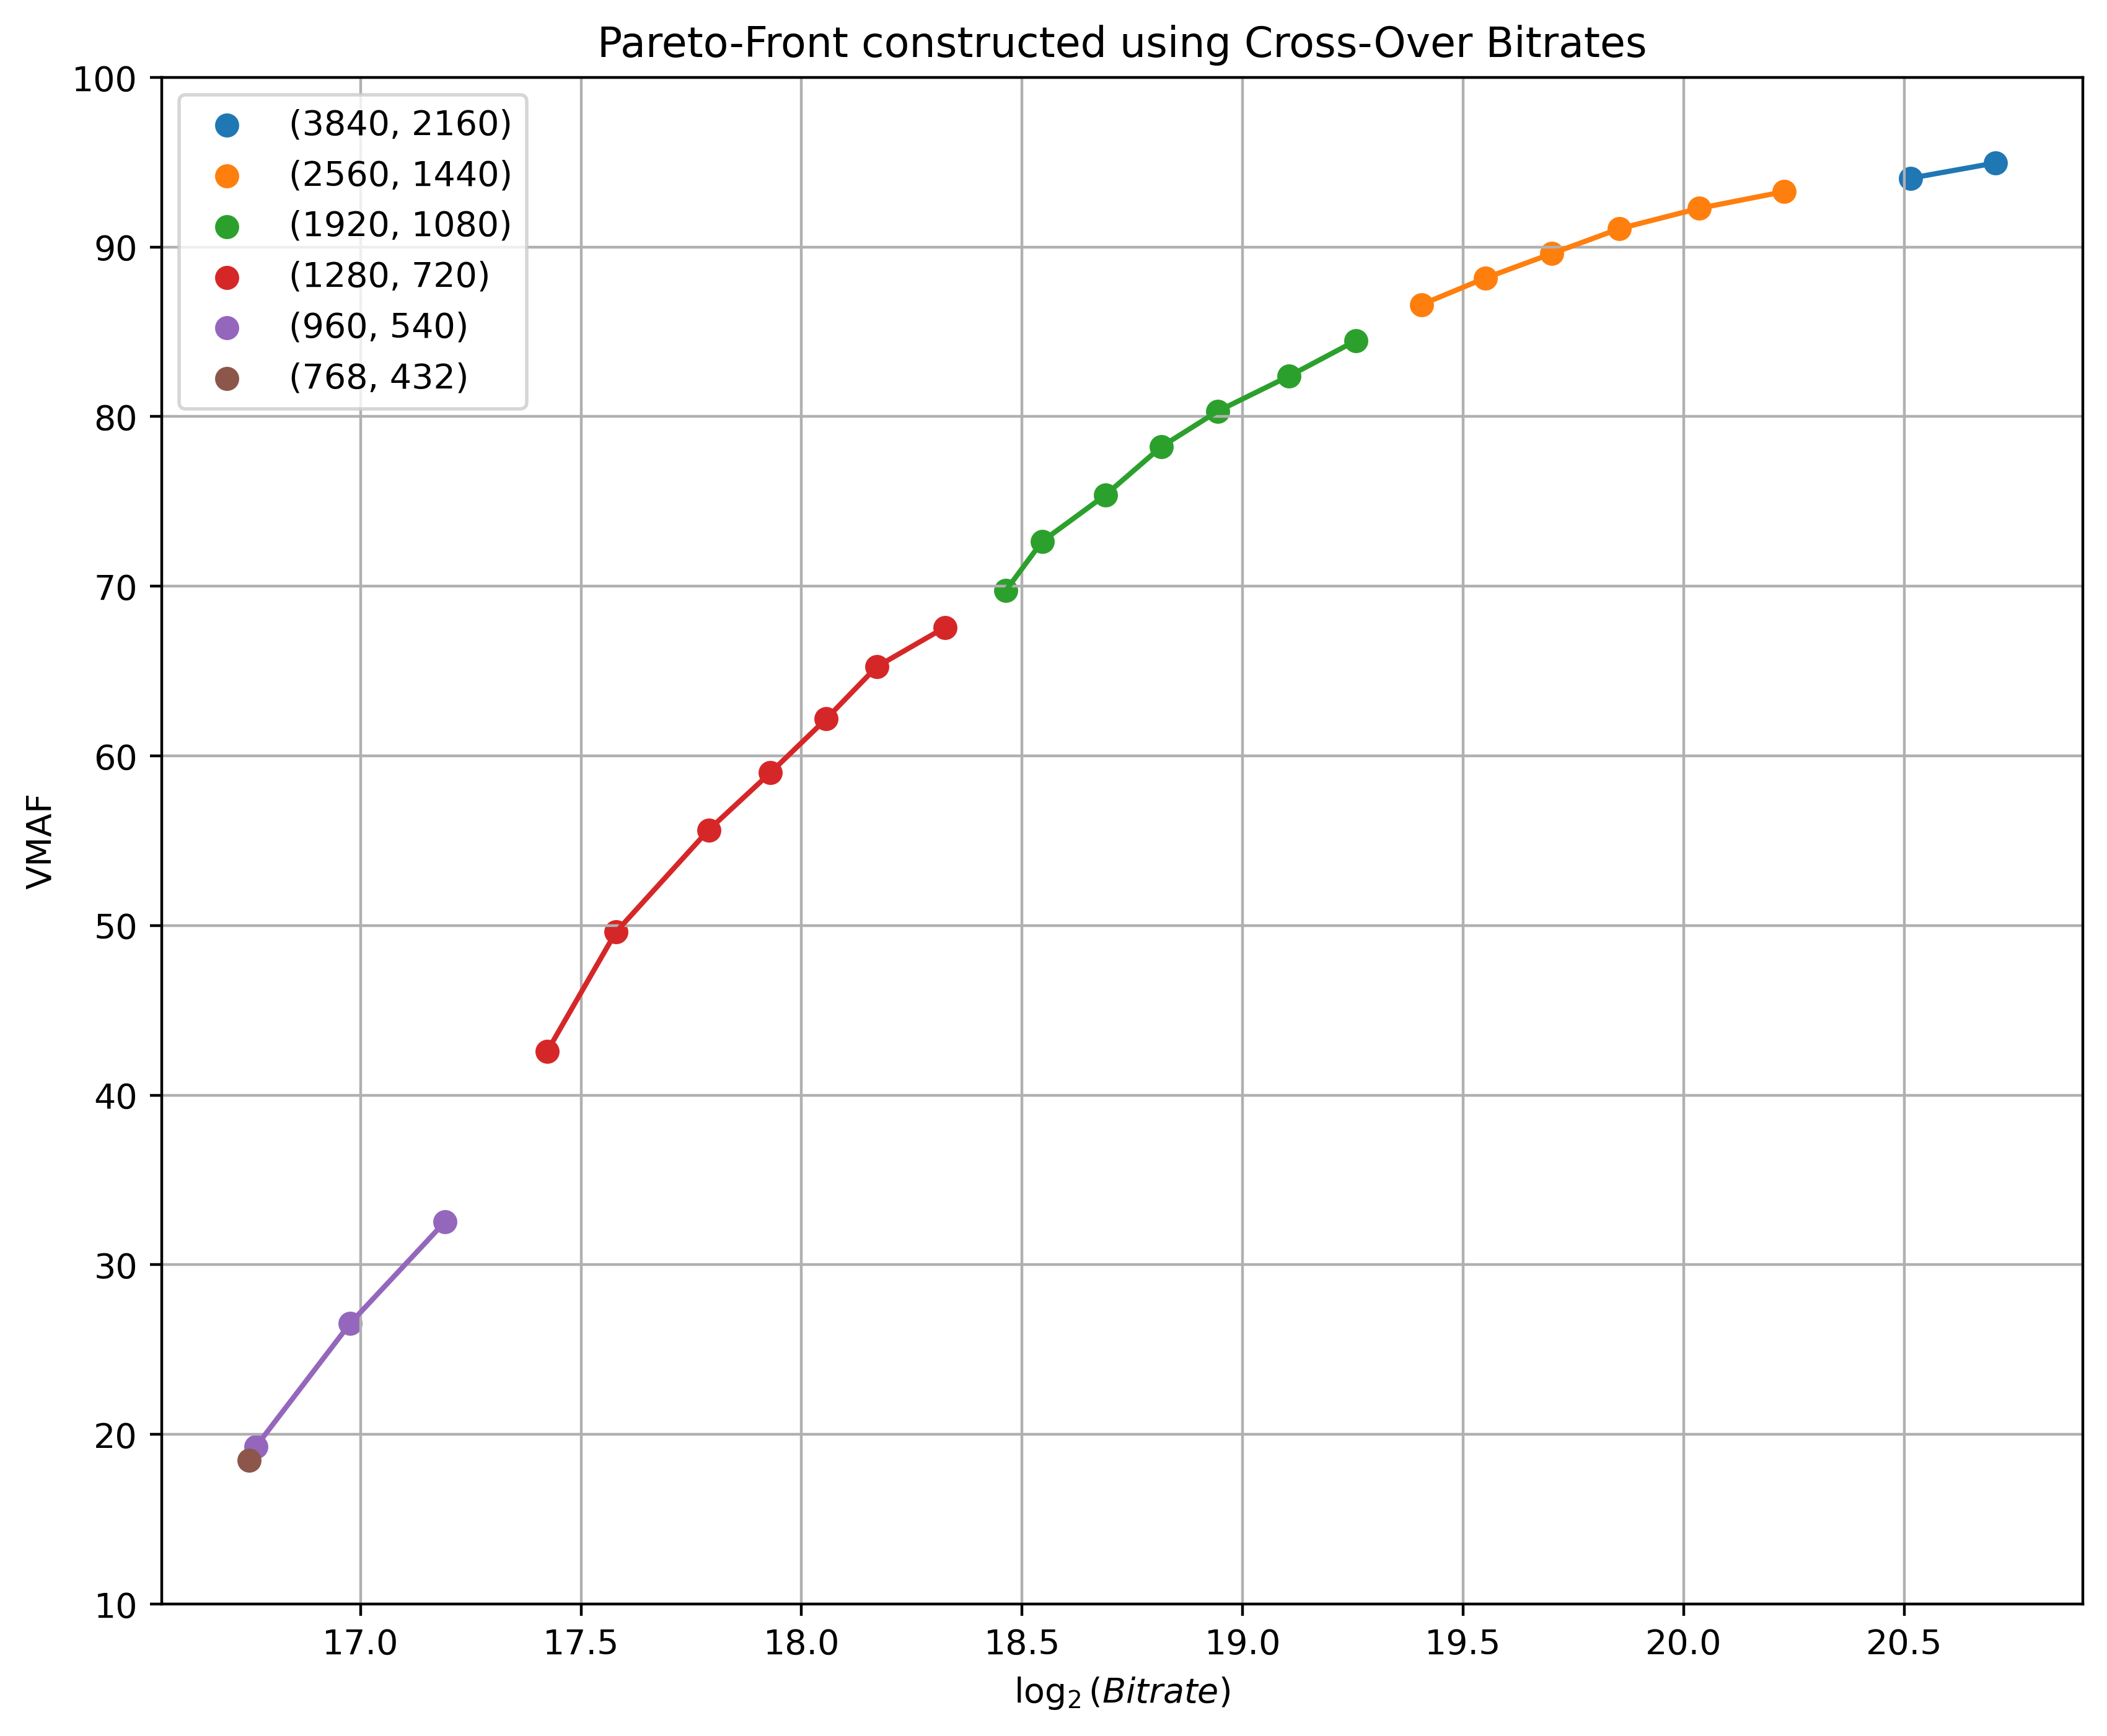
Similar to bitrate cross-over points, we designed a method using VMAF cross-over points. The VMAF cross-over points are the intersections of the RQ curves at each resolution where the predicted perceptual qualities are the same. Similar to cross-over bitrates, we predict VMAF cross-over points by extracting features from the source videos, then using them to construct per-shot quality ladders. Fig. 4 shows an example of rate-quality curves and Pareto-Fronts constructed using exhaustive encoding, cross-over bitrates, and VMAF cross-over points on a video sample in the dataset.

We compared our proposed methods against a technique that constructs a bitrate ladder using cross-over bitrates. After selecting six different spatial resolutions, we calculated five cross-over bitrates between adjacent resolutions. We used the low-level feature set defined in Table III in our experiments. We also used predicted cross-over bitrates between higher resolutions as additional features when predicting cross-over bitrates between lower resolutions. Since our training dataset contains only 70 videos, to avoid the curse of dimensionality, we used recursive feature elimination (RFE) to select nine features that are used to predict each cross-over bitrate. Later, we use the predicted cross-over bitrates to construct per-shot bitrate ladders. As mentioned earlier, we also learned the perceptual counterpart models, viz., that predict VMAF cross-over points using low-level features. Similarly, we applied RFE on the set of low-level features , to select nine features predictive of VMAF cross-over points, and we later employ these to construct per-shot quality ladders.
Table IV measures and compares the performances of the cross-over point prediction models defined in this way. We observed better correlations between predicted and true cross-over bitrates/VMAF at intermediate resolutions than at extreme resolutions (2160p and 432p). This is to be expected, since our quality constraints truncate different number of points as the resolutions are varied. This leads to inconsistency when calculating cross-over points at the extreme resolutions.
| Target | (2160p,1440p) | (1440p,1080p) | (1080p,720p) | (720p,540p) | (540p,432p) |
|---|---|---|---|---|---|
| Cross-Over Bitrates | 0.305 | 0.762 | 0.704 | 0.625 | 0.697 |
| Cross-Over VMAFs | 0.593 | 0.729 | 0.752 | 0.666 | 0.206 |
V-B Predicting Quality or Bitrate using Low-Level features
We compared our models against [16], where the authors utilized DCT-based texture energy features to predict the quality of compressed videos. Instead of only using DCT texture energy features, we develop a more comprehensive set of features, including metadata like , and , where , and are the bitrates, widths, and heights of the compressed videos, respectively. The expanded list of low-level features () is shown in Table III. The quality prediction models learned on these features are used to construct per-shot bitrate ladders. To construct per-shot quality ladders, we developed content-dependent bitrate prediction models. These models employ the more comprehensive set of low-level features shown in Table III, along with metadata including , , and where is the VMAF score of each analyzed compressed video, to predict the bitrates of compressed videos. These experiments help us understand the feasibility of predicting the bitrates or qualities of compressed videos using only low-level features extracted from the original source videos.
Table V shows the performances of quality and bitrate prediction models using only low-level video features. It may be observed that the performances of the quality prediction models was slightly higher than that of bitrate prediction models. We found that calculating aggregate PLCC values across all resolutions yields misleading interpretations of model performance at individual resolutions. Hence, we instead report the PLCC values for each resolution.
| Target | 2160p | 1440p | 1080p | 720p | 540p | 432p |
|---|---|---|---|---|---|---|
| Quality | 0.58 | 0.642 | 0.668 | 0.677 | 0.643 | 0.602 |
| Bitrate | 0.565 | 0.598 | 0.617 | 0.626 | 0.613 | 0.595 |
V-C Predicting Quality or Bitrate using Metadata
Fixed bitrate ladders [3] are generally designed considering a variety of content-independent video characteristics, network conditions, resolutions, and bitrates. We designed a quality prediction model that aims to predict the quality of compressed videos without using any content-dependent features. This quality prediction model is the best statistical fit to the training data based on , , and . Although it appears similar to a fixed bitrate ladder, this model is dependent on the characteristics of the videos in the training dataset and the encoding settings used to compress them. We also designed counterpart bitrate prediction models that only train on , , and .
We compared the performances of our models against the two metadata-based models, towards understanding the advantages conferred by using video content features. Table VI shows the performances of the bitrate and quality prediction models. The performances of bitrate and quality prediction models are similar, but worse than that of the regressors trained only on low-level features (Table V).
| Target | 2160p | 1440p | 1080p | 720p | 540p | 432p |
|---|---|---|---|---|---|---|
| Quality | 0.458 | 0.521 | 0.552 | 0.548 | 0.5 | 0.421 |
| Bitrate | 0.475 | 0.52 | 0.535 | 0.523 | 0.48 | 0.408 |
V-D Predicting Quality or Bitrate using VIF Features
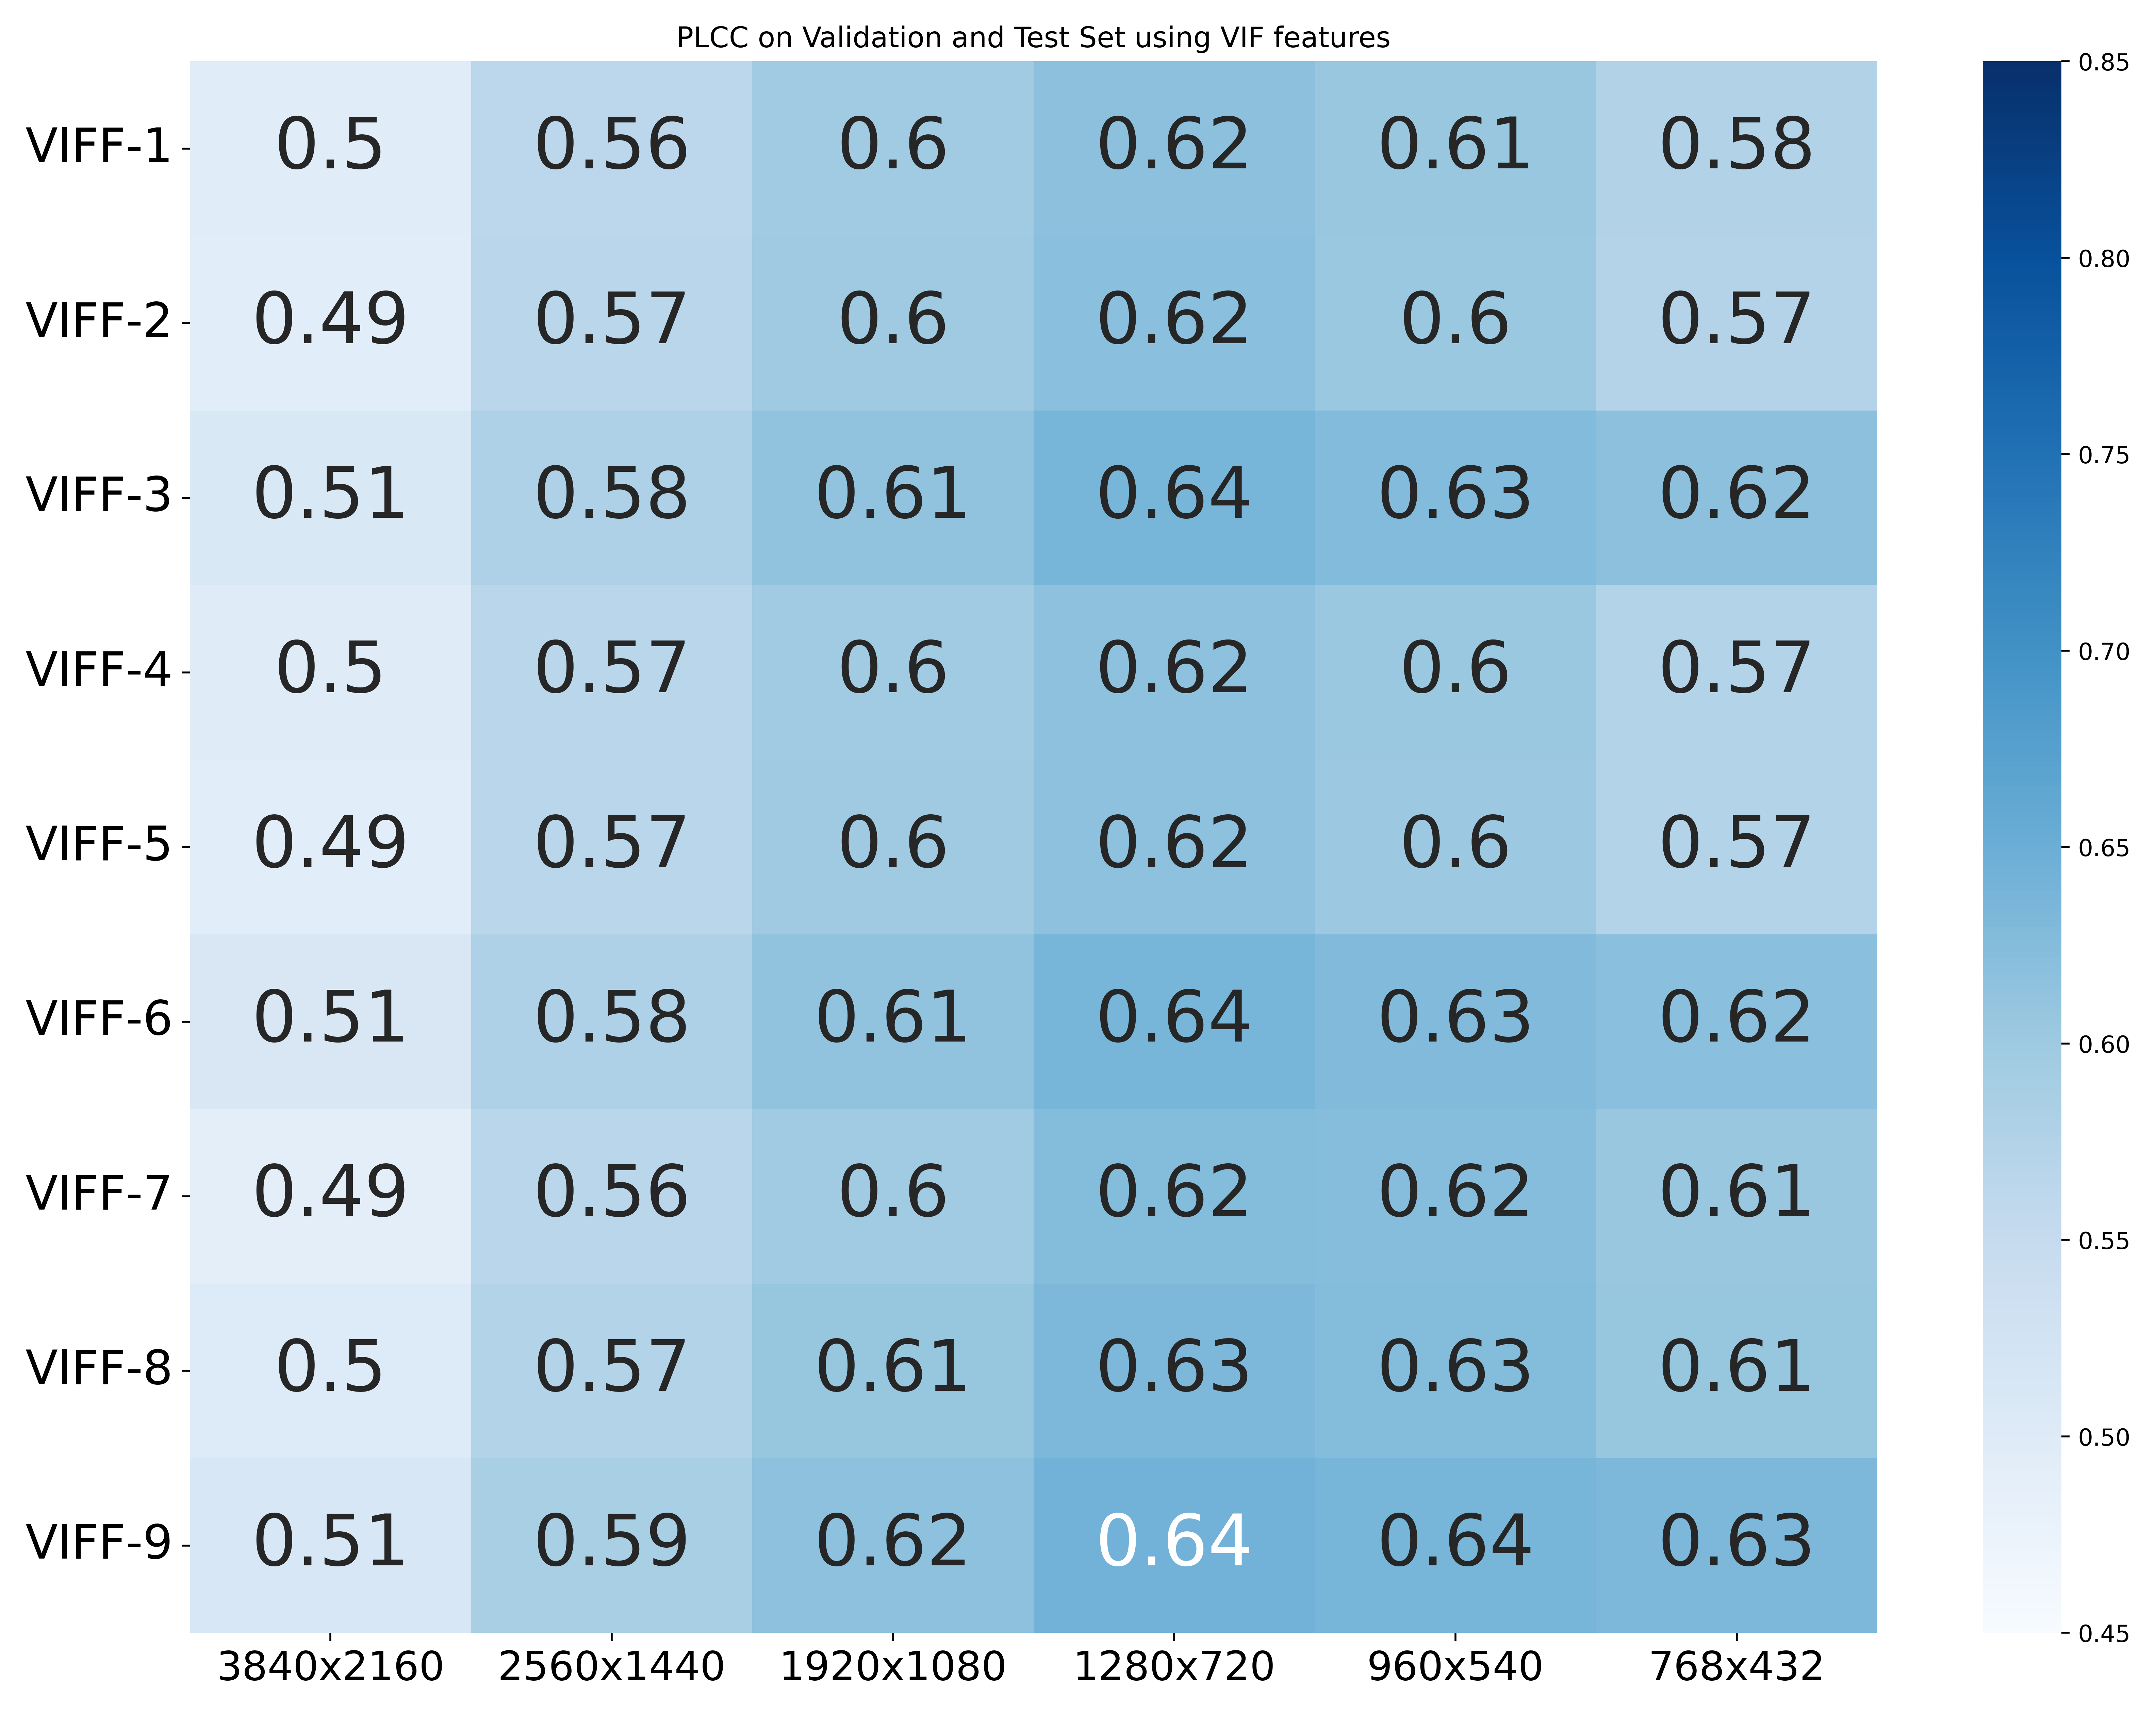
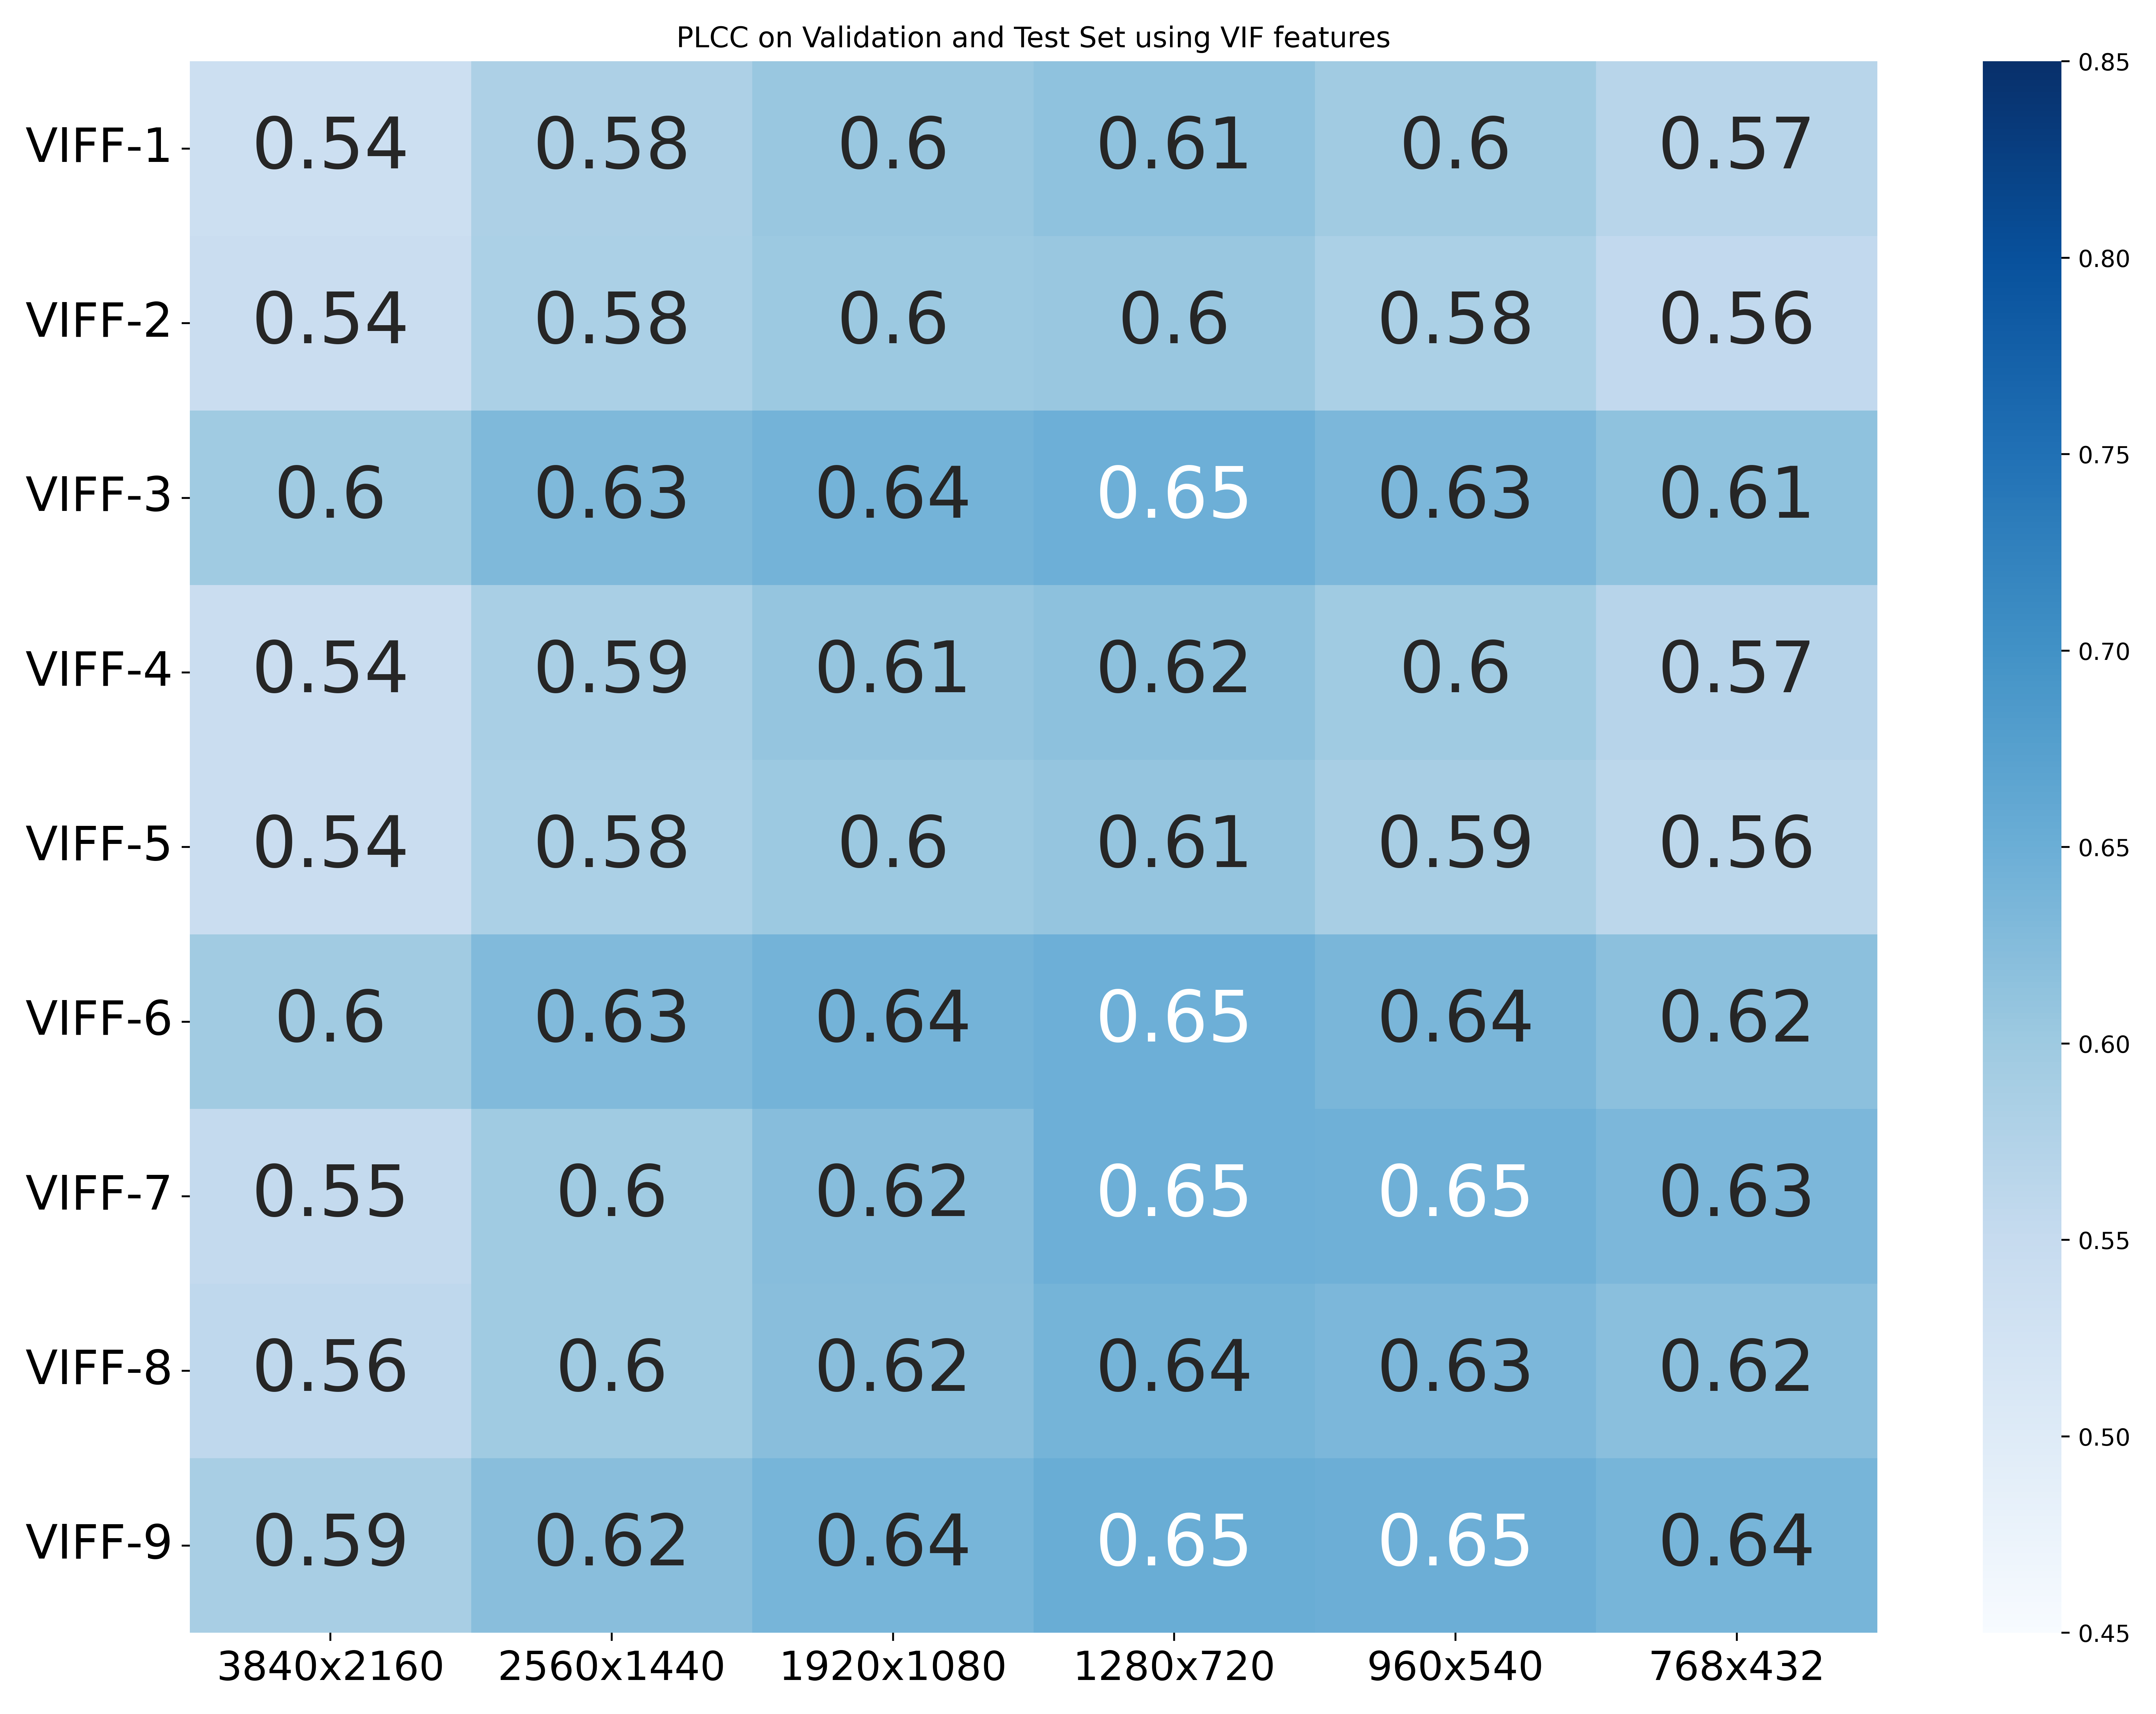
Each VIF feature set contains features extracted from different scales and subbands of uncompressed source videos. Here we examine the performance of these models built using VIF features under different experimental settings and quality constraints. We also designed integrated models trained on VIF feature sets combined with metadata like , , and , to learn to predict the bitrates of compressed videos. Comparing the performances of these methods helps us to understand the accuracy, feasibility, and efficacy of constructing bitrate and quality ladders using VIF feature sets.
Fig. 5 shows the performances of bitrate and quality prediction models for each VIF feature set and resolution using color coding. Over the range of implemented CRF values the performances of the two models were similar. Models trained on yielded slightly better correlations against subjectivity when predicting bitrates and qualities across resolutions. The performances of the best performing models was similar to the performances of models trained on low-level features.
V-E Predicting Quality or Bitrate using an Ensemble of Low-Level features and VIF features
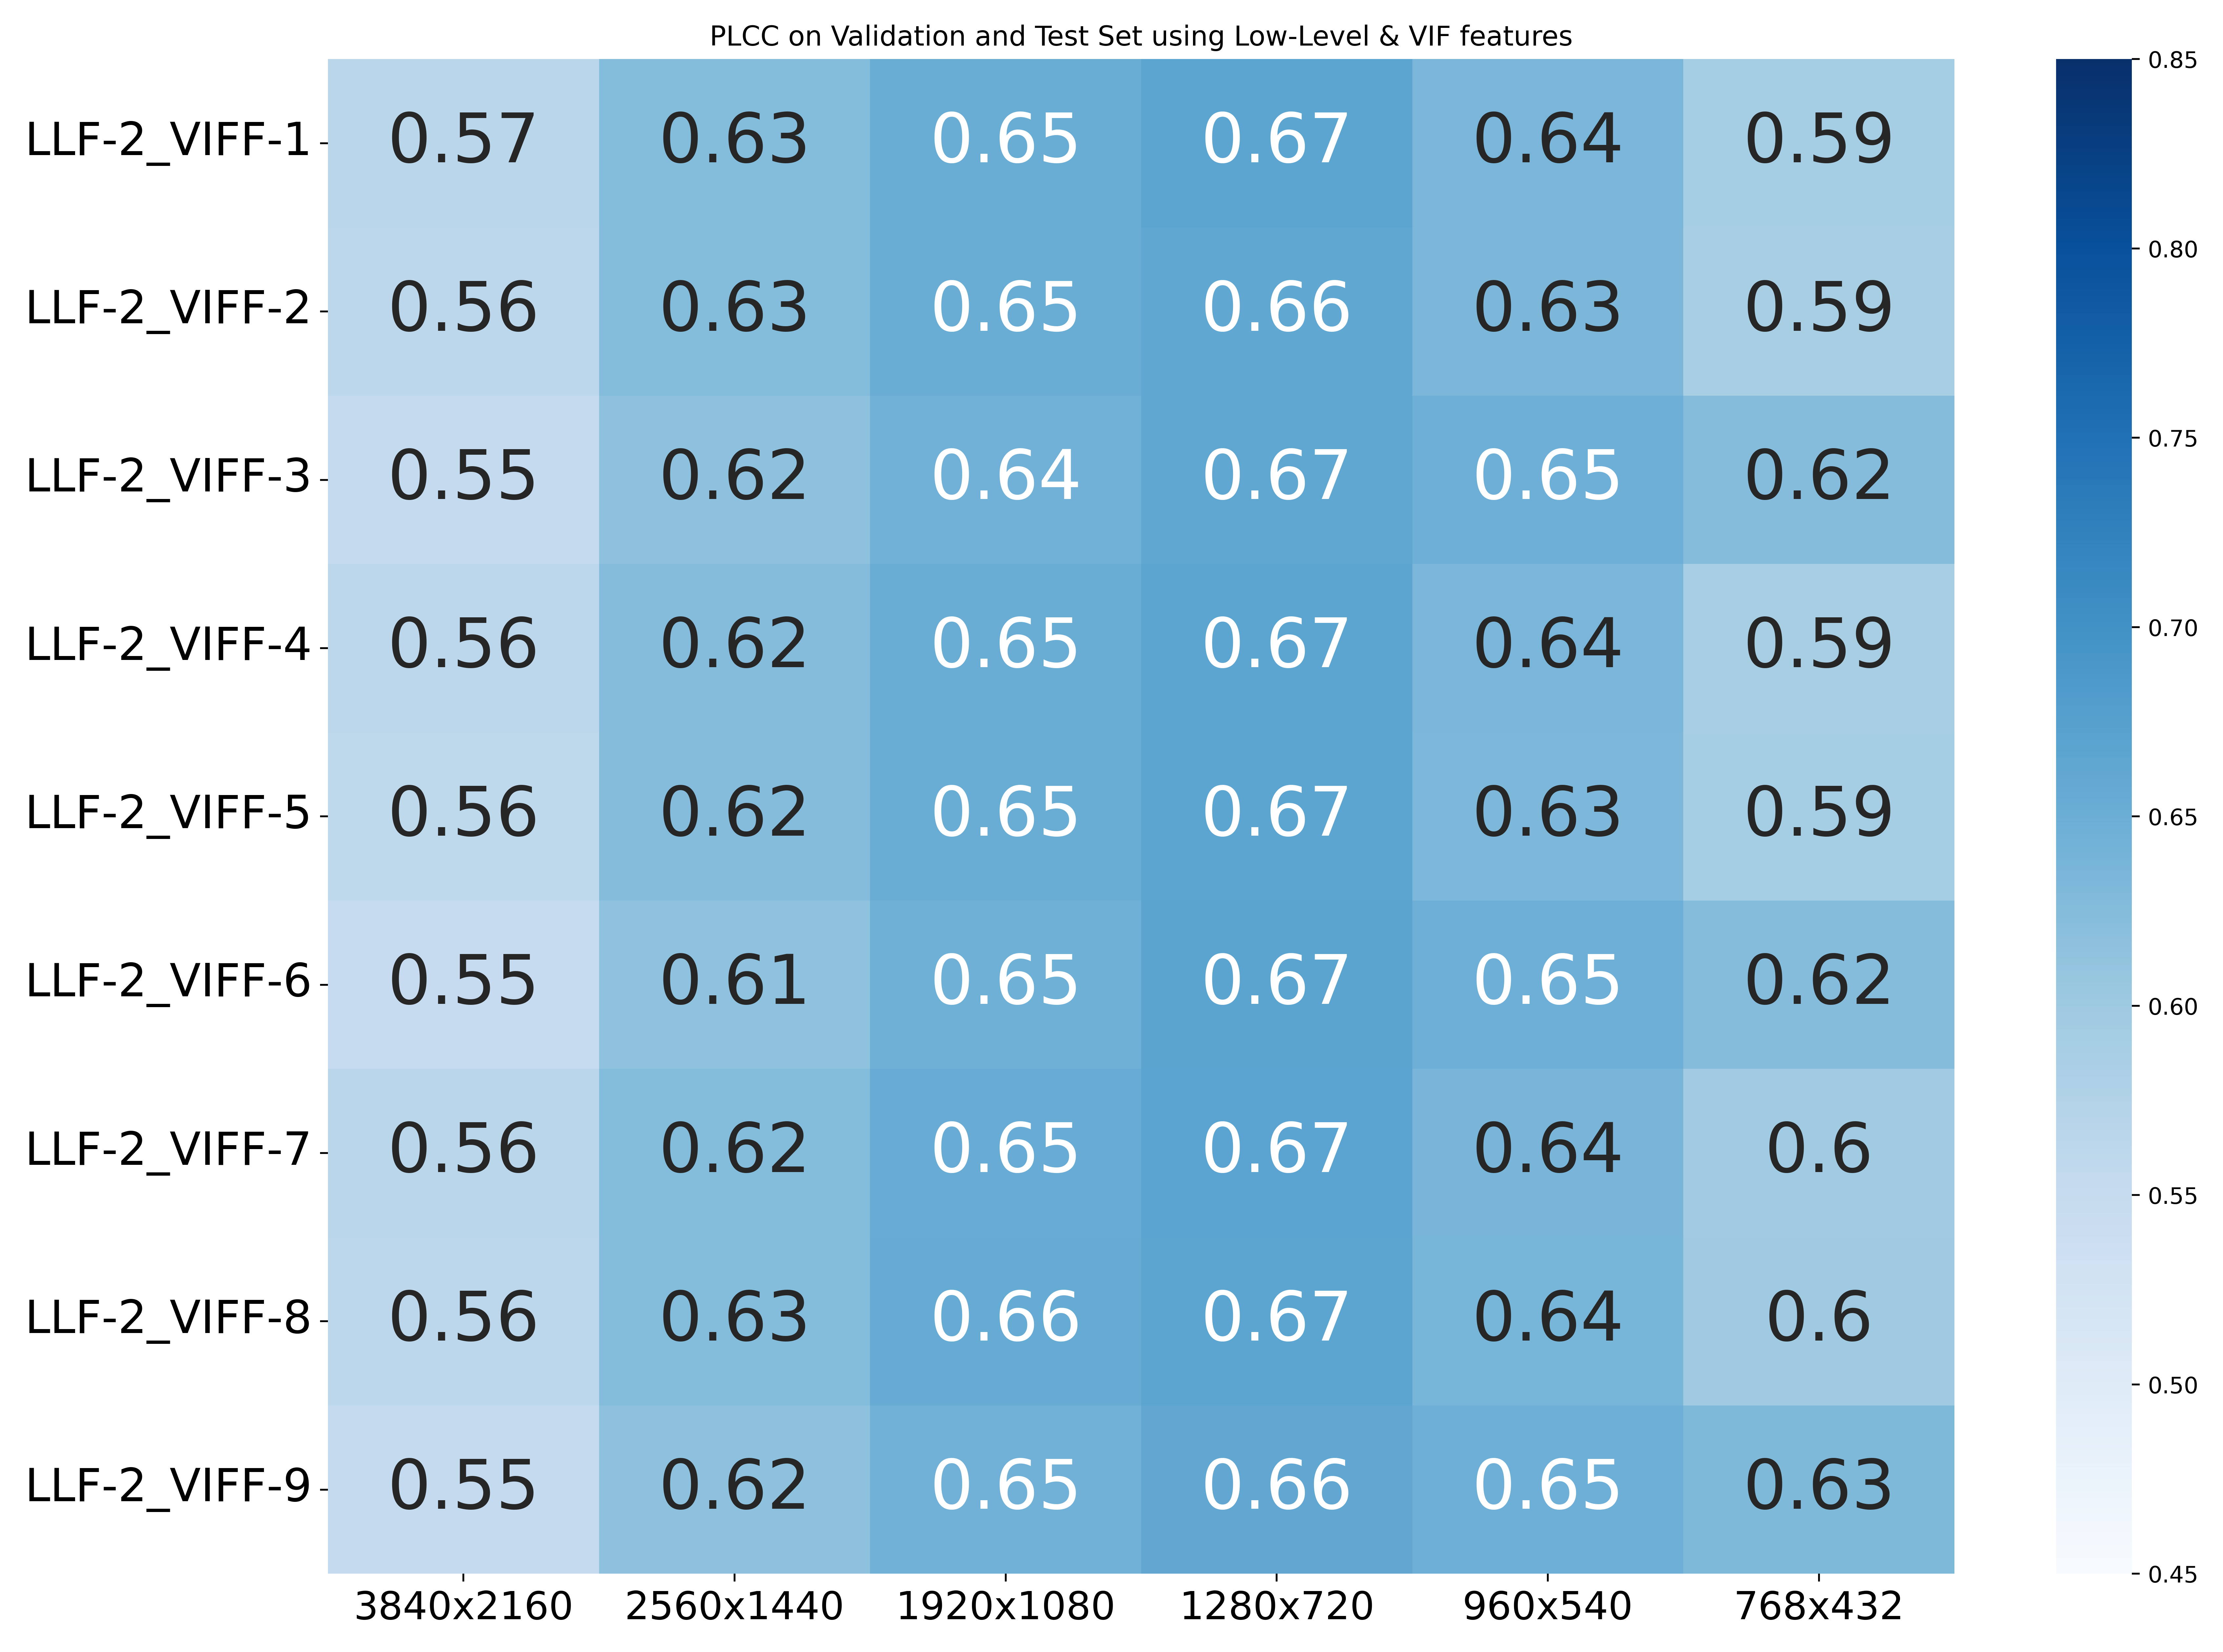
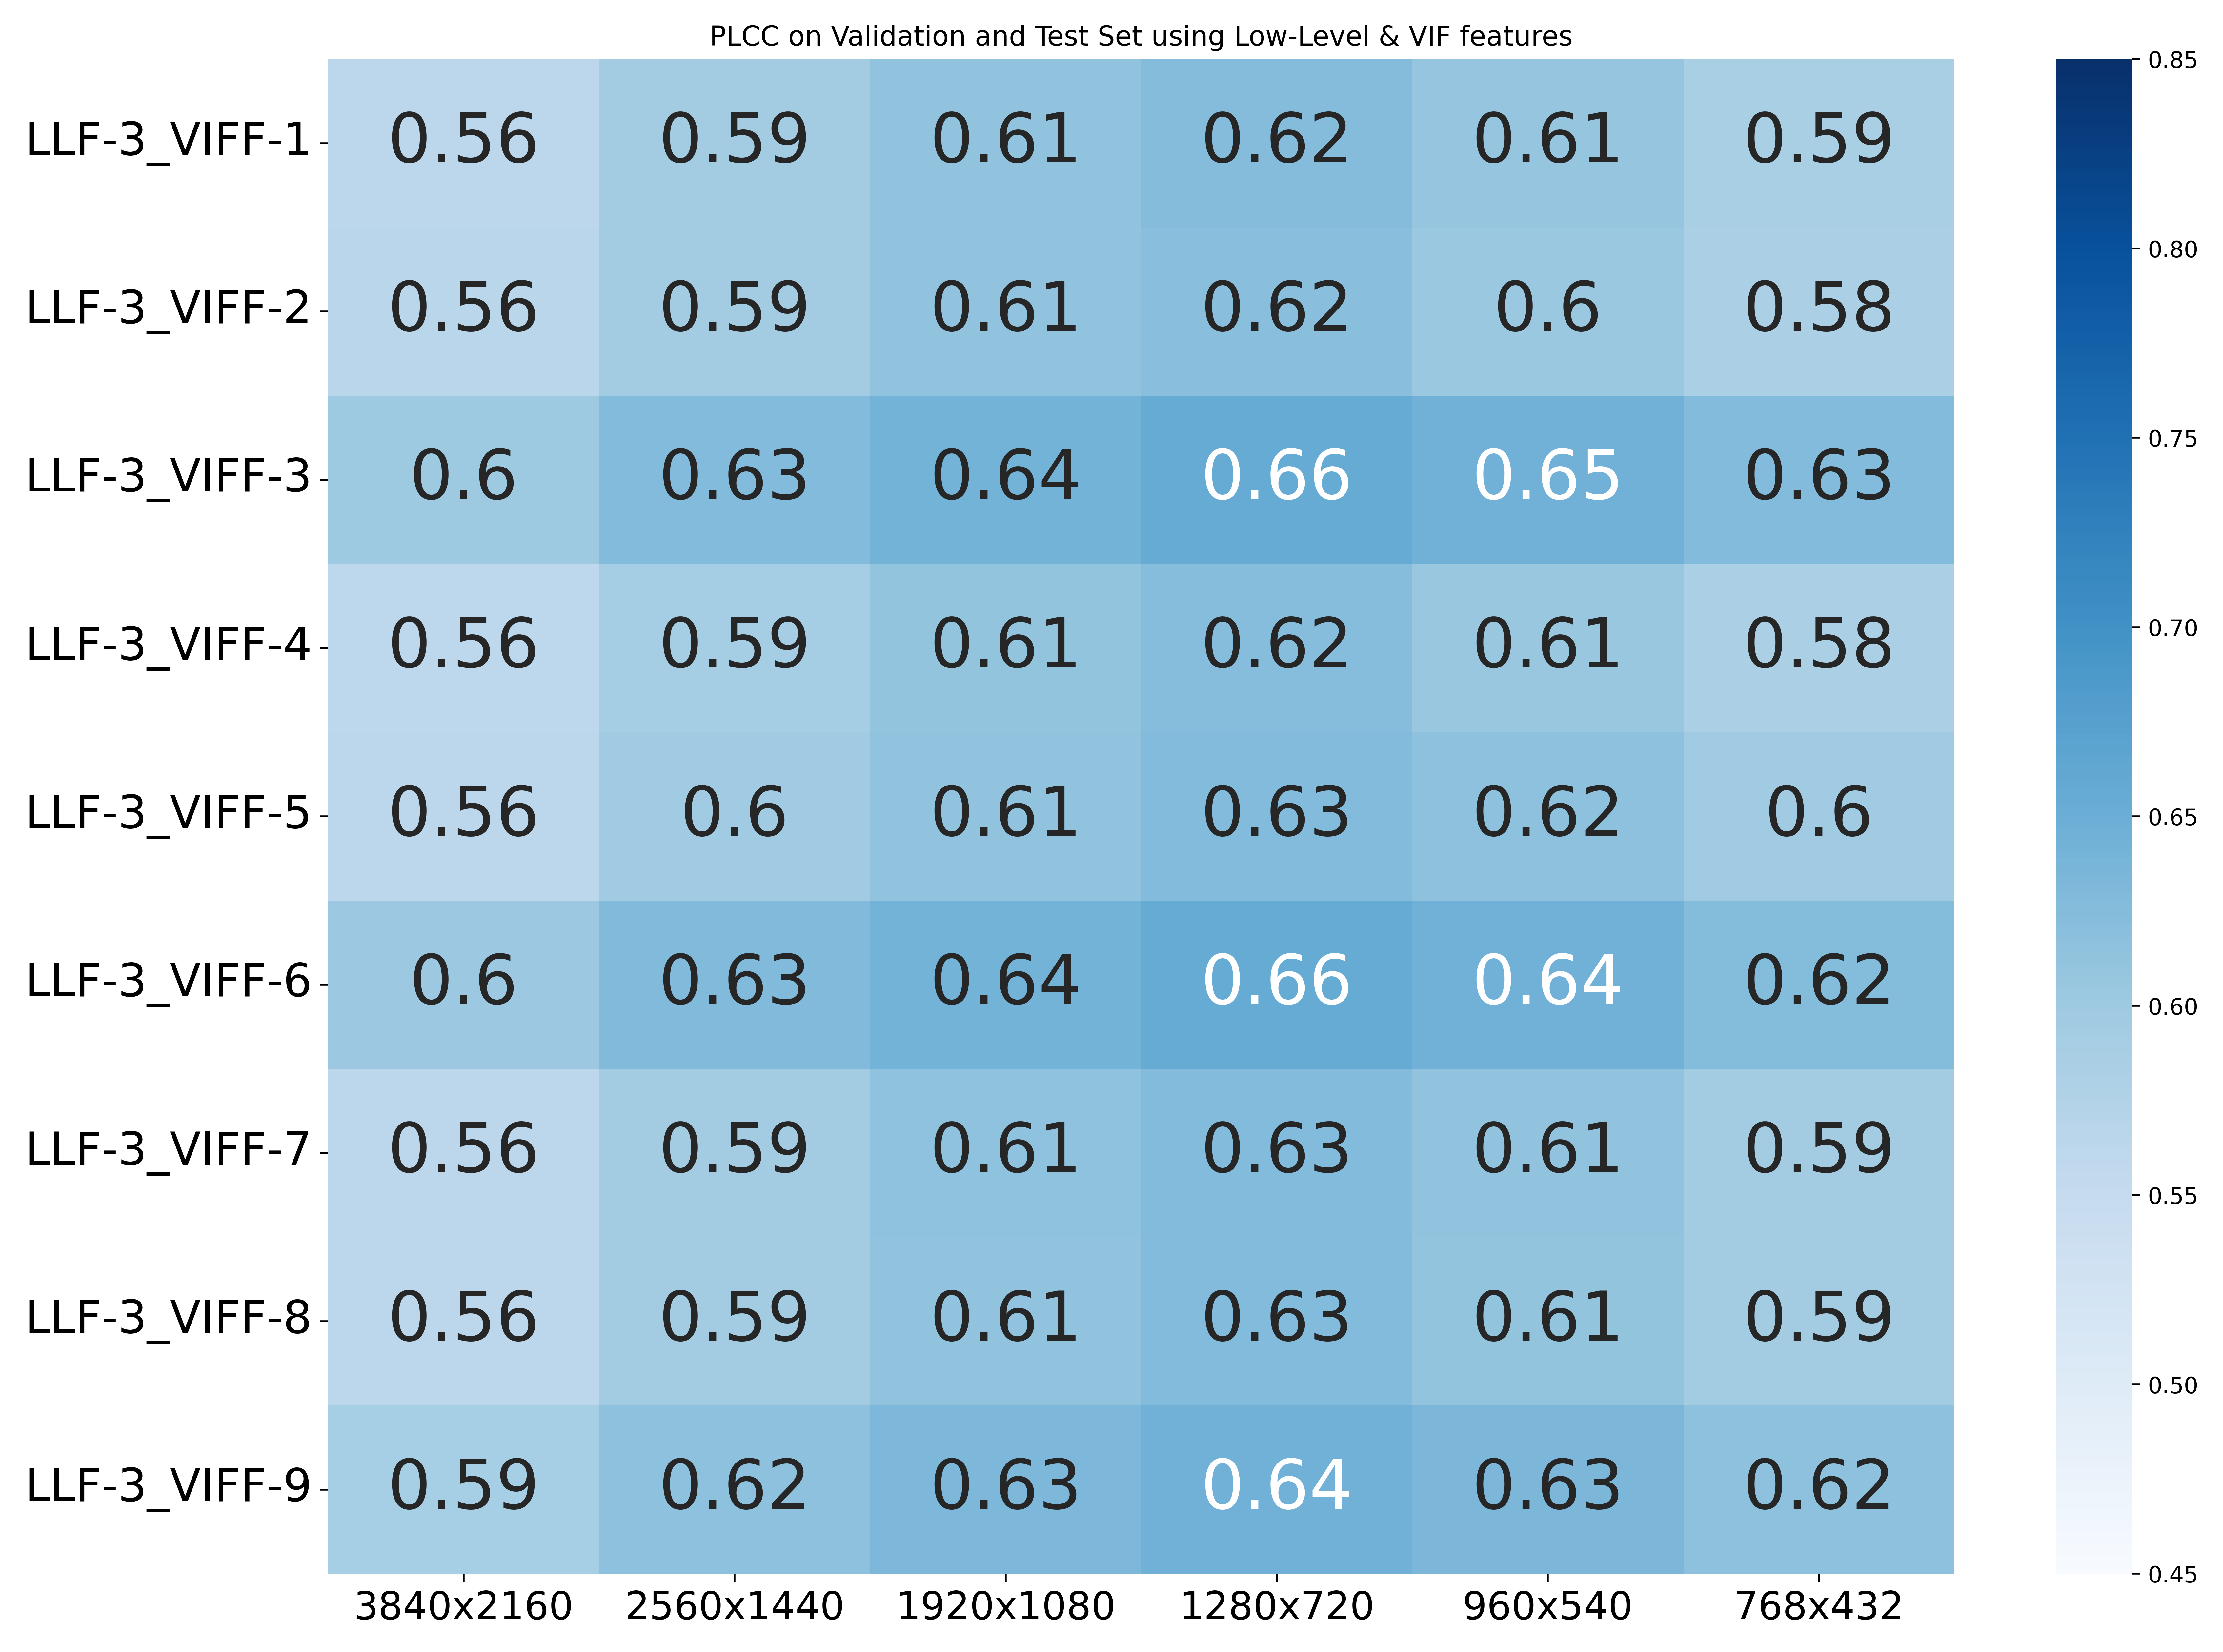
Low-level features and VIF feature sets extract different and complementary features from videos. The low-level features that we use include GLCM, TC, SI, TI, CTI, CI, CF, and DCT texture energy features, while VIF feature sets are based on quality-aware Natural Scene Statistics (NSS). We considered an ensemble of low-level features and VIF features to determine whether training on their combined, complementary measurements could enhance the performance of bitrate or quality prediction models. We deployed nine different ensemble pairs from and , where , to combine video content dependent features along with metadata features , , and , to learn video quality prediction models. We also formed nine pairs from , , along with , , and for which to learn bitrate prediction models.
Fig. 6 shows the performances of the resulting learned bitrate and quality prediction models. It may be observed that the quality prediction models were slightly more successful (better correlations) than the bitrate prediction models. The regressors trained on / and yield slightly better performance than the other models across resolutions. The performances of these models was similar to the best performing models trained on either low-level features or VIF features. However, it should be understood that these correlations do not indicate the potential performance gains of these models when used to construct bitrate or quality ladders, or their BD-Rate or BD-VMAF gains, against fixed bitrate ladders.
V-F Correction Algorithms
In the preceding, we have studied various techniques for predicting per-shot bitrate and quality ladders, using video quality and bitrate prediction models, respectively. Given that machine learning models are prone to errors, it is important to consider corrective measures on the predicted ladders to rectify any inaccuracies. In [8], we suggested a correction mechanism such that traversing the bitrate ladder from top to bottom (from higher to lower bitrates), will satisfy the condition that the optimal resolution at a current bitrate step should no larger than the optimal resolution at the previous step. This strategy works because:
-
•
Our dataset consists of videos compressed at six different resolutions (from 2160p to 432p) and covering a broad range of CRFs. Every resolution of each video spans a different bitrate range, with higher resolutions generally having higher quality ranges and lower resolutions having lower quality ranges.
-
•
Given this, it is reasonable to assume the presence of an inherent bias within the dataset, where higher resolutions generally have higher quality ratings and vice versa. This bias acts as both an advantage and disadvantage during the learning process.
-
•
During training, models learn to predict the quality of compressed videos based on their content features, bandpass statistical distributions, bitrates, and resolutions. The aforementioned bias in the dataset, which is also characteristic of rate-quality curves of videos having different resolutions and bitrates, helps these models learn to more accurately predict quality.
-
•
When constructing a bitrate ladder, we use the predicted quality scores of compressed videos at each bitrate, but over all resolutions, whereby the resolution having the highest predicted quality is selected as the optimal resolution for encoding at that bitrate.
-
•
During prediction, we have observed that the quality predictions computed on high-resolution compressed videos, tend to be higher, (particularly at lower bitrates) suggesting that the learning models overestimate quality. This is likely also due to the above mentioned bias observed in the dataset. This results in bitrate ladders where high resolutions are determined to be optimal resolutions at low bitrates.
-
•
However, imposing the condition that optimal resolutions should not increase as bitrate is decreased compensates for any incorrectly predicted optimal resolutions at lower bitrates. We will refer to this as Top-to-Bottom correction.
This correction mechanism is ineffective for quality ladder prediction where we predict bitrates. During quality ladder construction, we predict bitrates across multiple resolutions at each VMAF/quality level, then the resolution associated with the lowest bitrate prediction is selected as the optimal resolution. In this case, we have observed that the dataset bias causes the predicted optimal resolutions to generally be lower than expected for generally higher quality scores. In this case, a reverse-ordering constraint: from lower to higher quality, such that the optimal resolution at a current quality step is no less than the optimal resolution at lower quality steps, compensates for the lower resolutions predicted at higher quality scores. We refer to this as Bottom-to-Top correction.
Tables VII and VIII depict simulated examples of these Top-to-Bottom and Bottom-to-Top ladder correction strategies applied to bitrate ladders and quality ladders, respectively. These correction techniques are applied after the bitrate or quality ladders are constructed.
| Bitrate (in kbps) | Optimal Resolution |
|---|---|
| 4000 | (1920,1080) |
| 3000 | (1280,720) |
| 2000 | (1920,1080) |
| 1000 | (960,540) |
| 500 | (3840,2160) |
| Bitrate (in kbps) | Optimal Resolution |
|---|---|
| 4000 | (1920,1080) |
| 3000 | (1280,720) |
| 2000 | (1280,720) |
| 1000 | (960,540) |
| 500 | (960,540) |
| Quality (VMAF) | Optimal Resolution |
|---|---|
| 92.5 | (960,540) |
| 90 | (2560,1440) |
| 85 | (1920,1080) |
| 80 | (1280,720) |
| 75 | (1920,1080) |
| Quality (VMAF) | Optimal Resolution |
|---|---|
| 92.5 | (2560,1440) |
| 90 | (2560,1440) |
| 85 | (1920,1080) |
| 80 | (1920,1080) |
| 75 | (1920,1080) |
V-G Bjontegaard Delta Metrics
One of the most commonly used techniques for evaluating or comparing the compression efficiency of video codecs, presets, or encoding modes is by calculating bitrate and quality savings using the Bjøntegaard Delta (BD) method [30]. It measures the average difference between two RQ curves by fitting a third-order cubic polynomial through the data points, and then calculating the integral to estimate the average bitrate savings, referred to as BD-Rate, and the average quality savings, referred to as BD-Quality (e.g., BD-PSNR or BD-VMAF). Although there are many implementations of this concept, based on the results in [31], we used the implementation proposed in [32].
Since we are performing constant-quality encoding, at each step in the bitrate ladder and its corresponding optimal resolution , to construct the convex hull, we utilize the RQ points of the video from the dataset having resolution of , with bitrates lying within the range [, ]. We use this process, rather than selecting the nearest point, to obtain a precise convex hull for BD metric calculations. We applied a similar procedure when constructing convex hulls for quality ladders. We calculated the BD-Rate and BD-VMAF on each video in the validation and test datasets against the fixed bitrate ladder [3] and the reference bitrate ladder. The reference bitrate ladders were constructed by sampling the convex hull constructed by exhaustive encoding using the bitrate ladder steps we previously mentioned. We report the mean and standard deviation of BD-Rate and BD-VMAF for each of the compared techniques, on the combined validation and test datasets.
Neither the mean nor the standard deviation of BD-Rate and BD-Quality provides sufficient information to compare the performances of the two techniques, nor help in providing any insights into whether the predicted bitrate, or the predicted quality, changes monotonically or not. So, in addition, to the mean and standard deviation of BD metrics, we calculated the closeness of the performance of a method to the exhaustive reference bitrate ladder, by estimating the fractions of samples yielding both BD-Rate savings and BD-VMAF gain greater than 75%, 50%, and 25% of BD metrics of reference bitrate ladder against fixed bitrate ladder, which we denote by , , and , respectively. We also performed a monotonicity check to determine that the predicted bitrates or qualities monotonically change at each resolution of every video file in the test and validation datasets. This also helps to determine whether the learned models overfit on the training dataset, viz., learned a non-monotonic rate quality mapping. We trained the bitrate and quality prediction models with hyperparameters such that there were no regular failures of monotonicity.
V-H Constructing Per-Shot Bitrate and Quality Ladders
The construction of per-shot reference bitrate ladders is achieved by sampling the convex hulls computed on videos from both the validation and test datasets. The reference bitrate ladder demonstrated a BD-Rate performance having a mean improvement of (negative BD-rate means a gain in bitrate) and a standard deviation of , and a BD-VMAF performance having a mean improvement of (positive means gain in quality) and standard deviation against the fixed bitrate ladder [3]. Our models were compared against techniques that predict cross-over bitrates or cross-over VMAF points. For more accurate comparisons, we computed the performance of bitrate and quality ladders constructed using true cross-over bitrates and VMAFs points, respectively. We found that the bitrate ladder constructed using true cross-over bitrates, attained a BD-rate performance having a mean improvement of , and a standard deviation of . It also obtained a BD-VMAF performance having a mean improvement of and a standard deviation of . In a similar vein, the quality ladder constructed using true cross-over VMAF points, demonstrated a BD-rate performance having a mean improvement of and a standard deviation of , and a BD-VMAF performance having a mean improvement of and standard deviation .
| Features Set | BL vs Fixed Bitrate Ladder | BL vs Reference Bitrate Ladder | |||||
|---|---|---|---|---|---|---|---|
| BD-Rate (in %) | BD-VMAF | BD-Rate (in %) | BD-VMAF | ||||
| , , | |||||||
| , , , | |||||||
| , , , | |||||||
| , , , | |||||||
| , , , | |||||||
| , , , | |||||||
| , , , | |||||||
| , , , | |||||||
| , , , | |||||||
| , , , | |||||||
| , , , | |||||||
| , , , , | |||||||
| , , , , | |||||||
| , , , , | |||||||
| , , , , | |||||||
| , , , , | |||||||
| , , , , | |||||||
| , , , , | |||||||
| , , , , | |||||||
| , , , , | |||||||
| (Cross-Over bitrates) | |||||||
| Features Set | QL vs Fixed Bitrate Ladder | QL vs Reference Bitrate Ladder | |||||
|---|---|---|---|---|---|---|---|
| BD-Rate (in %) | BD-VMAF | BD-Rate (in %) | BD-VMAF | ||||
| , , | |||||||
| , , , | |||||||
| , , , | |||||||
| , , , | |||||||
| , , , | |||||||
| , , , | |||||||
| , , , | |||||||
| , , , | |||||||
| , , , | |||||||
| , , , | |||||||
| , , , | |||||||
| , , , , | |||||||
| , , , , | |||||||
| , , , , | |||||||
| , , , , | |||||||
| , , , , | |||||||
| , , , , | |||||||
| , , , , | |||||||
| , , , , | |||||||
| , , , , | |||||||
| (Cross-Over VMAFs) | |||||||
The performances of the per-shot bitrate ladders and quality ladders, constructed using the various described methods, are presented in Tables IX and X, respectively. These are compared against a fixed bitrate ladder [3] and reference exhaustive bitrate ladders. In Table IX, all rows, except the last one, show the performances of bitrate ladders constructed using quality prediction methods. The last row presents the performance of bitrate ladders constructed by predicting cross-over bitrates. Similarly, in Table X, all rows, barring the last one, list the performances of quality ladders constructed using bitrate prediction methods. The last row of the Table shows the performance of quality ladders constructed by predicting cross-over VMAF points.
From Table IX and Table X, it is evident that per-shot bitrate and quality ladders constructed using VIF feature sets yield significant gains in terms of both quality and bitrates against fixed bitrate ladders [3]. It may also be observed that the bitrate and quality ladders constructed using the ensemble of low-level features and VIF features provide even better BD-Rate and BD-VMAF gains against the fixed bitrate ladder [3], as compared to either using only low-level features or VIF features. This is also reflected in their performance against the reference bitrate ladders, as they obtain reduced BD-rate and BD-VMAF losses as compared with the non-ensemble methods. Interestingly, the performance of ladders constructed using only low-level features was better than the performance of ladders constructed using only VIF features.
All these methods learn to predict bitrate/quality ladders based on video content, which can be understood based on the performance of ladders constructed only using metadata. The metrics , , and provide insights into the relative performances of bitrate and quality ladders, including the reference bitrate ladder. For each method, a high value of signifies that a large proportion of test samples, encompassing both validation and test datasets, exhibit a BD-Rate and BD-VMAF gains more than of the BD-Rate and BD-VMAF gains of the reference bitrate ladder against the fixed bitrate ladder [3].
One of the salient differences between per-shot bitrate and quality ladders constructed by predicting quality and bitrate (respectively) is that predicted per-shot bitrate ladders struggle at low bitrates and include fewer low resolutions, while the predicted per-shot quality ladders tend to struggle at higher qualities and include fewer high resolutions. This can be ascribed to errors in the ML models during prediction. For this reason, the BD-Rate gains demonstrated by the quality ladders were slightly higher than the BD-Rate gains of bitrate ladders, against a fixed bitrate ladder, since the quality ladders contain fewer high resolutions.
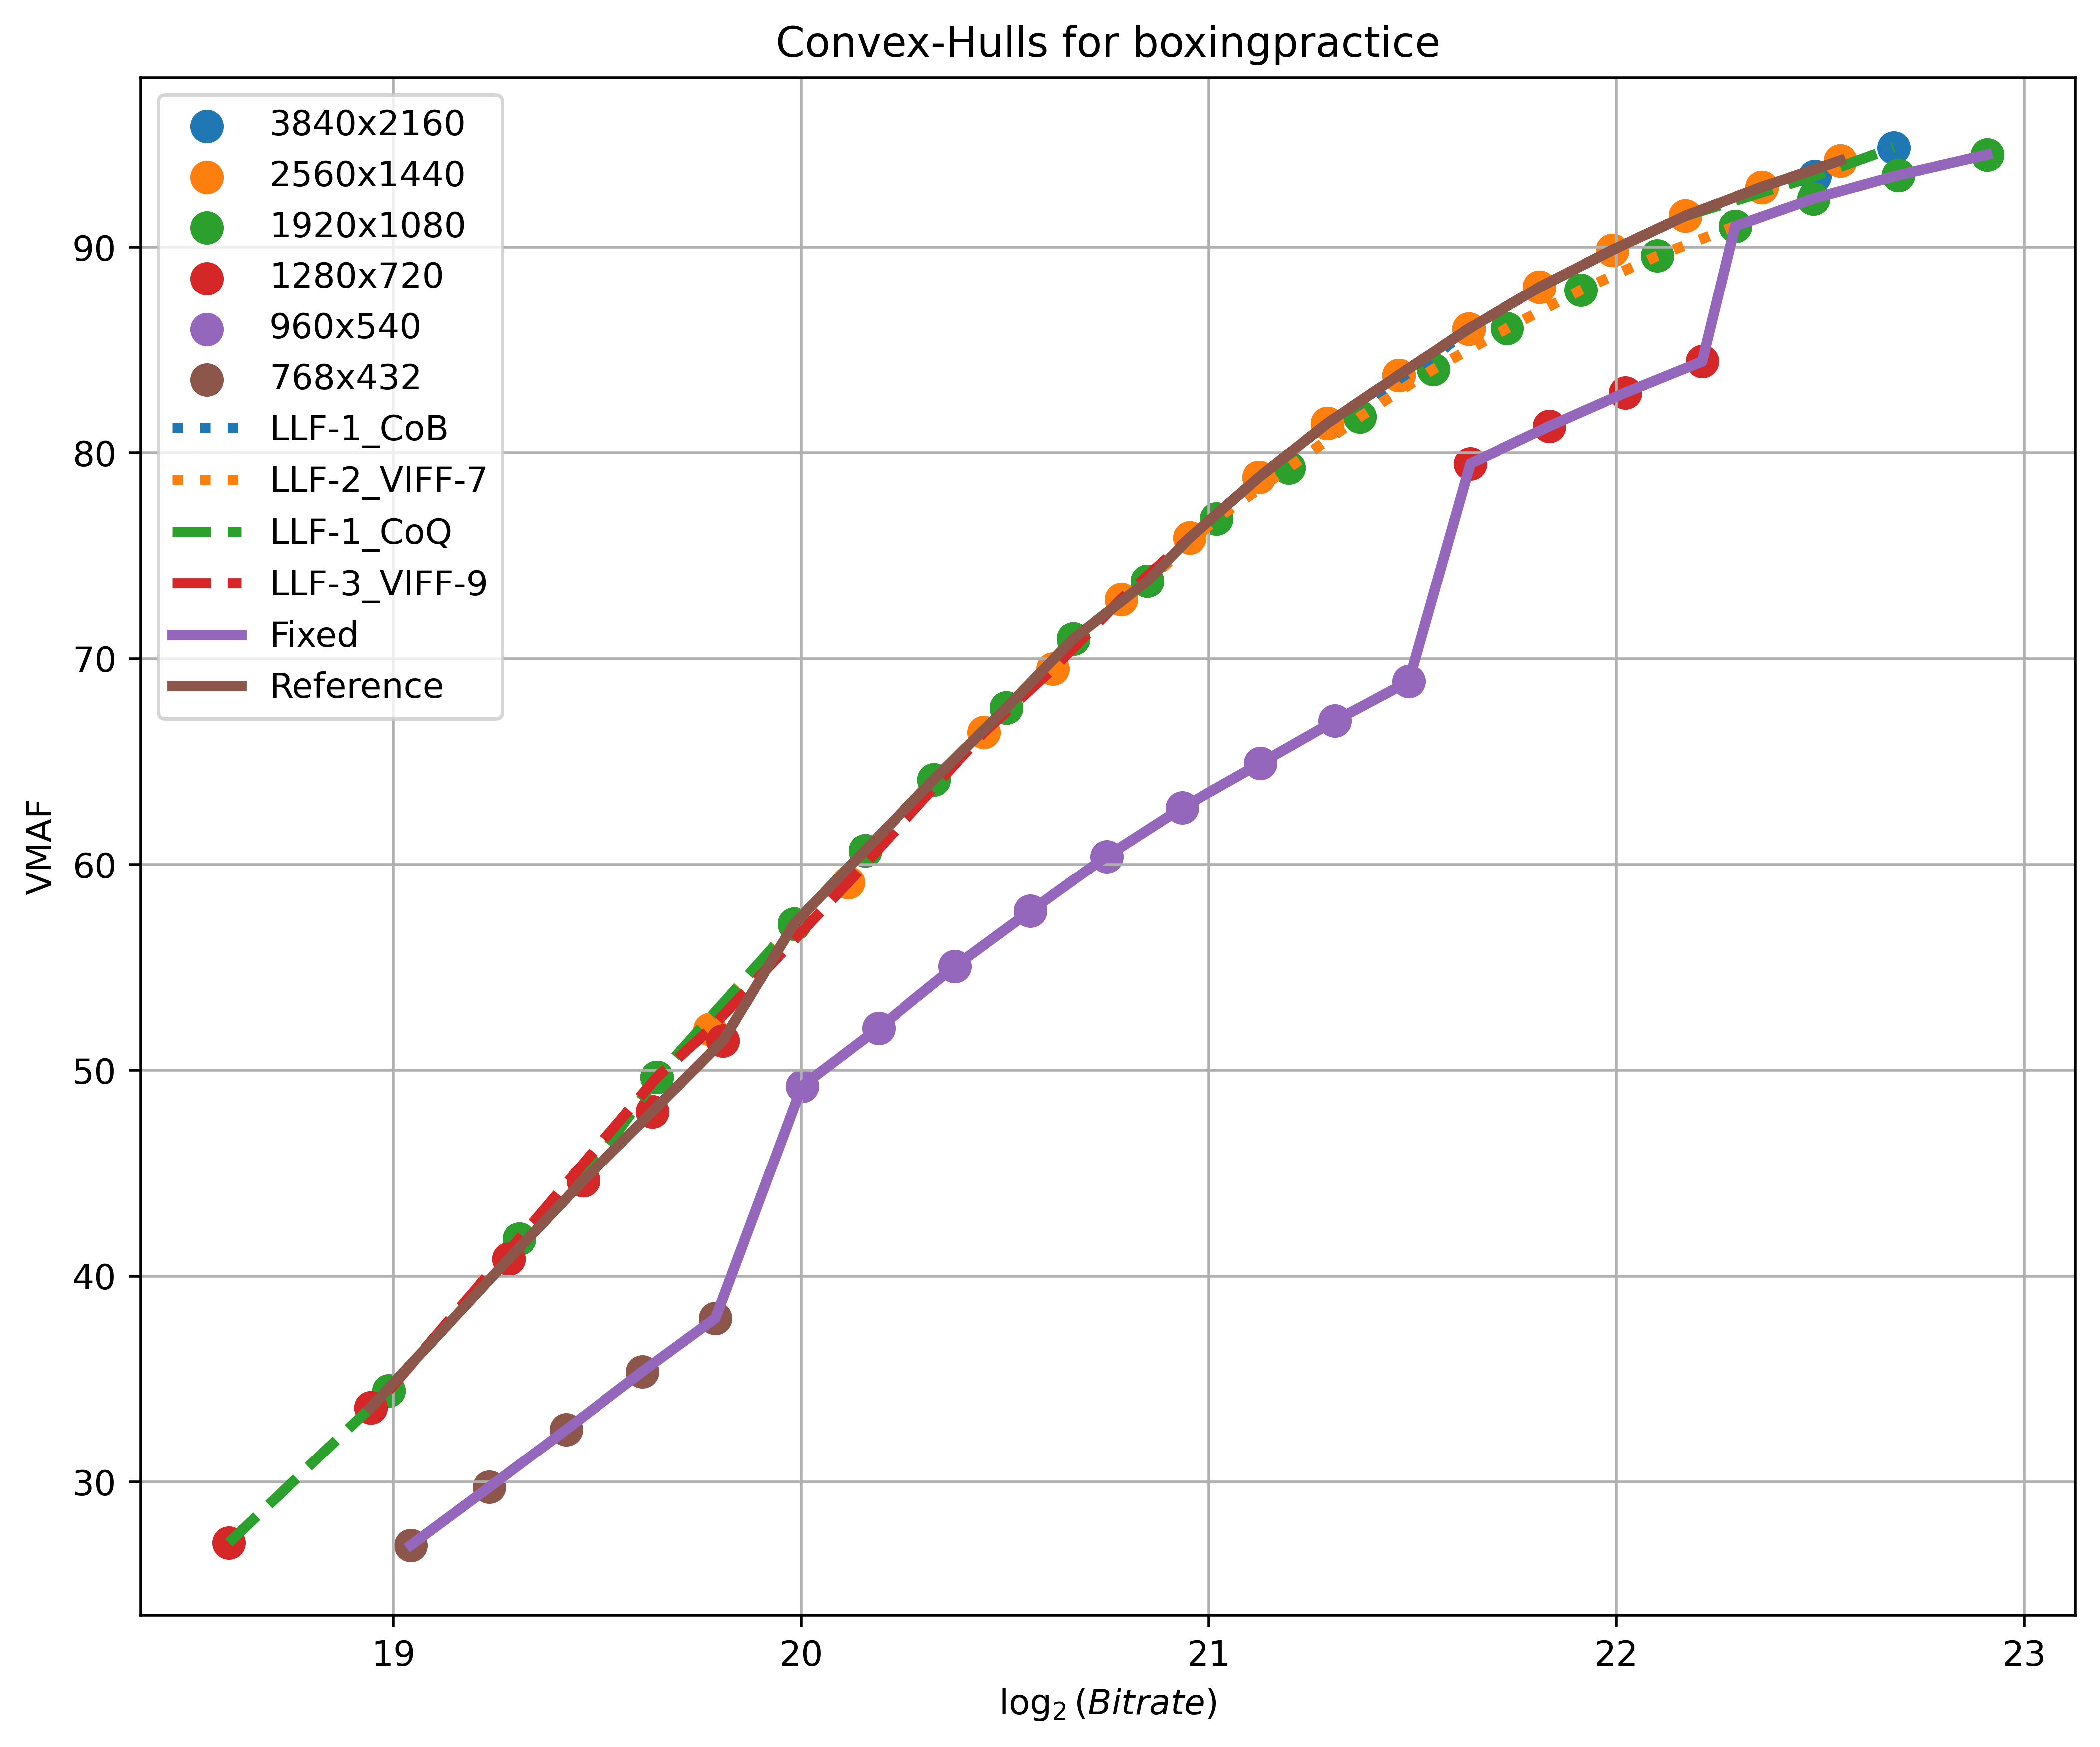
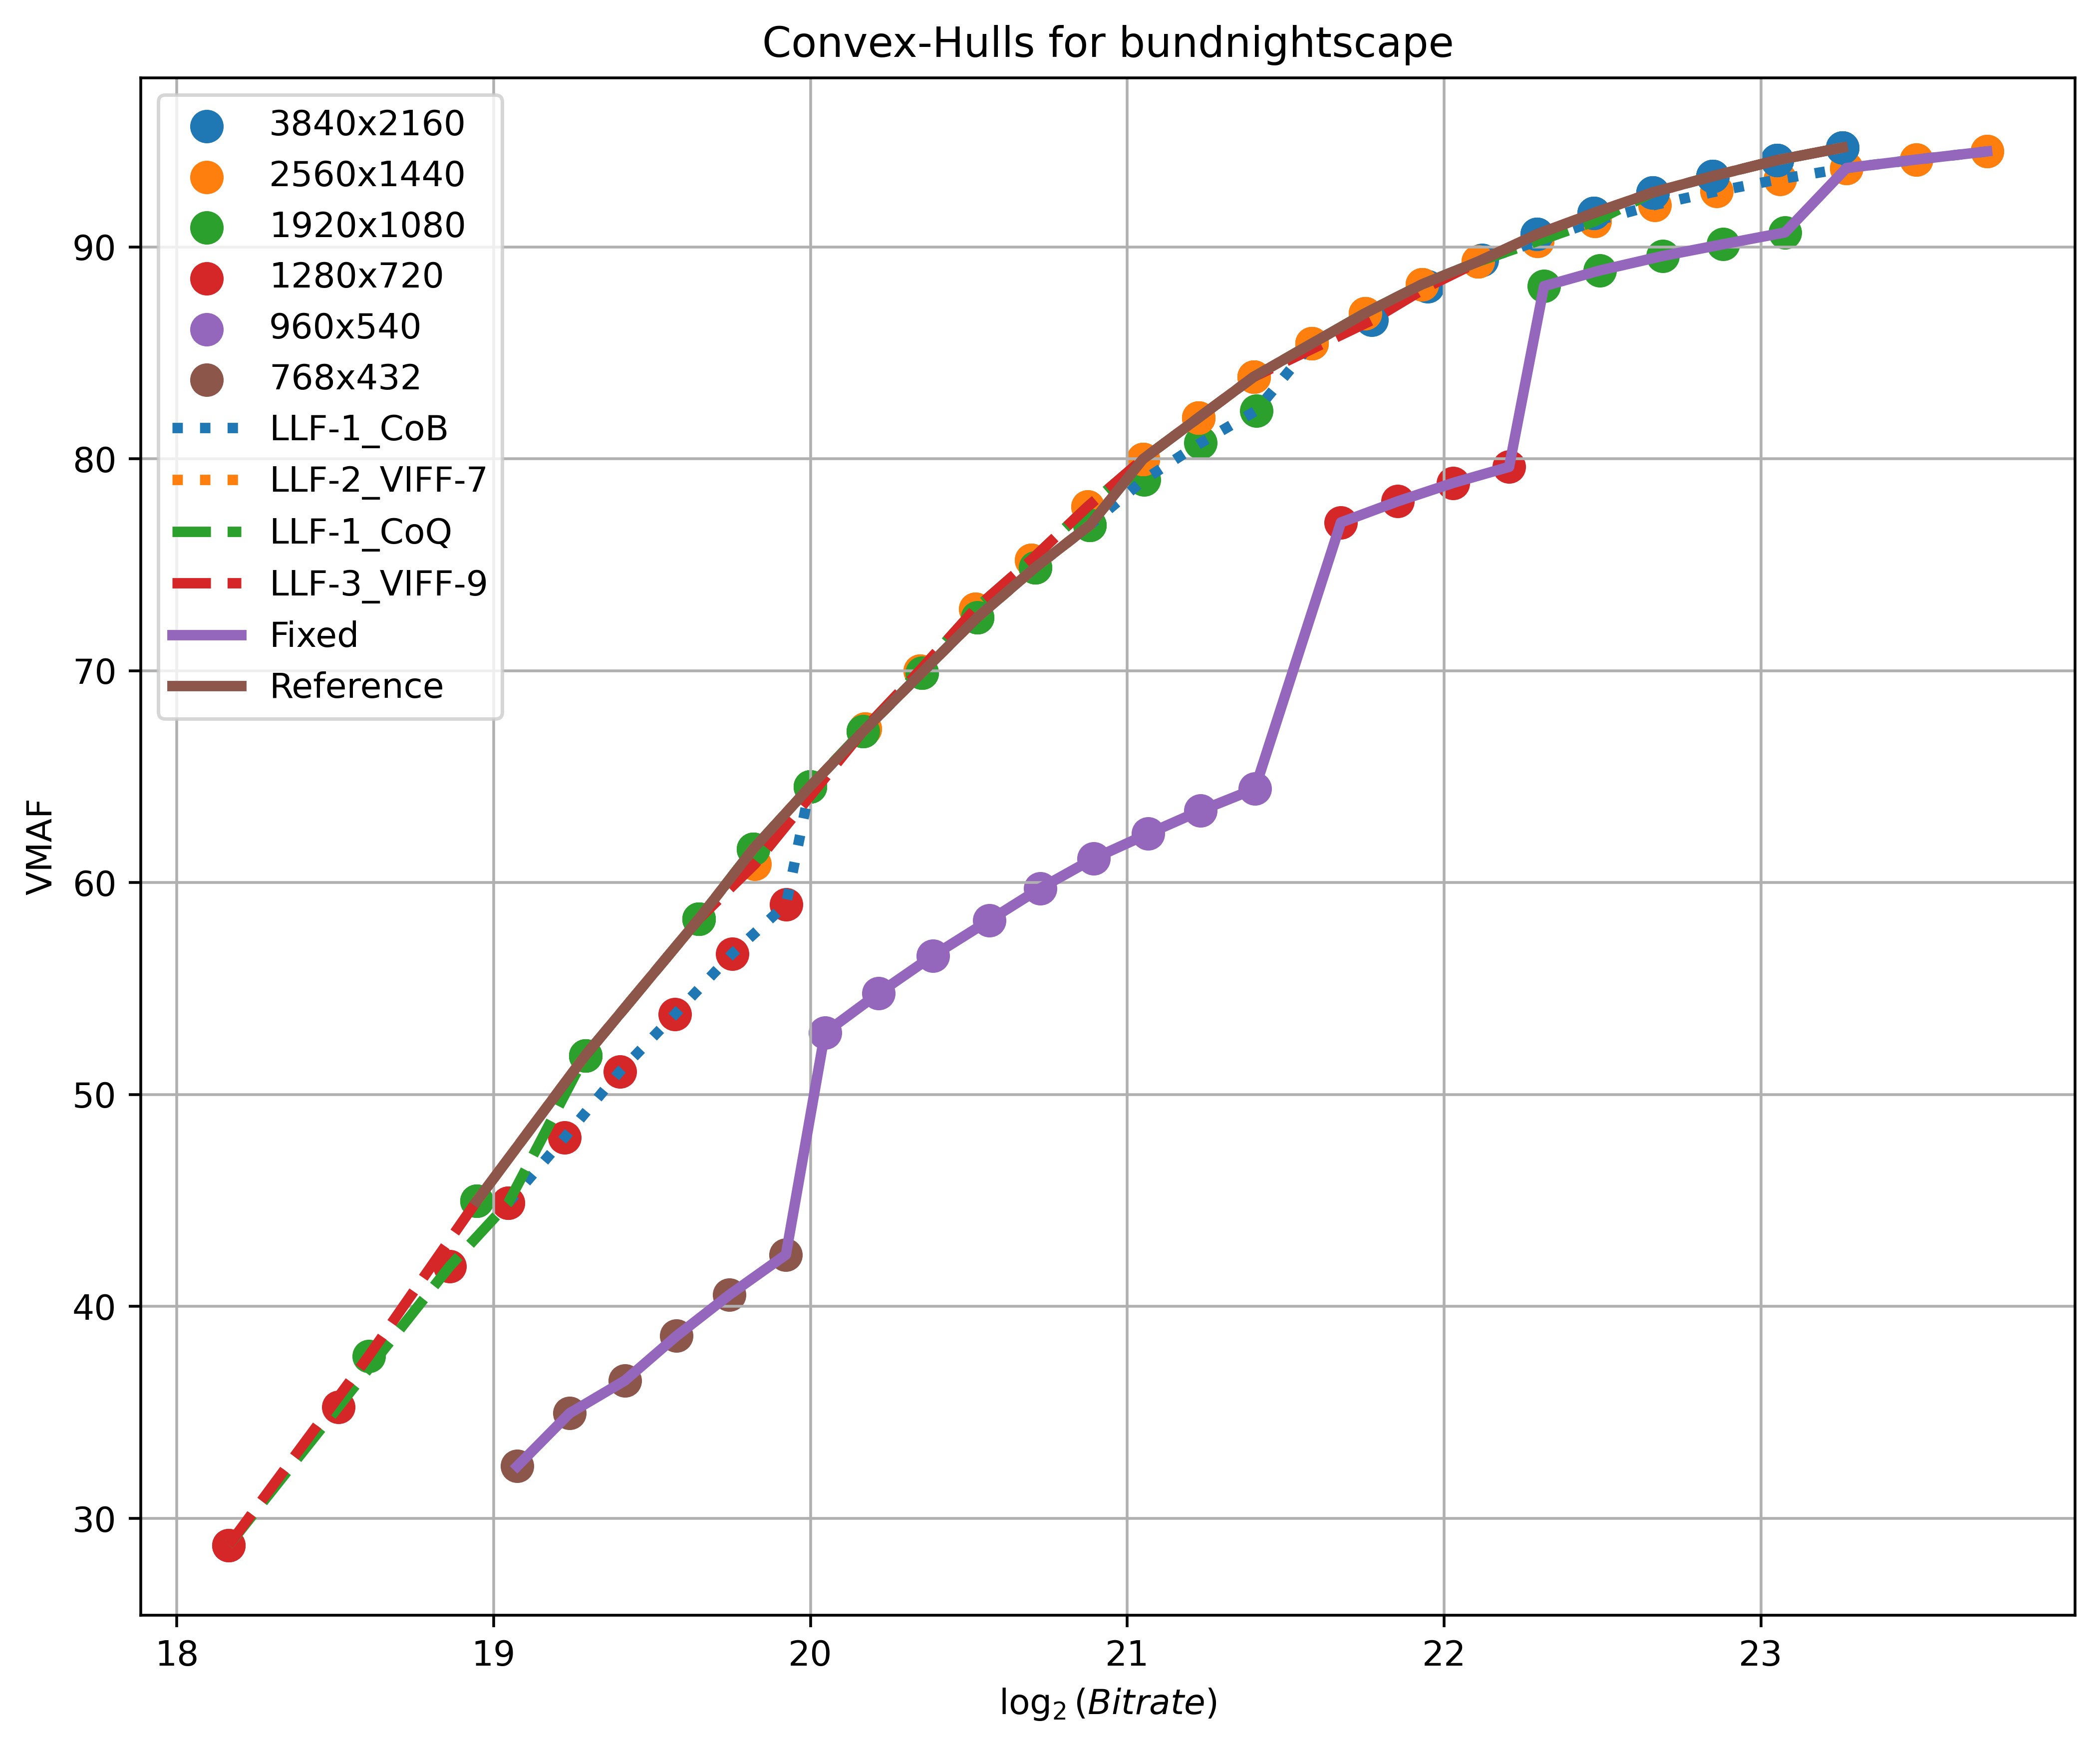
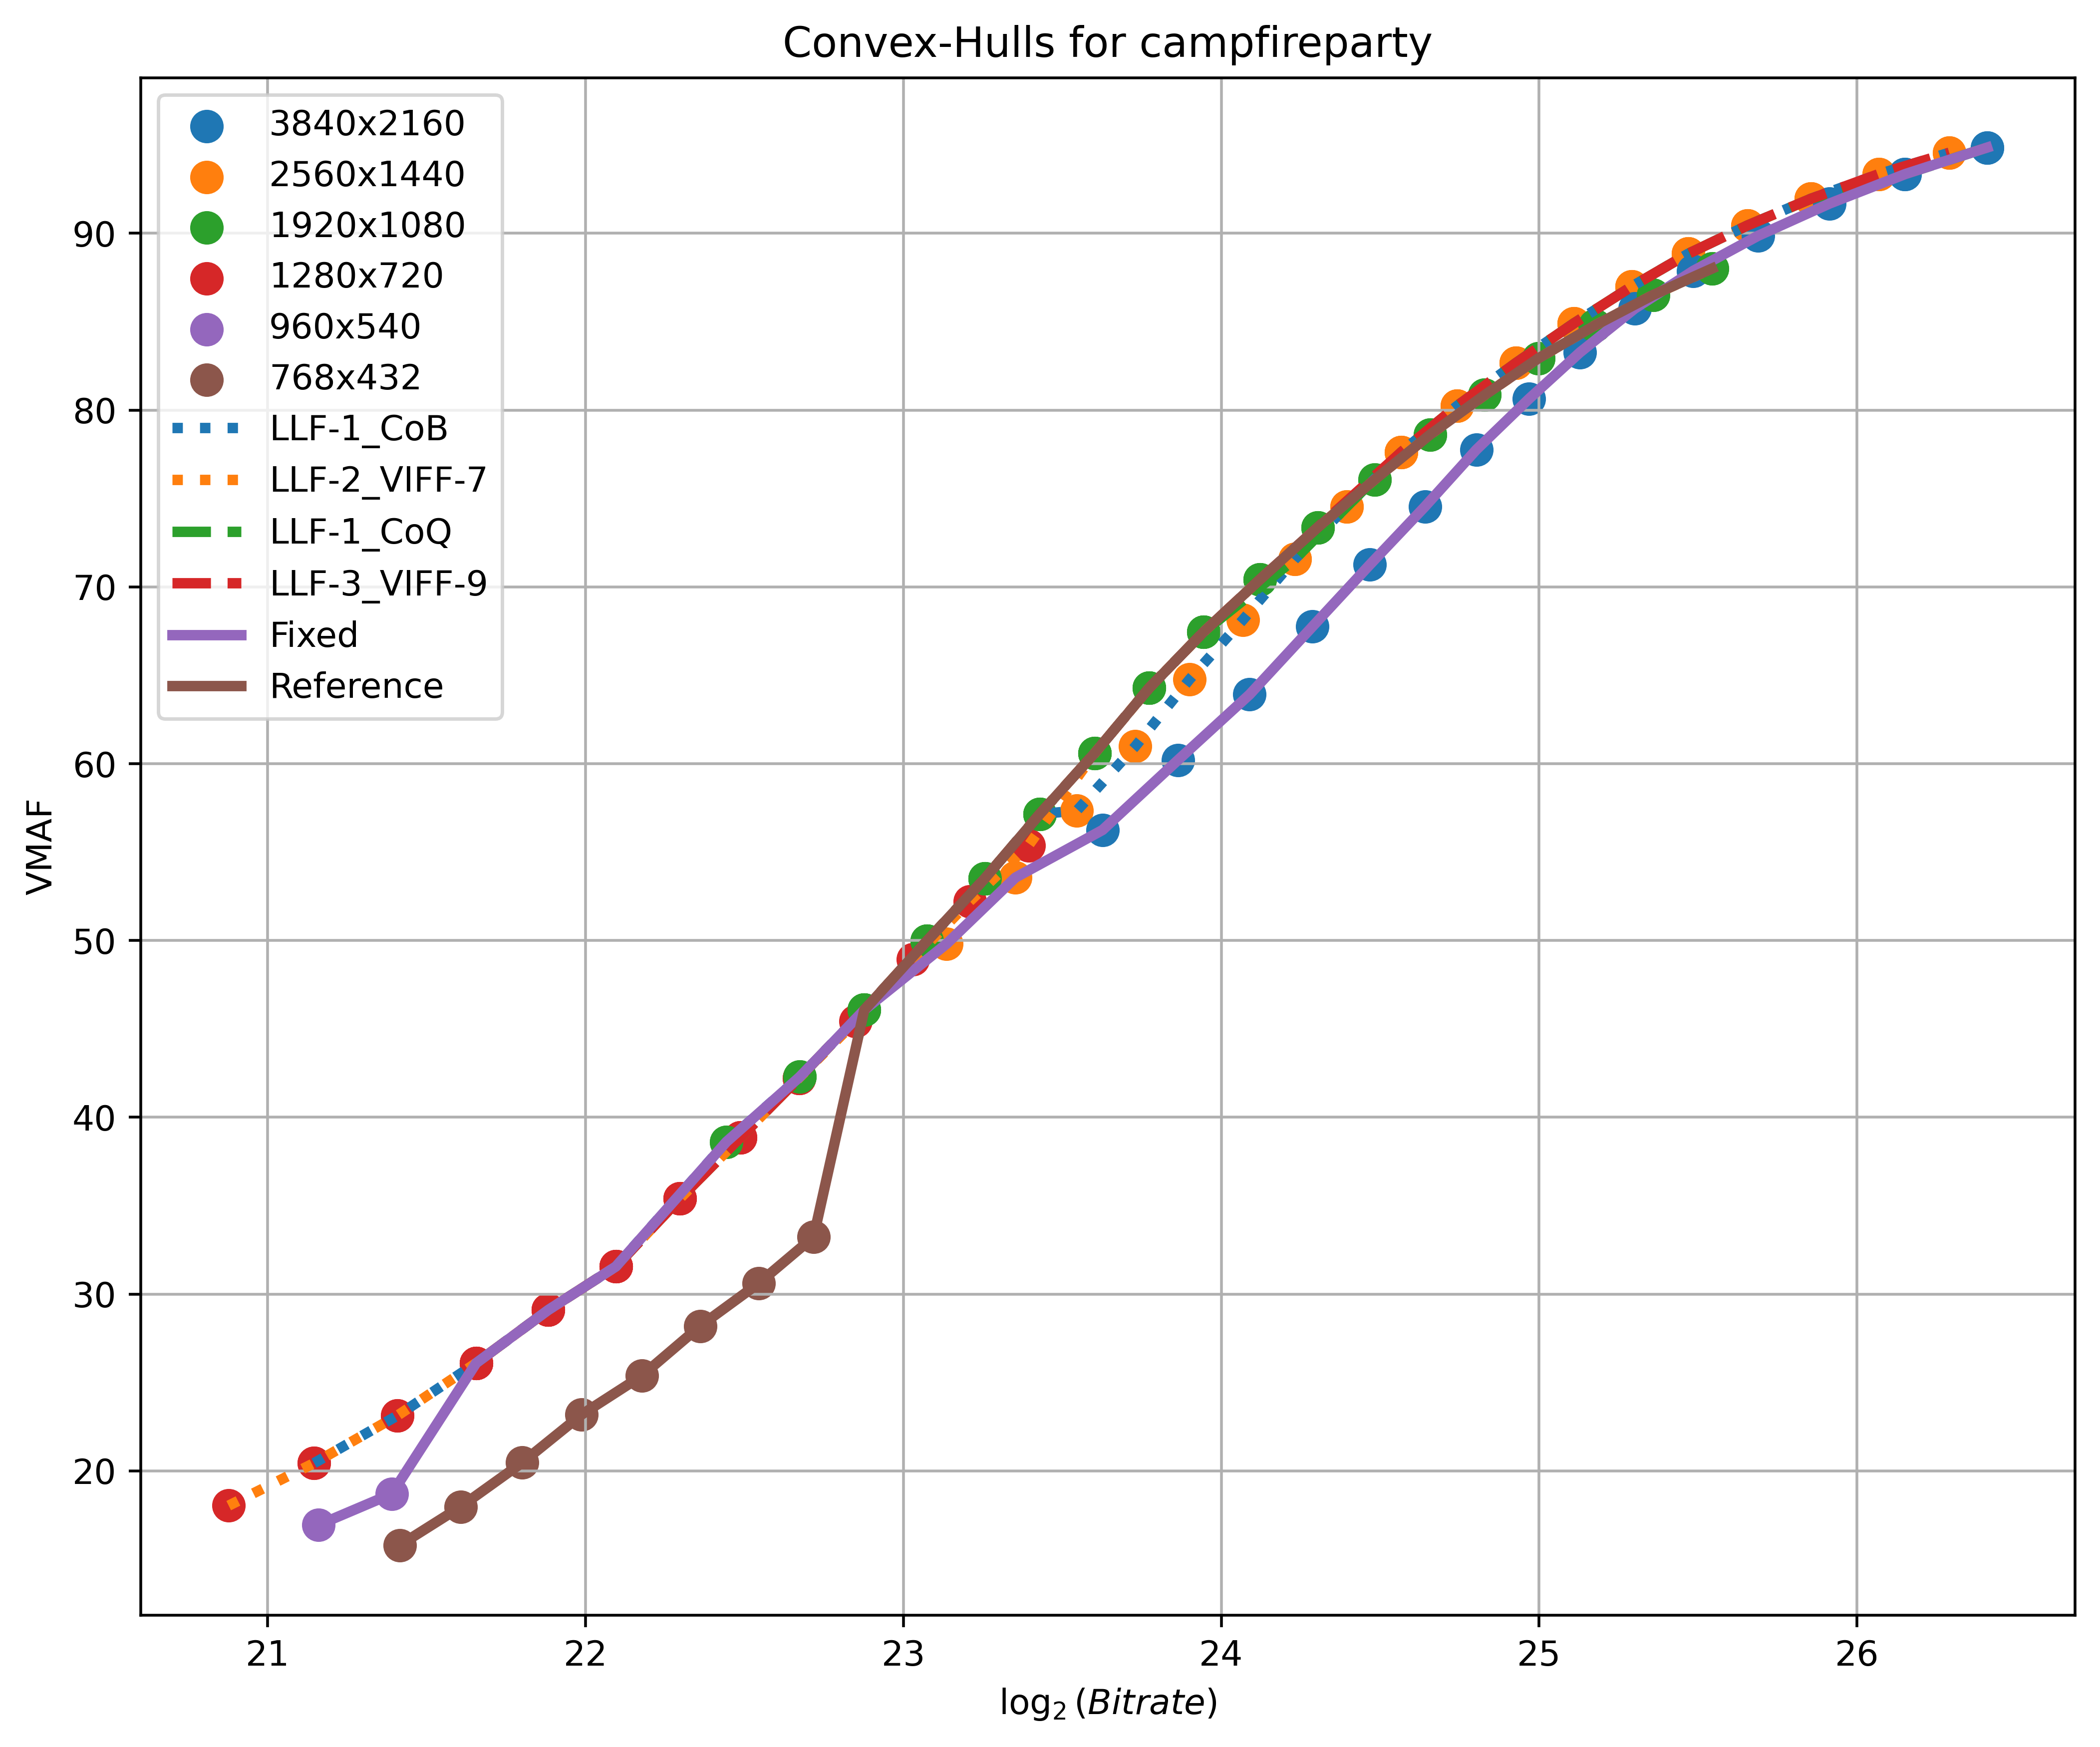
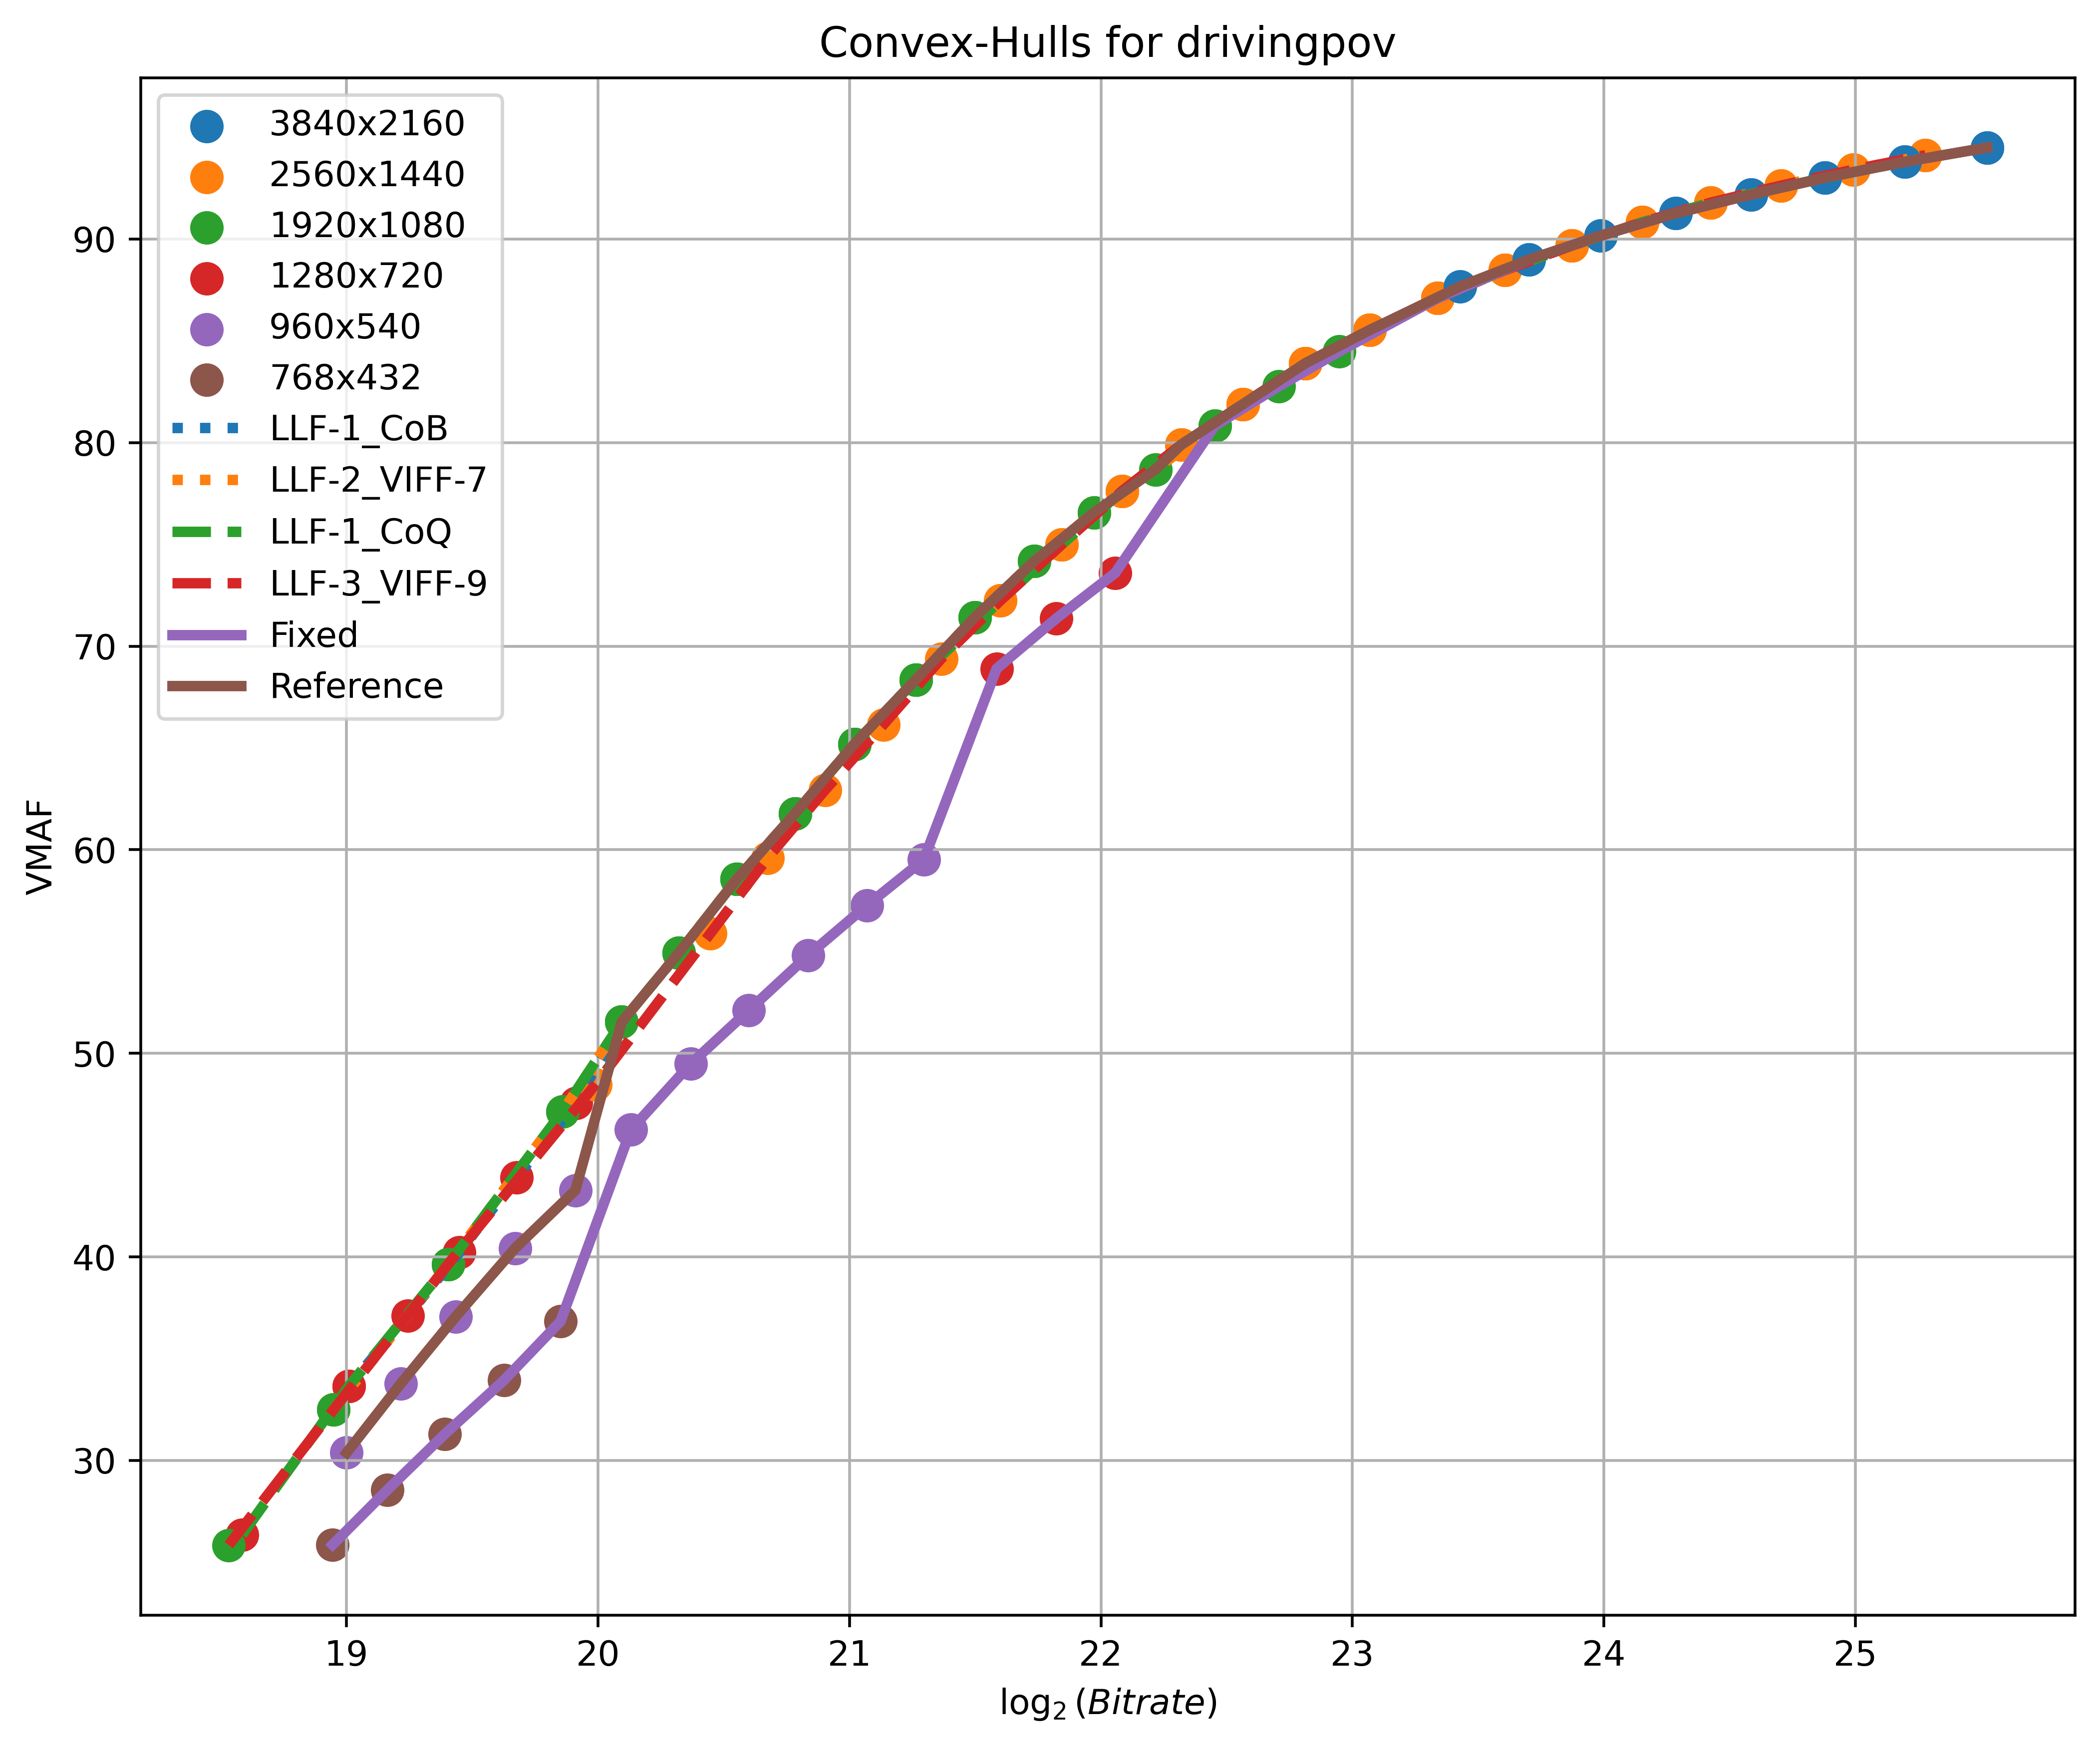
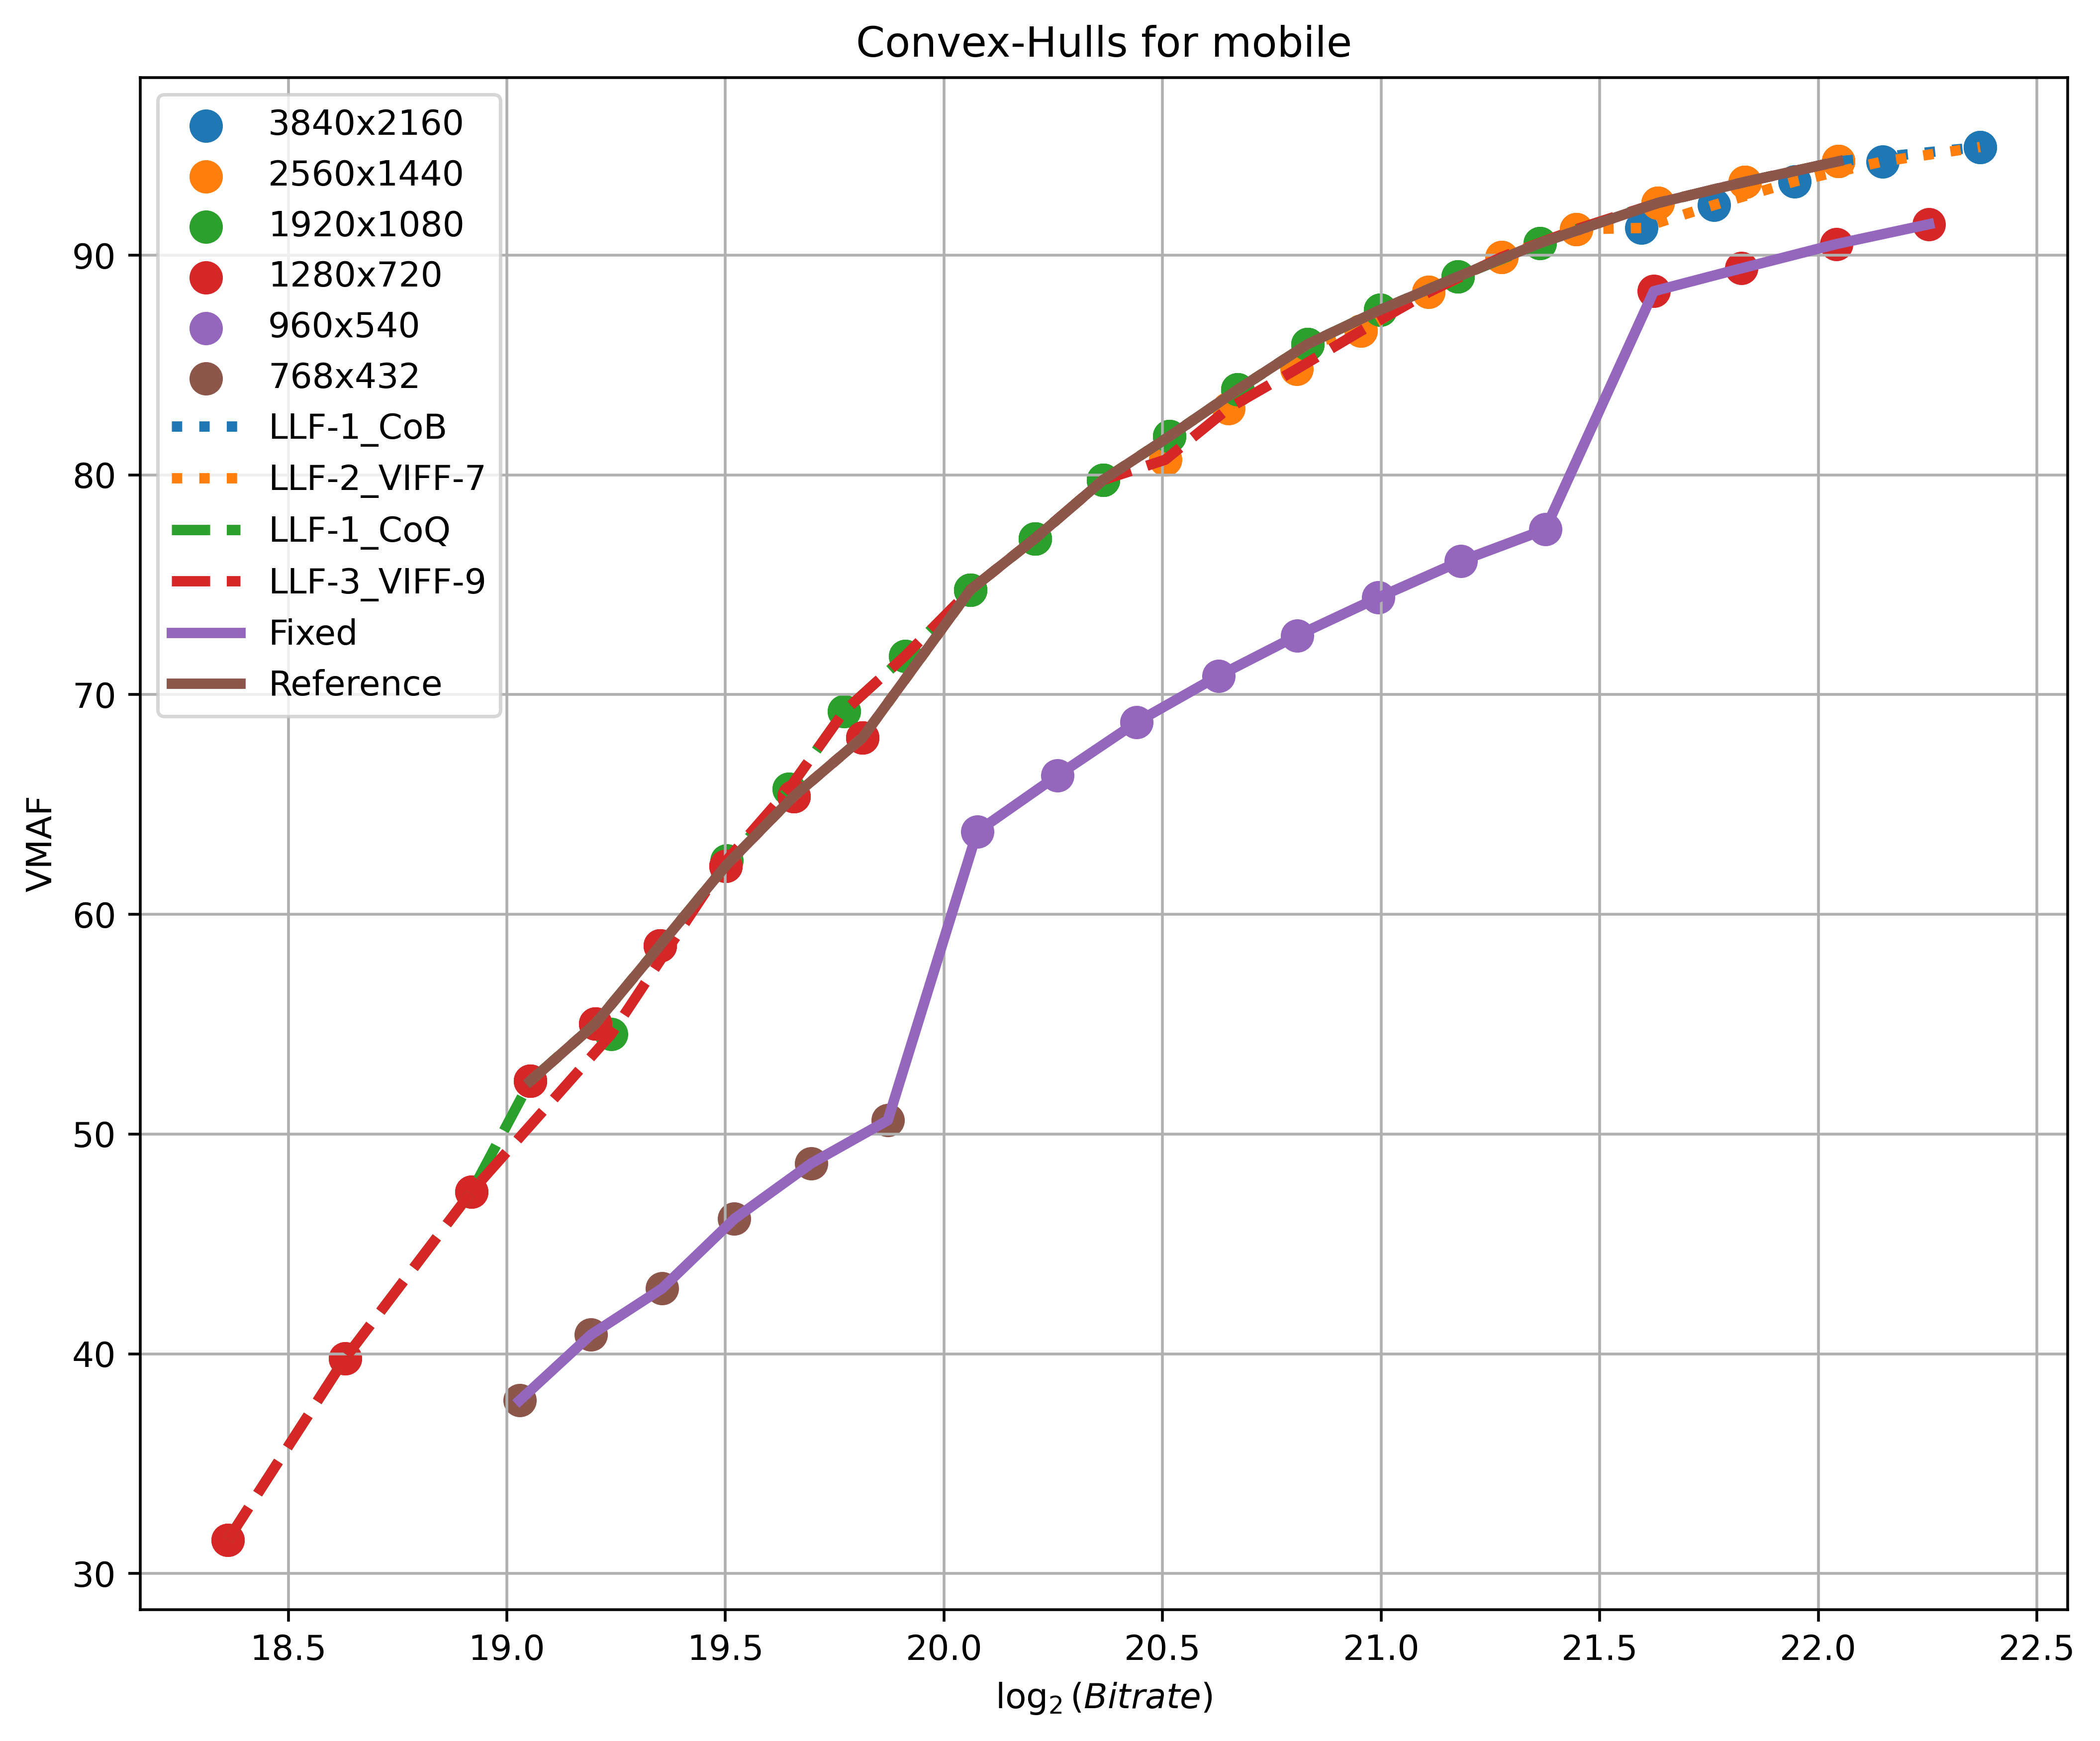
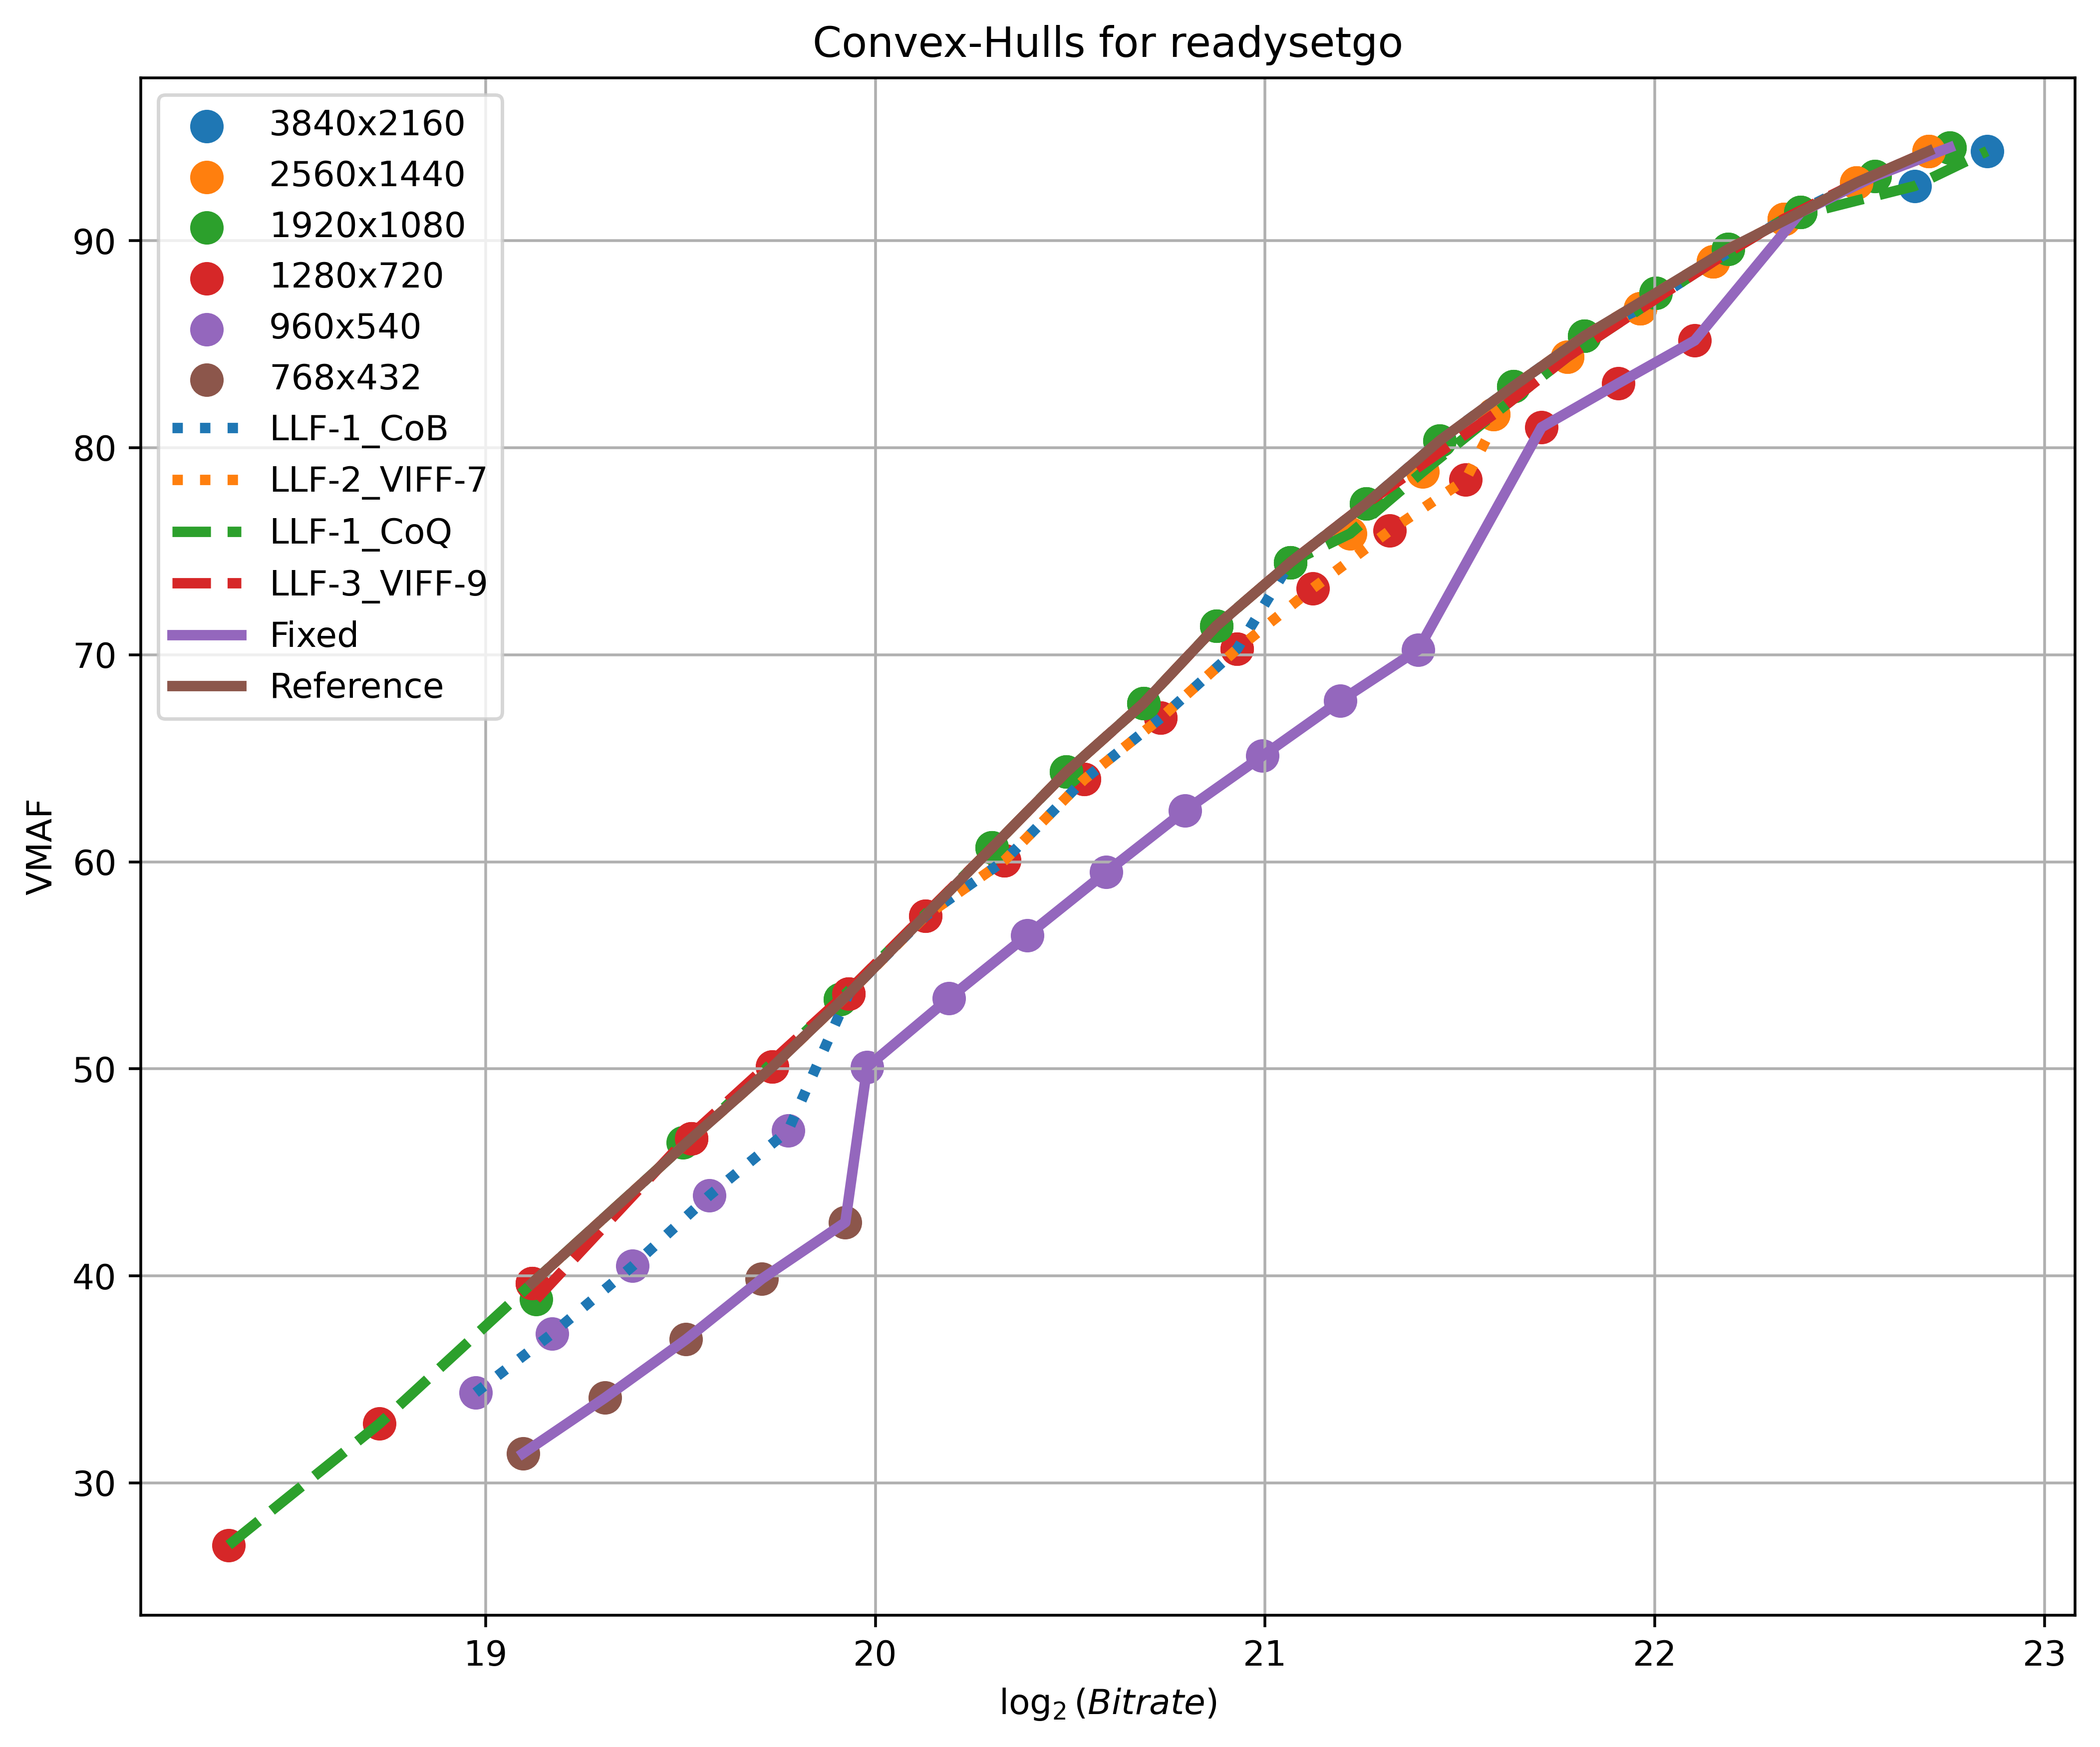
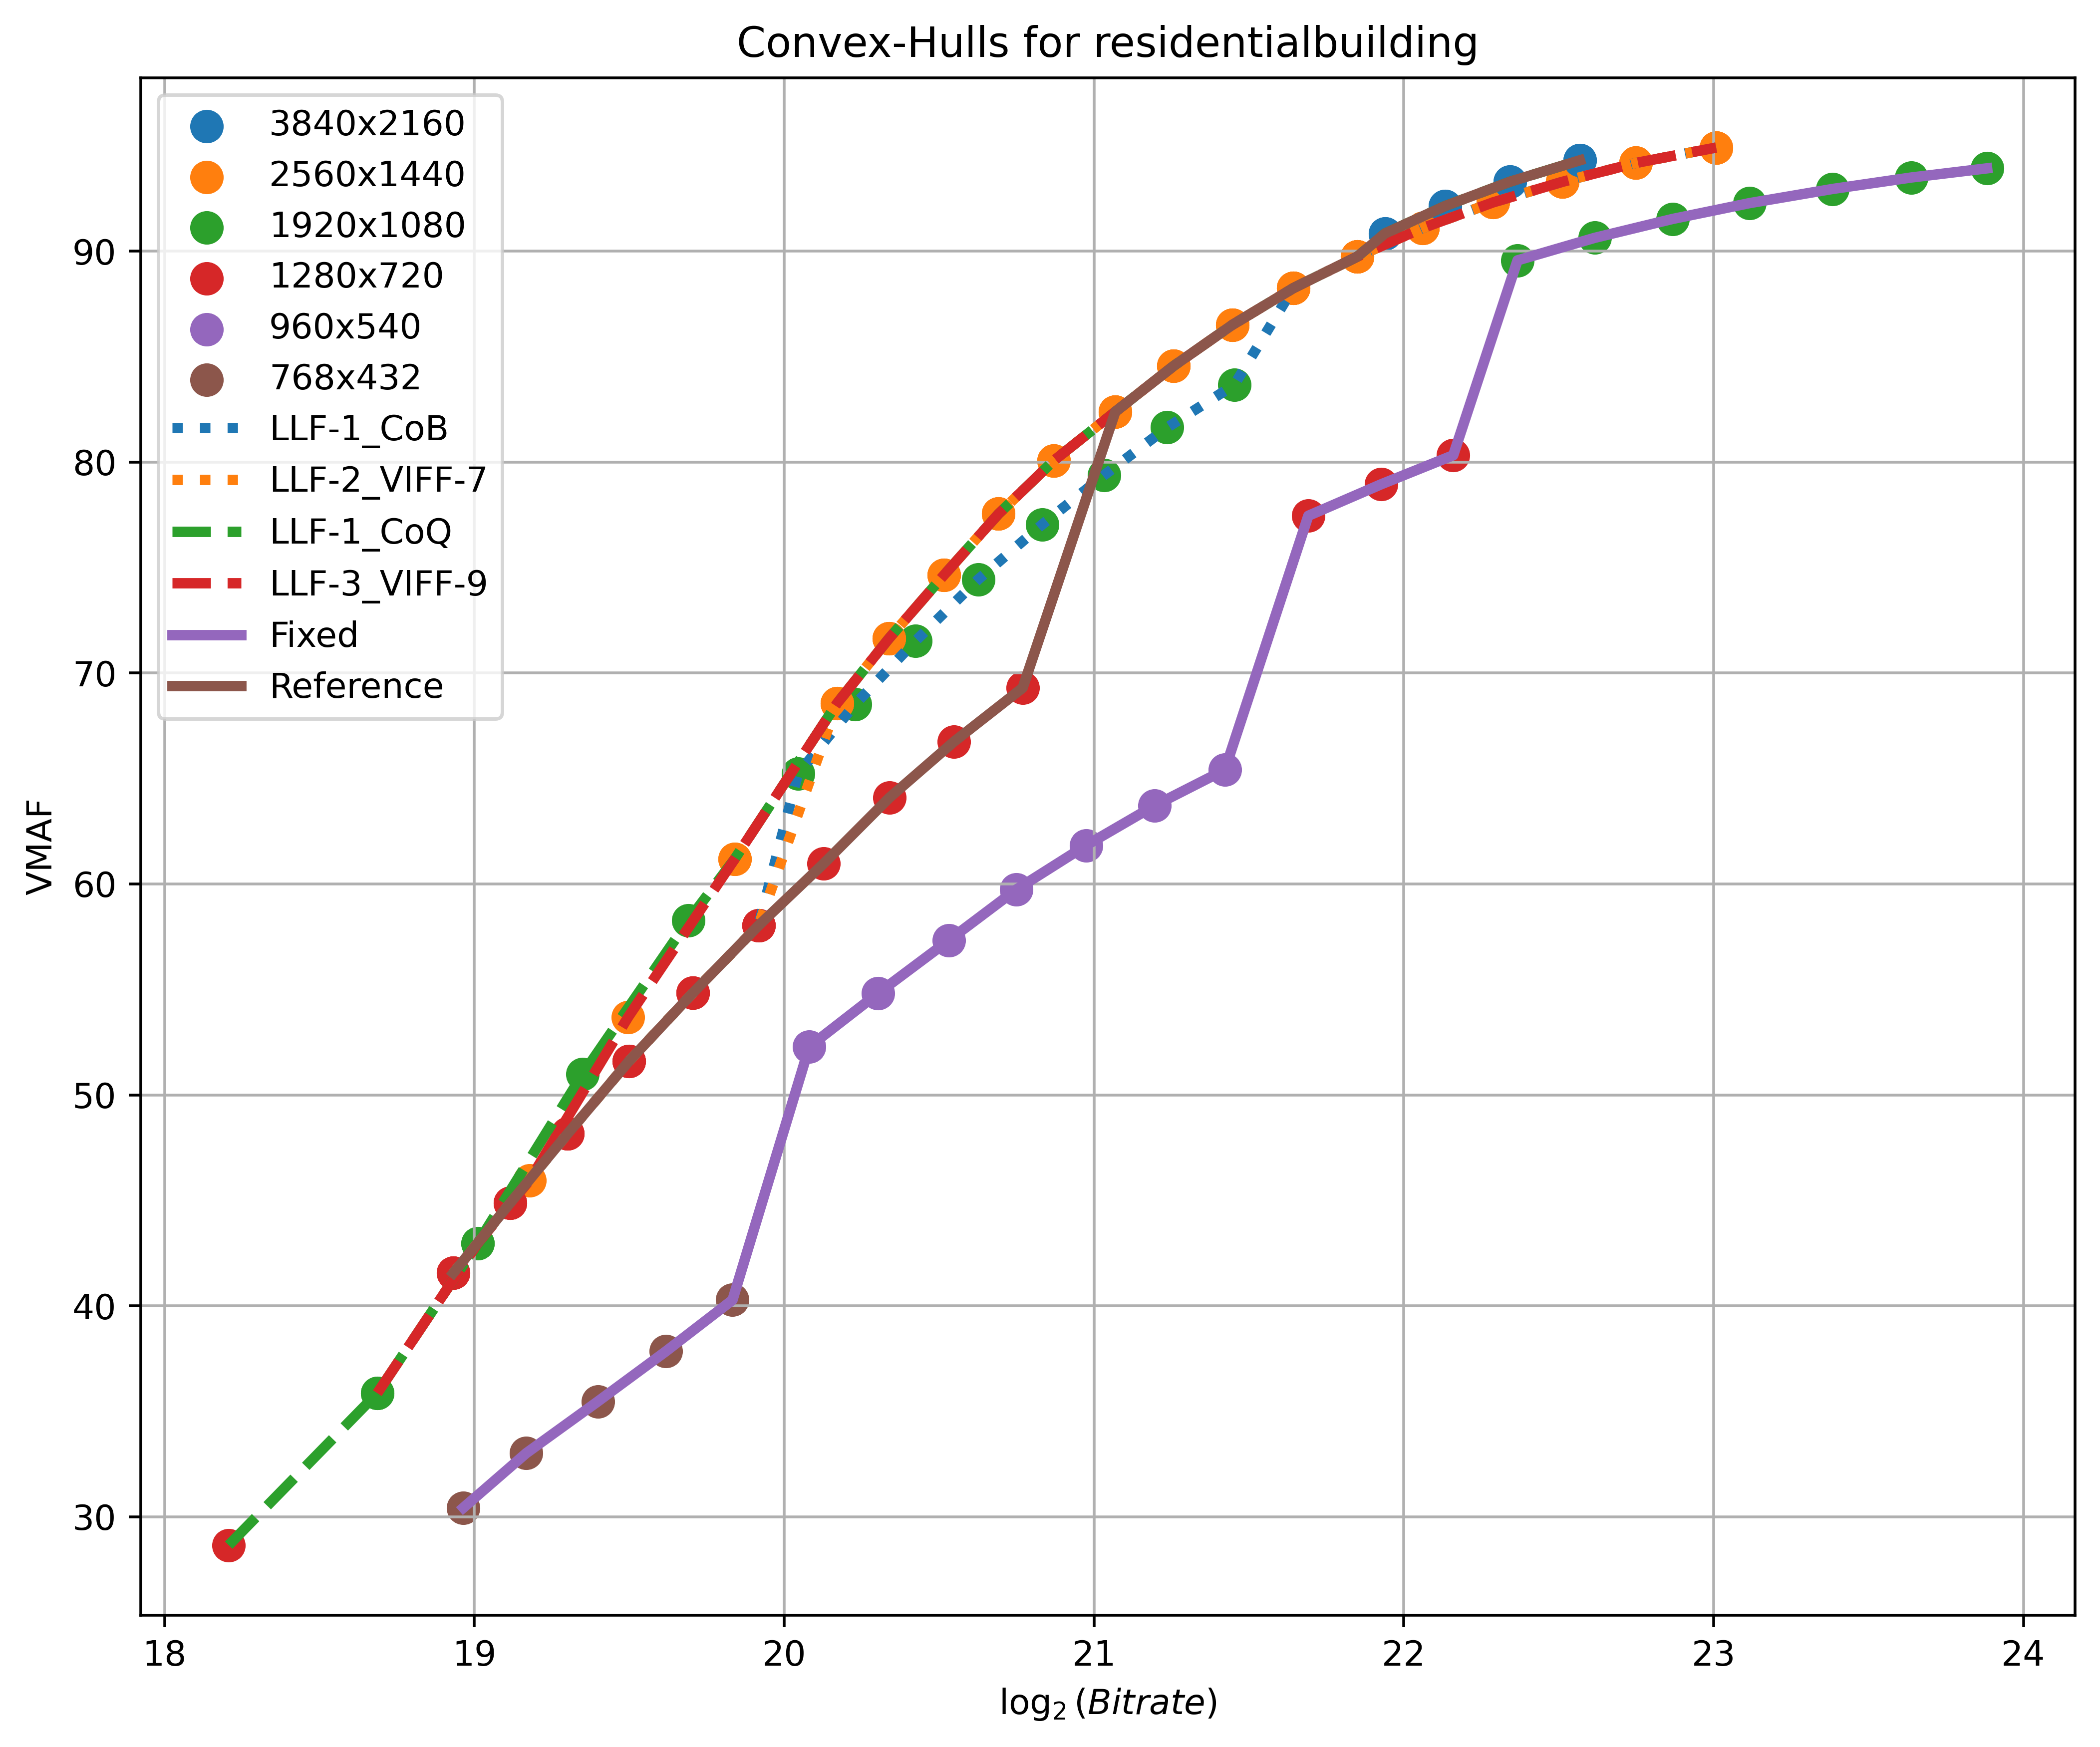
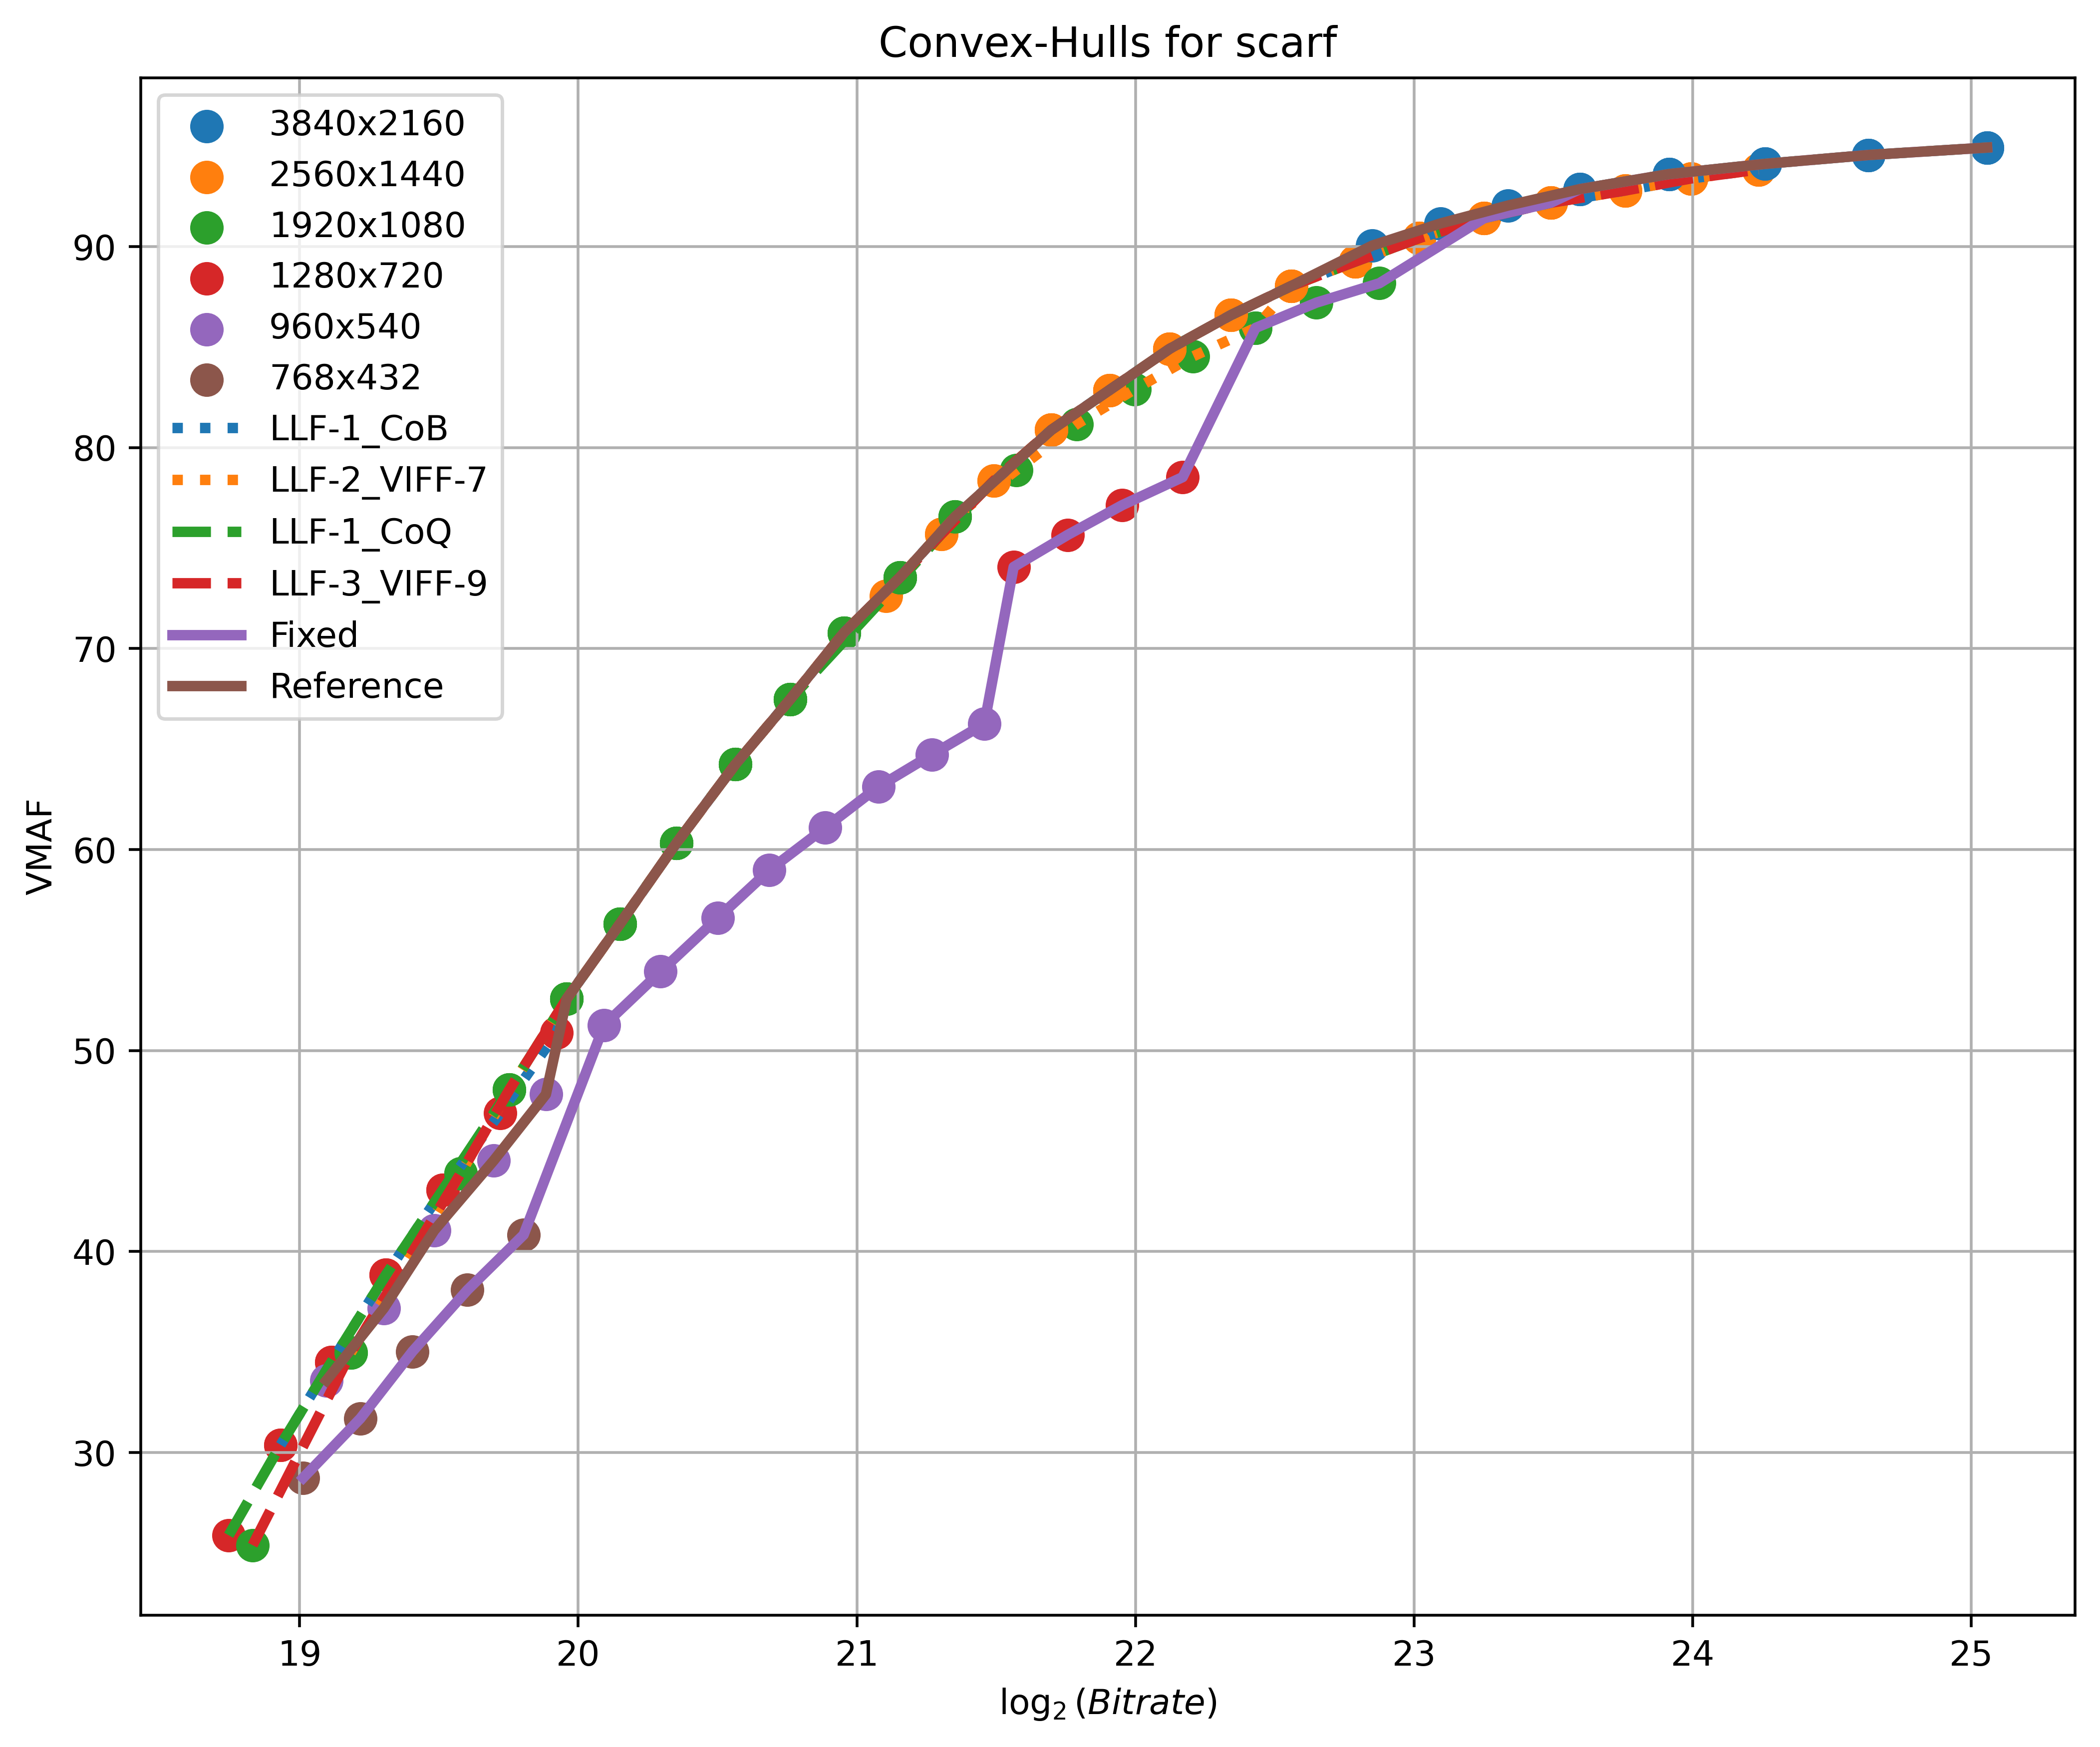
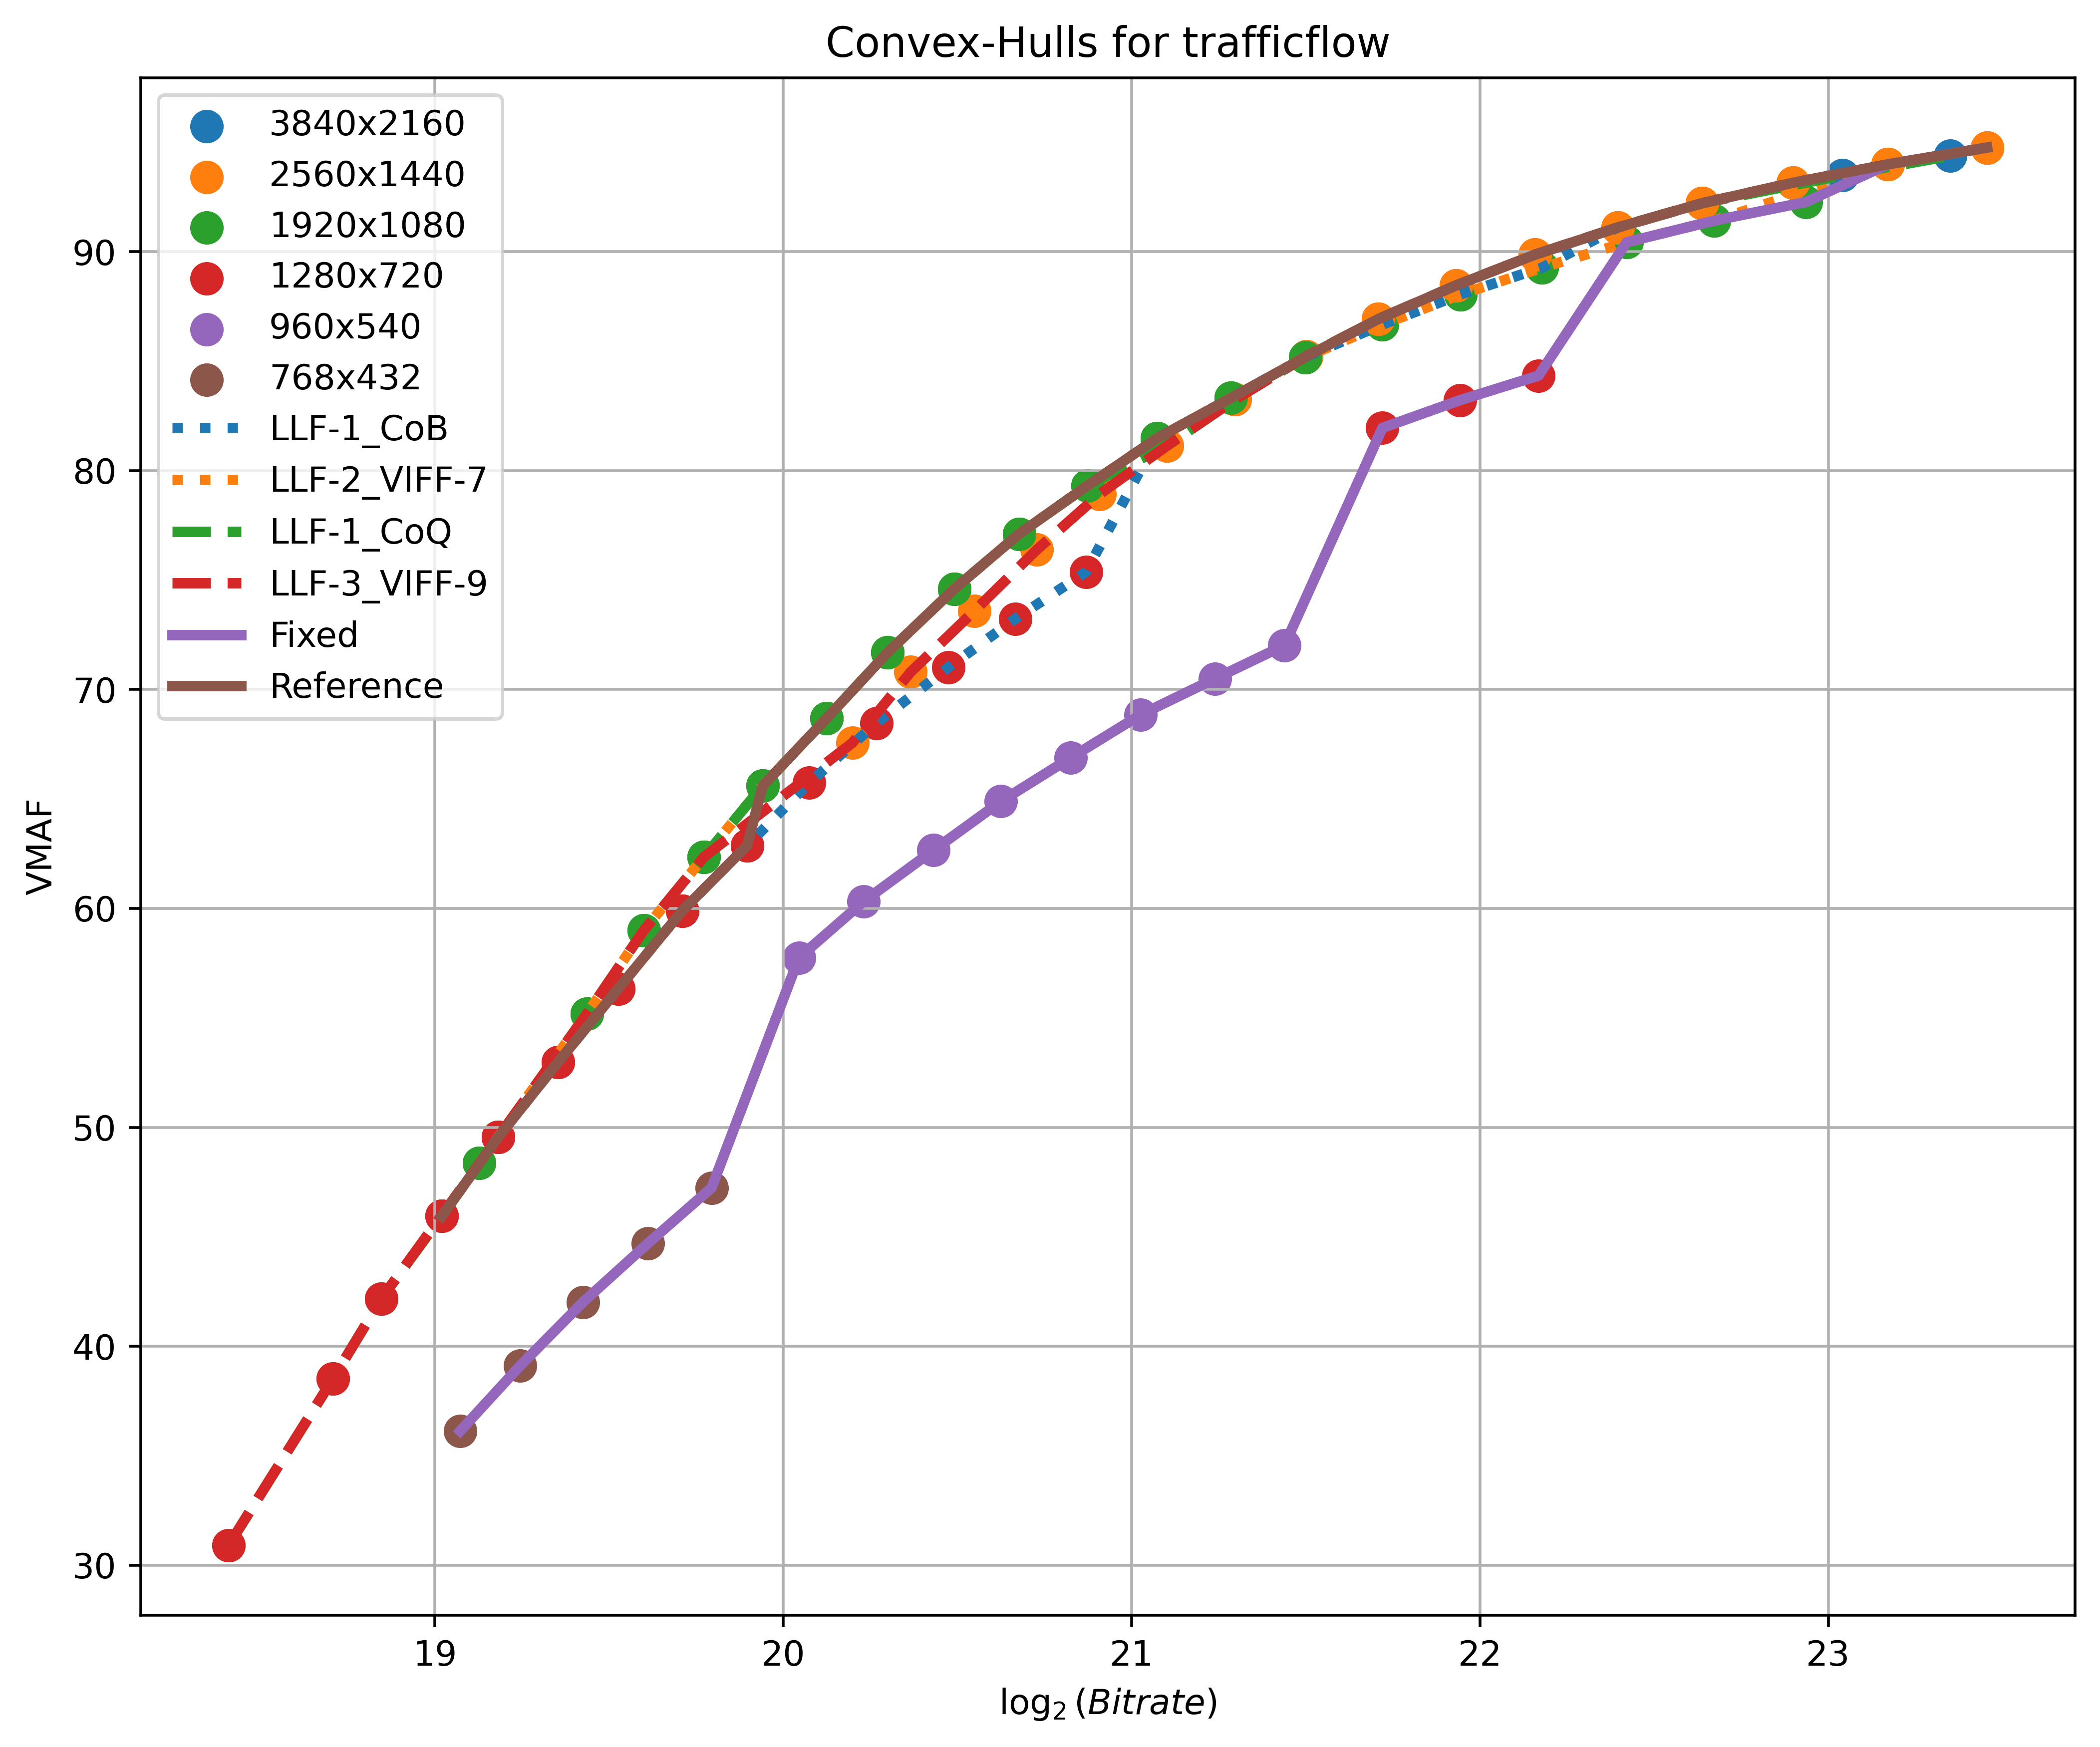
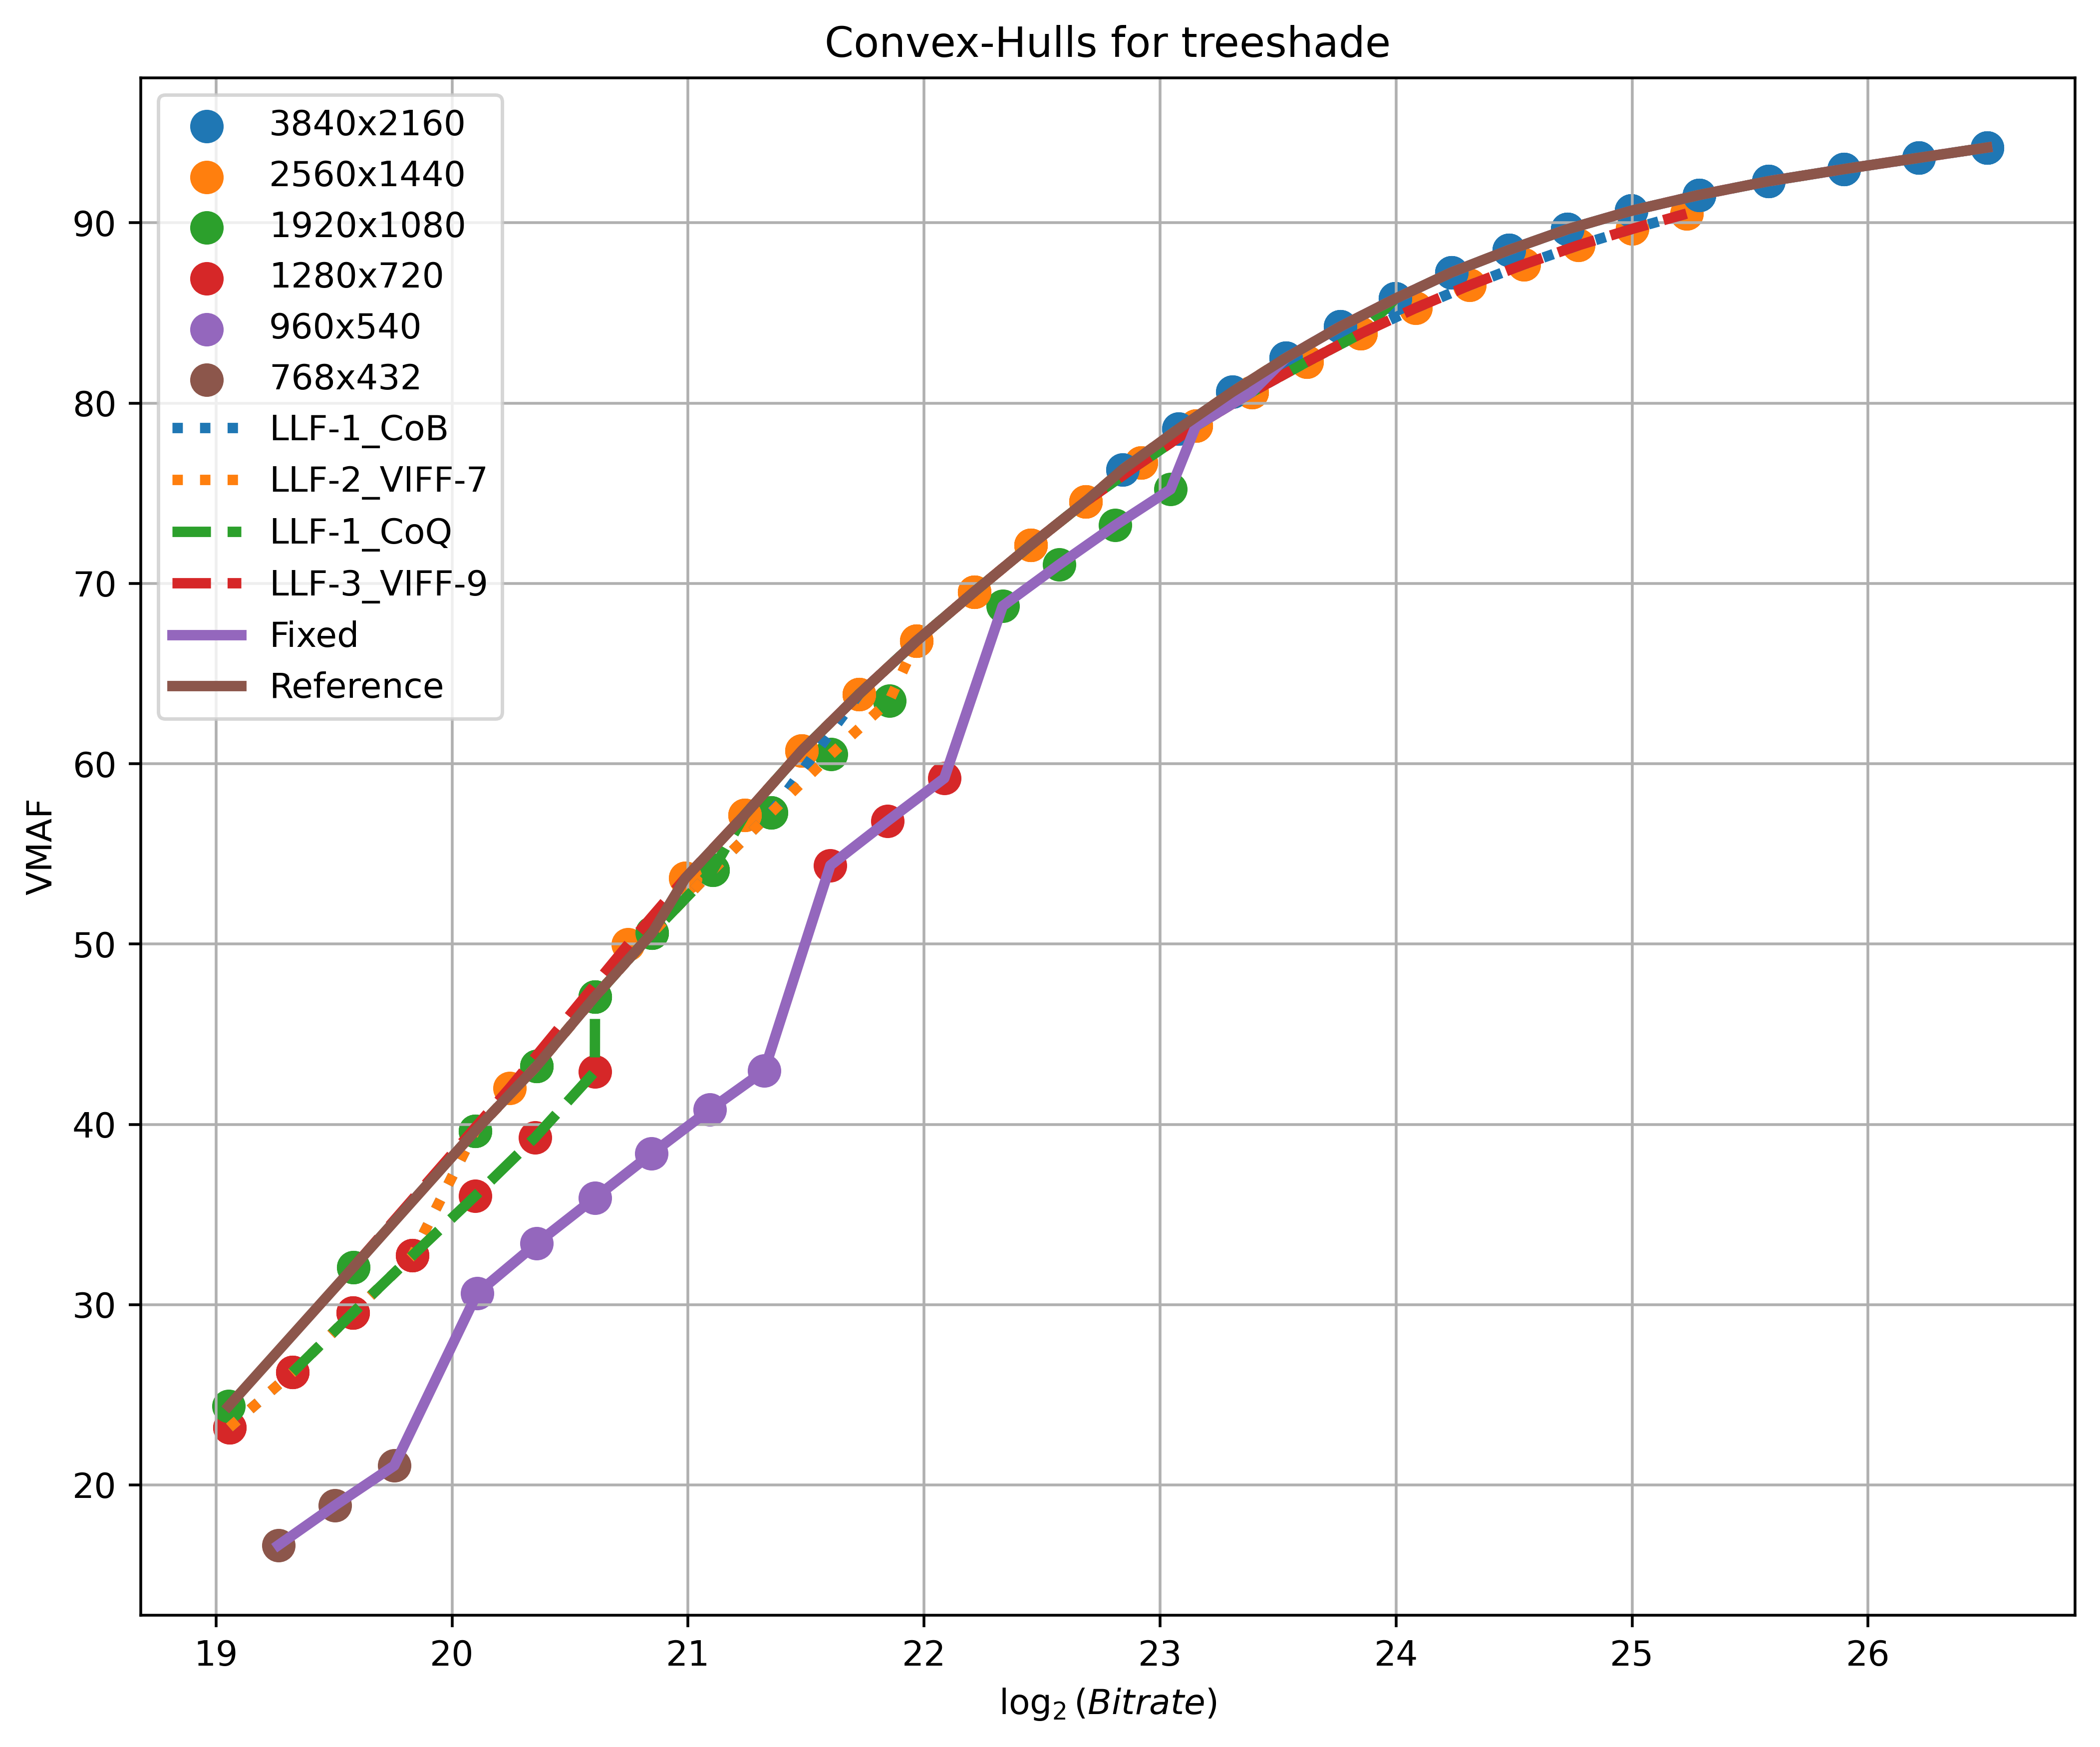
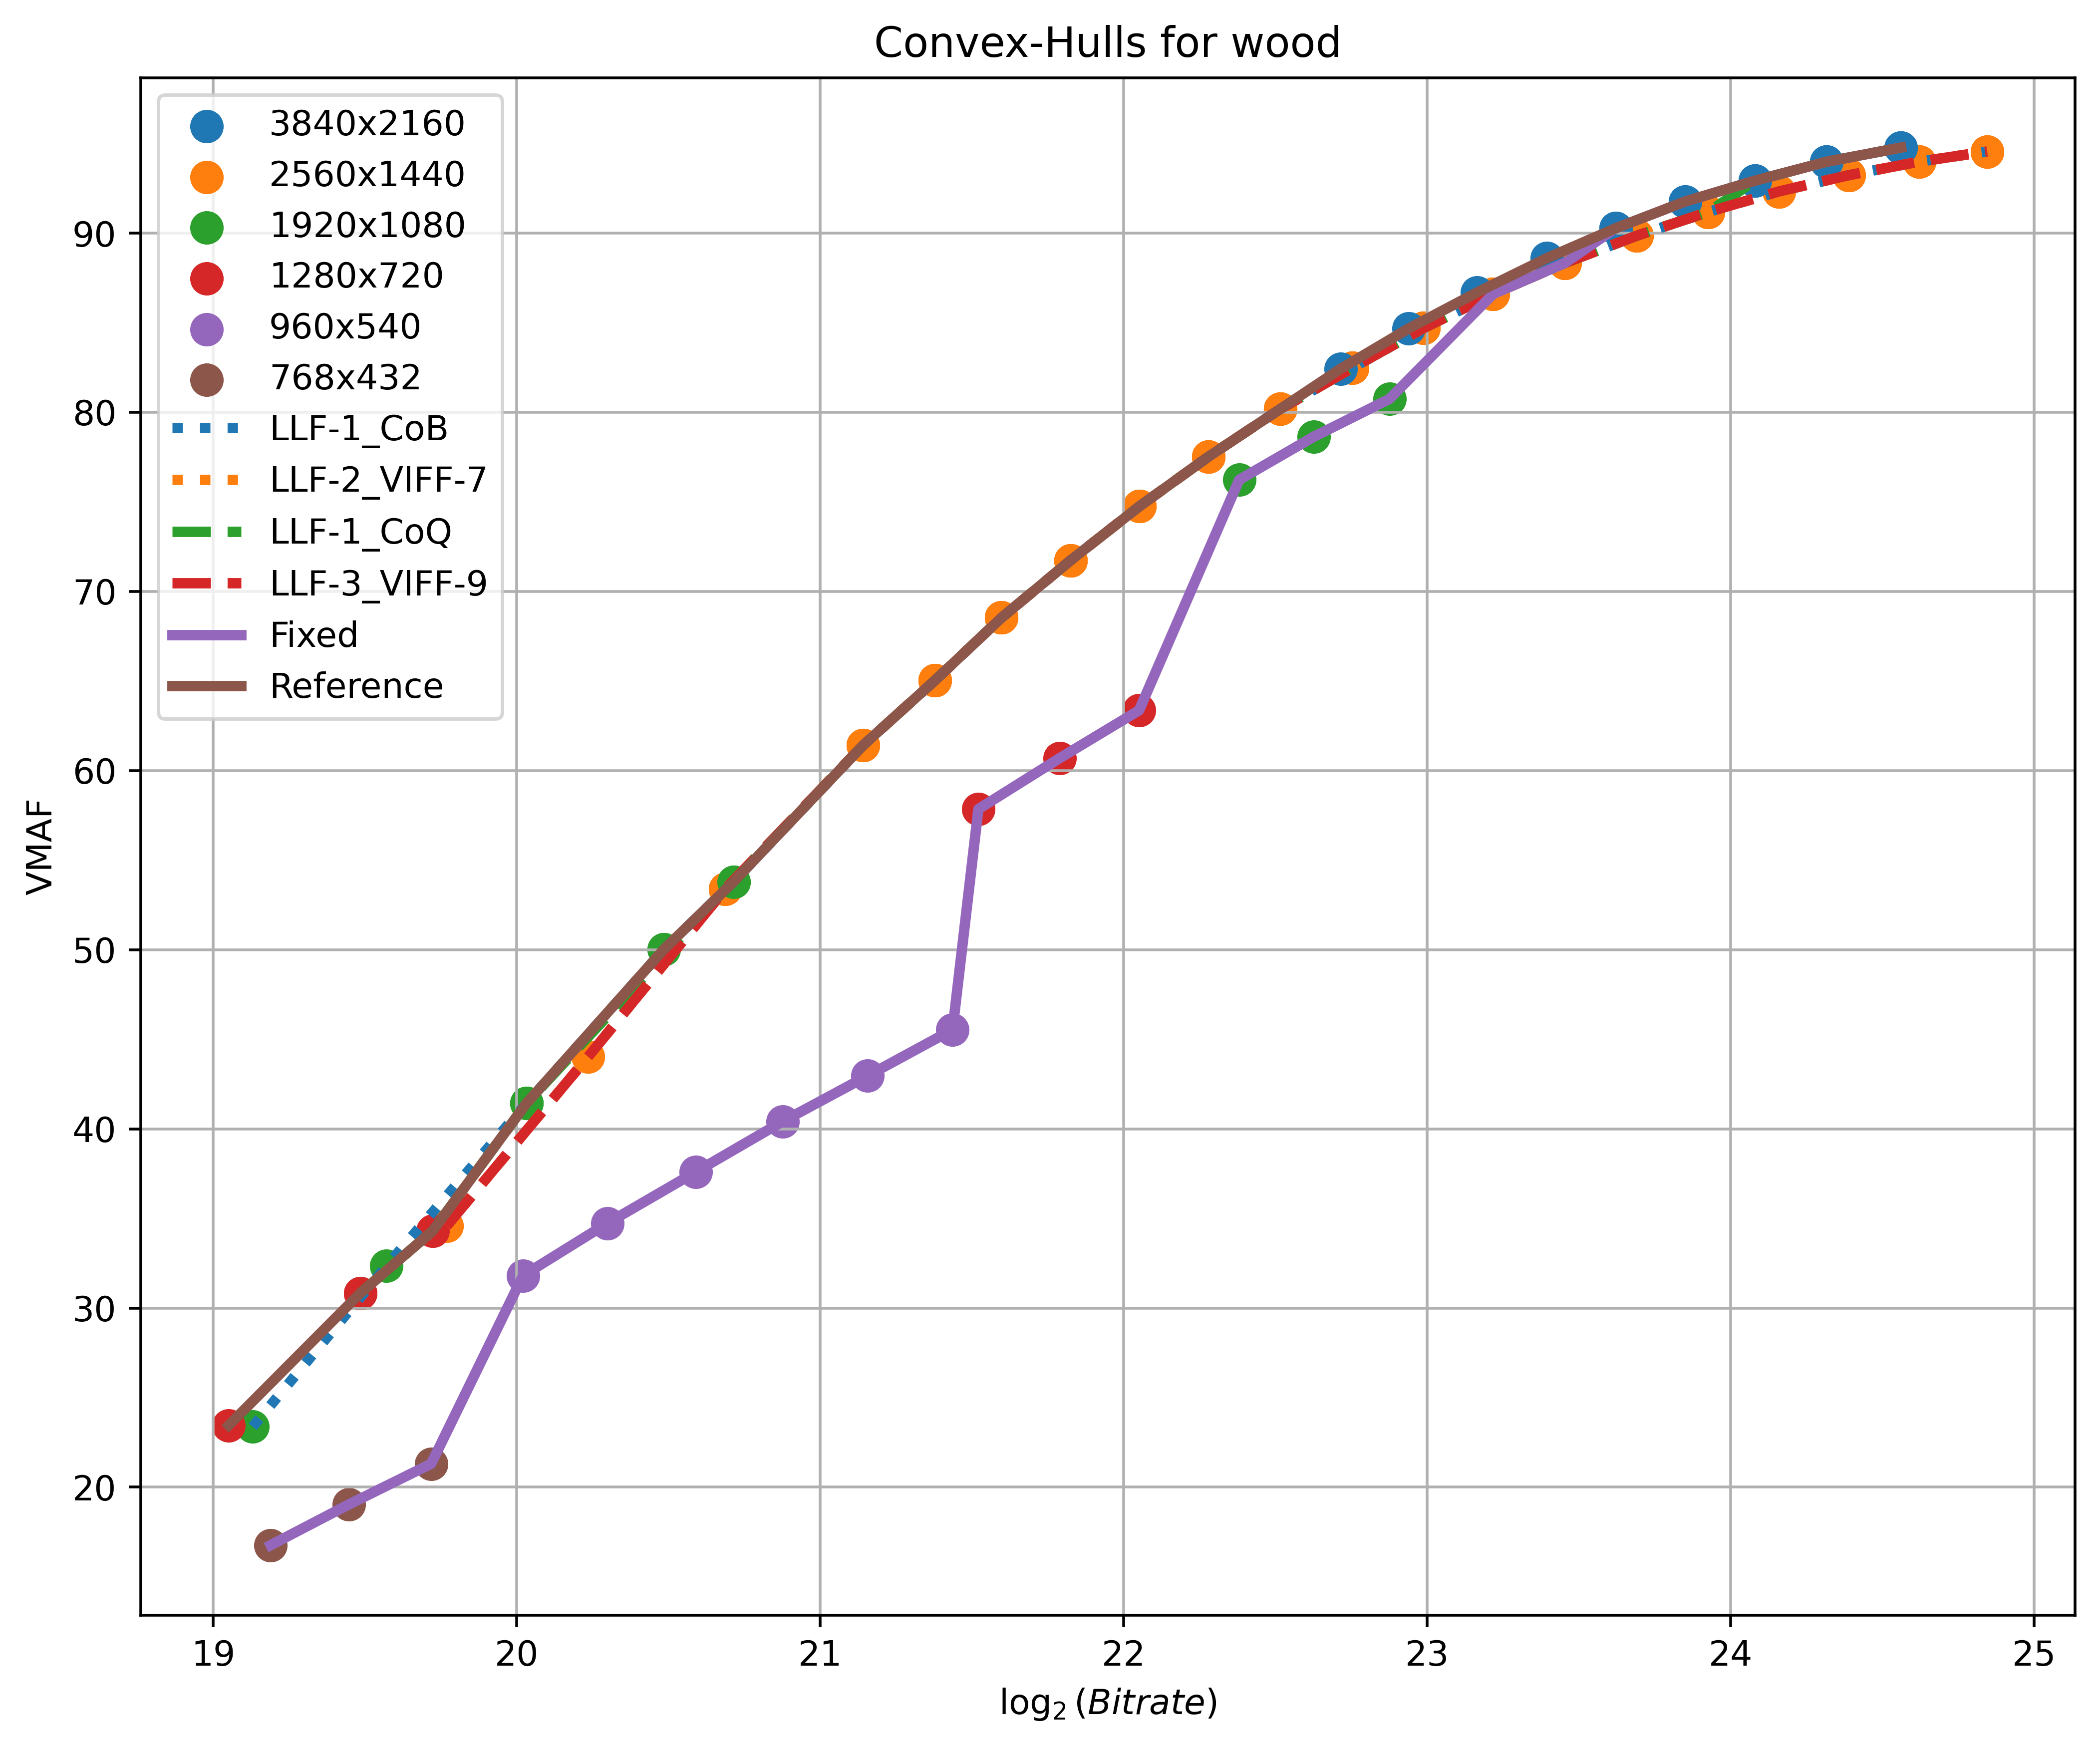
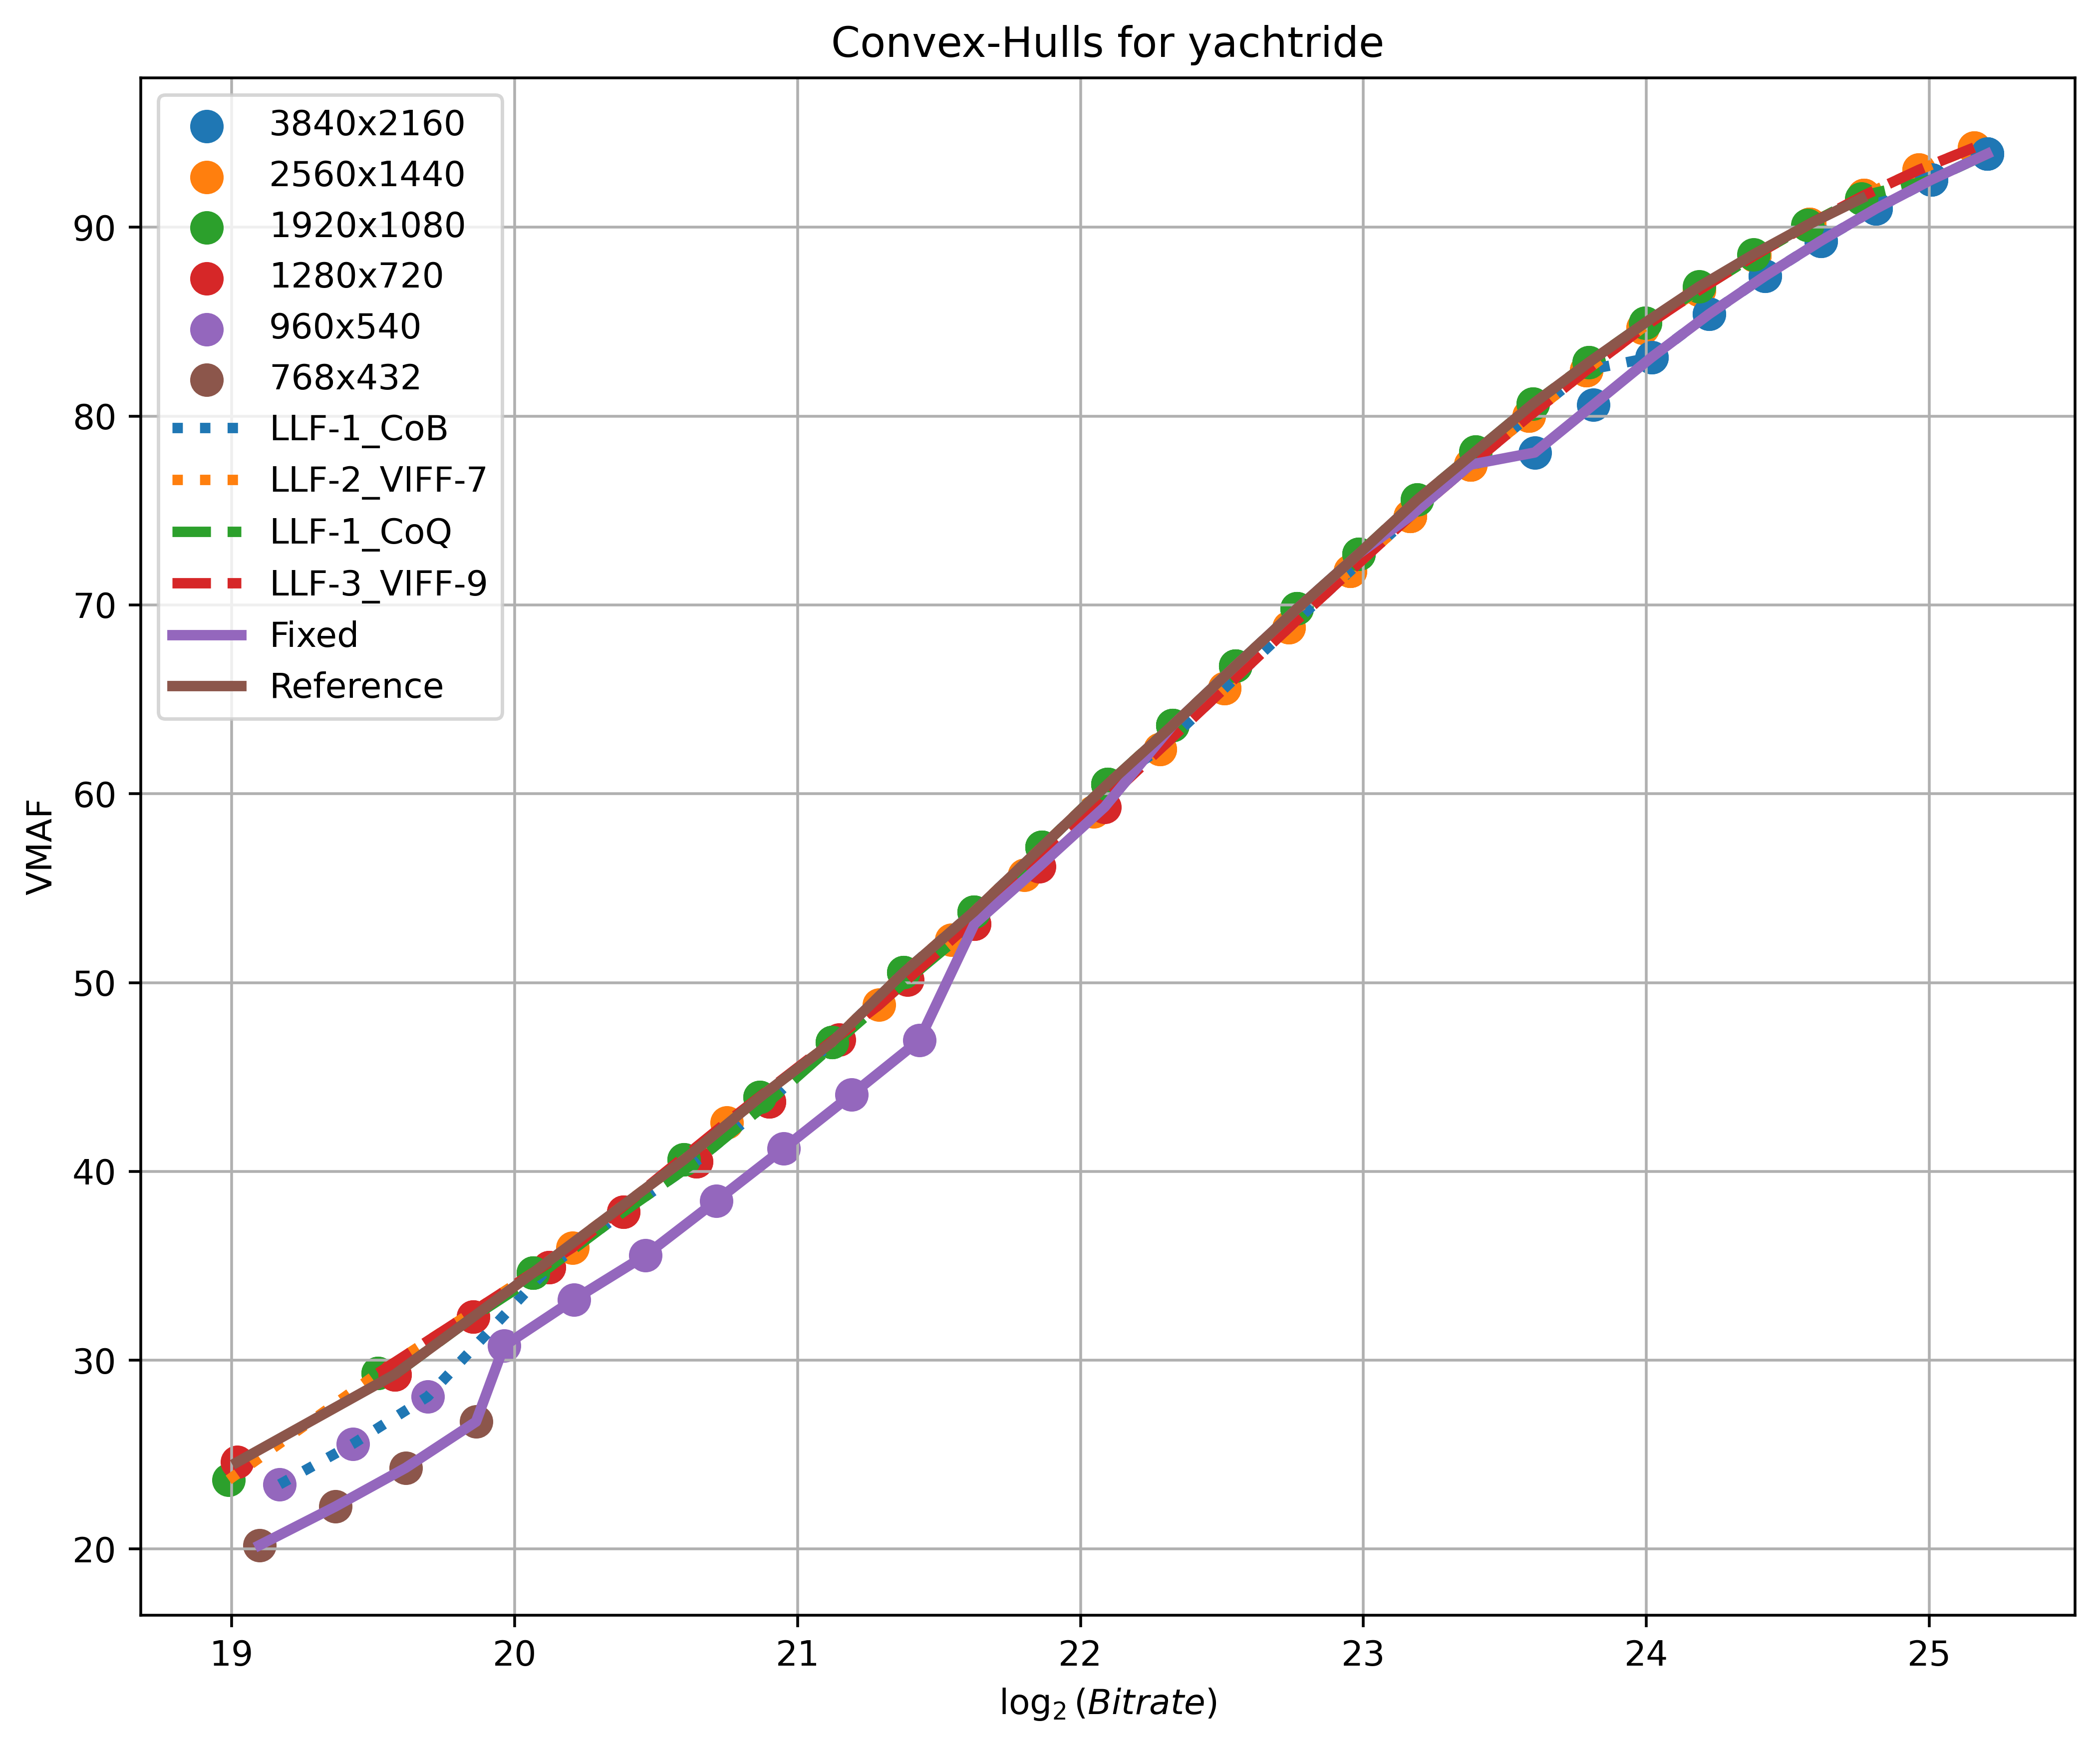
The per-shot bitrate and quality ladders constructed by predicting cross-over bitrates and cross-over VMAF points using low-level features achieved the largest gains and the least losses against the fixed bitrate ladder [3] and the reference bitrate ladder, respectively, over a substantial fraction of the test samples. Their performances were close to that of ladders constructed using true cross-over points. The bitrate ladders constructed using features , demonstrated the best performance amongst the quality prediction methods, next to bitrate ladders constructed using cross-over bitrates. Similarly, quality ladders constructed using features , demonstrated the best performance amongst the bitrate prediction methods, outperforming quality ladders constructed using cross-over VMAF points. The right selection of training and test videos, coupled with careful consideration of experimental settings, these techniques hold promise for delivering remarkable performance. Fig. 7 shows examples of convex hulls constructed using best-performing bitrate ladders, quality ladders, and fixed and reference bitrate ladders.
V-I Complexity
A significant challenge associated with the utilization of the Dynamic Optimizer [6] is its substantial computational demand. Construction of a convex hull for an individual shot requires compressing the shot at many resolutions and rate control settings. Subsequently, each compressed shot must be upsampled to its original resolution to compute VMAF. This procedure imposes a considerable time and resource burden. As discussed earlier, a variety of techniques have been proposed to optimize this procedure. In our experiments, we utilized an AMD Ryzen 9 5950X and reported the total execution time, which includes both user and system time. The execution time for compression, as well as the combined execution time for upsampling and quality estimation, varied depending on the resolution and the Constant Rate Factor (CRF) used during video encoding. As a result, we present the mean and maximum observed execution times.
While utilizing ffmpeg with the libx265 codec and a medium preset, we observed an approximate mean execution time of 0.42 minutes and a maximum execution time of 5.25 minutes for compression. Regarding the combined execution time of upsampling and quality estimation, we observed a mean of approximately 0.67 minutes and a maximum of around 0.94 minutes. Consequently, the construction of a convex hull via exhaustive encoding would require approximately 150 minutes on average, given our experimental settings, while direct construction of the reference bitrate ladder using bitrate steps would demand around 85 minutes on average. We also observed that the execution time for computation of the low-level feature set required about 6 minutes, while calculating the VIF features needed about 40 minutes. The execution time consumed by the Extra-Trees regressor was approximately 0.1 minutes per video.
Of course, the execution of Python-based code is considerably slower than that of C-based code (ffmpeg). This disparity becomes particularly noticeable when comparing the execution time of VMAF to the calculation of VIF features. Estimating VMAF between reference and compressed videos involves calculating VIF features on both videos. By contrast, VIF features in our models are only calculated on the reference video, which is the uncompressed video. When ffmpeg is used, due to its C-based execution, this process requires a maximum of approximately 0.94 minutes. By comparison, calculating VIF features in Python on a video sample required around 40 minutes. It is also worth noting that these execution times varied depending on video complexity, and the total execution time (user + system) was different from the time elapsed. Therefore, the execution times discussed should be understood as providing a baseline understanding of the time complexities of each process, but do not necessarily represent the best achievable execution time.
VI Conclusion and Future Work
We studied the efficacy of using features drawn from Visual Information Fidelity, extracted over scales and subbands, as features for constructing video bitrate and quality ladders. We proposed multiple feature sets based on VIF features, as well as an ensemble of VIF features and low-level features for constructing content-gnostic ladders for video delivery. The advantage of the VIF feature sets is that they can be easily calculated using a full-reference (FR) quality estimation model (e.g., VMAF) that is already widely deployed in video-delivery pipelines. We designed multiple regression models trained on these video content-gnostic features, along with metadata such as frame width and height, and bitrate or quality, to predict the quality or bitrate of compressed videos, respectively. We deployed these quality and bitrate prediction models to construct per-shot bitrate ladders with bitrate steps or quality ladders with VMAF steps. We compared our proposed models against existing popular techniques, including predicting cross-over bitrates and quality using low-level features. We also designed counterpart models that predict cross-over VMAF points and bitrates. Our observations indicated that ladders constructed by predicting cross-over points generally gave the best performance. When considering various quality and bitrate prediction methodologies, the use of an ensemble of low-level features and VIF features to predict quality (, ) in the construction of bitrate ladders, and the prediction of bitrates (, ) in the construction of quality ladders, obtained excellent performance against fixed bitrate ladder and reference bitrate ladders constructed from exhaustive encoding. The performances of these methods is close to, if not superior in some cases, to methods that predicted cross-over points. These results suggest a significant potential for constructing more efficient per-shot bitrate and quality ladders. In the future, we aim to explore the performances of these methods across various presets and codecs.
Acknowledgments
The authors thank the Texas Advanced Computing Center (TACC) at The University of Texas at Austin for providing HPC resources that have contributed to the research results reported in this paper. URL: http://www.tacc.utexas.edu.
References
- [1] I. Katsavounidis, “Iterative techniques for encoding video content,” 2021, uS Patent 10,917,644.
- [2] “Great mobile experiences start with excellent video streaming.” [Online]. Available: https://www.ericsson.com/4900be/assets/local/about-ericsson/company-facts/wordwide/united-states/docs/mobile-quality-of-experience-report.pdf
- [3] “HTTP live streaming (HLS) authoring specification for apple devices.” [Online]. Available: https://developer.apple.com/documentation/http-live-streaming/hls-authoring-specification-for-apple-devices
- [4] “Per-title encode optimization.” [Online]. Available: https://netflixtechblog.com/per-title-encode-optimization-7e99442b62a2
- [5] “Optimized shot-based encodes.” [Online]. Available: https://netflixtechblog.com/optimized-shot-based-encodes-now-streaming-4b9464204830
- [6] “Dynamic optimizer,” https://netflixtechblog.com/dynamic-optimizer-a-perceptual-video-encoding-optimization-framework-e19f1e3a277f.
- [7] Z. Wang, A. Bovik, H. Sheikh, and E. Simoncelli, “Image quality assessment: from error visibility to structural similarity,” IEEE Transactions on Image Processing, vol. 13, no. 4, pp. 600–612, 2004.
- [8] K. S. Durbha, H. Tmar, C. Stejerean, I. Katsavounidis, and A. C. Bovik, “Bitrate ladder construction using visual information fidelity,” in 2024 Picture Coding Symposium (PCS). IEEE, 2024, pp. 1–4.
- [9] H. Sheikh and A. Bovik, “Image information and visual quality,” IEEE Transactions on Image Processing, vol. 15, no. 2, pp. 430–444, 2006.
- [10] A. V. Katsenou, M. Afonso, D. Agrafiotis, and D. R. Bull, “Predicting video rate-distortion curves using textural features,” in Picture Coding Symposium, Nuremberg, Germany, December 4-7, 2016.
- [11] A. V. Katsenou, M. Afonso, and D. R. Bull, “Study of compression statistics and prediction of rate-distortion curves for video texture,” Signal Processing: Image Communication, vol. 101, p. 116551, 2022.
- [12] A. V. Katsenou, J. Sole, and D. R. Bull, “Content-gnostic bitrate ladder prediction for adaptive video streaming,” in Picture Coding Symposium, Ningbo, China, November 12-15, 2019.
- [13] A. V. Katsenou, J. Sole, and D. Bull, “Efficient bitrate ladder construction for content-optimized adaptive video streaming,” IEEE Open Journal of Signal Processing, vol. 2, pp. 496–511, 2021.
- [14] A. V. Katsenou, F. Zhang, K. Swanson, M. Afonso, J. Sole, and D. R. Bull, “VMAF-based bitrate ladder estimation for adaptive streaming,” in Picture Coding Symposium, Bristol, United Kingdom, June 29 - July 2, 2021.
- [15] A. Telili, W. Hamidouche, S. A. Fezza, and L. Morin, “Benchmarking learning-based bitrate ladder prediction methods for adaptive video streaming,” in Picture Coding Symposium, San Jose, CA, USA, December 7-9, 2022.
- [16] V. V. Menon, H. Amirpour, M. Ghanbari, and C. Timmerer, “Perceptually-aware per-title encoding for adaptive video streaming,” in IEEE International Conference on Multimedia and Expo, ICME 2022, Taipei, Taiwan, July 18-22, 2022.
- [17] V. V. Menon, J. Zhu, P. T. Rajendran, H. Amirpour, P. L. Callet, and C. Timmerer, “Just noticeable difference-aware per-scene bitrate-laddering for adaptive video streaming,” in 2023 IEEE International Conference on Multimedia and Expo (ICME), 2023, pp. 1673–1678.
- [18] F. Nasiri, W. Hamidouche, L. Morin, N. Dhollande, and J. Aubié, “Ensemble learning for efficient VVC bitrate ladder prediction,” in 10th European Workshop on Visual Information Processing, Lisbon, Portugal, September 11-14, 2022.
- [19] S. Paul, A. Norkin, and A. C. Bovik, “Efficient per-shot convex hull prediction by recurrent learning,” 2022.
- [20] I. Katsavounidis, “Chimera video sequence details and scenes,” https://www.cdvl.org/documents/NETFLIX_Chimera_4096x2160_Download_Instructions.pdf, 2015.
- [21] T. U. Ultra Video Group, http://ultravideo.cs.tut.fi/.
- [22] Harmonic Inc 4K demo footage, https://www.harmonicinc.com/4k-demo-footage-download/.
- [23] L. Song, X. Tang, W. Zhang, X. Yang, and P. Xia, “The sjtu 4k video sequence dataset,” in Fifth International Workshop on Quality of Multimedia Experience (QoMEX), 2013, pp. 34–35.
- [24] A. Elemental, https://www.youtube.com/playlist?list=PLwIpNYl7S0G_C5I76Tf46n6ImKssMn2kT/.
- [25] “VMAF - video multi-method assessment fusion.” [Online]. Available: https://github.com/Netflix/vmaf
- [26] S. Li, F. Zhang, L. Ma, and K. N. Ngan, “Image quality assessment by separately evaluating detail losses and additive impairments,” IEEE Transactions on Multimedia, vol. 13, no. 5, pp. 935–949, 2011.
- [27] H. R. Sheikh and A. C. Bovik, “A visual information fidelity approach to video quality assessment,” in First International Workshop on Video Processing and Quality Metrics for Consumer Electronics, Scottsdale, Arizona, 2005.
- [28] S. Ling, Y. Baveye, P. L. Callet, J. Skinner, and I. Katsavounidis, “Towards perceptually-optimized compression of user generated content (ugc): Prediction of ugc rate-distortion category,” in 2020 IEEE International Conference on Multimedia and Expo (ICME), 2020, pp. 1–6.
- [29] V. V. Menon, C. Feldmann, H. Amirpour, M. Ghanbari, and C. Timmerer, “VCA: video complexity analyzer.” Acm, 2022, pp. 259–264. [Online]. Available: https://doi.org/10.1145/3524273.3532896
- [30] G. Bjøntegaard, “Calculation of average PSNR differences between rd-curves,” 2001. [Online]. Available: https://api.semanticscholar.org/CorpusID:61598325
- [31] N. Barman, M. G. Martini, and Y. Reznik, “Bjøntegaard delta (BD): A tutorial overview of the metric, evolution, challenges, and recommendations,” arXiv preprint arXiv:2401.04039, 2024.
- [32] Anserw, “Bjontegaard metric,” 2016. [Online]. Available: https://github.com/Anserw/Bjontegaard_metric