JWST/NIRSpec Observations of Ly Emission in Star Forming Galaxies at
Abstract
We present an analysis of JWST Ly spectroscopy of galaxies, using observations in the public archive covering galaxies in four independent fields (GOODS-N, GOODS-S, Abell 2744, EGS). We measure Ly emission line properties for a sample of galaxies, with redshifts confirmed independently of Ly in all cases. We present new detections of Ly emission in JWST spectra, including a large equivalent width (EW Å) Ly emitter with strong C IV emission (EW Å) at in GOODS-N. We measure the redshift-dependent Ly EW distribution across our sample. We find that strong Ly emission (EW Å) becomes increasingly rare at earlier epochs, suggesting that the transmission of Ly photons decreases by between and . We describe potential implications for the IGM neutral fraction. There is significant field to field variance in the Ly emitter fraction. In contrast to the three other fields, the EGS shows no evidence for reduced transmission of Ly photons at , suggesting a significantly ionized sightline may be present in the field. We use available NIRCam grism observations from the FRESCO survey to characterize overdensities on large scales around known Ly emitters in the GOODS fields. The strongest overdensities appear linked with extremely strong Ly detections (EW Å) in most cases. Future Ly spectroscopy with JWST has the potential to constrain the size of ionized regions around early galaxy overdensities, providing a new probe of the reionization process.
1 Introduction
Ly emitting galaxies have long been used as probes of the reionization of intergalactic hydrogen (e.g., Malhotra & Rhoads 2004; Ouchi et al. 2010; Dijkstra 2014; Jung et al. 2020; Jones et al. 2024; see Ouchi et al. 2020 for a review), complementing measurements from the cosmic microwave background (CMB; Planck Collaboration et al. 2020) and deep quasar spectra (e.g., Bañados et al., 2018; Davies et al., 2018; Wang et al., 2020; Yang et al., 2020; Greig et al., 2022). The discovery of the first robust samples of star forming galaxies at in 2009 (e.g., Bouwens et al., 2010, 2011; Bunker et al., 2010; McLure et al., 2010, 2011; Oesch et al., 2010; Wilkins et al., 2010) sparked a series of ground-based spectroscopic campaigns with Keck and Very Large Telescope (VLT) aimed at measuring the distribution of Ly line strengths at (e.g., Stark et al., 2010; Fontana et al., 2010; Vanzella et al., 2011; Ono et al., 2012; Pentericci et al., 2014; Hoag et al., 2019; Mason et al., 2019b). The goal of these early investigations was to determine if the intergalactic medium (IGM) was sufficiently neutral at for its damping wing to attenuate the Ly line. These surveys quickly demonstrated that the fraction of strong Ly emitters (LAEs) in galaxy samples is lower than that at (e.g., Ono et al., 2012; Treu et al., 2013; Schenker et al., 2014; Tilvi et al., 2014; Pentericci et al., 2018; Mason et al., 2019b), indicating a significant reduction in transmission of Ly photons at . If due to the damping wing of the IGM, the disappearance of Ly emitters would point to significant neutral hydrogen (H I) fractions () at (e.g., Caruana et al., 2014; Zheng et al., 2017; Mason et al., 2018; Hoag et al., 2019; Whitler et al., 2020; Bolan et al., 2022; Nakane et al., 2024). Similar indications of a partially neutral IGM also emerged from comprehensive quasar surveys (e.g., McGreer et al., 2015; Jin et al., 2023; Ďurovčíková et al., 2024), suggesting a consistent picture for the latter half of reionization.
The launch of JWST (Gardner et al., 2023) has extended the galaxy frontier to (e.g., Arrabal Haro et al., 2023a, b; Bunker et al., 2023a; Curtis-Lake et al., 2023; D’Eugenio et al., 2023; Fujimoto et al., 2023a; Carniani et al., 2024; Castellano et al., 2024), offering the potential to apply the Ly test to the early stages of reionization. Deep JWST spectroscopy offers several distinct advantages with respect to earlier ground-based investigations. The absence of sky lines and atmospheric absorption has improved redshift completeness and reliability of flux measurements. The improved spectroscopic sensitivity and confident rest-frame optical redshifts allow meaningful Ly measurements in sources with continuum magnitudes fainter than was possible from the ground (e.g., Saxena et al. 2023; Chen et al. 2024), greatly improving statistics. Access to systemic redshifts and Balmer line fluxes have provided estimates of the velocity profiles and escape fraction of Ly, offering new insight into how the IGM is modulating Ly (e.g., Bunker et al., 2023a; Tang et al., 2023, 2024b, 2024a; Saxena et al., 2023, 2024; Chen et al., 2024; Witstok et al., 2024a).
Early results have demonstrated the potential of JWST to transform distant Ly emitter investigations. JWST spectroscopy of the galaxy GN-z11 (Oesch et al., 2016) quickly revealed the capability of the Near Infrared Spectrograph (NIRSpec; Jakobsen et al. 2022; Böker et al. 2023) in recovering Ly emission at (Bunker et al., 2023a). Meanwhile NIRSpec observations of the Extended Groth Strip (EGS; Davis et al. 2007) field revealed several extremely strong Ly emitters within several physical Mpc (pMpc) of previously-known bright Ly emitters (Tang et al., 2023; Chen et al., 2024; Nakane et al., 2024; Napolitano et al., 2024). The implied Ly escape fractions and equivalent widths (EWs) suggest minimal IGM attenuation, as would be expected if EGS was host to one or more large ( pMpc) ionized line-of-sight structures at (e.g., Tilvi et al., 2020; Leonova et al., 2022; Tang et al., 2023; Chen et al., 2024; Whitler et al., 2024). Variations in Ly visibility have been found in the EGS and Great Observatories Origins Deep Survey (GOODS; Giavalisco et al. 2004) South fields (Napolitano et al., 2024), possibly indicating significant differences in the typical IGM ionization state at in the two deep fields.
As of summer 2024, there is now a large database of NIRSpec observations targeting galaxies in four independent fields: Abell 2744 (Bezanson et al., 2022; Treu et al., 2022), EGS (Finkelstein et al., 2024), and GOODS-North and South (Bunker et al., 2023b; D’Eugenio et al., 2024). In this paper, we present an analysis of the Ly statistics of the full public dataset, with self-consistent reduction and selections. We measure Ly properties for galaxies at , a sample that is times larger than previous studies using NIRSpec (e.g., Jones et al., 2024; Nakane et al., 2024; Napolitano et al., 2024). We seek to quantify the distribution of Ly EWs and Ly escape fractions at with improved statistics relative to earlier investigations. Maximizing the number of independent fields is critical for these measurements given the range of IGM ionization states expected along different sightlines. We will use the evolving Ly distributions to quantify the changing transmission of Ly emission between and , discussing potential implications for the IGM. This compilation will provide insight into the state of Ly observations two years after the first JWST data, giving a baseline of what remains to be done to maximize the potential of JWST for constraining reionization with Ly datasets. The next key step involves investigating the galaxy populations in regions that Ly observations suggest are likely to be ionized. We will describe what early JWST observations are revealing about the galaxy environments associated with the strongest Ly emitters.
The organization of this paper is as follows. In Section 2, we describe the sample of galaxies at identified from publicly available JWST/NIRSpec observations. We then characterize the Ly EWs and Ly escape fractions of galaxies in our sample and derive the statistical distributions of Ly properties in Section 3. Using the Ly EW measurements, we infer the redshift-dependent transmission of Ly over and discuss the implications for the neutral hydrogen fraction in the IGM in Section 4. In Section 5, we discuss the galaxy environments associated with strong Ly emitting galaxies at . Finally, we summarize our conclusions in Section 6. Throughout the paper we adopt a -dominated, flat universe with , , and km s-1 Mpc-1. All magnitudes are quoted in the AB system (Oke & Gunn, 1983) and all EWs are quoted in the rest frame.
2 Spectroscopic Sample and Analysis
In this section, we construct and analyze the Ly properties of a sample of galaxies at with publicly-available NIRSpec spectra. We introduce the spectra in Section 2.1, and select the sample in Section 2.2. We describe the photometric measurements and fit the spectral energy distributions (SEDs) of our sources in Section 2.3. In Section 2.4, we present the spectroscopic measurements, characterizing the Ly EWs, Ly escape fractions, and Ly velocity offsets. We present three newly identified Ly emitting galaxies at in Section 2.5.
2.1 JWST/NIRSpec Spectra
The NIRSpec spectra used in this work were obtained from the following public observations: the JWST Advanced Deep Extragalactic Survey111https://jades-survey.github.io/ (JADES, GTO 1180, GTO 1181, PI: D. Eisenstein, GTO 1210, PI: N. Lützgendorf, GO 3215, PI: D. Eisenstein & R. Maiolino; Bunker et al. 2023b; Eisenstein et al. 2023a, b; D’Eugenio et al. 2024), the GLASS-JWST Early Release Science Program222https://glass.astro.ucla.edu/ers/ (ERS 1324, PI: T. Treu; Treu et al. 2022), the Cosmic Evolution Early Release Science333https://ceers.github.io/ (CEERS, ERS 1345, PI: S. Finkelstein; Finkelstein et al. 2024) and a Director’s Discretionary Time program (DDT 2750, PI: P. Arrabal Haro; Arrabal Haro et al. 2023a, b), as well as the Ultra-deep NIRCam and NIRSpec Observations Before the Epoch of Reionization444https://jwst-uncover.github.io/ (UNCOVER, GO 2561, PI: I. Labbé & R. Bezanson; Bezanson et al. 2022). All NIRSpec observations were performed with the multi-object spectroscopy (MOS) mode using the micro-shutter assembly (MSA; Ferruit et al. 2022). We refer readers to the above references for detailed descriptions of the NIRSpec observations. Below we briefly summarize these observations.
The JADES GTO 1180, GTO 1210, and GO 3215 observations targeted the GOODS-South field, and the GTO 1181 observations targeted the GOODS-North field. GTO 1180 so far have observed nine different pointings, using both the low resolution (; corresponding to velocity km s-1) prism covering a wavelength range of m and the medium resolution (; or km s-1 resolution in velocity) gratings with three grating/filter pairs G140M/F070LP, G235M/F170LP, and G395M/F290LP covering m. Each 1180 pointing was observed with exposure time of hours for prism and hours for each grating. GTO 1181 observed nine pointings using the prism and three medium resolution gratings (G140M/F070LP, G235M/F170LP, and G395M/F290LP), and three of the nine pointings were also observed using one high resolution (; or km s-1 in velocity) grating/filter pair G395H/F290LP. Each 1181 pointing took exposure time of hours for prism and hours for each grating. GTO 1210 observed one pointing using the prism, three medium resolution grating/filter pairs (G140M/F070LP, G235M/F170LP, and G395M/F290LP), and one high resolution grating/filter pair (G395H/F290LP), with exposure time of hours ( hours) for prism (each grating). GO 3215 observed one pointing using the prism and two medium resolution grating/filter pairs (G140M/F070LP and G395M/F290LP), with exposure time of , , and hours for prism, G140M/F070LP, and G395M/F290LP.
The GLASS and the UNCOVER observations targeted the field behind the lensing galaxy cluster Abell 2744 (Abell et al., 1989). The GLASS ERS 1324 observed one pointing using three high resolution grating/filter pairs G140H/F100LP, G235H/F170LP, and G395H/F290LP (covering m), with an exposure time of hours for each grating. The UNCOVER GO 2561 observed seven MSA mask configurations using the prism, with an exposure time of hours for each configuration. The CEERS ERS 1345 and DDT 2750 observations targeted the EGS field. ERS 1345 observed six pointings using the prism and another six pointings using three medium resolution grating/filter pairs (G140M/F100LP, G235M/F170LP, and G395M/F290LP), with four overlapped pointings observed with both the prism and gratings. The exposure time of each pointing is hour, except for one prism pointing with hours. DDT 2750 spectra observed one pointing using the prism, with an exposure time of hours. We list the details of the NIRSpec observations used in this study in Table 1.
| PID | Field | Pointings | PRISM | G140M | G235M | G395M | G140H | G235H | G395H |
|---|---|---|---|---|---|---|---|---|---|
| (h) | (h) | (h) | (h) | (h) | (h) | (h) | |||
| GTO 1180a | GOODS-S | 9 | - | - | - | ||||
| GTO 1181b | GOODS-N | 9 | - | - | |||||
| GTO 1210 | GOODS-S | 1 | - | - | |||||
| GO 3215 | GOODS-S | 1 | - | - | - | - | |||
| ERS 1324 | Abell 2744 | 7 | - | - | - | - | |||
| ERS 1345c | EGS | 6 | - | - | - | ||||
| GO 2561 | Abell 2744 | 7 | - | - | - | - | - | - | |
| DDT 2750 | EGS | 1 | - | - | - | - | - | - |
Note. — a: Seven of the nine 1180 pointings were observed with exposure time of hours for prism and hour for each grating at each pointing, one was observed with hours for prism and hours for each grating, and the remaining one was observed with hours for prism and hours for each grating. b: Six of the nine 1181 pointings were observed with the prism and three medium resolution gratings, with exposure time of hours for prism and hour for each grating at each pointing. The other three 1181 pointings were additionally observed with one high resolution grating, with an exposure time of hours for the prism and each grating at each pointing. c: Four 1345 pointings were observed with both the prism and medium resolution gratings, another two pointings were observed with gratings only and there are additional two observed with the prism only. Five of six pointings were observed using the prism with an exposure time of hour at each pointing, the remaining one was observed with hours for prism.
All the 2D NIRSpec spectra were reduced following the methods described in Topping et al. (2024a) using the standard JWST data reduction pipeline555https://github.com/spacetelescope/jwst (Bushouse et al., 2024). When performing the reduction, we also applied a wavelength-dependent slit loss correction for each spectrum assuming a point source, since the majority of objects in our sample are not significantly extended. We will discuss the slit loss in Section 3 when comparing against ground-based observations. For each object, we extract the 1D spectrum from the reduced 2D spectrum with a boxcar extraction. The extraction aperture is set to match the continuum or the emission line profile along the spatial direction, with a typical width of pixels ( arcsec in spatial direction; see also Tang et al. 2023; Chen et al. 2024).
2.2 Sample Selection
Using the public NIRSpec dataset, we identify a sample of galaxies with spectroscopic redshifts at . We determine the spectroscopic redshifts by visually inspecting the 2D spectra, searching for emission lines or the Ly break. We identify sources at with emission line detections. Then we derive the accurate systemic redshifts () of these systems as follows. For each object, we simultaneously fit the available strong rest-frame optical emission lines (H, H, [O III], or H) with Gaussian profiles. We use the fitted line centers to compute redshifts, then average them weighted by emission line S/N to obtain a final redshift. One object (JADES-20096216) has strong optical lines ([O III], Balmer lines) that are shifted out of the NIRSpec spectrum, so we derive the systemic redshift () based on its [Ne III] detection (see also Bunker et al. 2023b; Curtis-Lake et al. 2023; D’Eugenio et al. 2023). Overall we measure the systemic redshifts of emission line sources at .
In addition to galaxies with emission line detections, we identify a subset of galaxies without emission line detections based on the presence of Ly break. This is particularly important at given the absence of strong rest-frame optical emission lines in NIRSpec spectra. We include sources across the different fields with Ly break redshifts at . Our measurements are consistent with literature redshifts for these sources (Arrabal Haro et al., 2023a, b; Curtis-Lake et al., 2023; Fujimoto et al., 2023a). In order to maximize the size of the sample and ensure we are not biased against sources with weak emission lines (e.g., extremely metal-poor galaxies), we also search for sources with Ly breaks and no emission lines at lower redshifts (). We find such objects with redshifts at . In the following Section 2.3, we will examine whether the Ly break identifications of these systems are valid by fitting their SEDs. In total the NIRSpec sample contains galaxies with redshifts at .
Our goal is to investigate Ly properties of galaxies dominated by star formation, thus we remove systems hosting active galactic nuclei (AGNs) from the sample. Among the sources at , we find objects showing very broad Balmer emission lines (H or H), with full width at half maximum (FWHM) km s-1 and narrow [O III] emission lines (FWHM km s-1). This strongly suggests that they are broad-line AGNs, and indeed these sources have previously been identified as AGNs in the literature (Fujimoto et al., 2023a; Furtak et al., 2023a; Kocevski et al., 2024; Roberts-Borsani et al., 2024). We remove these systems from our sample, leaving galaxies at . There are , , , and galaxies in the Abell 2744, EGS, GOODS-N, and GOODS-S fields, respectively. These galaxies consist of emission line galaxies and Ly break systems without emission line detection. Among the galaxies, objects have low resolution prism spectra and have medium or high resolution grating spectra, with galaxies have both prism and grating spectra. In Table 4 we list the galaxies in our sample. This sample is larger than that used in earlier studies of Ly emission with NIRSpec ( objects at ; e.g., Jones et al. 2024; Nakane et al. 2024; Napolitano et al. 2024).
2.3 Photometric Measurements
We now characterize the physical properties (stellar populations, dust attenuation, ionizing properties) of galaxies in our NIRSpec sample by fitting their SEDs. We use the photometry extracted from the public JWST Near Infrared Camera (NIRCam; Rieke et al. 2005, 2023) imaging data when available. The NIRCam images were obtained from the observation programs introduced in Section 2.1. In all programs, we use deep imaging taken with six broad-band filters (F115W, F150W, F200W, F277W, F356W, and F444W) and one medium-band filter (F410M). For sources in JADES, we use additional images taken with F090W and F335M. We also use the F090W image taken from UNCOVER for sources in the Abell 2744 field. The NIRCam mosaics cover of the total galaxies in our sample. For of these galaxies, NIRCam images were taken with filters from F090W/F115W to F444W, fully covering their rest-frame UV to optical SEDs. For the remaining sources, NIRCam data were only taken with filters. The remaining of galaxies have not been observed with NIRCam, and we utilize the Hubble Space Telescope (HST) images from the Cosmic Assembly Near-infrared Deep Extragalactic Legacy Survey (CANDELS; Grogin et al. 2011; Koekemoer et al. 2011) dataset. We use the HST images taken with the Wide Field Camera 3 (WFC3/IR) filters F125W and F160W, which covers the rest-frame UV wavelengths of galaxies. When fitting SEDs, we will focus on the galaxies with full (rest-frame UV to optical) NIRCam SEDs in our sample.
We leverage the reduced JWST/NIRCam images and the photometry catalogs released on the DAWN JWST Archive666https://dawn-cph.github.io/dja/ (DJA). All the images were reduced with the grizli777https://github.com/gbrammer/grizli code (Brammer, 2023) in a homogeneous way. The process is briefly described in Valentino et al. (2023) and the full details will be presented in Brammer et al. (in prep.). The source extraction and photometry measurement on the reduced image were performed by the DJA team, using the Python version of Source Extractor (Bertin & Arnouts, 1996) sep (Barbary, 2016). We use the photometry measured in arcsec diameter circular apertures and corrected to the “total” fluxes within elliptical Kron (Kron, 1980) apertures. For galaxies in the Abell 2744 lensing cluster field (i.e., from GLASS and UNCOVER observations), we apply the magnification corrections888https://jwst-uncover.github.io/DR2.html (Weaver et al., 2024) derived from the updated lensing models in Furtak et al. (2023b) to their photometry. For HST imaging we use the CANDELS photometry catalogs generated by Guo et al. (2013) and Stefanon et al. (2017).
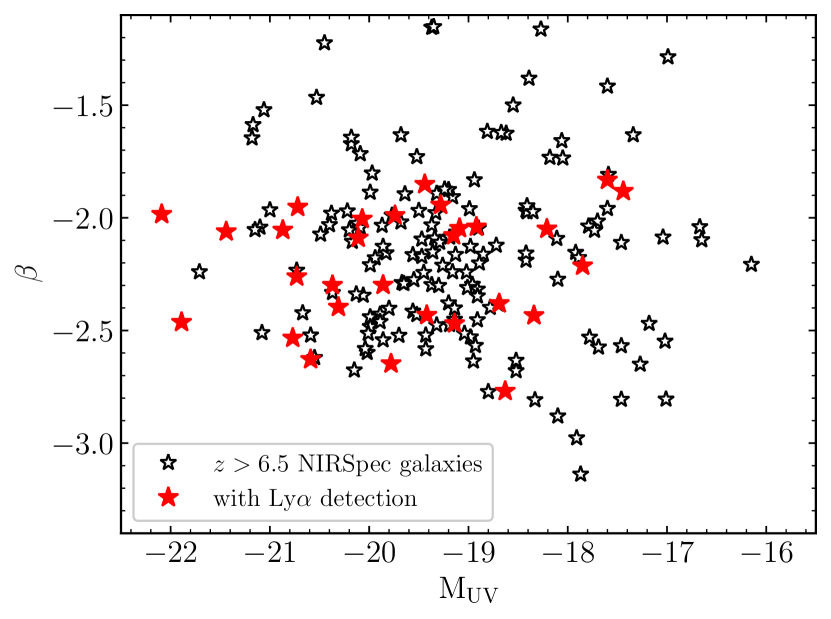
For each galaxy in our NIRSpec sample, we cross-match its coordinate with the photometry catalog and identify the best-matched source by visually inspecting the image. The absolute UV magnitudes (MUV) of the galaxies in our sample range from to , with a median M (Figure 1). Here we have included a magnification correction for those systems that are in lensing fields. We derive the UV continuum slopes for the galaxies with NIRCam SEDs by fitting a power law () to the broad-band photometry at rest-frame wavelength Å (Calzetti et al., 1994). The UV slopes of these galaxies at are generally blue (median ; Figure 1), suggesting relatively low dust attenuation, consistent with typical galaxies at these redshifts (e.g., Finkelstein et al., 2012; Bouwens et al., 2014; Cullen et al., 2023; Topping et al., 2024b).
We fit the NIRCam SEDs of the galaxies at using the Bayesian galaxy SED modelling and interpreting tool BayEsian Analysis of GaLaxy sEds (BEAGLE, version 0.29.2; Chevallard & Charlot 2016). The BEAGLE tool utilizes the latest version of the Bruzual & Charlot (2003) stellar population synthesis models and the Gutkin et al. (2016) photoionization models of star-forming galaxies with the CLOUDY code (Ferland et al., 2013). For each emission line galaxy, we fix the redshift to its systemic redshift measured from the NIRSpec spectrum (Section 2.2). For Ly break galaxies with no emission lines, we fit their redshifts in the range with a uniform prior. We assume a constant star formation history (CSFH), allowing the galaxy age to vary between Myr and the age of the Universe at the given redshift with a log-uniform prior. We also assume the Chabrier (2003) initial mass function (IMF) with stellar mass range of . The metallicity is set to vary in the range (; Caffau et al. 2011) and the dust-to-metal mass ratio () spans the range . The ionisation parameter is adjusted in the range . We adopt log-uniform priors for metallicity and ionization parameter, and a uniform prior for dust-to-metal mass ratio. For the dust attenuation, we apply the Small Magellanic Cloud (SMC) extinction curve (Pei, 1992), allowing the -band optical depth to vary between and with a log-uniform prior. Finally, we apply the prescription of Inoue et al. (2014) to account for the absorption of IGM. When fitting SEDs, we exclude the fluxes in filters blueward of Ly to avoid introducing the uncertain contribution from Lyman series emission and absorption.
From BEAGLE SED fitting, we derive the median values and the marginalized credible intervals from the posterior probability distributions for the fitted parameters. For the galaxies at with NIRCam SEDs, BEAGLE models indicate that their SEDs are dominated by young stellar populations, with CSFH ages spanning from Myr to Myr (median age Myr). The specific star formation rates (sSFRs) are large, with sSFR Gyr-1 (median sSFR Gyr-1) assuming CSFH. These suggest that many of our galaxies have recently experienced substantial bursts or upturns in their star formation histories, as is typical at these redshifts (e.g., Endsley et al., 2021, 2023a; Boyett et al., 2024).
The inferred dust attenuation of our galaxies is low, with a median rest-frame -band optical depth only . This is consistent with the blue UV slopes of our systems. The CSFH stellar masses of these galaxies are relatively low, ranging from to (median ). Here we note that the stellar masses derived from CSFH models correspond to the young stellar populations dominating the rest-frame UV to optical light. If older stellar populations exist in these galaxies (which could be easily outshined by the light from young stars), the stellar masses may increase up to an order of magnitude (e.g., Tang et al., 2022; Tacchella et al., 2023; Whitler et al., 2023). However, this effect does not impact the main results of this paper, as we do not discuss any trends with stellar mass.
The NIRCam SEDs exhibit flux excesses in filters contaminated by [O III] and H, allowing useful constraints to be placed on the [O III]+H EWs of galaxies in our sample. We find the rest-frame [O III]+H EWs span from Å to Å for the galaxies with BEAGLE models, with a median value of Å. This median [O III]+H EW is comparable to the average [O III]+H EW of galaxies at ( Å; e.g., Endsley et al. 2023a, b). The strong emission lines are expected given the young stellar ages inferred from the BEAGLE models for our sources (e.g., Chevallard et al., 2018; Tang et al., 2019, 2023).
The NIRCam SEDs also allow us to constrain the hydrogen ionizing photon production efficiencies (). Here we adopt the most commonly used definition of in literature: the hydrogen ionizing photon production rate per unit intrinsic UV luminosity density at rest-frame Å (), where includes both stellar and nebular continuum and is corrected for dust attenuation (see Chevallard et al. 2018 for various definitions of used in the literature). The BEAGLE models indicate that our galaxies have large ionizing photon production efficiencies, ranging from erg-1 Hz to erg-1 Hz with a median erg-1 Hz. These are comparable to the reionization-era populations (median erg-1 Hz; e.g., Endsley et al. 2023b; Tang et al. 2023). These results suggest that many of our galaxies have hard ionizing spectra.
Finally, we examine the Ly break identifications of the galaxies with no emission lines using the SED fitting results. Comparing to the redshifts derived from Ly breaks in NIRSpec spectra, the posterior median redshifts inferred from BEAGLE models are consistent within . For the four galaxies at , we consider whether the emission line fluxes predicted from BEAGLE models are consistent with the non-detections in the NIRSpec spectra. For [O III] (which is often the brightest optical emission line), the posterior median fluxes inferred from BEAGLE models for these four systems are erg s cm-2. These are in agreement with the upper limits of [O III] fluxes measured from NIRSpec spectra ( erg s cm-2). Therefore, we conclude that the Ly break identifications of the galaxies without emission line detections from NIRSpec spectra are consistent with their NIRCam SEDs.
2.4 Spectroscopic Measurements

In this subsection, we measure the emission line properties of the galaxies in our sample from the NIRSpec spectra. We first measure the Balmer emission line (H, H, H, or H) fluxes and derive the nebular dust attenuation using Balmer decrements. Then we derive the fluxes of Ly emission lines as well as the Ly EWs, Ly escape fractions, and Ly velocity offsets. The emission line measurements are performed for both the NIRSpec prism and grating spectra.
We derive the Balmer emission line fluxes by fitting the line profiles with Gaussians for the emission line galaxies in our sample (except for JADES-20096216 whose Balmer lines are not visible, see Section 2.2). To evaluate the uncertainties of measured line fluxes, we resample the flux densities of each spectrum times by taking the observed flux densities as mean values and the errors as standard deviations. Then we derive the line fluxes from the resampled spectra of each object and take the standard deviation as the uncertainty.
Utilizing the measured Balmer emission line fluxes, we estimate the dust attenuation to nebular emission from Balmer decrement. We use the observed H/H flux ratios for galaxies at where both emission lines are visible in NIRSpec spectra, the H/H ratios for those at where H is not visible, and the H/H ratios for those at where neither H nor H is visible. Assuming case B recombination and a gas temperature K, we expect the intrinsic H/H, H/H, and H/H ratios are , , and , respectively (Osterbrock & Ferland, 2006). We compare the observed Balmer decrements to the intrinsic values to derive the dust extinction assuming the Cardelli et al. (1989) curve. We infer a median , suggesting negligible dust attenuation to the nebular emission of our galaxies. This result is consistent with the low dust attenuation inferred from BEAGLE SED fitting (Section 2.3).
We now search for Ly emission lines of galaxies in our sample based on the systemic redshifts (Section 2.2). We detect Ly emission with S/N in galaxies out of the total objects. In galaxies their Ly emission lines are detected in grating spectra, and in galaxies the Ly lines are detected in prism spectra, including galaxies with Ly lines detected in both grating and prism spectra. The Ly detections of of these Ly emitting galaxies at have been reported in literature (Bunker et al., 2023a; Fujimoto et al., 2023a; Tang et al., 2023, 2024b, 2024a; Chen et al., 2024; Jones et al., 2024; Napolitano et al., 2024; Saxena et al., 2024; Witstok et al., 2024a). We have newly identified galaxies with Ly detections (JADES-13041, JADES-14373, JADES-15423), which will be described in detail in Section 2.5. In the following we derive the Ly EWs, Ly escape fractions, and Ly velocity offsets of galaxies in our sample.
We first compute the Ly fluxes and EWs from grating spectra. For each object with grating spectrum, we calculate the underlying continuum flux density by fitting the spectrum at rest-frame Å to Å with a flat continuum (in ) and extrapolating the fitted continuum to the Ly line center (determined using the systemic redshift). We do not use the spectrum at rest-frame Å for continuum fitting to avoid potential damped Ly absorption. For each galaxy with Ly detection in grating spectrum, we derive its Ly flux by fitting the continuum-subtracted line profile with an asymmetric Gaussian function to account for the impact of the IGM to the blue side of the Ly line. The uncertainty of the Ly flux is estimated using the same resampling methods introduced above. For those which Ly is undetected in grating spectra ( galaxies), we put upper limits to the Ly fluxes by directly integrating the error spectra over km s-1 within the systemic redshift in quadrature. This window ensures we capture the entire Ly profile of a galaxy (e.g., Tang et al., 2024b; Saxena et al., 2024). Then the Ly EWs (upper limits) are computed as the ratio between the measured Ly line fluxes (upper limits) and the underlying continuum flux densities. For the galaxies with Ly detections in grating spectra, we derive the percentile of Ly EW Å, Å, and Å. For the galaxies with Ly non-detections, the median upper limit of their Ly EWs derived from grating spectra is Å.
We apply the following methods to calculate the Ly fluxes and EWs from prism spectra. Due to the low resolution of the blue end of NIRSpec prism spectra (), the Ly emission of reionization-era galaxies will spread pixels at both sides of the Ly break (e.g., Chen et al., 2024; Jones et al., 2024; Keating et al., 2024; Napolitano et al., 2024). To estimate the underlying continuum flux density from prism spectrum, we fit the continuum with a power law at rest-frame Å to Å and a Heaviside function at the Ly break (e.g., Jones et al., 2024) for each object. For galaxies with Ly detections in prism spectra ( objects), we calculate the Ly line fluxes by directly integrating the continuum-subtracted line profile over rest-frame Å (corresponding to pixels centered on the Ly peak in prism spectrum). We derive the percentile of Ly EW Å, Å, and Å for these galaxies. For the galaxies with Ly detections in both prism and grating spectra, we find that their Ly fluxes and EWs derived from both spectra are generally consistent, with a scatter of dex. For those which Ly is undetected in prism spectra ( galaxies), we derive the upper limits of Ly line fluxes by integrating the error spectra over the same wavelength range in quadrature. The median upper limit of the Ly EWs of these galaxies is Å. The Ly EWs of our galaxies are shown in the top panel of Figure 2.
We next calculate the Ly escape fractions using the Ly flux constraints and Balmer emission line fluxes. We define the Ly escape fraction () as the ratio between the observed Ly flux () and the intrinsic Ly flux (). The intrinsic Ly flux is derived from the dust corrected H flux (; at ), H flux (; at ), or H flux (; at ), where the dust correction is estimated from the Balmer decrement measurement. Assuming case B recombination and K, we calculate the intrinsic Ly flux as , , or (e.g., Osterbrock & Ferland, 2006; Hayes, 2015; Henry et al., 2015). For the () galaxies with both Ly and Balmer emission line detections in grating (prism) spectra, we derive the percentile of , , and (, , and ). We put upper limits of for sources which Ly is undetected but Balmer emission lines are detected. The median upper limit is measured from grating spectra ( objects) and from prism spectra ( objects). In the bottom panel of Figure 2 we present the Ly escape fractions of galaxies in our sample.
Finally, we derive the Ly velocity offsets () for a subset of galaxies with Ly detections at . Because the derivation of Ly velocity offset requires precise measurements of redshift, we only consider objects with systemic redshifts derived from multiple emission lines measured in the medium or high resolution grating spectra. There are galaxies with Ly detections and systemic redshift measurements from grating spectra at . We derive their Ly redshifts () by fitting the line profiles with asymmetric Gaussian functions and using the fitted line centers. The Ly velocity offset is computed as , where is the speed of light. For those galaxies we derive the percentile of Ly velocity offsets km s-1, km s-1, and km s-1. The uncertainties of Ly velocity offsets are estimated by resampling the flux densities times and taking the standard deviation of Ly velocity offsets derived from the resampled spectra. The Ly velocity offset results were initially presented in Tang et al. (2024a). In Table 4 we list the Ly properties of galaxies in our NIRSpec sample.
2.5 New Ly Emitting Galaxies at

Our analysis has revealed three galaxies in the public datasets with newly identified Ly emission detections. We present the spectroscopic detections and properties of these galaxies in this subsection.
The strongest Ly emitter in the new sample is JADES-13041 at , identified in the 1181 observations of GOODS-N. This galaxy is situated at the same redshift as several other Ly emitters in this field (Tang et al. 2024a; see also Section 5). In Figure 3, we show the medium resolution grating spectra of JADES-13041. Strong rest-frame optical emission lines (H, [O III]) are clearly seen in its G395M/F290LP spectrum. By simultaneously fitting the strong optical lines with Gaussian profiles, we derive a systemic redshift of . We detect the Ly emission line of JADES-13041 in its G140M/F070LP spectrum, with . This indicates a Ly velocity offset of km s-1. We measure a Ly flux of erg s-1 cm-2 and EW Å. The Ly EW of JADES-13041 places it in the top of the Ly EW distribution at (see Section 3.2), indicating its strong Ly that is atypical in the reionization era.
We also constrain the Ly escape fraction of JADES-13041 using the H emission line. We measure a H/H ratio of . Comparing to the intrinsic H/H ratio expected in case B recombination (), this indicates negligible dust attenuation to the nebular emission. Assuming case B recombination with K, we derive a large Ly escape fraction of . We note that different recombination assumptions may yield different escape fractions (e.g., Chen et al., 2024; McClymont et al., 2024; Scarlata et al., 2024; Tang et al., 2024b), but the net conclusion that JADES-13041 transmits a large fraction of its Ly emission will not change. The fact that such a strong Ly emitter is located at the same redshift as other Ly emitters in GOODS-N may suggest the presence of an ionized bubble. We will come back to this in Section 5, describing whether there is evidence for an overdensity of galaxies at this redshift.
The spectrum of JADES-13041 reveals high ionization nebular C IV emission in the G140M/F070LP spectrum. We measure a C IV doublet EW Å, consistent with the intense C IV emission seen in a subset of reionization-era galaxies with metal poor gas (e.g., Stark et al., 2015; Castellano et al., 2024; Tang et al., 2024a; Topping et al., 2024a; Witstok et al., 2024a). The line ratio of the C IV doublet components () is close to the intrinsic value (; e.g., Flower et al. 1979), consistent with minimal scattering of the resonant line photons. The detection of such strong C IV emission indicates a hard radiation field in JADES-13041, potentially impacting the visibility of Ly emission.

We show the NIRCam photometry of JADES-13041 and the best-fit BEAGLE model (Section 2.3) in Figure 4. JADES-13041 has an absolute UV magnitude of . Its UV slope is blue (), consistent with the negligible dust attenuation inferred from H/H ratio. The SED fitting results indicate a relatively low stellar mass ( assuming CSFH). BEAGLE models also demonstrate that the rest-frame UV to optical light of this galaxy is dominated by very young stellar populations (CSFH age Myr), as expected for galaxies undergoing recent upturns in star formation.

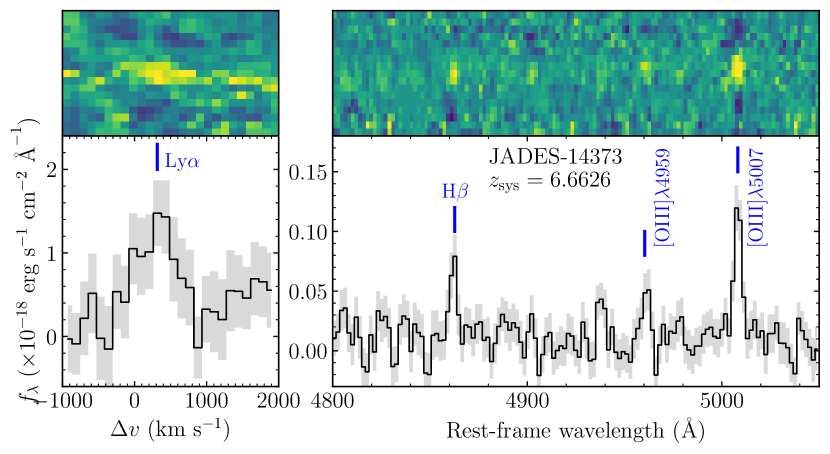
The two other new Ly detections are JADES-15423 (identified in the 1180 observations in GOODS-S) and JADES-14373 (identified in the 1181 observations in GOODS-N), both showing more moderate strength lines (EW Å) in the medium resolution gratings. The spectrum of JADES-15423 (M) is shown in the top panel of Figure 5. We find H, H, and [O III] emission lines in the G395M/F290LP spectrum. By fitting these optical lines with Gaussian profiles, we derive a systemic redshift of . In its G140M/F070LP spectrum, we detect the Ly emission with , indicating a Ly velocity offset of km s-1. We measure a Ly flux of erg s-1 cm-2 and EW Å. Then we estimate the dust attenuation from the Balmer decrement and hence calculate the Ly escape fraction for JADES-15423. We measure an H/H ratio , indicating a negligible dust attenuation to the nebular emission by comparing with the intrinsic H/H ratio expected from case B recombination (). Assuming case B recombination, we derive a Ly escape fraction of for JADES-15423.
For JADES-14373 (M), we detect the H, [O III], and H emission lines (bottom panel of Figure 5). We fit the optical lines with Gaussians and derive a systemic redshift of . We detect Ly at , indicating a velocity offset of km s-1. The Ly flux is erg s-1 cm-2 and the resulting EW is Å. We infer the nebular dust attenuation of JADES-15423 from the H/H ratio (). Comparing with the intrinsic value expected from case B recombination (H/H), this suggests negligible dust attenuation to nebular gas. We then derive a Ly escape fraction of for JADES-14373 assuming case B recombination.
3 The Evolution of Ly at
In this section, we derive the distributions of Ly EWs and Ly escape fractions at . We introduce the methodology for deriving Ly property distributions in Section 3.1. Then we present the distributions of Ly EW in Section 3.2 and Ly escape fraction in Section 3.3. Using these distributions we quantify the fractions of galaxies presenting large Ly EWs and large Ly escape fractions at and explore the evolution of such Ly emitter fractions in the reionization era. Finally, we discuss the field-to-field variations in Ly in Section 3.4.
3.1 Methodology
We establish the Ly EW and Ly escape fraction distributions at using a Bayesian approach (e.g., Schenker et al., 2014; Endsley et al., 2021; Boyett et al., 2022; Chen et al., 2024) following the methodology described in Tang et al. (2024b). To be consistent with previous studies of Ly property distributions at (e.g., Schenker et al., 2014; Endsley et al., 2021; Chen et al., 2024; Tang et al., 2024b), we assume a log-normal distribution of Ly EW or Ly escape fraction for our sample. We note that fitting our data with a different distribution model (an exponentially declining function; Dijkstra et al. 2011) does not impact the main results (i.e., the fraction of galaxies showing large Ly EWs or large ) significantly.
We briefly summarize the methodology for constructing Ly EW and Ly escape fraction distributions. We model the distributions with a set of parameters , where and are the mean and the standard deviation of a log-normal distribution. For a Ly EW distribution, we assume uniform priors for the parameters: (corresponding to median Ly EW Å) and (e.g., Schenker et al., 2014; Endsley et al., 2021). For a Ly escape fraction distribution, we adopt a uniform prior for ( to , or median ) and a Gaussian prior for (mean , standard deviation ; Chen et al. 2024). Using Bayes’ theorem, we derive the posterior probability distributions of the model parameters as:
where are the priors of the parameters and is the likelihood of the entire sample for a given set of parameters .
The likelihood of each set of parameters is computed as follows. We write the log-normal probability distribution as:
where is the Ly EW or Ly escape fraction, and is the normalization parameter: for the Ly EW distribution, for the Ly escape fraction distribution (Chen et al., 2024). For each galaxy with Ly emission detections in the sample, the Gaussian measurement uncertainty is:
where and are the observed Ly EW or Ly escape fraction and its uncertainty of the system. Then the individual likelihood of each galaxy with Ly detection is written as:
For non-detections of Ly, the absence of OH sky lines in NIRSpec observations significantly improves the completeness of line detection (relative to earlier ground-based observations), the individual likelihood can be simply written as the likelihood of Ly EW or below the upper limit:
where is the upper limit of Ly EW or . The total likelihood for each set of parameters is taken as the product of individual likelihoods of all the galaxies in the sample:
Finally, we sample the posteriors of the model parameters using a Markov Chain Monte Carlo (MCMC) approach with the emcee package (Foreman-Mackey et al., 2013). For each model parameter, we derive the posterior probability distribution and compute the median value and the marginal credible interval.
3.2 The Ly EW Distribution
We now derive the Ly EW distribution and compare with results at in Tang et al. (2024b). We note that the Ly property distributions in Tang et al. (2024b) are derived using spectra obtained with ground-based spectrographs including the Multi Unit Spectroscopic Explorer (MUSE; Bacon et al. 2010) at VLT and the DEep Imaging Multi-Object Spectrograph (DEIMOS; Faber et al. 2003) at the Keck II telescope. Comparison with JWST/NIRSpec MSA observations require modest flux conversions due to the different apertures used to extract spectra. The apertures we used to extract spectra from ground-based facilities have a median diameter of arcsec (Tang et al., 2024b). In Tang et al. (2024b) we have derived a conversion factor between the Ly fluxes measured from MUSE or DEIMOS spectral extractions and NIRSpec MSA shutter spectra (NIRSpec Ly flux ground-based Ly flux). We multiply the ground-based Ly fluxes by this factor in order to be consistent with the NIRSpec measurements. To quantify the redshift revolution, we divide our sample into three redshift bins: (median , galaxies), (median , galaxies), and (median , galaxies). The fitted Ly EW distribution parameters of each group are presented in Table 2.
| Sample | (Å) | ||
|---|---|---|---|
| EGS () | |||
| GOODS + Abell 2744 () |
Note. — is the number of galaxies in each subsample. We give the Posterior median and credible interval of the median Ly EW () and standard deviation ().
As ground-based investigations focused most on the disappearance of Ly emitters between and , we first investigate whether JWST observations suggest a similar picture. At , we derive the following constraints on the Ly EW distribution parameters: and . This indicates that of the galaxies show strong Ly emission with EW Å (the so-called Ly fraction; e.g., Stark et al. 2010). In Figure 6, we compare our Ly fractions to those derived at () and () in Tang et al. (2024b). The comparison indicates that strong Ly emission becomes less common from to . This is consistent with the trends found in the literature from ground-based studies (e.g., Schenker et al., 2014; Pentericci et al., 2018) and early JWST work (Jones et al., 2024; Nakane et al., 2024).

We note that earlier measurements have often focused on systems with , narrower than the MUV range of our sample (). To evaluate how a different MUV range affects our results, we also derive the Ly EW distribution and the Ly fraction of our galaxies with ( galaxies) using the same methodology. We find that the Ly fraction of this subset is , which is consistent with the Ly fraction of the entire sample (). Therefore, we conclude that choosing different MUV ranges (the entire MUV range of our sample or that mostly used in the literature) does not impact our results significantly.
In spite of the disappearance of Ly emitters, JWST is revealing a small number of galaxies with extremely strong Ly emission (EW Å) at (Figure 2; see also, e.g., Saxena et al. 2023; Chen et al. 2024; Napolitano et al. 2024; Tang et al. 2024a; Witstok et al. 2024a). Based on our Ly EW distribution, we infer that and of the galaxies at present Ly EW Å and Å, respectively. Ly emission with EW Å is sufficiently close to the intrinsic Ly EWs ( Å; e.g., Chen et al. 2024; Tang et al. 2024b) to suggest a large fraction () of Ly escapes from these systems. These galaxies must be located along sightlines where the transmission through the IGM is large ( assuming unity transmission through the ISM and CGM). It has been shown that this large transmission requires these galaxies are far from the neutral IGM ( pMpc; e.g., Mason & Gronke 2020; Saxena et al. 2023; Tang et al. 2024a; Witstok et al. 2024a). As typical bubble sizes decrease at , we expect these large ionized sightlines (and the extremely strong Ly emitters they permit) should disappear from our survey volume.
We now consider what current observations reveal about Ly emission at . Early JWST observations took the first steps to constrain the Ly fraction at based on a handful of spectroscopically-selected galaxies (; e.g., Jones et al. 2024; Nakane et al. 2024; Napolitano et al. 2024). The public NIRSpec sample used in this study increases the redshift sample by a factor of (). At , the Ly EW distribution parameters are and . This indicates a Ly fraction (EW Å) of , about only half of the Ly fraction at . At , given the relatively small sample size ( galaxies) we use the statistics for small numbers of events (Gehrels, 1986) to estimate the Ly fraction. None of the systems at present Ly emission with EW Å, resulting in a Ly fraction of . These results suggest that whatever physical process is leading to the disappearance of strong Ly emitters at continues to . The extremely strong Ly lines (EW Å) that may provide signposts of large ionized sightlines indeed are extremely rare in existing samples, comprising only of the galaxies at . We will quantify implications for the evolution in Ly transmission in Section 4.
3.3 The Ly Escape Fraction Distribution
We now consider the evolution in the Ly escape fraction distribution. We consider two redshift bins: ( galaxies) and ( galaxies). We do not derive the Ly escape fraction distribution at because there are only two objects with constraints. The Ly escape fraction distribution parameters of these two bins are shown in Table 3. At , the Ly escape fraction distribution indicates that of the population shows large Ly escape fractions (). As a baseline reference, the fractions of galaxies with are at and to at (Chen et al., 2024; Tang et al., 2024b). The results suggest that the fraction of galaxies with large Ly escape fractions decreases by a factor of from to (Figure 7). The fraction of galaxies with large Ly transmission decreases further at , with only of the population presenting (Figure 7). We will discuss implications of the evolving Ly transmission in Section 4.
| Sample | |||
|---|---|---|---|
| EGS () | |||
| GOODS + Abell 2744 () |
Note. — is the number of galaxies in each subsample. We give the Posterior median and credible interval of the median Ly escape fraction () and standard deviation ().

3.4 Field-to-Field Variations
In the final portion of this section, we explore the field-to-field variations of the distributions of Ly emitters at . If there are large ( pMpc) ionized sightlines corresponding to early intergalactic bubbles, the counts of Ly emitters will vary greatly in different fields.
We show the spatial distributions of spectroscopically-confirmed galaxies at in the four fields sampled by JWST observations (EGS, Abell 2744, GOODS-S, and GOODS-N) in Figure 8. We also include the small number of Ly emitters with Ly detections identified from ground-based telescope observations that have yet to be observed with JWST (Oesch et al., 2015; Tilvi et al., 2020; Jung et al., 2022). We see clearly that there is significant variance in the counts of Ly emitters in the four observed fields. The EGS now has Ly detections in the redshift range , far greater than what has been reported in the other three fields. In spite of considerable observational investment, the GOODS-S and GOODS-N fields have only revealed and Ly emitting galaxies at , respectively. The Abell 2744 field currently has only Ly detections in the same redshift range, and of them appear to be broad line AGNs (Furtak et al., 2023a; Kocevski et al., 2024).

To quantity whether the excess of Ly detections in EGS is statistically meaningful with existing data, we calculate the distribution of Ly properties in each field. The EW and escape fraction distribution parameters are presented in Table 2 and Table 3, respectively. In the EGS, we find that of the galaxies in this field present strong (EW Å) Ly emission. This is two times greater than the Ly fraction measured in the other three fields (Figure 6). The Ly escape fraction distribution shows a similar result, with the EGS displaying a larger fraction of high escape fraction () galaxies (Figure 7).
Also of note in Figure 6 and Figure 7 is the comparison of the field-dependent Ly fraction at and . The EGS shows no evidence for a significant downturn in Ly emission that is seen in the three other fields targeted to date. While uncertainties are still significant, current results suggest that the impact of the damping wing from the neutral IGM may be significantly reduced in the EGS field at , as expected in regions with large ionized sightlines. Of the four fields targeted so far with JWST, it does appear as if the EGS may be host to the largest ionized regions at . Statistical uncertainties will be greatly reduced as larger rest-frame UV spectroscopic samples are obtained.
4 Ly Emission Transmission at and Implications for the Early IGM
In Section 3, we quantified the disappearance of galaxies with large Ly EWs and large escape fraction of Ly from to . In this section, we will constrain the evolution in the transmission of Ly photons that is required to explain the observations (Section 4.1). Assuming this is driven by damping wing attenuation from the neutral IGM, we will estimate the neutral hydrogen fraction in the IGM () at following similar methods to that used in the literature (e.g., Mason et al., 2018, 2019b) (Section 4.2). Here our focus will primarily be on the very early stages of reionization () that JWST observations are now probing.
4.1 The Evolving Transmission of Ly Emission
To derive the evolution in the transmission of Ly, we compare the rest-frame Ly EWs at with the Ly EW distribution at . We will assume that changes in Ly are driven by evolution in the IGM transmission (), but we will discuss the likelihood of additional contributions from evolving galaxy properties below. Recent studies have suggested an endpoint of reionization at (e.g., Becker et al., 2021; Bosman et al., 2022; Spina et al., 2024; Zhu et al., 2024). It is thus standard to use the Ly EW distribution at as the baseline against which higher redshift samples are assessed. We will make use of the Ly EW distribution that was recently derived in Tang et al. (2024b) using ground-based spectroscopy together with JWST/NIRCam photometry. As discussed in Tang et al. (2024b) and in Section 3, comparison of the distributions with JWST/NIRSpec observations requires correction for the aperture mismatch between the ground-based spectra and the NIRSpec microshutter. For the ground-based observations used in this study, this aperture correction is on average given by (see Tang et al. 2024b). After applying this correction, the Ly EW distribution, , can be modeled by a log-normal distribution with parameters and . Since we are interested in the transmission relative to , we assume the average IGM transmission of Ly at is unity () and then write a forward model of Ly EW distribution as . We note that the residual H I in the ionized IGM at does impact Ly transmission (see Tang et al. 2024b), but this does not affect our results since we are only interested in computing the relative transmission as the IGM becomes increasingly neutral at .
Equipped with the forward model of Ly EW distribution, we infer the average IGM transmission of Ly at (relative to ) using a Bayesian approach (e.g., Mason et al., 2018). Based on Bayes’ Theorem, we derive the posterior probability distribution of inferred from Ly EWs as:
Here is the prior on the IGM transmission, and we assume a uniform prior with . The likelihood of the entire NIRSpec sample for a given is written as , which is taken as the product of the individual likelihood of all the galaxies in the sample. For each galaxy with a Ly detection, the likelihood function is given by:
where EWi and are the measured Ly EW and the uncertainty of the galaxy. For each source where Ly is undetected, the individual likelihood is as follows:
where is the upper limit of Ly EW, and erfc is the complementary error function. We then sample the posterior of the IGM transmission using an MCMC approach with the emcee package. We derive the posterior probability distribution of and compute the median value and the marginal credible interval.
We now derive the average transmission of Ly (relative to ) for galaxies in three redshift ranges: (median ), (median ), and (median ). At , we require an IGM transmission to reproduce our observations. This suggests that the average IGM transmission of Ly at is about half that at . The average IGM transmission decreases at yet higher redshifts, with at and at . These findings indicate that the transmission of Ly photons decreases by between and . This result is now clearly established with JWST spectroscopy (see also Tang et al. 2023; Chen et al. 2024), marking a significant step beyond the uncertainties that were inherent in ground-based infrared campaigns (as described in Section 1).
Observational work has long sought to determine how much of the evolution in Ly is driven by changes in galaxies and how much is due to the IGM. As our understanding of the demographics of the galaxy population has improved, it has become clear that galaxies are unlikely to be the primary factor driving this evolution. Indeed at , the physical properties of galaxies shift towards higher sSFR and lower dust attenuation, implying a higher intrinsic production efficiency and escape of Ly photons from galaxies (e.g., Stark et al., 2010; Stefanon et al., 2022; Topping et al., 2022, 2024b; Cullen et al., 2023; Morales et al., 2024). Measurements of low ionization absorption lines at suggest that the covering fraction of neutral gas in the ISM and CGM of galaxies decreases toward earlier times (e.g., Jones et al., 2012; Du et al., 2018; Pahl et al., 2020), likely allowing a larger fraction of Ly radiation to be transmitted through galaxies. Collectively these observations indicate that galaxies are evolving in a manner that allows more Ly to escape at earlier epochs, consistent with the evolution in Ly EW distribution at (e.g., Stark et al., 2011; Cassata et al., 2015; Arrabal Haro et al., 2018; de La Vieuville et al., 2020; Kusakabe et al., 2020; Tang et al., 2024b)
JWST continuum spectroscopy is now allowing new avenues of probing the influence of galaxies on the transfer of Ly photons, building on the work described above. Recent attention has focused on the discovery of strong absorption around the Ly break in galaxies, likely by dense neutral gas in the ISM and CGM (e.g., Cameron et al., 2024; Chen et al., 2024; Hainline et al., 2024; Heintz et al., 2024a, b). Of course the presence of such damped Ly spectra are not surprising, as they are seen in a large fraction of galaxy spectra (e.g., Shapley et al., 2003). Based on existing JWST spectroscopy, there is no indication that gas column densities required to produce the damped Ly profiles are significantly different than at lower redshifts (e.g. Reddy et al., 2016), or evolve strongly with redshift (Mason et al. in prep.). The absence of strong evolution toward large H I column densities in the CGM of early galaxies is consistent with indications for lower neutral gas covering fractions at described above. While there have long been suggestions from quasar absorption line studies that the CGM may become more neutral at (Becker et al., 2019; Cooper et al., 2019; Christensen et al., 2023; Sebastian et al., 2024), it is thought that this effect is not able to dominate the evolving Ly transmission seen in galaxy spectra. An increasingly neutral IGM is the most likely driver (Mesinger et al., 2015). As higher resolution JWST continuum spectra are obtained, it will be possible to revisit the quantitative impact of self-shielding absorption systems on Ly emission. In what follows, we will consider what neutral hydrogen fraction is required for the damping wing attenuation to reproduce the Ly emission spectra.
4.2 Implications for the Early IGM Neutral Fraction
We now quantify the neutral hydrogen fraction required to explain the decrease in the Ly transmission between to , making the standard assumption that an increasingly neutral IGM is the primary source of opacity to Ly photons. In addition to the attenuation provided by the damping wing of the neutral IGM (Miralda-Escudé, 1998), it is standard to also account for the effect of infalling intergalactic gas onto galaxies. Even if the regions surrounding galaxies have been reionized, the IGM density is high enough that the residual neutral hydrogen resonantly scatters photons blueward of the Ly resonance (Gunn & Peterson, 1965). If the gas is infalling, Ly will also be scattered on the red side of the systemic redshift (e.g., Santos, 2004; Dijkstra et al., 2007; Laursen et al., 2011; Mason et al., 2018).
The optical depth provided by the IGM to the Ly profile is computed by combining these two effects as a function of velocity () with respect to line center:
where is the optical depth due to scattering from residual neutral hydrogen in the ionized bubble around the galaxy, and is the damping wing optical depth from the neutral IGM. To evaluate , we follow the approach described in Mason et al. (2018). In this model, the IGM is assumed to be infalling at the circular velocity () of the halo, and the halo mass () is estimated from the redshift and MUV of the galaxy using the M relations in Mason et al. (2015). The reader is directed to that paper for details, but in this approach, more luminous galaxies will have attenuation from infalling gas extending to larger velocities on the red side of line center. For simplicity, we assume at and at . To give a quantitative example, this infall model will cause a galaxy with M to have zero transmission of its Ly at velocities below km s-1. We will discuss the impact of infall on the evolution of Ly emitters at later in the section.
The IGM damping wing attenuates the Ly profile differently as a function of wavelength. To compute the damping wing optical depth () provided to Ly photons at observed wavelength , we follow the prescription described in Mason & Gronke (2020):
integrating the attenuation provided to a Ly photon emitted at wavelength from a galaxy at redshift . Here the emitted wavelength is the rest-frame equivalent of the observed wavelength in equation: . The integral accounts for the Ly opacity as the line emission is redshifted through the IGM. The number density of scattering H I particles in each differential redshift bin is given by the product of the IGM neutral fraction and the number density of hydrogen atoms, and , respectively. The Ly scattering cross section is given by , defined in the rest-frame of the scattering particles as a function of wavelength and H I kinetic temperature (see Dijkstra 2014 for the complete functional form). As Ly photons are redshifted, they move to larger wavelengths where the cross section is greatly reduced. In theory, the integral is computed from the redshift where the IGM becomes somewhat neutral () to the redshift of the galaxy. In practice, the damping wing optical depth depends negligibly on the value chosen for given that most of the opacity is from H I at redshifts closer to the galaxy redshift ( in our sample) where the scattering cross section is still significant.
We consider a galaxy situated at the center of an ionized bubble, where the distance to the neutral IGM is given by (i.e., the radius of the ionized bubble). For the ionized bubble sizes, we adopt the size distribution in Lu et al. (2024) given the source redshift , MUV, and the IGM neutral fraction . The ionized bubble size distributions in Lu et al. (2024) are derived from the semi-numerical cosmological simulation code 21cmfast (Mesinger et al., 2011; Sobacchi & Mesinger, 2014; Mesinger et al., 2016). We will adopt the source model where reionization is driven by numerous UV-faint galaxies (the “gradual” model), but our main conclusions are not very sensitive to this choice. We compute the damping wing optical depth in two steps, following approach in Mason & Gronke 2020. We first integrate within the ionized bubble from to , where is the boundary of the ionized bubble at distance from the source galaxy and hydrogen is assumed to be ionized within the bubble. We next integrate outside the ionized bubble from to . Because the damping wing optical depth is dominated by the distance to the first neutral patch of hydrogen (e.g., Mesinger & Furlanetto, 2008), we assume the IGM is neutral () outside the bubble.
Given the total optical depth to Ly, we model the IGM transmission of the Ly emission emerging from a galaxy with MUV at redshift as (e.g., Dijkstra et al., 2011; Mason et al., 2018):
is the normalized Ly velocity profile emerging from the ISM and CGM of the host galaxy prior to interaction with the neutral IGM outside the ionized bubble. The term computes the IGM transmission of the Ly velocity profile for a galaxy in an ionized bubble with radius , accounting for both infall and the damping wing. Then we integrate this transmission with the size distribution given the source redshift and MUV to calculate the average IGM transmission for a given . Here we adopt the composite Ly velocity profile of Ly emitting galaxies at in Tang et al. (2024b) as . We refer readers to Tang et al. (2024b) for details of the Ly emitter sample. The composite has a peak velocity offset km s-1, and a FWHM km s-1. Given the MUV range of our sample and the large velocity offsets at , the effects of infall are not predicted to contribute to the declining IGM transmission through reionization era.
We apply the IGM transmission models to the Ly EW distributions at (Tang et al., 2024b) to derive the forward model of Ly EW distribution . We then infer the IGM neutral fraction at using a similar Bayesian approach to that described in Mason et al. (2018). The posterior probability distribution of is derived from NIRSpec Ly EW measurements:
where is the prior of IGM neutral fraction (assuming a uniform prior ), and is the likelihood of the entire NIRSpec sample for a given . The likelihood function of each galaxy is computed as the same way as when deriving the average IGM transmission (see Section 4.1). Finally, we sample the posterior of the IGM neutral fraction using an MCMC approach with the emcee package. We compute the median value and the marginal credible interval of from the posterior probability distribution.

In Figure 9, we show the inferred IGM neutral hydrogen fractions as a function of redshift (red stars). At , we derive an IGM neutral fraction of . This is broadly consistent with inferences from prior to JWST, but the new results are now based on spectroscopically-confirmed samples with much-improved reliability in the flux measurements. One of the primary advantages of JWST is the ability to extend measurements to . We find that the downturn in Ly transmission suggests very large neutral fractions at () and (). These values are derived from the largest samples to date, but are consistent with recent measurements in the literature (e.g., Bruton et al., 2023; Curtis-Lake et al., 2023; Hsiao et al., 2023; Umeda et al., 2023; Nakane et al., 2024)
The extremely large neutral fraction that JWST is revealing at may seem surprising in light of the large density of UV photons that appears to be in place at (e.g., Adams et al., 2023; Bouwens et al., 2023; Harikane et al., 2023; Donnan et al., 2024; Finkelstein et al., 2024). It has been shown that these new JWST measurements may indicate that reionization had an earlier start than we previously expected, with a non-negligible fraction of the IGM ionized at . Gelli et al. (2024) demonstrate that in some extreme models, the neutral fractions may already be at . The neutral fractions depend on source assumptions, with the lowest neutral fractions expected in the Gelli et al. (2024) models where the Lyman continuum escape fraction is exponentially boosted during strong bursts of star formation. If these models are correct, we should find strong Ly emitters (EW Å) at as spectroscopic samples increase in size. At present, current results hint at a significant reduction in Ly transmission at , which is more consistent with the less extreme ionizing photon assumptions in Gelli et al. (2024). While uncertainties remain sizable, the sample statistics will be greatly improved in the future, allowing JWST Ly studies to provide one of our only windows on the earliest phases of reionization.
5 The Galaxy Environment associated with strong Ly emitters
In the previous sections, we have demonstrated that JWST is capable of identifying strong Ly emitters at redshifts () where the IGM is significantly neutral. We now consider whether these systems tend to probe overdense regions that may be capable of carving large ionized bubbles. We focus on Ly detections in the footprint of the two GOODS fields that have been targeted with the NIRCam grism by the First Reionization Epoch Spectroscopically Complete Observations (FRESCO; Oesch et al. 2023) team. Given the blind nature of grism follow-up, these areas will offer the highest level of completeness (at least for galaxies that have strong [O III] emission). FRESCO observed an area of arcmin2 in each of the GOODS fields using the F444W slitless grism, providing wavelength coverage that is ideal for confirming galaxies at via strong [O III] and emission. Here we make use of the [O III] emitter catalog released by the FRESCO team in Meyer et al. (2024).
In the area covered by FRESCO, there are currently four known Ly emitters with large EWs ( Å) and large Ly transmissions () at (JADES-1129, ; JADES-13041, ; JADES-13682, ; JADES-1899, ; Table 4). Their Ly escape fractions and EWs are among the top of the and Ly EW distributions in the JADES fields at (Section 3). We note that JADES-1129 and JADES-13041 are both at roughly the same redshift ( in GOODS-N. Our goal is to investigate whether strong spectroscopic overdensities are required to facilitate sightlines with such strong Ly emission (see also Witstok et al. 2024b, a).
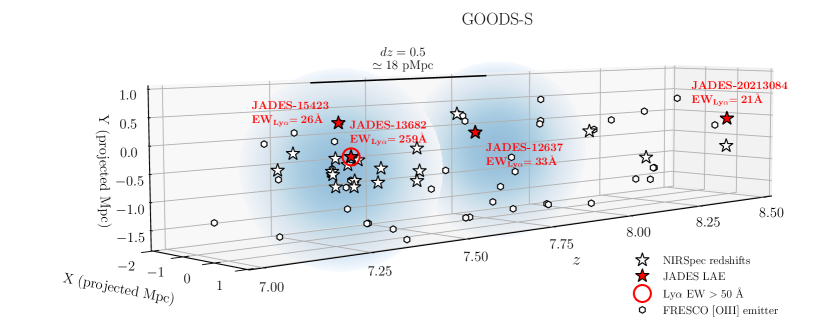

We show the spatial distribution of spectroscopically-confirmed galaxies around the four strong Ly emitters in Figure 10. To quantify overdensities, we first must measure the average number of [O III] emitters in each GOODS field. We apply a flux limit of erg s-1 cm-2 (corresponding to S/N ; Oesch et al. 2023) and measure the median number of [O III] emitters in a large number () redshift bins spanning (equivalent to line-of-sight distance of pMpc at ) with randomly-chosen central redshifts between and . For reference, the arcmin2 area in each GOODS field has an effective radius of arcmin (or pMpc at ), corresponding to a moderate-to-large bubble size at these redshifts (Lu et al., 2024). In each redshift bin, we find on average () [O III]-detected galaxies in GOODS-S (GOODS-N). We will show below that these numbers are consistent with expectations given the UV luminosity function (LF) and luminosity-dependent [O III]+H EW distribution at these redshifts.
If the four strong Ly emitters in the FRESCO fields trace overdensities, we should see significantly more than galaxies in the window centered on their redshifts. We find that there are and [O III] emitters in the narrow redshift windows around JADES-1129 + JADES-13041 ( in GOODS-N) and JADES-13682 ( in GOODS-S), respectively (see Figure 10). These numbers indicate significant overdensities ( for JADES-1129 + JADES-13041 and for JADES-13682) around both sources, as would be expected if these Ly emitters trace regions with an excess of ionizing photons capable of carving out a sizable bubble. On the other hand, we find that the redshift bin around the strong Ly emitter JADES-1899 contains no additional [O III] emitters over the full GOODS-N field999There are several spectroscopically confirmed galaxies within pMpc of JADES-1899 (see Figure 10) which are not detected in FRESCO as they are either out of the footprint or fainter than the grism flux limit, but they are not abundant enough to suggest an overdensity.. This suggests that this extremely strong Ly emitter (EW Å) is able to transmit a large fraction of its line luminosity despite being situated in a potentially underdense region. Below we consider each of these environments in more detail.
JADES-13682 (first reported in Saxena et al. 2023) is one of the strongest Ly emitters identified by JWST to-date (EW Å), and a variety of studies have now confirmed that it is associated with an overdense region at in GOODS-S (e.g., Endsley et al., 2023b; Helton et al., 2023; Witstok et al., 2024b). Our measurement of the spectroscopic overdensity () is broadly consistent with the findings in Witstok et al. (2024b). They report an overdensity factor of based on analysis in Helton et al. (2023). While slightly larger than our quoted overdensity, we note that they search over a considerably smaller area ( pkpc pkpc) and a much smaller redshift range (), while also using a different grism redshift catalog (Sun et al., in prep.). A photometric overdensity () has also been reported around JADES-13682 in Endsley et al. (2023b), leveraging medium bands sensitive to [O III]+H emission. Our results demonstrate that the spectroscopic overdensity around this intense Ly emitter spans a large physical volume (with effective radius pMpc) in GOODS-S at . If this region is mostly ionized, we should expect to see the distribution of Ly strengths enhanced (on average) throughout the overdensity. As is clear in Figure 10, one additional galaxy in this overdensity is found with Ly with EW Å (JADES-15423). Several other galaxies in this area show non-detections of Ly, but the EW limits are not yet stringent for many of them. Deeper spectroscopy will be required to robustly quantify the Ly EW distribution in this volume.
The spectroscopic overdensity in GOODS-N at is one of the strongest known on large ( pMpc) scales at . Two closely separated ( pkpc) strong Ly emitters, JADES-1129 (EW Å) and JADES-13041 (EW Å), are situated in this overdensity. They are actually the second and the third known Ly emitters at this redshift in GOODS-N. The first was reported over decade ago with a ground-based Ly EW Å at (Ono et al., 2012) and a separation of pMpc and pMpc from JADES-1129 and JADES-13041, respectively. The large-scale structure also hosts the massive dust-obscured AGN GNz7Q at (Fujimoto et al., 2022; Meyer et al., 2024). While some Ly non-detections exist in the overdensity, statistics are not yet adequate to assess whether transmission is enhanced throughout the structure. Further spectroscopy in this overdense region should reveal whether the overdensity has created a large ionized bubble.
The absence of a strong overdensity around JADES-1899 in GOODS-N is puzzling, as its Ly EW ( Å) is among the strongest known at these redshifts. Furthermore, its velocity profile reveals line emission near the systemic redshift (see Tang et al. 2024a; Witstok et al. 2024a), which is extremely rare at (e.g., Tang et al., 2024b) and likely indicates reduced IGM attenuation of the line profile. Witstok et al. (2024a) reported several galaxies that may be associated with the Ly emitter (both photometric and spectroscopic) but concluded that the overdensity was likely not strong enough to power a large ( pMpc) ionized region around the Ly emitter. Our results are consistent with this conclusion.
There are two possible explanations for presence of strong Ly without a significant population of surrounding [O III] emitters. First, it is conceivable that there is an overdensity present, but that it is not recovered by the [O III] selections in FRESCO. This may be possible if the galaxies are weak in [O III] emission. We will consider this in more detail below. The second possibility is related to the hard radiation field of JADES-1899, as revealed by its strong emission from high-ionization species (N IV], C IV; Tang et al. 2024a; Witstok et al. 2024a). If the radiation field is intense enough to boost the local ionization fraction of hydrogen in its surroundings, it may reduce the impact of infalling IGM on resonant scattering of Ly emission near line center101010While the infalling IGM is ionized, the residual neutral hydrogen fraction is large enough at to attenuate Ly emission extending to the red side of the systemic redshift (e.g., Santos, 2004; Dijkstra et al., 2007; Laursen et al., 2011; Mason et al., 2018). (see Mason & Gronke 2020). If the residual neutral hydrogen fraction in the infalling IGM is lower in the vicinity of JADES-1899, it would boost the transmission of the line at small velocities, helping to explain the velocity profile and the large EW. The damping wing from the neutral IGM outside the bubble would still attenuate the line emission, but the observed line profile could be explained with a smaller line-of-sight distance to the neutral IGM ( pMpc; Tang et al. 2024a), requiring a weaker overdensity that may be consistent with the FRESCO observations.
The discussion above motivates the potential of combining JWST measurements of galaxy environment with Ly statistical distributions. Here we investigate the extent to which observations targeting [O III] or H emission are able to recover overdensities, motivated by the absence of a strong overdensity in the field surrounding JADES-1899. We consider a volume at with a radius of pMpc ( arcmin) and calculate the average galaxy counts (as a function of MUV) expected in the volume according to the UV luminosity function (using the Schechter parameters in Bouwens et al. 2021). We then use measurements of the [O III]+H EW distribution to assign each galaxy an [O III] and H EW. We take into account measurements that indicate that the [O III] and H EWs become weaker among fainter galaxies (Endsley et al., 2023b), but we also consider cases where the rest-frame optical EW distributions are fixed with MUV. To convert from [O III]+H to [O III] on its own, we use a typical [O III] /H flux ratio () for reionization-era galaxies (e.g., Nakajima et al., 2023; Sanders et al., 2023; Shapley et al., 2023; Tang et al., 2023).
We find that our chosen volume (with radius pMpc) should host () galaxies to M (; Figure 11). Of course the lower luminosity galaxies are most abundant by number, but their [O III] and H lines are weaker (in line flux), making them more challenging to select. If we apply the same line flux limit we adopted for analysis of the FRESCO observations ( erg s-1 cm-2), we find that we would primarily recover the small number of galaxies that are UV luminous in the continuum (see Figure 11). In particular, if we adopt the MUV-dependent [O III] EW distributions (Endsley et al., 2023b), we would only identify galaxies above the FRESCO flux limit, with typical continuum magnitudes in the range M to (Figure 11). If we instead adopt a fixed [O III] EW distribution, we find the recovered sample size is the same.
Not surprisingly, moderate depth grism observations will be incomplete to the majority of fainter galaxies in the environment. This could be easily rectified with deeper NIRCam grism (or NIRSpec) observations of pointings found to be overdense. However, even at current -hour depth, it is unlikely that a strong overdensity would be missed. For example, if the region within pMpc of JADES-1899 was overdense, we should have detected galaxies with erg s-1 cm-2, well above the that was detected. To explain the observations, we would require that the majority of the galaxies surrounding JADES-1899 happen to either be UV-faint or [O III]-weak, both of which are not expected given our understanding of galaxy demographics. We thus conclude that the lack of strong overdensity around JADES-1899 is likely robust. This suggests that other factors (i.e., hard radiation field) may be permitting visibility of strong Ly. This underscores why Ly statistical distributions (and not individual galaxy measurements) are required to infer the presence of large ionized bubbles in sub-regions of targeted fields.

6 Summary
JWST has led to rapid progress in our characterization of Ly emission from galaxies in the reionization era. The datasets are allowing improved constraints on the statistical distributions of Ly emission, with the potential to greatly improve our knowledge of the early stages of reionization. Here we present and analyze JWST/NIRSpec Ly spectra of galaxies at . We summarize our main results below.
1. Using our reductions of publicly-available NIRSpec observations, we construct a sample of spectroscopically-confirmed galaxies at with Ly constraints. These data come from observations targeting four independent fields: Abell 2744, EGS, GOODS-North and South. We measure the Ly EWs and Ly escape fractions for these galaxies, forming a sample with size that is larger than early JWST investigations of Ly at (e.g., Jones et al., 2024; Nakane et al., 2024; Napolitano et al., 2024). Our sample contains galaxies at , providing the largest sample to-date.
2. The spectroscopic dataset includes galaxies with Ly detections, with significant overlap with earlier papers in these fields (Bunker et al., 2023a; Fujimoto et al., 2023a; Tang et al., 2023, 2024b, 2024a; Chen et al., 2024; Jones et al., 2024; Napolitano et al., 2024; Saxena et al., 2024; Witstok et al., 2024a). Three of these source have yet to be identified in the literature (JADES-13041, JADES-14373, JADES-15423). In particular, JADES-13041 shows extremely strong Ly emission (EW Å) in GOODS-N at a redshift () known to host two other Ly emitters, hinting at a potential ionized structure at this redshift in GOODS-N.
3. With improved statistics relative to previous studies, we quantify the distributions of Ly EWs and Ly escape fractions at . We find that the fraction of galaxies showing large Ly EW ( Å) or large Ly escape fraction () decreases by between and , suggesting a rapid reduction in the transmission of Ly photons.
4. If large ( pMpc) ionized bubbles are in place at , we should find significant field-to-field variations in Ly detections across the four survey fields. With our current dataset, we find that the Ly emitter (25 Å) fraction in the EGS at () is two times larger than that measured in the other three fields. This field shows an elevated Ly fraction, with little evidence for downward evolution from . While spectroscopic completeness in these fields is still limited, evidence continues to suggest that the EGS is likely to harbor large ionized regions at than the other three fields targeted with deep spectroscopy.
5. We consider implications for the IGM under the assumption that the declining Ly transmission is driven by the neutral IGM. The results are consistent with a picture where the IGM grows increasingly neutral from () to () and (). Whereas JWST has indicated a surprisingly large density of UV photons at , Ly observations have yet to reveal evidence that these galaxies made a significant impact on the ionization state of the IGM. Future observations are required to test this picture of early reionization with greater statistics.
6. In addition to identifying likely ionized bubbles, JWST is optimized for mapping the distribution of galaxies within these ionized regions. We use [O III] emitters identified from the FRESCO grism spectroscopic survey (Oesch et al., 2023; Meyer et al., 2024) to investigate the environments linked to the four strongest Ly emitters (EW Å) at in the FRESCO footprint. We find that three of the four strong Ly emitters do trace significant () overdensities (JADES-1129 + JADES-13041 at in GOODS-North and JADES-13682 at in GOODS-South. However we do not find a strong overdensity around JADES-1899 (, Ly EW Å), suggesting it is possible to achieve large Ly transmission in regions that are not overdense in [O III] emitters. We suggest the hard radiation field of JADES-1899 may boost the transmission, allowing a large Ly escape fraction with a smaller galaxy overdensity.
Acknowledgment
The authors thank Stéphane Charlot and Jacopo Chevallard for providing access to the BEAGLE tool used for SED fitting analysis. MT acknowledges funding from the JWST Arizona/Steward Postdoc in Early galaxies and Reionization (JASPER) Scholar contract at the University of Arizona. DPS acknowledges support from the National Science Foundation through the grant AST-2109066. CAM acknowledges support by the VILLUM FONDEN under grant 37459 and the Carlsberg Foundation under grant CF22-1322. The Cosmic Dawn Center (DAWN) is funded by the Danish National Research Foundation under grant DNRF140. RSE acknowledges generous support from the Peter and Patricia Gruber Foundation.
This work is based on observations made with the NASA/ESA/CSA James Webb Space Telescope. The data were obtained from the Mikulski Archive for Space Telescopes at the Space Telescope Science Institute, which is operated by the Association of Universities for Research in Astronomy, Inc., under NASA contract NAS 5-03127 for JWST. These observations are associated with program GTO 1180, 1181, 1210, and GO 3215 (JADES), ERS 1324 (GLASS), ERS 1345 and DDT 2750 (CEERS), as well as GO 2561 (UNCOVER). The authors acknowledge the JADES, GLASS, CEERS, and UNCOVER teams led by Daniel Eisenstein & Nora Lüetzgendorf, Tommaso Treu, Steven L. Finkelstein, and Ivo Labbé & Rachel Bezanson for developing their observing programs. This research is also based in part on observations made with the NASA/ESA Hubble Space Telescope obtained from the Space Telescope Science Institute, which is operated by the Association of Universities for Research in Astronomy, Inc., under NASA contract NAS 5–26555. Part of the data products presented herein were retrieved from the Dawn JWST Archive (DJA). DJA is an initiative of the Cosmic Dawn Center, which is funded by the Danish National Research Foundation under grant DNRF140. This work is based in part upon High Performance Computing (HPC) resources supported by the University of Arizona TRIF, UITS, and Research, Innovation, and Impact (RII) and maintained by the UArizona Research Technologies department.
Appendix A Table of Ly Properties of Galaxies
| ID | PID | R.A. | Decl. | MUV | EW | EW | Ref. | ||||
|---|---|---|---|---|---|---|---|---|---|---|---|
| (deg) | (deg) | (mag) | (km s-1) | (Å) | (Å) | ||||||
| CEERS-662 | 2750 | ||||||||||
| CEERS-663 | 2750 | (21) | |||||||||
| CEERS-80575 | 1345 | ||||||||||
| JADES-71983 | 1181 | ||||||||||
| JADES-42722 | 1181 | ||||||||||
| JADES-57330 | 1181 | ||||||||||
| JADES-78455 | 1181 | ||||||||||
| JADES-58561 | 1181 | ||||||||||
| JADES-59734 | 1181 | ||||||||||
| JADES-78891 | 1181 | ||||||||||
| UNCOVER-38248 | 2561 | ||||||||||
| UNCOVER-37504 | 2561 | ||||||||||
| CEERS-1160 | 1345 | (18) | |||||||||
| CEERS-496 | 1345 | ||||||||||
| CEERS-265 | 1345 | ||||||||||
| JADES-17158 | 1180 | ||||||||||
| UNCOVER-6829 | 2561 | ||||||||||
| CEERS-781 | 2750 | ||||||||||
| JADES-1223 | 1181 | ||||||||||
| CEERS-386 | 1345 | (18) | |||||||||
| JADES-5447 | 1210 | (10) | |||||||||
| JADES-13607 | 1180 | (25,31,34) | |||||||||
| JADES-13647 | 1180 | (25) | |||||||||
| JADES-128261 | 3215 | ||||||||||
| JADES-58930 | 1180 | (25) | |||||||||
| JADES-9903 | 1210 | (10,11,25,31,34) | |||||||||
| JADES-8239 | 1181 | ||||||||||
| JADES-14373 | 1181 | ||||||||||
| JADES-18533 | 1181 | ||||||||||
| CEERS-1414 | 1345 | (21,28) | |||||||||
| JADES-44124 | 1181 | ||||||||||
| UNCOVER-8936 | 2561 | ||||||||||
| CEERS-577 | 1345 | (18) | |||||||||
| JADES-39799 | 1181 | ||||||||||
| JADES-13286 | 1180 | ||||||||||
| JADES-38428 | 1181 | ||||||||||
| JADES-2113 | 1181 | ||||||||||
| UNCOVER-23619 | 2561 | (29) | |||||||||
| JADES-12359 | 1181 | ||||||||||
| JADES-89464 | 1181 | ||||||||||
| UNCOVER-43709 | 2561 | ||||||||||
| JADES-1948 | 1181 | ||||||||||
| CEERS-613 | 1345 | ||||||||||
| JADES-38420 | 1181 | (33) | |||||||||
| CEERS-81049 | 1345 | (18,21,28) | |||||||||
| JADES-28342 | 1181 | ||||||||||
| UNCOVER-2008 | 2561 | ||||||||||
| JADES-1076 | 1181 | ||||||||||
| CEERS-80925 | 1345 | (21,28) | |||||||||
| JADES-1066 | 1181 | ||||||||||
| UNCOVER-27335 | 2561 | ||||||||||
| JADES-926 | 1181 | ||||||||||
| JADES-896 | 1181 | ||||||||||
| JADES-10806 | 1181 | ||||||||||
| UNCOVER-36857 | 2561 | ||||||||||
| JADES-73977 | 1181 | ||||||||||
| UNCOVER-33673 | 2561 | ||||||||||
| JADES-13178 | 1180 | (25) | |||||||||
| CEERS-1064 | 1345 | (18) | |||||||||
| JADES-15362 | 1180 | (25,31,34) | |||||||||
| JADES-38681 | 1181 | ||||||||||
| JADES-18536 | 1181 | ||||||||||
| JADES-9104 | 1181 | ||||||||||
| JADES-17509 | 1180 | (29) | |||||||||
| JADES-137573 | 3215 | ||||||||||
| UNCOVER-11254 | 2561 | (29) | |||||||||
| UNCOVER-16155 | 2561 | ||||||||||
| UNCOVER-12899 | 2561 | ||||||||||
| JADES-8532 | 1180 | (33) | |||||||||
| JADES-1075 | 1181 | (33) | |||||||||
| CEERS-1143 | 1345 | (18,20,21) | |||||||||
| JADES-13609 | 1210 | (10,11) | |||||||||
| CEERS-481 | 1345 | ||||||||||
| CEERS-717 | 1345 | (18,20,21) | |||||||||
| CEERS-1142 | 1345 | (18,28) | |||||||||
| UNCOVER-9883 | 2561 | ||||||||||
| CEERS-716 | 1345 | (18) | |||||||||
| CEERS-445 | 2750 | (21) | |||||||||
| JADES-1254 | 1181 | ||||||||||
| CEERS-1102 | 1345 | (18,20) | |||||||||
| JADES-1893 | 1181 | ||||||||||
| JADES-7424 | 1181 | ||||||||||
| JADES-2316 | 1181 | ||||||||||
| CEERS-80244 | 1345 | ||||||||||
| JADES-5088 | 1181 | ||||||||||
| JADES-1166 | 1181 | ||||||||||
| CEERS-407 | 1345 | (18,20) | |||||||||
| CEERS-80401 | 1345 | ||||||||||
| UNCOVER-28876 | 2561 | (29) | |||||||||
| CEERS-542 | 1345 | (18,27) | |||||||||
| JADES-40307 | 1181 | ||||||||||
| JADES-1129 | 1181 | (33) | |||||||||
| CEERS-749 | 1345 | ||||||||||
| JADES-7675 | 1181 | ||||||||||
| JADES-13041 | 1181 | ||||||||||
| JADES-1936 | 1181 | ||||||||||
| CEERS-44 | 1345 | (16,18,20,27,28) | |||||||||
| CEERS-534 | 1345 | (18,27) | |||||||||
| UNCOVER-60141 | 2561 | ||||||||||
| JADES-3982 | 1181 | ||||||||||
| JADES-9442 | 1180 | (25) | |||||||||
| JADES-66336 | 1181 | ||||||||||
| JADES-24819 | 1181 | ||||||||||
| JADES-4530 | 1181 | ||||||||||
| JADES-67006 | 1181 | ||||||||||
| CEERS-499 | 1345 | (20) | |||||||||
| CEERS-829 | 1345 | (16,18,27) | |||||||||
| CEERS-80374 | 1345 | (18,21,27,28) | |||||||||
| CEERS-498 | 1345 | (18,20,27,28) | |||||||||
| CEERS-439 | 1345 | (16,18,27,28) | |||||||||
| CEERS-1038 | 1345 | (18,20) | |||||||||
| JADES-13905 | 1210 | (10,11) | |||||||||
| JADES-11547 | 1180 | (25) | |||||||||
| JADES-9942 | 1180 | (25) | |||||||||
| JADES-9886 | 1180 | (25) | |||||||||
| JADES-27058 | 1181 | ||||||||||
| JADES-15423 | 1180 | ||||||||||
| JADES-13729 | 1180 | ||||||||||
| JADES-5115 | 1210 | (10) | |||||||||
| JADES-13173 | 1180 | ||||||||||
| JADES-2958 | 1180 | ||||||||||
| JADES-13682 | 1210 | (10,11,19,25,34) | |||||||||
| JADES-9425 | 1180 | ||||||||||
| GLASS-10021 | 1324 | (18) | |||||||||
| UNCOVER-8669 | 2561 | ||||||||||
| JADES-9315 | 1210 | (10) | |||||||||
| JADES-11541 | 1180 | ||||||||||
| JADES-13552 | 1180 | ||||||||||
| JADES-60331 | 1181 | ||||||||||
| CEERS-52 | 1345 | ||||||||||
| CEERS-1163 | 1345 | (16,18,20) | |||||||||
| CEERS-38 | 1345 | ||||||||||
| CEERS-698 | 1345 | (3,4,18,20,26,30) | |||||||||
| JADES-30083556 | 3215 | ||||||||||
| CEERS-80432 | 1345 | (18,21,27,28) | |||||||||
| CEERS-80372 | 1345 | (18,28) | |||||||||
| CEERS-434 | 2750 | (29) | |||||||||
| CEERS-80239 | 1345 | (18,21) | |||||||||
| CEERS-80445 | 1345 | (18,27,28) | |||||||||
| CEERS-689 | 1345 | (18,20,26) | |||||||||
| CEERS-449 | 2750 | ||||||||||
| JADES-44323 | 1180 | ||||||||||
| JADES-17038 | 1180 | (25) | |||||||||
| UNCOVER-38059 | 2561 | ||||||||||
| JADES-38684 | 1181 | ||||||||||
| CEERS-80025 | 1345 | (7) | |||||||||
| JADES-12637 | 1180 | (25,31,34) | |||||||||
| UNCOVER-18924 | 2561 | ||||||||||
| CEERS-686 | 1345 | (18,20,26,28) | |||||||||
| CEERS-20 | 1345 | (14) | |||||||||
| CEERS-1023 | 1345 | (16,18,20) | |||||||||
| CEERS-1027 | 1345 | (16,18,20,30) | |||||||||
| GLASS-100001b | 1324 | (16,17,18,21) | |||||||||
| GLASS-100003 | 1324 | (17,18) | |||||||||
| GLASS-100005 | 1324 | (17,18) | |||||||||
| GLASS-10000b | 1324 | (17,18,21) | |||||||||
| UNCOVER-23604 | 2561 | (21) | |||||||||
| CEERS-355 | 2750 | (8) | |||||||||
| JADES-5173 | 1210 | (10,11,25,31,34) | |||||||||
| CEERS-4 | 1345 | (14,18,20) | |||||||||
| CEERS-3 | 1345 | (14,18,20,27) | |||||||||
| CEERS-1149 | 1345 | (16,18,20,30) | |||||||||
| JADES-20198852 | 3215 | ||||||||||
| JADES-1899 | 1181 | (33,35) | |||||||||
| JADES-45131 | 1181 | ||||||||||
| JADES-45170 | 1181 | ||||||||||
| JADES-5776 | 1181 | ||||||||||
| JADES-6139 | 1210 | (10,11) | |||||||||
| JADES-20213084 | 3215 | (32,35) | |||||||||
| UNCOVER-10646 | 2561 | (15) | |||||||||
| JADES-74111 | 1181 | ||||||||||
| CEERS-1029 | 1345 | (5,16,18,20,27) | |||||||||
| CEERS-80083 | 1345 | (7,18) | |||||||||
| JADES-54165 | 1181 | (29) | |||||||||
| CEERS-1019 | 1345 | (1,6,16,18,20,30) | |||||||||
| CEERS-1025 | 1345 | (18,20) | |||||||||
| JADES-20100293 | 3215 | ||||||||||
| CEERS-28 | 2750 | (8,24) | |||||||||
| CEERS-2 | 1345 | (14) | |||||||||
| JADES-20111790 | 3215 | ||||||||||
| CEERS-7 | 1345 | (14,18) | |||||||||
| CEERS-23 | 1345 | (14,20) | |||||||||
| JADES-20110306 | 3215 | ||||||||||
| JADES-13643 | 1181 | ||||||||||
| CEERS-24 | 1345 | (14,20) | |||||||||
| JADES-619 | 1181 | ||||||||||
| JADES-17858 | 1181 | ||||||||||
| JADES-19715 | 1181 | ||||||||||
| UNCOVER-3686 | 2561 | (15) | |||||||||
| JADES-3990 | 1181 | ||||||||||
| JADES-265801 | 3215 | (10,11,22) | |||||||||
| UNCOVER-22223 | 2561 | (15) | |||||||||
| JADES-59720 | 1181 | ||||||||||
| JADES-80088 | 1181 | ||||||||||
| JADES-55757 | 1181 | ||||||||||
| CEERS-80026 | 1345 | (7) | |||||||||
| UNCOVER-13151 | 2561 | (15) | |||||||||
| JADES-11508 | 1181 | ||||||||||
| UNCOVER-26185 | 2561 | (15) | |||||||||
| CEERS-64 | 2750 | (8) | |||||||||
| CEERS-80041 | 1345 | (7) | |||||||||
| UNCOVER-37126 | 2561 | (15) | |||||||||
| JADES-14177 | 1210 | (10,12) | |||||||||
| JADES-3991 | 1181 | (2,9) | |||||||||
| CEERS-10 | 2750 | (8) | |||||||||
| JADES-14220 | 1210 | (10,12,23) | |||||||||
| CEERS-1 | 2750 | (8,24) | |||||||||
| UNCOVER-38766 | 2561 | (15) | |||||||||
| JADES-20096216 | 3215 | (10,12,13) | |||||||||
| JADES-20128771 | 3215 | (10,12,23) |
Note. — We list Ly EWs (EWLyα) and Ly escape fractions () derived from both the NIRSpec grating and prism spectra. Ly velocity offsets () are derived from grating spectra. PID is the JWST program ID. Absolute UV magnitudes of galaxies in GLASS or UNCOVER are corrected for magnifications using models in Furtak et al. (2023b). Spectroscopic redshifts () listed are the systemic redshifts measured from grating spectra, or from prism spectra for galaxies without grating spectra. Ly escape fractions are computed assuming case B recombination. a: Redshifts derived from Ly break; b: GLASS-100001 and GLASS-10000 have been observed in both GLASS (with high resolution grating spectra) and UNCOVER (with low resolution prism spectra) programs, their NIRSpec IDs in the UNCOVER dataset are UNCOVER-60157 and UNCOVER-24531, respectively.
Reference: (1) Zitrin et al. (2015), (2) Oesch et al. (2016), (3) Roberts-Borsani et al. (2016), (4) Stark et al. (2017), (5) Larson et al. (2022), (6) Larson et al. (2023), (7) Arrabal Haro et al. (2023a), (8) Arrabal Haro et al. (2023b), (9) Bunker et al. (2023a), (10) Bunker et al. (2023b), (11) Cameron et al. (2023), (12) Curtis-Lake et al. (2023), (13) D’Eugenio et al. (2023), (14) Fujimoto et al. (2023b), (15) Fujimoto et al. (2023a), (16) Heintz et al. (2023), (17) Morishita et al. (2023), (18) Nakajima et al. (2023), (19) Saxena et al. (2023), (20) Tang et al. (2023), (21) Chen et al. (2024), (22) Curti et al. (2024), (23) Hainline et al. (2024), (24) Heintz et al. (2024a), (25) Jones et al. (2024), (26) Jung et al. (2024), (27) Nakane et al. (2024), (28) Napolitano et al. (2024), (29) Roberts-Borsani et al. (2024), (30) Sanders et al. (2024), (31) Saxena et al. (2024), (32) Tang et al. (2024b), (33) Tang et al. (2024a), (34) Witstok et al. (2024b), (35) Witstok et al. (2024a).
References
- Abell et al. (1989) Abell, G. O., Corwin, Harold G., J., & Olowin, R. P. 1989, ApJS, 70, 1, doi: 10.1086/191333
- Adams et al. (2023) Adams, N. J., Conselice, C. J., Ferreira, L., et al. 2023, MNRAS, 518, 4755, doi: 10.1093/mnras/stac3347
- Arrabal Haro et al. (2018) Arrabal Haro, P., Rodríguez Espinosa, J. M., Muñoz-Tuñón, C., et al. 2018, MNRAS, 478, 3740, doi: 10.1093/mnras/sty1106
- Arrabal Haro et al. (2023a) Arrabal Haro, P., Dickinson, M., Finkelstein, S. L., et al. 2023a, Nature, 622, 707, doi: 10.1038/s41586-023-06521-7
- Arrabal Haro et al. (2023b) —. 2023b, ApJ, 951, L22, doi: 10.3847/2041-8213/acdd54
- Astropy Collaboration et al. (2013) Astropy Collaboration, Robitaille, T. P., Tollerud, E. J., et al. 2013, A&A, 558, A33, doi: 10.1051/0004-6361/201322068
- Bañados et al. (2018) Bañados, E., Venemans, B. P., Mazzucchelli, C., et al. 2018, Nature, 553, 473, doi: 10.1038/nature25180
- Bacon et al. (2010) Bacon, R., Accardo, M., Adjali, L., et al. 2010, in Society of Photo-Optical Instrumentation Engineers (SPIE) Conference Series, Vol. 7735, Ground-based and Airborne Instrumentation for Astronomy III, ed. I. S. McLean, S. K. Ramsay, & H. Takami, 773508, doi: 10.1117/12.856027
- Barbary (2016) Barbary, K. 2016, The Journal of Open Source Software, 1, 58, doi: 10.21105/joss.00058
- Becker et al. (2021) Becker, G. D., D’Aloisio, A., Christenson, H. M., et al. 2021, MNRAS, 508, 1853, doi: 10.1093/mnras/stab2696
- Becker et al. (2019) Becker, G. D., Pettini, M., Rafelski, M., et al. 2019, ApJ, 883, 163, doi: 10.3847/1538-4357/ab3eb5
- Bertin & Arnouts (1996) Bertin, E., & Arnouts, S. 1996, A&AS, 117, 393, doi: 10.1051/aas:1996164
- Bezanson et al. (2022) Bezanson, R., Labbe, I., Whitaker, K. E., et al. 2022, arXiv e-prints, arXiv:2212.04026, doi: 10.48550/arXiv.2212.04026
- Böker et al. (2023) Böker, T., Beck, T. L., Birkmann, S. M., et al. 2023, PASP, 135, 038001, doi: 10.1088/1538-3873/acb846
- Bolan et al. (2022) Bolan, P., Lemaux, B. C., Mason, C., et al. 2022, MNRAS, 517, 3263, doi: 10.1093/mnras/stac1963
- Bosman et al. (2022) Bosman, S. E. I., Davies, F. B., Becker, G. D., et al. 2022, MNRAS, 514, 55, doi: 10.1093/mnras/stac1046
- Bouwens et al. (2010) Bouwens, R. J., Illingworth, G. D., Oesch, P. A., et al. 2010, ApJ, 709, L133, doi: 10.1088/2041-8205/709/2/L133
- Bouwens et al. (2011) —. 2011, ApJ, 737, 90, doi: 10.1088/0004-637X/737/2/90
- Bouwens et al. (2014) —. 2014, ApJ, 793, 115, doi: 10.1088/0004-637X/793/2/115
- Bouwens et al. (2021) Bouwens, R. J., Oesch, P. A., Stefanon, M., et al. 2021, AJ, 162, 47, doi: 10.3847/1538-3881/abf83e
- Bouwens et al. (2023) Bouwens, R. J., Stefanon, M., Brammer, G., et al. 2023, MNRAS, 523, 1036, doi: 10.1093/mnras/stad1145
- Boyett et al. (2024) Boyett, K., Bunker, A. J., Chevallard, J., et al. 2024, arXiv e-prints, arXiv:2404.07497, doi: 10.48550/arXiv.2404.07497
- Boyett et al. (2022) Boyett, K. N. K., Stark, D. P., Bunker, A. J., Tang, M., & Maseda, M. V. 2022, MNRAS, 513, 4451, doi: 10.1093/mnras/stac1109
- Brammer (2023) Brammer, G. 2023, grizli, 1.9.11, Zenodo, doi: 10.5281/zenodo.1146904
- Bruton et al. (2023) Bruton, S., Lin, Y.-H., Scarlata, C., & Hayes, M. J. 2023, ApJ, 949, L40, doi: 10.3847/2041-8213/acd5d0
- Bruzual & Charlot (2003) Bruzual, G., & Charlot, S. 2003, MNRAS, 344, 1000, doi: 10.1046/j.1365-8711.2003.06897.x
- Bunker et al. (2010) Bunker, A. J., Wilkins, S., Ellis, R. S., et al. 2010, MNRAS, 409, 855, doi: 10.1111/j.1365-2966.2010.17350.x
- Bunker et al. (2023a) Bunker, A. J., Saxena, A., Cameron, A. J., et al. 2023a, A&A, 677, A88, doi: 10.1051/0004-6361/202346159
- Bunker et al. (2023b) Bunker, A. J., Cameron, A. J., Curtis-Lake, E., et al. 2023b, arXiv e-prints, arXiv:2306.02467, doi: 10.48550/arXiv.2306.02467
- Bushouse et al. (2024) Bushouse, H., Eisenhamer, J., Dencheva, N., et al. 2024, JWST Calibration Pipeline, 1.14.0, Zenodo, doi: 10.5281/zenodo.6984365
- Caffau et al. (2011) Caffau, E., Ludwig, H. G., Steffen, M., Freytag, B., & Bonifacio, P. 2011, Sol. Phys., 268, 255, doi: 10.1007/s11207-010-9541-4
- Calzetti et al. (1994) Calzetti, D., Kinney, A. L., & Storchi-Bergmann, T. 1994, ApJ, 429, 582, doi: 10.1086/174346
- Cameron et al. (2024) Cameron, A. J., Katz, H., Witten, C., et al. 2024, MNRAS, doi: 10.1093/mnras/stae1547
- Cameron et al. (2023) Cameron, A. J., Saxena, A., Bunker, A. J., et al. 2023, A&A, 677, A115, doi: 10.1051/0004-6361/202346107
- Cardelli et al. (1989) Cardelli, J. A., Clayton, G. C., & Mathis, J. S. 1989, ApJ, 345, 245, doi: 10.1086/167900
- Carniani et al. (2024) Carniani, S., Hainline, K., D’Eugenio, F., et al. 2024, arXiv e-prints, arXiv:2405.18485, doi: 10.48550/arXiv.2405.18485
- Caruana et al. (2014) Caruana, J., Bunker, A. J., Wilkins, S. M., et al. 2014, MNRAS, 443, 2831, doi: 10.1093/mnras/stu1341
- Cassata et al. (2015) Cassata, P., Tasca, L. A. M., Le Fèvre, O., et al. 2015, A&A, 573, A24, doi: 10.1051/0004-6361/201423824
- Castellano et al. (2024) Castellano, M., Napolitano, L., Fontana, A., et al. 2024, arXiv e-prints, arXiv:2403.10238, doi: 10.48550/arXiv.2403.10238
- Chabrier (2003) Chabrier, G. 2003, PASP, 115, 763, doi: 10.1086/376392
- Chen et al. (2024) Chen, Z., Stark, D. P., Mason, C., et al. 2024, MNRAS, 528, 7052, doi: 10.1093/mnras/stae455
- Chevallard & Charlot (2016) Chevallard, J., & Charlot, S. 2016, MNRAS, 462, 1415, doi: 10.1093/mnras/stw1756
- Chevallard et al. (2018) Chevallard, J., Charlot, S., Senchyna, P., et al. 2018, MNRAS, 479, 3264, doi: 10.1093/mnras/sty1461
- Christensen et al. (2023) Christensen, L., Jakobsen, P., Willott, C., et al. 2023, A&A, 680, A82, doi: 10.1051/0004-6361/202347943
- Cooper et al. (2019) Cooper, T. J., Simcoe, R. A., Cooksey, K. L., et al. 2019, ApJ, 882, 77, doi: 10.3847/1538-4357/ab3402
- Cullen et al. (2023) Cullen, F., McLure, R. J., McLeod, D. J., et al. 2023, MNRAS, 520, 14, doi: 10.1093/mnras/stad073
- Curti et al. (2024) Curti, M., Witstok, J., Jakobsen, P., et al. 2024, arXiv e-prints, arXiv:2407.02575, doi: 10.48550/arXiv.2407.02575
- Curtis-Lake et al. (2023) Curtis-Lake, E., Carniani, S., Cameron, A., et al. 2023, Nature Astronomy, 7, 622, doi: 10.1038/s41550-023-01918-w
- Davies et al. (2018) Davies, F. B., Hennawi, J. F., Bañados, E., et al. 2018, ApJ, 864, 142, doi: 10.3847/1538-4357/aad6dc
- Davis et al. (2007) Davis, M., Guhathakurta, P., Konidaris, N. P., et al. 2007, ApJ, 660, L1, doi: 10.1086/517931
- de La Vieuville et al. (2020) de La Vieuville, G., Pelló, R., Richard, J., et al. 2020, A&A, 644, A39, doi: 10.1051/0004-6361/202037651
- D’Eugenio et al. (2023) D’Eugenio, F., Maiolino, R., Carniani, S., et al. 2023, arXiv e-prints, arXiv:2311.09908, doi: 10.48550/arXiv.2311.09908
- D’Eugenio et al. (2024) D’Eugenio, F., Cameron, A. J., Scholtz, J., et al. 2024, arXiv e-prints, arXiv:2404.06531, doi: 10.48550/arXiv.2404.06531
- Dijkstra (2014) Dijkstra, M. 2014, PASA, 31, e040, doi: 10.1017/pasa.2014.33
- Dijkstra et al. (2007) Dijkstra, M., Lidz, A., & Wyithe, J. S. B. 2007, MNRAS, 377, 1175, doi: 10.1111/j.1365-2966.2007.11666.x
- Dijkstra et al. (2011) Dijkstra, M., Mesinger, A., & Wyithe, J. S. B. 2011, MNRAS, 414, 2139, doi: 10.1111/j.1365-2966.2011.18530.x
- Donnan et al. (2024) Donnan, C. T., McLure, R. J., Dunlop, J. S., et al. 2024, arXiv e-prints, arXiv:2403.03171, doi: 10.48550/arXiv.2403.03171
- Du et al. (2018) Du, X., Shapley, A. E., Reddy, N. A., et al. 2018, ApJ, 860, 75, doi: 10.3847/1538-4357/aabfcf
- Eisenstein et al. (2023a) Eisenstein, D. J., Willott, C., Alberts, S., et al. 2023a, arXiv e-prints, arXiv:2306.02465, doi: 10.48550/arXiv.2306.02465
- Eisenstein et al. (2023b) Eisenstein, D. J., Johnson, B. D., Robertson, B., et al. 2023b, arXiv e-prints, arXiv:2310.12340, doi: 10.48550/arXiv.2310.12340
- Endsley et al. (2021) Endsley, R., Stark, D. P., Charlot, S., et al. 2021, MNRAS, 502, 6044, doi: 10.1093/mnras/stab432
- Endsley et al. (2023a) Endsley, R., Stark, D. P., Whitler, L., et al. 2023a, MNRAS, 524, 2312, doi: 10.1093/mnras/stad1919
- Endsley et al. (2023b) —. 2023b, arXiv e-prints, arXiv:2306.05295, doi: 10.48550/arXiv.2306.05295
- Faber et al. (2003) Faber, S. M., Phillips, A. C., Kibrick, R. I., et al. 2003, in Society of Photo-Optical Instrumentation Engineers (SPIE) Conference Series, Vol. 4841, Instrument Design and Performance for Optical/Infrared Ground-based Telescopes, ed. M. Iye & A. F. M. Moorwood, 1657–1669, doi: 10.1117/12.460346
- Ferland et al. (2013) Ferland, G. J., Porter, R. L., van Hoof, P. A. M., et al. 2013, Rev. Mexicana Astron. Astrofis., 49, 137, doi: 10.48550/arXiv.1302.4485
- Ferruit et al. (2022) Ferruit, P., Jakobsen, P., Giardino, G., et al. 2022, A&A, 661, A81, doi: 10.1051/0004-6361/202142673
- Finkelstein et al. (2012) Finkelstein, S. L., Papovich, C., Salmon, B., et al. 2012, ApJ, 756, 164, doi: 10.1088/0004-637X/756/2/164
- Finkelstein et al. (2024) Finkelstein, S. L., Leung, G. C. K., Bagley, M. B., et al. 2024, ApJ, 969, L2, doi: 10.3847/2041-8213/ad4495
- Flower et al. (1979) Flower, D. R., Nussbaumer, H., & Schild, H. 1979, A&A, 72, L1
- Fontana et al. (2010) Fontana, A., Vanzella, E., Pentericci, L., et al. 2010, ApJ, 725, L205, doi: 10.1088/2041-8205/725/2/L205
- Foreman-Mackey et al. (2013) Foreman-Mackey, D., Hogg, D. W., Lang, D., & Goodman, J. 2013, PASP, 125, 306, doi: 10.1086/670067
- Fujimoto et al. (2022) Fujimoto, S., Brammer, G. B., Watson, D., et al. 2022, Nature, 604, 261, doi: 10.1038/s41586-022-04454-1
- Fujimoto et al. (2023a) Fujimoto, S., Wang, B., Weaver, J., et al. 2023a, arXiv e-prints, arXiv:2308.11609, doi: 10.48550/arXiv.2308.11609
- Fujimoto et al. (2023b) Fujimoto, S., Arrabal Haro, P., Dickinson, M., et al. 2023b, ApJ, 949, L25, doi: 10.3847/2041-8213/acd2d9
- Furtak et al. (2023a) Furtak, L. J., Zitrin, A., Plat, A., et al. 2023a, ApJ, 952, 142, doi: 10.3847/1538-4357/acdc9d
- Furtak et al. (2023b) Furtak, L. J., Zitrin, A., Weaver, J. R., et al. 2023b, MNRAS, 523, 4568, doi: 10.1093/mnras/stad1627
- Gardner et al. (2023) Gardner, J. P., Mather, J. C., Abbott, R., et al. 2023, PASP, 135, 068001, doi: 10.1088/1538-3873/acd1b5
- Gehrels (1986) Gehrels, N. 1986, ApJ, 303, 336, doi: 10.1086/164079
- Gelli et al. (2024) Gelli, V., Mason, C., & Hayward, C. C. 2024, arXiv e-prints, arXiv:2405.13108, doi: 10.48550/arXiv.2405.13108
- Giavalisco et al. (2004) Giavalisco, M., Ferguson, H. C., Koekemoer, A. M., et al. 2004, ApJ, 600, L93, doi: 10.1086/379232
- Goto et al. (2021) Goto, H., Shimasaku, K., Yamanaka, S., et al. 2021, ApJ, 923, 229, doi: 10.3847/1538-4357/ac308b
- Greig et al. (2022) Greig, B., Mesinger, A., Davies, F. B., et al. 2022, MNRAS, 512, 5390, doi: 10.1093/mnras/stac825
- Grogin et al. (2011) Grogin, N. A., Kocevski, D. D., Faber, S. M., et al. 2011, ApJS, 197, 35, doi: 10.1088/0067-0049/197/2/35
- Gunn & Peterson (1965) Gunn, J. E., & Peterson, B. A. 1965, ApJ, 142, 1633, doi: 10.1086/148444
- Guo et al. (2013) Guo, Y., Ferguson, H. C., Giavalisco, M., et al. 2013, ApJS, 207, 24, doi: 10.1088/0067-0049/207/2/24
- Gutkin et al. (2016) Gutkin, J., Charlot, S., & Bruzual, G. 2016, MNRAS, 462, 1757, doi: 10.1093/mnras/stw1716
- Hainline et al. (2024) Hainline, K. N., D’Eugenio, F., Jakobsen, P., et al. 2024, arXiv e-prints, arXiv:2404.04325, doi: 10.48550/arXiv.2404.04325
- Harikane et al. (2023) Harikane, Y., Ouchi, M., Oguri, M., et al. 2023, ApJS, 265, 5, doi: 10.3847/1538-4365/acaaa9
- Harris et al. (2020) Harris, C. R., Millman, K. J., van der Walt, S. J., et al. 2020, Nature, 585, 357, doi: 10.1038/s41586-020-2649-2
- Hayes (2015) Hayes, M. 2015, PASA, 32, e027, doi: 10.1017/pasa.2015.25
- Heintz et al. (2023) Heintz, K. E., Brammer, G. B., Giménez-Arteaga, C., et al. 2023, Nature Astronomy, 7, 1517, doi: 10.1038/s41550-023-02078-7
- Heintz et al. (2024a) Heintz, K. E., Watson, D., Brammer, G., et al. 2024a, Science, 384, 890, doi: 10.1126/science.adj0343
- Heintz et al. (2024b) Heintz, K. E., Bennett, J. S., Oesch, P. A., et al. 2024b, arXiv e-prints, arXiv:2407.06287, doi: 10.48550/arXiv.2407.06287
- Helton et al. (2023) Helton, J. M., Sun, F., Woodrum, C., et al. 2023, arXiv e-prints, arXiv:2311.04270, doi: 10.48550/arXiv.2311.04270
- Henry et al. (2015) Henry, A., Scarlata, C., Martin, C. L., & Erb, D. 2015, ApJ, 809, 19, doi: 10.1088/0004-637X/809/1/19
- Hoag et al. (2019) Hoag, A., Bradač, M., Huang, K., et al. 2019, ApJ, 878, 12, doi: 10.3847/1538-4357/ab1de7
- Hsiao et al. (2023) Hsiao, T. Y.-Y., Abdurro’uf, Coe, D., et al. 2023, arXiv e-prints, arXiv:2305.03042, doi: 10.48550/arXiv.2305.03042
- Hunter (2007) Hunter, J. D. 2007, Computing in Science and Engineering, 9, 90, doi: 10.1109/MCSE.2007.55
- Inoue et al. (2014) Inoue, A. K., Shimizu, I., Iwata, I., & Tanaka, M. 2014, MNRAS, 442, 1805, doi: 10.1093/mnras/stu936
- Inoue et al. (2018) Inoue, A. K., Hasegawa, K., Ishiyama, T., et al. 2018, PASJ, 70, 55, doi: 10.1093/pasj/psy048
- Jakobsen et al. (2022) Jakobsen, P., Ferruit, P., Alves de Oliveira, C., et al. 2022, A&A, 661, A80, doi: 10.1051/0004-6361/202142663
- Jin et al. (2023) Jin, X., Yang, J., Fan, X., et al. 2023, ApJ, 942, 59, doi: 10.3847/1538-4357/aca678
- Jones et al. (2024) Jones, G. C., Bunker, A. J., Saxena, A., et al. 2024, A&A, 683, A238, doi: 10.1051/0004-6361/202347099
- Jones et al. (2012) Jones, T., Stark, D. P., & Ellis, R. S. 2012, ApJ, 751, 51, doi: 10.1088/0004-637X/751/1/51
- Jung et al. (2020) Jung, I., Finkelstein, S. L., Dickinson, M., et al. 2020, ApJ, 904, 144, doi: 10.3847/1538-4357/abbd44
- Jung et al. (2022) Jung, I., Finkelstein, S. L., Larson, R. L., et al. 2022, arXiv e-prints, arXiv:2212.09850, doi: 10.48550/arXiv.2212.09850
- Jung et al. (2024) Jung, I., Finkelstein, S. L., Arrabal Haro, P., et al. 2024, ApJ, 967, 73, doi: 10.3847/1538-4357/ad3913
- Keating et al. (2024) Keating, L. C., Bolton, J. S., Cullen, F., et al. 2024, MNRAS, 532, 1646, doi: 10.1093/mnras/stae1530
- Kocevski et al. (2024) Kocevski, D. D., Finkelstein, S. L., Barro, G., et al. 2024, arXiv e-prints, arXiv:2404.03576, doi: 10.48550/arXiv.2404.03576
- Koekemoer et al. (2011) Koekemoer, A. M., Faber, S. M., Ferguson, H. C., et al. 2011, ApJS, 197, 36, doi: 10.1088/0067-0049/197/2/36
- Konno et al. (2014) Konno, A., Ouchi, M., Ono, Y., et al. 2014, ApJ, 797, 16, doi: 10.1088/0004-637X/797/1/16
- Konno et al. (2018) Konno, A., Ouchi, M., Shibuya, T., et al. 2018, PASJ, 70, S16, doi: 10.1093/pasj/psx131
- Kron (1980) Kron, R. G. 1980, ApJS, 43, 305, doi: 10.1086/190669
- Kusakabe et al. (2020) Kusakabe, H., Blaizot, J., Garel, T., et al. 2020, A&A, 638, A12, doi: 10.1051/0004-6361/201937340
- Larson et al. (2022) Larson, R. L., Finkelstein, S. L., Hutchison, T. A., et al. 2022, ApJ, 930, 104, doi: 10.3847/1538-4357/ac5dbd
- Larson et al. (2023) Larson, R. L., Finkelstein, S. L., Kocevski, D. D., et al. 2023, ApJ, 953, L29, doi: 10.3847/2041-8213/ace619
- Laursen et al. (2011) Laursen, P., Sommer-Larsen, J., & Razoumov, A. O. 2011, ApJ, 728, 52, doi: 10.1088/0004-637X/728/1/52
- Leonova et al. (2022) Leonova, E., Oesch, P. A., Qin, Y., et al. 2022, MNRAS, 515, 5790, doi: 10.1093/mnras/stac1908
- Lu et al. (2024) Lu, T.-Y., Mason, C. A., Hutter, A., et al. 2024, MNRAS, 528, 4872, doi: 10.1093/mnras/stae266
- Malhotra & Rhoads (2004) Malhotra, S., & Rhoads, J. E. 2004, ApJ, 617, L5, doi: 10.1086/427182
- Mason & Gronke (2020) Mason, C. A., & Gronke, M. 2020, MNRAS, 499, 1395, doi: 10.1093/mnras/staa2910
- Mason et al. (2019a) Mason, C. A., Naidu, R. P., Tacchella, S., & Leja, J. 2019a, MNRAS, 489, 2669, doi: 10.1093/mnras/stz2291
- Mason et al. (2015) Mason, C. A., Trenti, M., & Treu, T. 2015, ApJ, 813, 21, doi: 10.1088/0004-637X/813/1/21
- Mason et al. (2018) Mason, C. A., Treu, T., Dijkstra, M., et al. 2018, ApJ, 856, 2, doi: 10.3847/1538-4357/aab0a7
- Mason et al. (2019b) Mason, C. A., Fontana, A., Treu, T., et al. 2019b, MNRAS, 485, 3947, doi: 10.1093/mnras/stz632
- McClymont et al. (2024) McClymont, W., Tacchella, S., D’Eugenio, F., et al. 2024, arXiv e-prints, arXiv:2405.15859, doi: 10.48550/arXiv.2405.15859
- McGreer et al. (2015) McGreer, I. D., Mesinger, A., & D’Odorico, V. 2015, MNRAS, 447, 499, doi: 10.1093/mnras/stu2449
- McLure et al. (2010) McLure, R. J., Dunlop, J. S., Cirasuolo, M., et al. 2010, MNRAS, 403, 960, doi: 10.1111/j.1365-2966.2009.16176.x
- McLure et al. (2011) McLure, R. J., Dunlop, J. S., de Ravel, L., et al. 2011, MNRAS, 418, 2074, doi: 10.1111/j.1365-2966.2011.19626.x
- Mesinger et al. (2015) Mesinger, A., Aykutalp, A., Vanzella, E., et al. 2015, MNRAS, 446, 566, doi: 10.1093/mnras/stu2089
- Mesinger et al. (2011) Mesinger, A., Furlanetto, S., & Cen, R. 2011, MNRAS, 411, 955, doi: 10.1111/j.1365-2966.2010.17731.x
- Mesinger & Furlanetto (2008) Mesinger, A., & Furlanetto, S. R. 2008, MNRAS, 385, 1348, doi: 10.1111/j.1365-2966.2007.12836.x
- Mesinger et al. (2016) Mesinger, A., Greig, B., & Sobacchi, E. 2016, MNRAS, 459, 2342, doi: 10.1093/mnras/stw831
- Meyer et al. (2024) Meyer, R. A., Oesch, P. A., Giovinazzo, E., et al. 2024, arXiv e-prints, arXiv:2405.05111, doi: 10.48550/arXiv.2405.05111
- Miralda-Escudé (1998) Miralda-Escudé, J. 1998, ApJ, 501, 15, doi: 10.1086/305799
- Morales et al. (2021) Morales, A. M., Mason, C. A., Bruton, S., et al. 2021, ApJ, 919, 120, doi: 10.3847/1538-4357/ac1104
- Morales et al. (2024) Morales, A. M., Finkelstein, S. L., Leung, G. C. K., et al. 2024, ApJ, 964, L24, doi: 10.3847/2041-8213/ad2de4
- Morishita et al. (2023) Morishita, T., Roberts-Borsani, G., Treu, T., et al. 2023, ApJ, 947, L24, doi: 10.3847/2041-8213/acb99e
- Nakajima et al. (2023) Nakajima, K., Ouchi, M., Isobe, Y., et al. 2023, ApJS, 269, 33, doi: 10.3847/1538-4365/acd556
- Nakane et al. (2024) Nakane, M., Ouchi, M., Nakajima, K., et al. 2024, ApJ, 967, 28, doi: 10.3847/1538-4357/ad38c2
- Napolitano et al. (2024) Napolitano, L., Pentericci, L., Santini, P., et al. 2024, arXiv e-prints, arXiv:2402.11220, doi: 10.48550/arXiv.2402.11220
- Ning et al. (2022) Ning, Y., Jiang, L., Zheng, Z.-Y., & Wu, J. 2022, ApJ, 926, 230, doi: 10.3847/1538-4357/ac4268
- Oesch et al. (2010) Oesch, P. A., Bouwens, R. J., Illingworth, G. D., et al. 2010, ApJ, 709, L16, doi: 10.1088/2041-8205/709/1/L16
- Oesch et al. (2015) Oesch, P. A., van Dokkum, P. G., Illingworth, G. D., et al. 2015, ApJ, 804, L30, doi: 10.1088/2041-8205/804/2/L30
- Oesch et al. (2016) Oesch, P. A., Brammer, G., van Dokkum, P. G., et al. 2016, ApJ, 819, 129, doi: 10.3847/0004-637X/819/2/129
- Oesch et al. (2023) Oesch, P. A., Brammer, G., Naidu, R. P., et al. 2023, MNRAS, 525, 2864, doi: 10.1093/mnras/stad2411
- Oke & Gunn (1983) Oke, J. B., & Gunn, J. E. 1983, ApJ, 266, 713, doi: 10.1086/160817
- Ono et al. (2012) Ono, Y., Ouchi, M., Mobasher, B., et al. 2012, ApJ, 744, 83, doi: 10.1088/0004-637X/744/2/83
- Osterbrock & Ferland (2006) Osterbrock, D. E., & Ferland, G. J. 2006, Astrophysics of gaseous nebulae and active galactic nuclei
- Ouchi et al. (2020) Ouchi, M., Ono, Y., & Shibuya, T. 2020, ARA&A, 58, 617, doi: 10.1146/annurev-astro-032620-021859
- Ouchi et al. (2010) Ouchi, M., Shimasaku, K., Furusawa, H., et al. 2010, ApJ, 723, 869, doi: 10.1088/0004-637X/723/1/869
- Ouchi et al. (2018) Ouchi, M., Harikane, Y., Shibuya, T., et al. 2018, PASJ, 70, S13, doi: 10.1093/pasj/psx074
- Pahl et al. (2020) Pahl, A. J., Shapley, A., Faisst, A. L., et al. 2020, MNRAS, 493, 3194, doi: 10.1093/mnras/staa355
- Pei (1992) Pei, Y. C. 1992, ApJ, 395, 130, doi: 10.1086/171637
- Pentericci et al. (2014) Pentericci, L., Vanzella, E., Fontana, A., et al. 2014, ApJ, 793, 113, doi: 10.1088/0004-637X/793/2/113
- Pentericci et al. (2018) Pentericci, L., Vanzella, E., Castellano, M., et al. 2018, A&A, 619, A147, doi: 10.1051/0004-6361/201732465
- Planck Collaboration et al. (2020) Planck Collaboration, Aghanim, N., Akrami, Y., et al. 2020, A&A, 641, A6, doi: 10.1051/0004-6361/201833910
- Reddy et al. (2016) Reddy, N. A., Steidel, C. C., Pettini, M., Bogosavljević, M., & Shapley, A. E. 2016, ApJ, 828, 108, doi: 10.3847/0004-637X/828/2/108
- Rieke et al. (2005) Rieke, M. J., Kelly, D., & Horner, S. 2005, in Society of Photo-Optical Instrumentation Engineers (SPIE) Conference Series, Vol. 5904, Cryogenic Optical Systems and Instruments XI, ed. J. B. Heaney & L. G. Burriesci, 1–8, doi: 10.1117/12.615554
- Rieke et al. (2023) Rieke, M. J., Kelly, D. M., Misselt, K., et al. 2023, PASP, 135, 028001, doi: 10.1088/1538-3873/acac53
- Roberts-Borsani et al. (2024) Roberts-Borsani, G., Treu, T., Shapley, A., et al. 2024, arXiv e-prints, arXiv:2403.07103, doi: 10.48550/arXiv.2403.07103
- Roberts-Borsani et al. (2016) Roberts-Borsani, G. W., Bouwens, R. J., Oesch, P. A., et al. 2016, ApJ, 823, 143, doi: 10.3847/0004-637X/823/2/143
- Sanders et al. (2023) Sanders, R. L., Shapley, A. E., Topping, M. W., Reddy, N. A., & Brammer, G. B. 2023, ApJ, 955, 54, doi: 10.3847/1538-4357/acedad
- Sanders et al. (2024) —. 2024, ApJ, 962, 24, doi: 10.3847/1538-4357/ad15fc
- Santos (2004) Santos, M. R. 2004, MNRAS, 349, 1137, doi: 10.1111/j.1365-2966.2004.07594.x
- Saxena et al. (2023) Saxena, A., Robertson, B. E., Bunker, A. J., et al. 2023, A&A, 678, A68, doi: 10.1051/0004-6361/202346245
- Saxena et al. (2024) Saxena, A., Bunker, A. J., Jones, G. C., et al. 2024, A&A, 684, A84, doi: 10.1051/0004-6361/202347132
- Scarlata et al. (2024) Scarlata, C., Hayes, M., Panagia, N., et al. 2024, arXiv e-prints, arXiv:2404.09015, doi: 10.48550/arXiv.2404.09015
- Schenker et al. (2014) Schenker, M. A., Ellis, R. S., Konidaris, N. P., & Stark, D. P. 2014, ApJ, 795, 20, doi: 10.1088/0004-637X/795/1/20
- Sebastian et al. (2024) Sebastian, A. M., Ryan-Weber, E., Davies, R. L., et al. 2024, MNRAS, 530, 1829, doi: 10.1093/mnras/stae789
- Shapley et al. (2023) Shapley, A. E., Reddy, N. A., Sanders, R. L., Topping, M. W., & Brammer, G. B. 2023, ApJ, 950, L1, doi: 10.3847/2041-8213/acd939
- Shapley et al. (2003) Shapley, A. E., Steidel, C. C., Pettini, M., & Adelberger, K. L. 2003, ApJ, 588, 65, doi: 10.1086/373922
- Sobacchi & Mesinger (2014) Sobacchi, E., & Mesinger, A. 2014, MNRAS, 440, 1662, doi: 10.1093/mnras/stu377
- Sobacchi & Mesinger (2015) —. 2015, MNRAS, 453, 1843, doi: 10.1093/mnras/stv1751
- Spina et al. (2024) Spina, B., Bosman, S. E. I., Davies, F. B., Gaikwad, P., & Zhu, Y. 2024, arXiv e-prints, arXiv:2405.12273, doi: 10.48550/arXiv.2405.12273
- Stark et al. (2010) Stark, D. P., Ellis, R. S., Chiu, K., Ouchi, M., & Bunker, A. 2010, MNRAS, 408, 1628, doi: 10.1111/j.1365-2966.2010.17227.x
- Stark et al. (2011) Stark, D. P., Ellis, R. S., & Ouchi, M. 2011, ApJ, 728, L2, doi: 10.1088/2041-8205/728/1/L2
- Stark et al. (2015) Stark, D. P., Walth, G., Charlot, S., et al. 2015, MNRAS, 454, 1393, doi: 10.1093/mnras/stv1907
- Stark et al. (2017) Stark, D. P., Ellis, R. S., Charlot, S., et al. 2017, MNRAS, 464, 469, doi: 10.1093/mnras/stw2233
- Stefanon et al. (2022) Stefanon, M., Bouwens, R. J., Illingworth, G. D., et al. 2022, ApJ, 935, 94, doi: 10.3847/1538-4357/ac7e44
- Stefanon et al. (2017) Stefanon, M., Yan, H., Mobasher, B., et al. 2017, ApJS, 229, 32, doi: 10.3847/1538-4365/aa66cb
- Tacchella et al. (2023) Tacchella, S., Johnson, B. D., Robertson, B. E., et al. 2023, MNRAS, 522, 6236, doi: 10.1093/mnras/stad1408
- Tang et al. (2019) Tang, M., Stark, D. P., Chevallard, J., & Charlot, S. 2019, MNRAS, 489, 2572, doi: 10.1093/mnras/stz2236
- Tang et al. (2022) Tang, M., Stark, D. P., & Ellis, R. S. 2022, MNRAS, 513, 5211, doi: 10.1093/mnras/stac1280
- Tang et al. (2024a) Tang, M., Stark, D. P., Ellis, R. S., et al. 2024a, arXiv e-prints, arXiv:2404.06569, doi: 10.48550/arXiv.2404.06569
- Tang et al. (2023) Tang, M., Stark, D. P., Chen, Z., et al. 2023, MNRAS, 526, 1657, doi: 10.1093/mnras/stad2763
- Tang et al. (2024b) Tang, M., Stark, D. P., Ellis, R. S., et al. 2024b, MNRAS, 531, 2701, doi: 10.1093/mnras/stae1338
- Tilvi et al. (2014) Tilvi, V., Papovich, C., Finkelstein, S. L., et al. 2014, ApJ, 794, 5, doi: 10.1088/0004-637X/794/1/5
- Tilvi et al. (2020) Tilvi, V., Malhotra, S., Rhoads, J. E., et al. 2020, ApJ, 891, L10, doi: 10.3847/2041-8213/ab75ec
- Topping et al. (2022) Topping, M. W., Stark, D. P., Endsley, R., et al. 2022, MNRAS, 516, 975, doi: 10.1093/mnras/stac2291
- Topping et al. (2024a) Topping, M. W., Stark, D. P., Senchyna, P., et al. 2024a, MNRAS, 529, 3301, doi: 10.1093/mnras/stae682
- Topping et al. (2024b) Topping, M. W., Stark, D. P., Endsley, R., et al. 2024b, MNRAS, 529, 4087, doi: 10.1093/mnras/stae800
- Treu et al. (2013) Treu, T., Schmidt, K. B., Trenti, M., Bradley, L. D., & Stiavelli, M. 2013, ApJ, 775, L29, doi: 10.1088/2041-8205/775/1/L29
- Treu et al. (2022) Treu, T., Roberts-Borsani, G., Bradac, M., et al. 2022, ApJ, 935, 110, doi: 10.3847/1538-4357/ac8158
- Umeda et al. (2023) Umeda, H., Ouchi, M., Nakajima, K., et al. 2023, arXiv e-prints, arXiv:2306.00487, doi: 10.48550/arXiv.2306.00487
- Valentino et al. (2023) Valentino, F., Brammer, G., Gould, K. M. L., et al. 2023, ApJ, 947, 20, doi: 10.3847/1538-4357/acbefa
- Vanzella et al. (2011) Vanzella, E., Pentericci, L., Fontana, A., et al. 2011, ApJ, 730, L35, doi: 10.1088/2041-8205/730/2/L35
- Ďurovčíková et al. (2024) Ďurovčíková, D., Eilers, A.-C., Chen, H., et al. 2024, ApJ, 969, 162, doi: 10.3847/1538-4357/ad4888
- Virtanen et al. (2020) Virtanen, P., Gommers, R., Oliphant, T. E., et al. 2020, Nature Methods, 17, 261, doi: 10.1038/s41592-019-0686-2
- Wang et al. (2020) Wang, F., Davies, F. B., Yang, J., et al. 2020, ApJ, 896, 23, doi: 10.3847/1538-4357/ab8c45
- Weaver et al. (2024) Weaver, J. R., Cutler, S. E., Pan, R., et al. 2024, ApJS, 270, 7, doi: 10.3847/1538-4365/ad07e0
- Whitler et al. (2024) Whitler, L., Stark, D. P., Endsley, R., et al. 2024, MNRAS, 529, 855, doi: 10.1093/mnras/stae516
- Whitler et al. (2023) —. 2023, MNRAS, doi: 10.1093/mnras/stad004
- Whitler et al. (2020) Whitler, L. R., Mason, C. A., Ren, K., et al. 2020, MNRAS, 495, 3602, doi: 10.1093/mnras/staa1178
- Wilkins et al. (2010) Wilkins, S. M., Bunker, A. J., Ellis, R. S., et al. 2010, MNRAS, 403, 938, doi: 10.1111/j.1365-2966.2009.16175.x
- Witstok et al. (2024a) Witstok, J., Maiolino, R., Smit, R., et al. 2024a, arXiv e-prints, arXiv:2404.05724, doi: 10.48550/arXiv.2404.05724
- Witstok et al. (2024b) Witstok, J., Smit, R., Saxena, A., et al. 2024b, A&A, 682, A40, doi: 10.1051/0004-6361/202347176
- Yang et al. (2020) Yang, J., Wang, F., Fan, X., et al. 2020, ApJ, 897, L14, doi: 10.3847/2041-8213/ab9c26
- Zheng et al. (2017) Zheng, Z.-Y., Wang, J., Rhoads, J., et al. 2017, ApJ, 842, L22, doi: 10.3847/2041-8213/aa794f
- Zhu et al. (2024) Zhu, Y., Becker, G. D., Bosman, S. E. I., et al. 2024, MNRAS, doi: 10.1093/mnrasl/slae061
- Zitrin et al. (2015) Zitrin, A., Labbé, I., Belli, S., et al. 2015, ApJ, 810, L12, doi: 10.1088/2041-8205/810/1/L12