Photon energy reconstruction with the MEG II liquid xenon calorimeter
Abstract
The MEG II experiment searches for a charged-lepton-flavour-violating with the target sensitivity of . A liquid xenon calorimeter with VUV-sensitive photosensors measures photon position, timing, and energy. This paper concentrates on the precise photon energy reconstruction with the MEG II liquid xenon calorimeter. Since a muon beam rate is \qtyrange[range-units=single,range-phrase=–]35e7\per, multi-photon elimination analysis is performed using waveform analysis techniques such as a template waveform fit. As a result, background events in the energy range of \qtyrange[range-units=single,range-phrase=–]4858MeV were reduced by \qty34. The calibration of an energy scale of the calorimeter with several calibration sources is also discussed to achieve a high resolution of \qty1.8.
1 Introduction
A charged-lepton-flavour-violating muon rare decay, , is strongly suppressed below the branching ratio of in the Standard Model of particle physics considering neutrino oscillation. The branching ratio of is, however, predicted by new physics models beyond the Standard Model such as supersymmetry Kuno-okada .
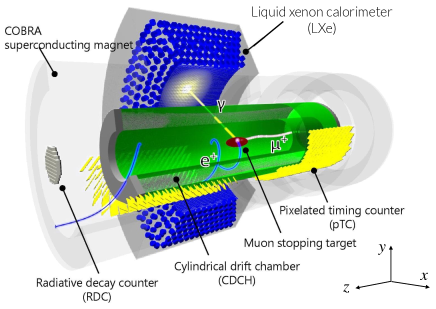
The MEG II experiment aims to search for with the sensitivity of approximately using innovative high-resolution detectors and the most intense DC muon beam at Paul Scherrer Institut meg2-design ; meg2-detector (Figure 1). It started physics data-taking in 2021 and is planned to be continued to 2026. An upper limit on the branching ratio was set to (\qty90 C.L.) with a combination of the MEG full dataset and the MEG II first dataset meg2-2021 .
Precise measurements of photons and positions realise high sensitivity with the kinematical difference between signal and background. The signal kinematics is a two-body decay: positron and photon are emitted back-to-back with monochromatic energy of \qty52.8MeV at the same time. Meanwhile, the dominant background is an accidental coincidence of positron and photon from different parent muons. The positron background source is the Michel decay () and the photon background is generated by radiative muon decay (RMD; ) and positron annihilation in flight (AIF) with electrons in the positron spectrometer. The number of the accidental background depends on the detector resolution :
| (1) |
where is photon (positron) energy, is an opening angle between positron and photon, and is time difference between them.
This paper will concentrate on the photon energy measurement for the data taken in 2021 and 2022. A liquid xenon calorimeter as a photon detector is introduced in Section 2. We, then, discuss analysis methods to realise high-resolution energy measurement in a high-intensity muon beam. Section 3 presents a multi-photon elimination algorithm. Section 4 discusses the calibration of an energy scale of the calorimeter.
2 Liquid xenon calorimeter
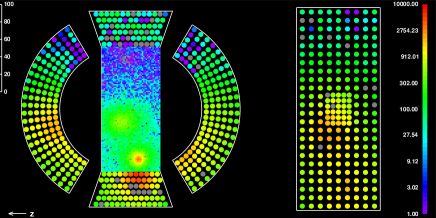
A liquid xenon (LXe) calorimeter plays a role in measuring -ray position, timing, and energy in the MEG II experiment. This is a C-shape homogeneous calorimeter as shown in Figure 1 filled with \qty900 LXe to obtain a uniform response. The LXe has a lot of advantages to detect \qty52.8MeV -rays: high stopping power (radiation length of \qty2.8cm), high light yield (\qty46000photons/MeV), and fast response (\qty45ns decay time). Since scintillation light emitted from xenon is in a vacuum ultra-violet (VUV) region, VUV-sensitive photosensors are utilised for scintillation light detection. The -ray entrance face is covered by Multi-Pixel Photon Counters (MPPCs) with the size of \qtyproduct[product-units=single]1.5 x 1.5cm^2 vuv-mppc to realise high granularity. The other faces are covered by 2-inch round-shape photomultiplier tubes (PMTs). The photosensors were calibrated to reconstruct the number of impinging scintillation photons on the -th photosensor (Figure 2) as presented in Section 6.3 of Ref. meg2-detector . The signal waveforms are read out with the DRS4 waveform digitiser drs4 with a sampling frequency of \qty1.4GSPS.
The -ray energy is reconstructed by collecting scintillation photons and converting it:
| (2) | ||||
| (3) |
where is an energy scale conversion factor, and are temporal variation correction functions, is a non-uniformity correction function, and () is the weighted sum of the number of scintillation photons detected by MPPCs (PMTs). The weighted sums and are calculated for a single photon through a multi-photon elimination algorithm discussed in Section 3. The conversion factor to the energy , and correction functions , , and are necessary to be calibrated to achieve high resolution as discussed in Section 4.
3 Multi-photon elimination
Multi-photon events deteriorate the energy resolution in a high-intensity muon beam. One of the multi-photon event sources is two photons from AIF both of which are incident to the calorimeter. This type of event has to be discarded from the analysis sample because this is only the coincident photon source in the MEG II experiment. Meanwhile, not only radiative decay and AIF photons but also signal photons can be detected with accidental low-energy photons in the DRS time window of approximately \qty700ns, so-called “pileup”, since beam muons stop at high rates of . The event has to be unfolded to extract the information of each individual photon.
We first perform peak search in the spatial distribution shown in Figure 2 to identify the multi-photon event. We, then, analyse the MPPC and PMT summed waveforms with a template waveform fitting technique to determine whether detected multiple photons are coincident and to unfold multiple pulses in case the multiple photons are off-timing. The template waveforms were created by taking an average of the measured summed waveforms. Their fluctuation is expressed as a standard deviation at time . The template waveform fit minimises defined as
| (4) |
where is observed MPPCs and PMTs summed waveforms with position-dependent weights to make the resolution best, and is the number of fitted pulses. The amplitude and timing for the -th pulse are floating parameters. Initial parameter sets of , , and are calculated with three techniques discussed in Section 3.1 before the waveform fit is performed. These multi-photon detection techniques are important to make the fitting robust as well as the energy resolution better. The performance evaluation of the multi-photon elimination is presented in Section 3.2.
3.1 Multi-photon detection techniques
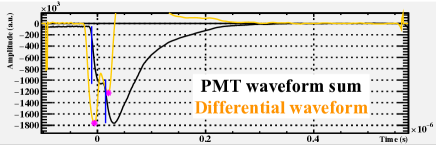
The first technique is peak search in differential PMT-summed waveform. We differentiate the PMT summed waveform because the waveform is sharper than that of MPPCs. Figure 3 shows PMT summed waveform and differential waveform. It is clear that the differential one is sensitive to multiple pulses.
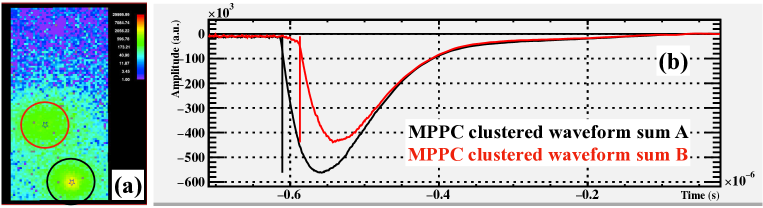
The second technique is clustering photosensors based on the spatial distribution and analysing summed waveforms of the clusters shown in Figure 4. This technique allows us to distinguish distant photons in a small time difference of a few to \qty20ns which are not distinguished by the differential waveform.
The last technique is the use of the flash ADC (FADC) signal used for the trigger whose time window is \qty1600ns. The time window is more than twice as wide as the DRS time window (approximately \qty700ns) though its sampling frequency is \qty80MSPS. This signal enables us to obtain information on pulses coming before the DRS time window.
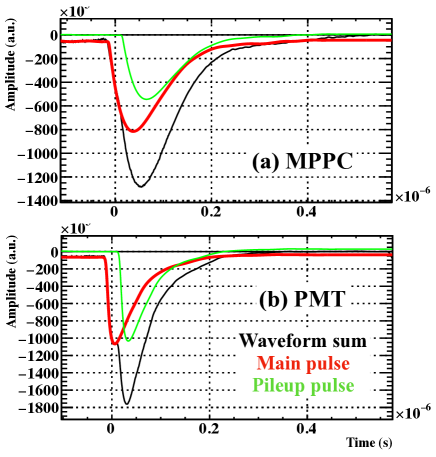
Figure 5 shows the unfolded pulses using the techniques described above. The red waveform is determined as the main photon because the preceding position and timing reconstructions are performed for the pulse. The weighted sums and for the main photon are calculated by integrating out the main pulse.
3.2 Performance
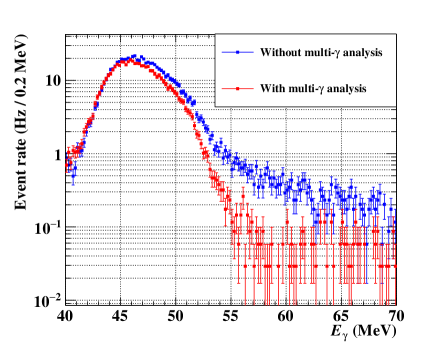
Successfully unfolded events are used for the physics analysis. That is, events with coincident two photons and a fit failure are discarded from the analysis sample. The performance of the multi-photon elimination is evaluated based on a reduction of background events in the analysis region () and the signal efficiency.
The number of background photons in \qtyrange[range-phrase=–,range-units=single]4858MeV was reduced by \qty34. A clear drop around \qty52.8MeV is seen in the energy spectrum thanks to the multi-photon elimination analysis (the red spectrum in Figure 6). The drop is important to suppress the background events since the signal energy is monochromatic at \qty52.8MeV.
The signal efficiency was evaluated to be \qty95 based on the Monte Carlo simulation for the signal event. The inefficiency of \qty5 is mainly due to events where photons in an electromagnetic shower escape from the shower and develop a new shower far enough from the original shower. The new shower results in fake spatial on-timing peaks.
4 Energy scale calibration
An energy scale of the calorimeter has to be calibrated so as not to miss the signal event and to achieve as high a resolution as possible for the whole data-taking period. The calibration for the 2021 data and the achieved energy resolution of \qty1.8 are described in Section 6.6 of Ref. meg2-detector . This paper focuses on xenon impurity and its temporal evolution during the 2022 run, which is an additional difficulty from the 2021 run. This was due to the impure Xe which we added to fill the active volume up at the beginning. Purification was done in parallel with the data-taking to remove impurities.
The impurity reduced the transparency of LXe to scintillation light. It resulted in less scintillation light detection by PMTs for photons generated from the muon stopping target because most electromagnetic showers develop near the entrance face covered by MPPCs. Position-dependent weights on mentioned in Section 3, however, were optimised to make the peak width sharpest with \qty54.9MeV photons from
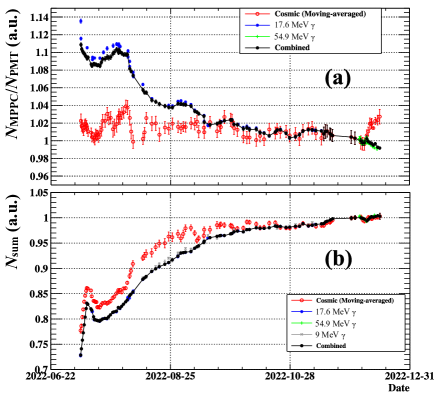
at the last of the 2022 run. We, therefore, need to calibrate the response difference between MPPCs and PMTs to keep the resolution using \qty17.6MeV photons from reaction and cosmic rays penetrating the calorimeter as well as \qty54.9MeV photons. Note that the \qty54.9MeV-photon data was taken after the physics data-taking because it required a pion beam. Figure 7(a) shows a temporal evolution of the ratio of to during the 2022 run. The ratio for -ray data decreased as the Xe purity was recovered as discussed above. Meanwhile, the ratio in cosmic-ray data was constant during the run because scintillation light was generated also near PMTs. The correction function is a reciprocal of the combined / history drawn in black in Figure 7(a).
The total detected scintillation light also decreased as impurities in LXe increased. It was calibrated also using \qty9MeV photons from reaction as well as \qty17.6MeV and \qty54.9MeV photons and cosmic rays. Figure 7(b) shows the temporal evolution of the peak positions. We see a good agreement in the temporal evolutions between \qty9MeV and \qty17.6MeV photons. On the other hand, there is a discrepancy between photons and cosmic rays which is not understood. We, however, relied on the -ray data since the shower development should be similar to that of signal and background photons in a muon beam. The cosmic-ray data was used to connect the peaks with \qty17.6MeV and \qty54.9MeV photons. The stability of the energy scale during the physics data-taking was assessed to be \qty0.2 based on the standard deviation of reconstructed energy for \qty17.6MeV photons after applying the correction function .
5 Conclusion
The MEG II LXe calorimeter with \qty900 LXe and VUV-sensitive photosensors measures photon position, timing, and energy. This paper focuses on photon energy reconstruction, discussing the multi-photon elimination algorithm and energy scale calibration.
Multi-photon elimination algorithm is performed to reconstruct single-photon energy in a high-intensity muon beam. Pileup photons are unfolded by the template waveform fit with three multi-photon detection techniques. The number of background events in the range of [\qty48MeV, \qty58MeV] was reduced by \qty34 in data while keeping the signal efficiency as high as \qty95.
We discuss the temporal evolution of the response difference between MPPCs and PMTs and of the energy scale due to Xe impurity. The stability during the physics data-taking was evaluated to be \qty0.2. The calorimeter performance such as the resolution will be evaluated after the ongoing calibration. The physics analysis results with the 2021 and 2022 data will finally be released this year.
Acknowledgements
We are grateful for the support provided by PSI as the host laboratory. This work was supported by MEXT/JSPS KAKENHI Grant Numbers 21H04991, 22K21350, 24KJ0607, and JSPS Core-to-Core Program, A. Advanced Research Networks JPJSCCA20180004.
References
- (1) Y. Kuno, Y. Okada, Muon decay and physics beyond the standard model, Reviews of Modern Physics 73 (2001). \doiwoc10.1103/RevModPhys.73.151
- (2) A.M. Baldini et al., The design of the MEG II experiment, Eur. Phys. J. C 78 (2018). \doiwoc10.1140/epjc/s10052-018-5845-6
- (3) K. Afanaciev et al., Operation and performance of the MEG II detector, Eur. Phys. J. C 84, 190 (2024). \doiwoc10.1140/epjc/s10052-024-12415-3
- (4) K. Afanaciev et al., A search for with the first dataset of the MEG II experiment, Eur. Phys. J. C 84, 214 (2024). \doiwoc10.1140/epjc/s10052-024-12416-2
- (5) K. Ieki et al., Large-area MPPC with enhanced VUV sensitivity for liquid xenon scintillation detector, Nucl. Instrum. Meth. A 925 (2019). \doiwoc10.1016/j.nima.2019.02.010
- (6) S. Ritt, The DRS chip: Cheap waveform digitizing in the GHz range, Nucl. Instrum. Meth. A 518 (2004). \doiwoc10.1016/j.nima.2003.11.059