Characterizing limit order books in call auctions of a stock market
Abstract
There has been little research on limit order books in call auctions of stock markets, where trades are executed at a single point in time, although there has been extensive research on continuous auctions, where trades are executed sequentially. This study focuses on the limit order books in the call auctions, with the aim of identifying their shapes and clarifying the relation between these shapes and the trading volume. Using data for all stocks listed on the Tokyo Stock Exchange, we found that the shape of the limit order books in call auctions are well fitted by the hyperbolic tangent function. We defined “median spread” and the “width” of limit orders from the fitting parameters. When the median spread and the width were plotted for all stocks, we observed interesting distributions depending on the attributes of the stocks and the company performances. Furthermore, we showed that the trading volume can be represented by the median spread and the width. The main contribution of this research is to demonstrate that median spread and the width are useful indicators for characterizing the states of the limit order books in the call auctions.
Introduction
A limit order book is a list of orders to sell or buy at a certain price (limit orders). The execution prices and the trading volumes are determined by the structure of the limit order book and the inflow of the market orders (orders which do not specify the price). Therefore, understanding the distribution of the limit order book and the dynamics of that is essential to predicting the dynamics of price, trading volume, volatility, etc. of that stock [1, 2, 3, 4, 5, 6].
The classical indicators to characterize the shape of the limit order books are “spread”, “depth”, and “resiliency” [7]. The spread refers to the distance between sell orders and buy orders. The most commonly used one is the Best Bid-Offer spread (BBO spread), which is the distance between the best ask (the lowest sell orders) and the best bid (the highest buy orders). It is known that stocks of the company with lower profit tend to have wider BBO spreads. One possible explanation for this is that traders demand a high return for taking the risk, and hence place high sell orders and low buy orders [8]. The depth characterizes the volume of orders near the price of the best ask and the best bid. Especially, order volume at the price of the best ask and the best bid is commonly used. The resiliency refers to the speed with which the market price (especially, the BBO spread) returns to its original value after the execution. Another characteristic of the shape of the limit order books is “slope”, which is the increment of the order volume to the increment of the price on the limit order books. It is known that the slope of the limit order book is negatively correlated with the trading volume [9].
However, these studies focus on the continuous auction, where orders are placed and executed sequentially. There has been little study on the call auction, where orders are accumulated and those are executed all at once at the end of the auction. The share of the call auction is at around 30% in the Tokyo Stock Exchange [10, 11] in the European exchanges [12, 13]. Moreover, the share of the call auction in the European exchanges is increasing [12, 13].
In this study, we investigate the shape of the limit order books on the call auction, and see the differences among the stocks with different attributes. Moreover, we clarify the relation between the shape and the trading volume.
Results
Fitting function of limit order book
We use the data of the limit order books at the moment of the execution (9:00 A.M.) for all the stocks listed on the Tokyo Stock Exchange in 2022. In order to analyze the shape of the limit order book for each stock, we aggregate the limit order books of all the days in the data for each stock. Because the price levels and the order volumes vary day to day, we standardize them for aggregation. The details of the data preparation are described in Method.
For the aggregated order distribution, we denote the number density of sell (Ask) limit orders at price as , and the number density of buy (Bid) limit orders at price as . We denote the cumulative number of sell and buy limit orders as and , respectively. Also, the number of sell market orders and the buy market orders are denoted by and , respectively.
The execution price and the trading volume are determined by the relation
| (1) |
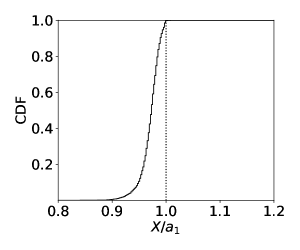
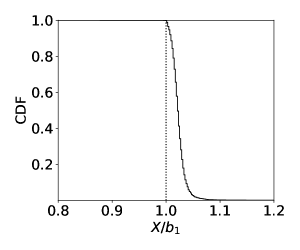
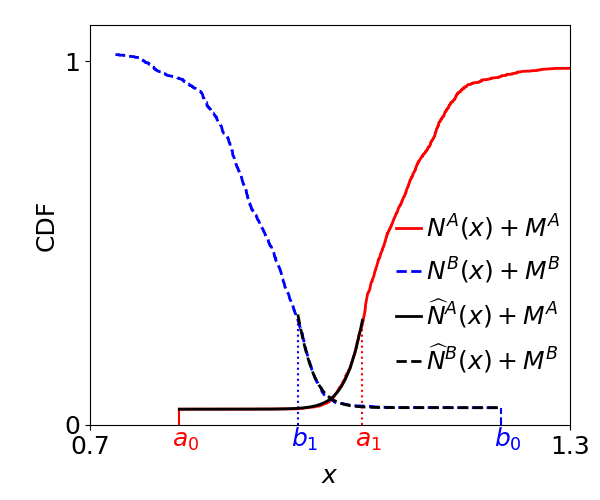
As shown in Fig. 2, the execution price is in the range between the first quartile of sell limit orders, and the first quartile of buy limit orders, . Therefore, in order to keep the information to characterize the price and the volume, we fit in the range , and fit in the range by functions introduced below, where is the price of the best ask and is the price of the best bid. Fig. 2 shows a typical shape of a limit order book. We treat the sell market orders as the sell limit orders placed at , and treat the buy market orders as the buy limit orders placed at . The red solid line represents the sell limit orders and market orders , and the blue dashed line represents the buy limit orders and market orders . It is found that the cumulative orders and typically start from a slow rise and then steepens at a certain point like the sigmoid function, so we adopt the hyperbolic tangent function as the fitting function for its mathematical convenience. Namely, we fit and as
| (2) |
where and are the total numbers of sell and buy limit orders. and are the fitting parameters which correspond to the typical widths of the sell and buy orders. and represent the medians of the sell and buy fitting functions. The example of the fit for the limit order book is shown in Fig. 2 by the black lines.
Asymmetry in the width of the sell and buy limit order books
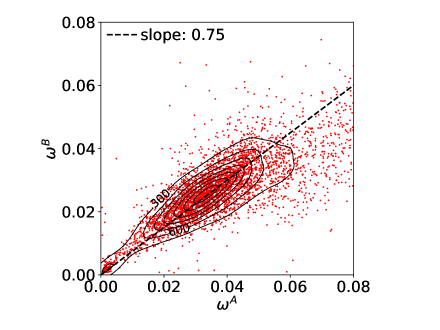
Using the fitting functions in Eq. (2), we observe the relation between the typical widths of the sell and buy orders, and . Fig. 3 shows the scatter plot of stocks in the - plane with its density contours. This indicates that and are correlated, with the clear asymmetry that tends to be larger than . In the continuous auction, the asymmetry in the sell-side and the buy-side has been reported for the number of orders [14]. For the distributions of incoming orders, there seems to be no difference between the sell-side and the buy-side when the sell (buy) order prices are normalized by the best ask (bid) [15]. The asymmetry in the shape of the limit order book we have found here is different from the above reported ones, which may be specific to the call auction.
Classification of stocks
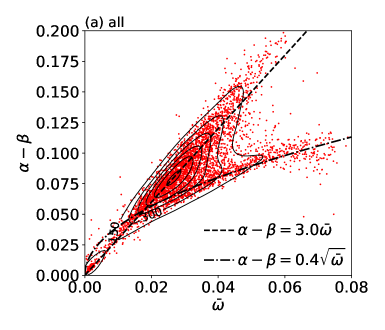
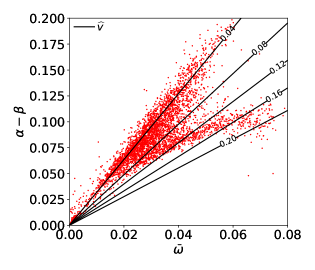
We now compare the distance between the sell orders and the buy orders to those widths, to capture the basic information of the limit order book of each stock. We use to characterize the width of the orders, and to characterize the distance between the sell orders and the buy orders. Fig. 5 (a) shows the distribution of stocks in the and plain. This distribution can be classified into three clusters. The first cluster (Cluster 1) is characterized by the small width and the small spread (). The second cluster (Cluster 2) is the group of stocks which are distributed around a line: . The other stocks are distributed below this line, forming the third cluster (Cluster 3).
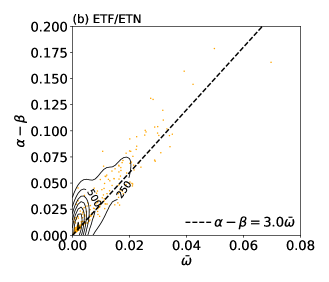
We find that those clusters are strongly correlated with the types of stocks. While most stocks in Cluster 2 and Cluster 3 are individual stocks, most stocks in Cluster 1 are Exchange-Traded Funds (ETFs) and Exchange-Traded Notes (ETNs) (Fig. 5 (b)). ETFs and ETNs are investment funds linked to an index composed of different stocks and other assets, and therefore the fluctuations of the prices tend to be small, merely because of the Law of Large Numbers. An interesting observation is that both Cluster 1 and Cluster 2 are distributed along the same line: . This constant slope of the distribution corresponds to the constant execution ratio. As is shown in the Method, the execution ratio for given fitting functions is determined only by the slope as
| (3) |
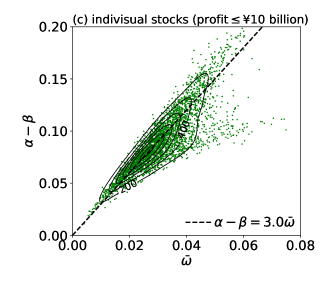
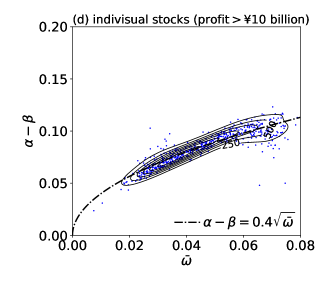
The lines for the constant execution ratio are shown in Fig. 5. The slope corresponds to the execution ratio . The fact that Cluster 1 and Cluster 2 are distributed along the single line suggests that self-organizing mechanism may work among traders. That is, traders have an empirical knowledge of the normal shape of the limit order book, i.e. the ratio of the spread to the width. Based on this knowledge, they place orders, which result in the normal shape of the limit order book. As for Cluster 3, they are distributed along a curve: , which is below the line with slope . For these stocks, the theoretical execution ratios are higher than . The origin of this non-linearity of the curve is not clear yet. It turns out that most of the individual stocks in Cluster 3 are separated from Cluster 2 by whether the company’s net profit in that year was more than 10 billion yen or not (Fig. 5 (c), (d)).
Summary and discussion
Intensive studies have been made on the limit order books under the continuous auction. On the other hand, there has been little research on the limit order books in the call auction. In this study, we focused on the shape of the limit order books in the call auction. The empirical findings we have found are following.
First, we fitted the limit order book for each stock at the moment of the call auction by the hyperbolic tangent function to obtain the typical widths and the medians . We find that the widths in the sell-side and the buy-side, and , are correlated with clear asymmetry that is larger than . This suggests that sell traders have a more diverse view of stock valuations than buy traders. For the continuous auction, the asymmetry of the shape of the sell and buy limit order books has not been reported, which suggests the symmetry is specific to the call auction.
Next, we examined the relation between the width with the median spread . We found that stocks are roughly classified into three clusters. Cluster 1 is the group of stocks whose width and spread are small (). Cluster 2 is the group of stocks which are distributed around the line: . Cluster 3 is the group of stocks which are distributed around the non-linear curve: , which is below the straight line. Most stocks in Cluster 1 are ETFs and ETNs. Most stocks in Cluster 2 and Cluster 3 are individual stocks with net profits of less than 10 billion yen and individual stocks with net profits of more than 10 billion yen. Moreover, we showed the theoretical execution ratio is determined only by the slope . For most stocks in Cluster 1 and Cluster 2, the slope corresponds to the execution ratio . For most stocks in Cluster 3, the slope corresponds to the execution ratio . The main contribution of this study is to show that width and the median spread are useful indicators in characterizing the limit order books in the call auction.
Most stocks are distributed around the straight line in Cluster 1 and Cluster 2. This fact suggests that there may be some sort of self-organizing mechanism at work among traders. That is, traders have an empirical knowledge of the normal shape of the limit order book, i.e. the ratio of the spread to the width. Based on this knowledge, they place orders, which result in the normal shape of the limit order book. This self-organizing mechanism is not introduced in the existing zero-intelligence models. The zero-intelligence model is a kind of the market model, which implements a limit order book and trading rules but does not assume any traders’ intelligence such as trading strategies. The zero-intelligence models are very simple, but they have had some success in explaining the market price fluctuations [16, 17] and the market impact (the price response to new orders) observed [18] in the real stock markets. Introducing the self-organizing mechanism into the models would allow the model to be set up closer to reality and may encourage further findings.
As mentioned in the Introduction, in the previous study on the continuous auction, the relation between the spread and the company’s profit has been shown [8]. This fact is consistent with our finding that the spreads are larger for stocks with lower net profits (Cluster 2) than stocks with higher net profits (Cluster 3). Another previous study on the continuous auction showed that trading volume and the slope of the limit order book are negatively correlated [9], which is also consistent with the increasing function of depending on in Eq. (3).
We found that the shapes of limit order books are well fitted by the hyperbolic tangent function. This finding on the shape could be applied in two ways. The first one is the study on market impact. It is well known that the market impact in the continuous auction is proportional to the square root of the order volume. This fact has been explained by the latent order book model, which is based on the shape of the limit order book [19]. By using the shape of the limit order book in the call auction obtained from this study, the study of the market impact will be further advanced. The second one is the study on market liquidity. In previous model studies in call auctions [20, 21], trading volume and utility, which represents the goodness of the execution price, were expressed as an increasing function of order volume. In the theoretical model, the distribution of order prices was assumed to be uniformly distributed. Based on the actual shape of the limit order book which was obtained from this study, more realistic relation between trading volume and utility and order volume shall be investigated in the future.
The daily observation of and of limit order books also has practical applications. Suppose that and for a stock is placed in a different position than usual. It helps stock exchanges to detect erroneous orders or illegal activities such as insider trading. For traders, unusual position of and may indicate changes in the company performance, such as the profit, and contribute to their investment decisions.
Method
Data set
We use the data of limit order books at the time of the call auction at 9:00 A.M. for 244 business days from January 4 to December 30, 2022 for all the listed stocks on the Tokyo Stock Exchange (4,024 stocks per day on average). Stocks for which the number of orders is so small that the daily best ask, best bid and the first quartiles cannot be defined are to be excluded. In order to examine the shape of the limit order book for each stock, we aggregate the limit orders of all the days in the data for each stock.
Data preparation
The order volumes vary day to day. Sometimes artificial events such as stock split are conducted by the Tokyo Stock Exchange. Therefore, when we aggregate the limit order books, the weight of the order volume for each day is set to be constant.
Also, the stock price levels varies from day to day, and according to these differences, the position of the limit order book varies from day to day. Therefore, we define a reference price for each day for each stock, and calculate order prices divided by the reference price. We aggregate the limit order books based on the relative price. This concept of the relative price is used in a previous study [15], for instance. As for the definition of the reference price, the execution price of the call auction is one candidate. However, the execution price cannot be defined when the sell and buy limit order books are not overlapped. Next idea of the definition of the reference price shall be the middle price of the best ask and the best bid. However, for many cases of call auctions, the best ask and the best bid become the lower and the upper limit price, which are artificially set by the Tokyo Stock Exchange. Therefore, the middle price of the best ask and the best bid does not reflect the stock price level of the day. Thus, we define the reference price by the average of the first quartile of the sell limit order book and the first quartile of the buy limit order book.
Theoretical execution price and execution ratio
As Eq. (1), the execution is conducted at the point where the cumulative numbers of sell and buy orders cross. By using the fitting functions and obtained in Eq. (2), the execution price and the trading volume shall satisfy the following relation
| (4) |
Under the approximations that , , and , we obtain the execution price and the execution ratio as follows.
| (5) |
Data availability statement
The data that support the findings of this study are available from Tokyo Stock Exchange, Inc. but restrictions apply to the availability of these data, which were used under the non-disclosure agreement for the current study, and so are not publicly available. However, in some cases, the processed data, not the raw data may be shared by the authors upon reasonable request and with the permission of Japan Exchange Group, Inc. (the parent company of Tokyo Stock Exchange, Inc.).
References
- [1] Chakraborti, A., Toke, I. M., Patriarca, M. & Abergel, F. Econophysics review: I. empirical facts. \JournalTitleQuantitative Finance 11, 991–1012 (2011).
- [2] Chakraborti, A., Toke, I. M., Patriarca, M. & Abergel, F. Econophysics review: II. agent-based models. \JournalTitleQuantitative Finance 11, 1013–1041 (2011).
- [3] Bouchaud, J.-P., Farmer, J. D. & Lillo, F. How markets slowly digest changes in supply and demand. In Handbook of financial markets: dynamics and evolution, 57–160 (Elsevier, 2009).
- [4] Bouchaud, J.-P., Bonart, J., Donier, J. & Gould, M. Trades, quotes and prices: financial markets under the microscope (Cambridge University Press, 2018).
- [5] Abergel, F., Anane, M., Chakraborti, A., Jedidi, A. & Muni Toke, I. Limit Order Books. Physics of Society: Econophysics and Sociophysics (Cambridge University Press, 2016).
- [6] Gould, M. D. et al. Limit order books. \JournalTitleQuantitative Finance 13, 1709–1742 (2013).
- [7] Kyle, A. S. Continuous auctions and insider trading. \JournalTitleEconometrica: Journal of the Econometric Society 1315–1335 (1985).
- [8] Agrawal, V., Kothare, M., Rao, R. K. & Wadhwa, P. Bid-ask spreads, informed investors, and the firm’s financial condition. \JournalTitleThe Quarterly Review of Economics and Finance 44, 58–76 (2004).
- [9] Næs, R. & Skjeltorp, J. A. Order book characteristics and the volume–volatility relation: Empirical evidence from a limit order market. \JournalTitleJournal of Financial Markets 9, 408–432 (2006).
- [10] Lehmann, B. N. & Modest, D. M. Trading and liquidity on the tokyo stock exchange: A bird’s eye view. \JournalTitleThe Journal of Finance 49, 951–984 (1994).
- [11] Ohta, W. Stock trading on the tokyo stock exchange from 2001 to 2003 (in Japanese). \JournalTitleOsaka University Knowledge Archive 57, 242–262 (2008).
- [12] Derksen, M., Kleijn, B. & De Vilder, R. Heavy tailed distributions in closing auctions. \JournalTitlePhysica A: Statistical Mechanics and its Applications 593, 126959 (2022).
- [13] Derksen, M., Kleijn, B. & De Vilder, R. Effects of mifid ii on stock price formation. \JournalTitlearXiv preprint arXiv:2003.10353 (2020).
- [14] Noritake, Y., Hemmi, R., Nagumo, S., Mizuta, T. & Izumi, K. Analysis of short side market inefficiencies using artificial market model. \JournalTitleJPX working paper 38 (2022).
- [15] Mike, S. & Farmer, J. D. An empirical behavioral model of liquidity and volatility. \JournalTitleJournal of Economic Dynamics and Control 32, 200–234 (2008).
- [16] Maslov, S. Simple model of a limit order-driven market. \JournalTitlePhysica A: Statistical Mechanics and its Applications 278, 571–578 (2000).
- [17] Slanina, F. Mean-field approximation for a limit order driven market model. \JournalTitlePhysical Review E 64, 056136 (2001).
- [18] Donier, J. & Bouchaud, J.-P. From walras’ auctioneer to continuous time double auctions: A general dynamic theory of supply and demand. \JournalTitleJournal of Statistical Mechanics: Theory and Experiment 2016, 123406 (2016).
- [19] Tóth, B. et al. Anomalous price impact and the critical nature of liquidity in financial markets. \JournalTitlePhysical Review X 1, 021006 (2011).
- [20] Nagumo, S. & Ichiki, S. Impact on utility of traders by improvement of liquidity in stock secondary markets (in Japanese). \JournalTitleJPX working paper 24 (2018).
- [21] Nagumo, S., Ichiki, S. & Shimada, T. Analytical and simulational approaches to the relation between the stock market liquidity and the traders’ utility. \JournalTitleArtificial Life and Robotics 27, 691–697 (2022).
Acknowledgements
We greatly appreciate the data provision by Tokyo Stock Exchange, Inc.
Author contributions
S.N. obtained and analyzed the data. S.N. and T.S. discussed the results and wrote the manuscript.
Competing interests
The authors declare no competing interests.
Disclaimer
The views expressed in this paper are those of the authors and do not represent the views of the organizations to which they belong.