Near-quantum limited axion dark matter search with the ORGAN experiment around 26 eV
Abstract
The latest result from The ORGAN Experiment, an axion haloscope is presented. This iteration of the experiment operated at millikelvin temperatures using a flux-driven Josephson parametric amplifier (JPA) for reduced noise, along with various other upgrades over previous iterations. Covering the ( GHz) mass (frequency) range, this near-quantum limited phase of ORGAN employs a conducting rod resonator and a 7-T solenoidal magnet to place the most sensitive exclusion limits on axion-photon coupling in the range to date, with at a 95% confidence level.
Dark matter remains one of the universe’s most elusive mysteries, accounting for approximately of its mass, yet it continues to evade detection [1]. Among the candidates proposed to explain dark matter, axions emerge as a favoured solution due to their separate theoretical foundations and potential to resolve longstanding issues in particle physics. Originally introduced to address the strong CP problem in quantum chromodynamics (QCD) [2, 3, 4, 5], axions bridge the worlds of cosmological phenomena and fundamental particle interactions. The Peccei-Quinn (PQ) symmetry breaking scale determines the axion’s mass , expected to be [6, 7, 8] and coupling to Standard Model particles. The axion haloscope [9] is a method for detecting axions in the laboratory by taking advantage of their expected coupling to photons. The haloscope method typically involves a cryogenic microwave cavity immersed in a strong static magnetic field (a source of virtual photons) to convert axions into real photons with a frequency related to the axion rest mass, . The axion-converted photons will resonate inside the cavity if coupled to a geometrically appropriate resonant mode that satisfies the interaction Lagrangian:
| (1) |
where is the axion field, is the electric field and is the magnetic field (often externally applied). The coupling strength of this interaction is related to by
| (2) |
Here, is the fine-structure constant, and is a dimensionless model-dependent parameter, taking a value of and in the Kim-Shifman-Vainshtein-Zakharov (KSVZ) [10, 11] and the Dine-Fischler-Srednicki-Zhitnitsky (DFSZ) [12, 7] benchmark models, respectively. To date, only the ADMX [13, 14, 15] and CAPP-12 TB [16, 17] experiments have achieved sensitivity to DFSZ-coupled axions, partly due to the favourable sensitivity scaling at frequencies around . However, there is considerable interest in exploring the higher-frequency (equivalently high axion mass) parameter space, which is favoured when PQ symmetry breaks after inflation [18, 19, 20, 21], with QCD lattice simulations indicating a lower bound for the axion mass (frequency) of [22]. The Oscillating Resonant Group AxioN (ORGAN) Experiment [23, 24, 25], hosted in Western Australia, is among the growing list of higher-frequency haloscope experiments attempting to search the post-inflationary mass window. Other notable experiments searching this range include HAYSTAC [26, 27, 28], QUAX [29, 30], MADMAX [31], TASEH [32], RADES [33, 34], CAPP [35] and GrAHal [36].
The signal power extracted from axion-photon conversion in a typical haloscope experiment can be expressed as [26, 32]
| (3) |
where is the local dark matter density (assumed to be all axions). The second set of parentheses denotes properties of the haloscope: is the angular resonant frequency, is the magnetic field strength, is the cavity volume, is the mode-dependent form factor that represents the coupling of the axion field to the electromagnetic mode, is the loaded quality factor and is the coupling strength of the strongly coupled antenna receiver.
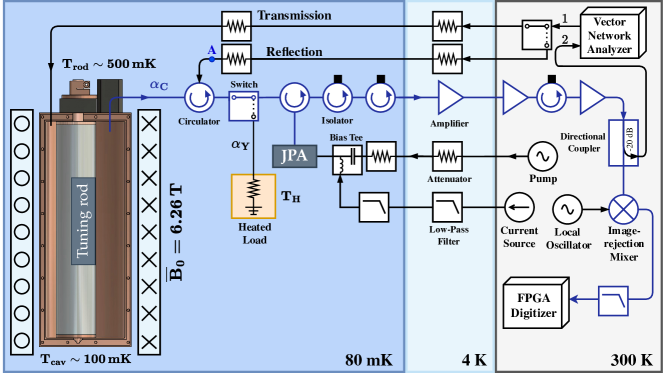
In this work, we report on the most recent axion search with The ORGAN Experiment, which scanned the ( GHz) mass (frequency) range of the axion-photon coupling parameter space. To achieve this, we implement a -based conducting rod resonator that fully occupies our 7-T solenoidal magnet bore. The cavity has a volume of and features a clamshell design made from oxygen-free high-conductivity copper. The aluminium tuning rod (selected as opposed to copper for its lower mass and therefore enhanced mechanical tuning), as depicted in Fig. 1, results in a typical value for the form factor of over the frequency range searched.
The ORGAN Experiment is planned in several stages [25] with the first phase of the experiment having been competed [23, 24]. While this search falls outside ORGAN’s targeted GHz frequency range, ORGAN Q serves as a testbed for a variety of techniques and technologies which may be applied in future ORGAN searches as Phase 2 of the experiment is prepared. These include a clamshell resonant cavity design, operating at millikelvin temperatures, employing a commercially available, flux-driven Josephson parametric amplifier (JPA) from Raytheon [37] before the HEMT amplifier (as opposed to solely HEMT amplifiers in Phase 1), the collection of high frequency resolution data (for a dedicated high resolution search), and the implementation of various other RF design features such as cryogenic switches and a heated load for noise calibration. The JPA consists of a nonlinear resonator, making use of Josephson junctions as its inductive element, and has a broadband impedance transformer on its input, which has been shown to increase the bandwidth beyond the gain bandwidth product [37, 38, 39]. It can be operated in either 3 or 4-wave mixing mode, has near-quantum limited performance and can produce broadband gain of order 100 MHz. In order to reduce the number of components and shift the pump tone away from the gain band, it is operated in 3-wave mixing mode, where the inductive element is parametrically modulated via a pump at roughly twice the signal frequency. Details of the JPA gain characterisation are discussed further in the supplementary materials.
Implementing a near-quantum-limited amplifier at millikelvin temperatures greatly reduces the total system noise, , compared to ORGAN Phase 1. For this reason, we refer to this spin-ff phase of the experiment as ORGAN-Q, where Q stands for quantum. The total system noise, referred to that cavity output, is given by [32]:
| (4) |
where represents the sum of the effective temperature of the blackbody radiation at the physical temperature , and the zero-point fluctuations of the vacuum, is the physical temperature of the cavity, is the cavity’s Lorentzian lineshape, is the physical temperature of the attenuator , anchored to the mixing chamber plate (as shown in Fig. 1). The effective noise added by the JPA, referred to the cavity output, is denoted as . The gain , of this initial amplification stage suppresses the noise added by the second-stage high electron mobility transistor (HEMT) amplifier, which is labelled as and referred to the cavity output.
The sensitivity of an axion haloscope is given by the signal-to-noise ratio (SNR), which also determines the rate of scanning at a given axion-photon coupling exclusion power:
| (5) |
Here is the integration time, and is the expected axion linewidth due to the local axion kinetic energy distribution. For the standard halo model, this distribution is assumed to follow a Maxwell-Boltzmann profile [40, 41].
The total system noise is, therefore, a crucial parameter in determining the sensitivity of a haloscope. We calculate using the Y-factor method and the signal-to-noise ratio improvement (SNRI) method, which has become the standard calibration method in haloscope experiments [42, 15, 14, 43, 44]. The Y-factor method utilises the cryogenic switch, located on the mixing chamber plate as shown in Fig. 1 to connect the receiver chain to a matched load, which can be heated at the “” cold plate. The “hot load” equipped with a thermometer, is mounted to a piece of Nb and connected to the switch using a stainless steel coaxial cable to provide thermal isolation between the plates. By measuring the noise power, with the JPA pump tone off, at various hot-load temperatures , we can determine , which is the measured noise temperature of the HEMT by Y-factor. To find the effective noise temperature contribution of the HEMT to signals at the output of the cavity, it is first scaled by the loss (Y-factor to switch) to refer this noise to the input of the switch, and then by (cavity to switch) to refer it back to the cavity. These losses are shown in Fig. 1 and were measured in a separate, dedicated cooldown after the data-taking run was complete. In order to simplify terminology, includes the noise contribution from all losses between the switch and the HEMT input.
| Dates (2024) | Feb 12 - March 10 |
|---|---|
| Axion sensitive data taking | 17 days |
| Frequency range | 6.15-6.35 GHz |
| Axion mass | 25.45-26.27 eV |
| Frequency bin width | 954 Hz |
| Tuning step | |
| Sweep time | 30-60 minutes |
| Magnetic field (average) | 6.26 T |
| Q factor (typical) | 1700 (=400) |
| Form factor (typical) | 0.42 |
| Cavity volume | 0.708 L |
| Cavity coupling (typical) | 1.45 (=0.32) |
| MXC temperature | 80 mK |
| Cavity Temperature | 100 mK |
| Rod temperature | 500 mK |
| System noise | 928 mK (=108 mK) |
| System noise quanta | 3.12 (=0.36) @ 6.2GHz |
cannot be measured reliably using the Y-factor method since the limited dynamic range and broad bandwidth of the JPA saturates at low values. Instead, we determine (which includes ) using the SNRI method. This method involves a spectrum comparison that must be done relatively quickly for each tuning-rod (cavity frequency) position by comparing the SNR with the JPA on (pump tone on) to the SNR with the JPA off (pump tone off). The SNRI is given by [42]
| (6) |
where () are the transfer functions measured using a vector network analyzer (VNA) with the JPA turned on (off), with and () are the noise-powers measured using a spectrum analyzer with the JPA turned on (off). The JPA transfer function given by the S-parameter , is measured by operating a room temperature switch that switches the VNA output (port 1) to the RF “reflection” line to measure the frequency response at the VNA input (port 2). Using the measured SNRI and , the total system noise temperature referred to the cavity output is given by [17]
| (7) |
where all parameters are measured quantities. A summary of relevant experimental parameters is given in table 1.
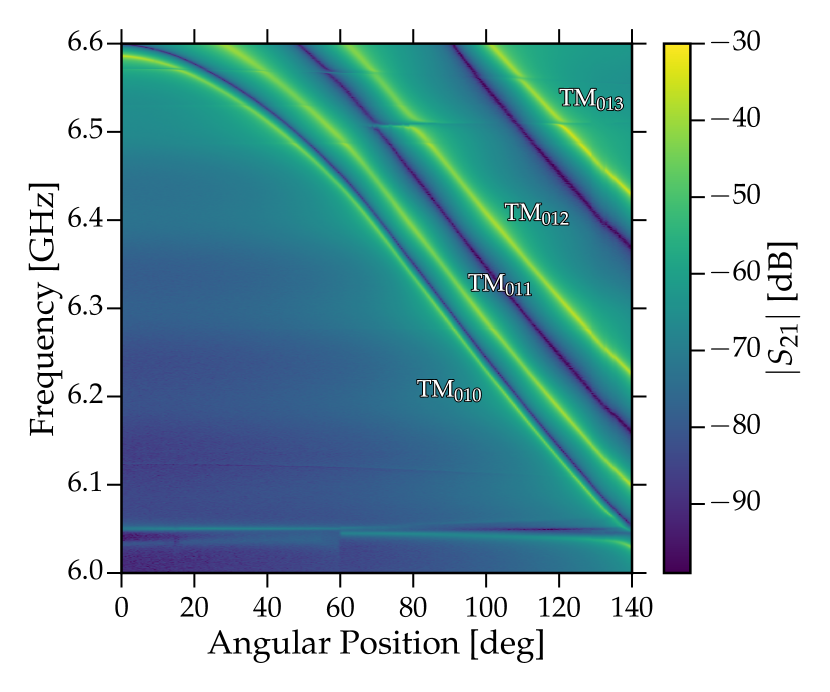
We acquired axion-sensitive data for days, to search for axions in a region without mode-crossings, with masses between ( GHz). A total of 489 resonant frequencies were scanned with an integration time . Rotating the off-axis tuning rod via an Attocube ANR240 piezoelectric stepper motor shifted the resonant frequency in step sizes of , as shown in Fig. 2. The tuning rod was hollowed out in such a way that the centre of mass coincided with the axis of rotation, minimizing the torque required to move the rod, which ensured smooth tuning at cryogenic temperatures. The stepper motor was directly coupled to the tuning rod axle, while the bottom rod endcap was positioned in a conical groove (as shown in Fig. 1) to avoid radiation leakage and provide additional thermalisation between the rod and cavity. The antenna coupling was adjusted using an Attocube ANPz101 piezoelectric stepper motor mounted to the cavity, which is also shown in Fig. 1.
At each frequency, the parameters , and the SNRI are measured by operating the room temperature switch to take VNA transfer function measurements. Throughout the scan, had a typical value of and was adjusted to maintain above critical coupling, with an average value of .
As mentioned, is determined at each cavity frequency and varied as a function of detuning from resonance. We express the system noise temperature in the th bin of the th spectrum as , with an an average value of over the scanned region. This corresponds to a total system noise quantum of 3.12 () at 6.2GHz. This is much higher than the noise temperature expected assuming , as measured by Raytheon [37]. Unfortunately, tuning the rod position with the rotary piezo motor led to significant heating of the rod, resulting in a typical rod temperature of . We attribute the higher-than-expected value for to the “hot rod”, which is accounted for in the SNRI measurements.
Data acquisition is fully automated using Python and LabVIEW. The appropriate JPA gain curve is chosen based on the cavity centre frequency , maintaining a gain greater than 18 dB over most of the searched frequency range. Once amplified, the thermal noise (and potential axion signal) are down-mixed to an intermediate frequency (IF) using a local oscillator and IQ mixer. The outputs of the IQ mixer are combined using a hybrid coupler to achieve image rejection of the amplifier-only sideband. The signal is then sampled by a 250 MS/s digitizer (NI-5761R), and a zero dead-time fast Fourier transform is processed on a field-programmable gate array (FPGA; Xilinx Kintex-7, NI-7935R).
In contrast to previous ORGAN searches [23, 24], ORGAN-Q operates at a low enough frequency to capture “high-resolution” spectra, which are sensitive to non-virialized axion flows. These narrow, cold axion flows have been proposed in the caustic ring model [45, 46, 47, 48] or as a consequence of the QCD axion being born after inflation [49]. To achieve this, we operate two parallel data streams on the FPGA. The first stream, similar to previous ORGAN searches [23, 24], uses FPGA-based averaging to generate a 6554 point, 6.25-MHz-wide spectrum centred at 45 MHz, resulting in a bin width of . The second stream does not perform any averaging and operates at one-quarter of the sampling frequency as the main data stream, producing a 3,355,444 point, 1.5625-MHz-wide spectrum, with a fractional spectral width of . The results from the high-resolution analysis will be presented in a forthcoming publication.
As in previous ORGAN searches [23, 24], we follow the HAYSTAC analysis procedure [41, 50], more details of which can be found in the supplementary materials. We chose to forgo rescans due to multiple magnet quenches during the data-taking run, which significantly extended the experimental time. The resulting limits for the mass range are the most sensitive to date, and are shown in Fig. 3, assuming axions make up 100% of the local dark matter density of . The fractional uncertainty on axion-photon coupling is calculated in a similar way to previous analyses [23, 24]. We find , which is dominated by uncertainties in the parameters and .
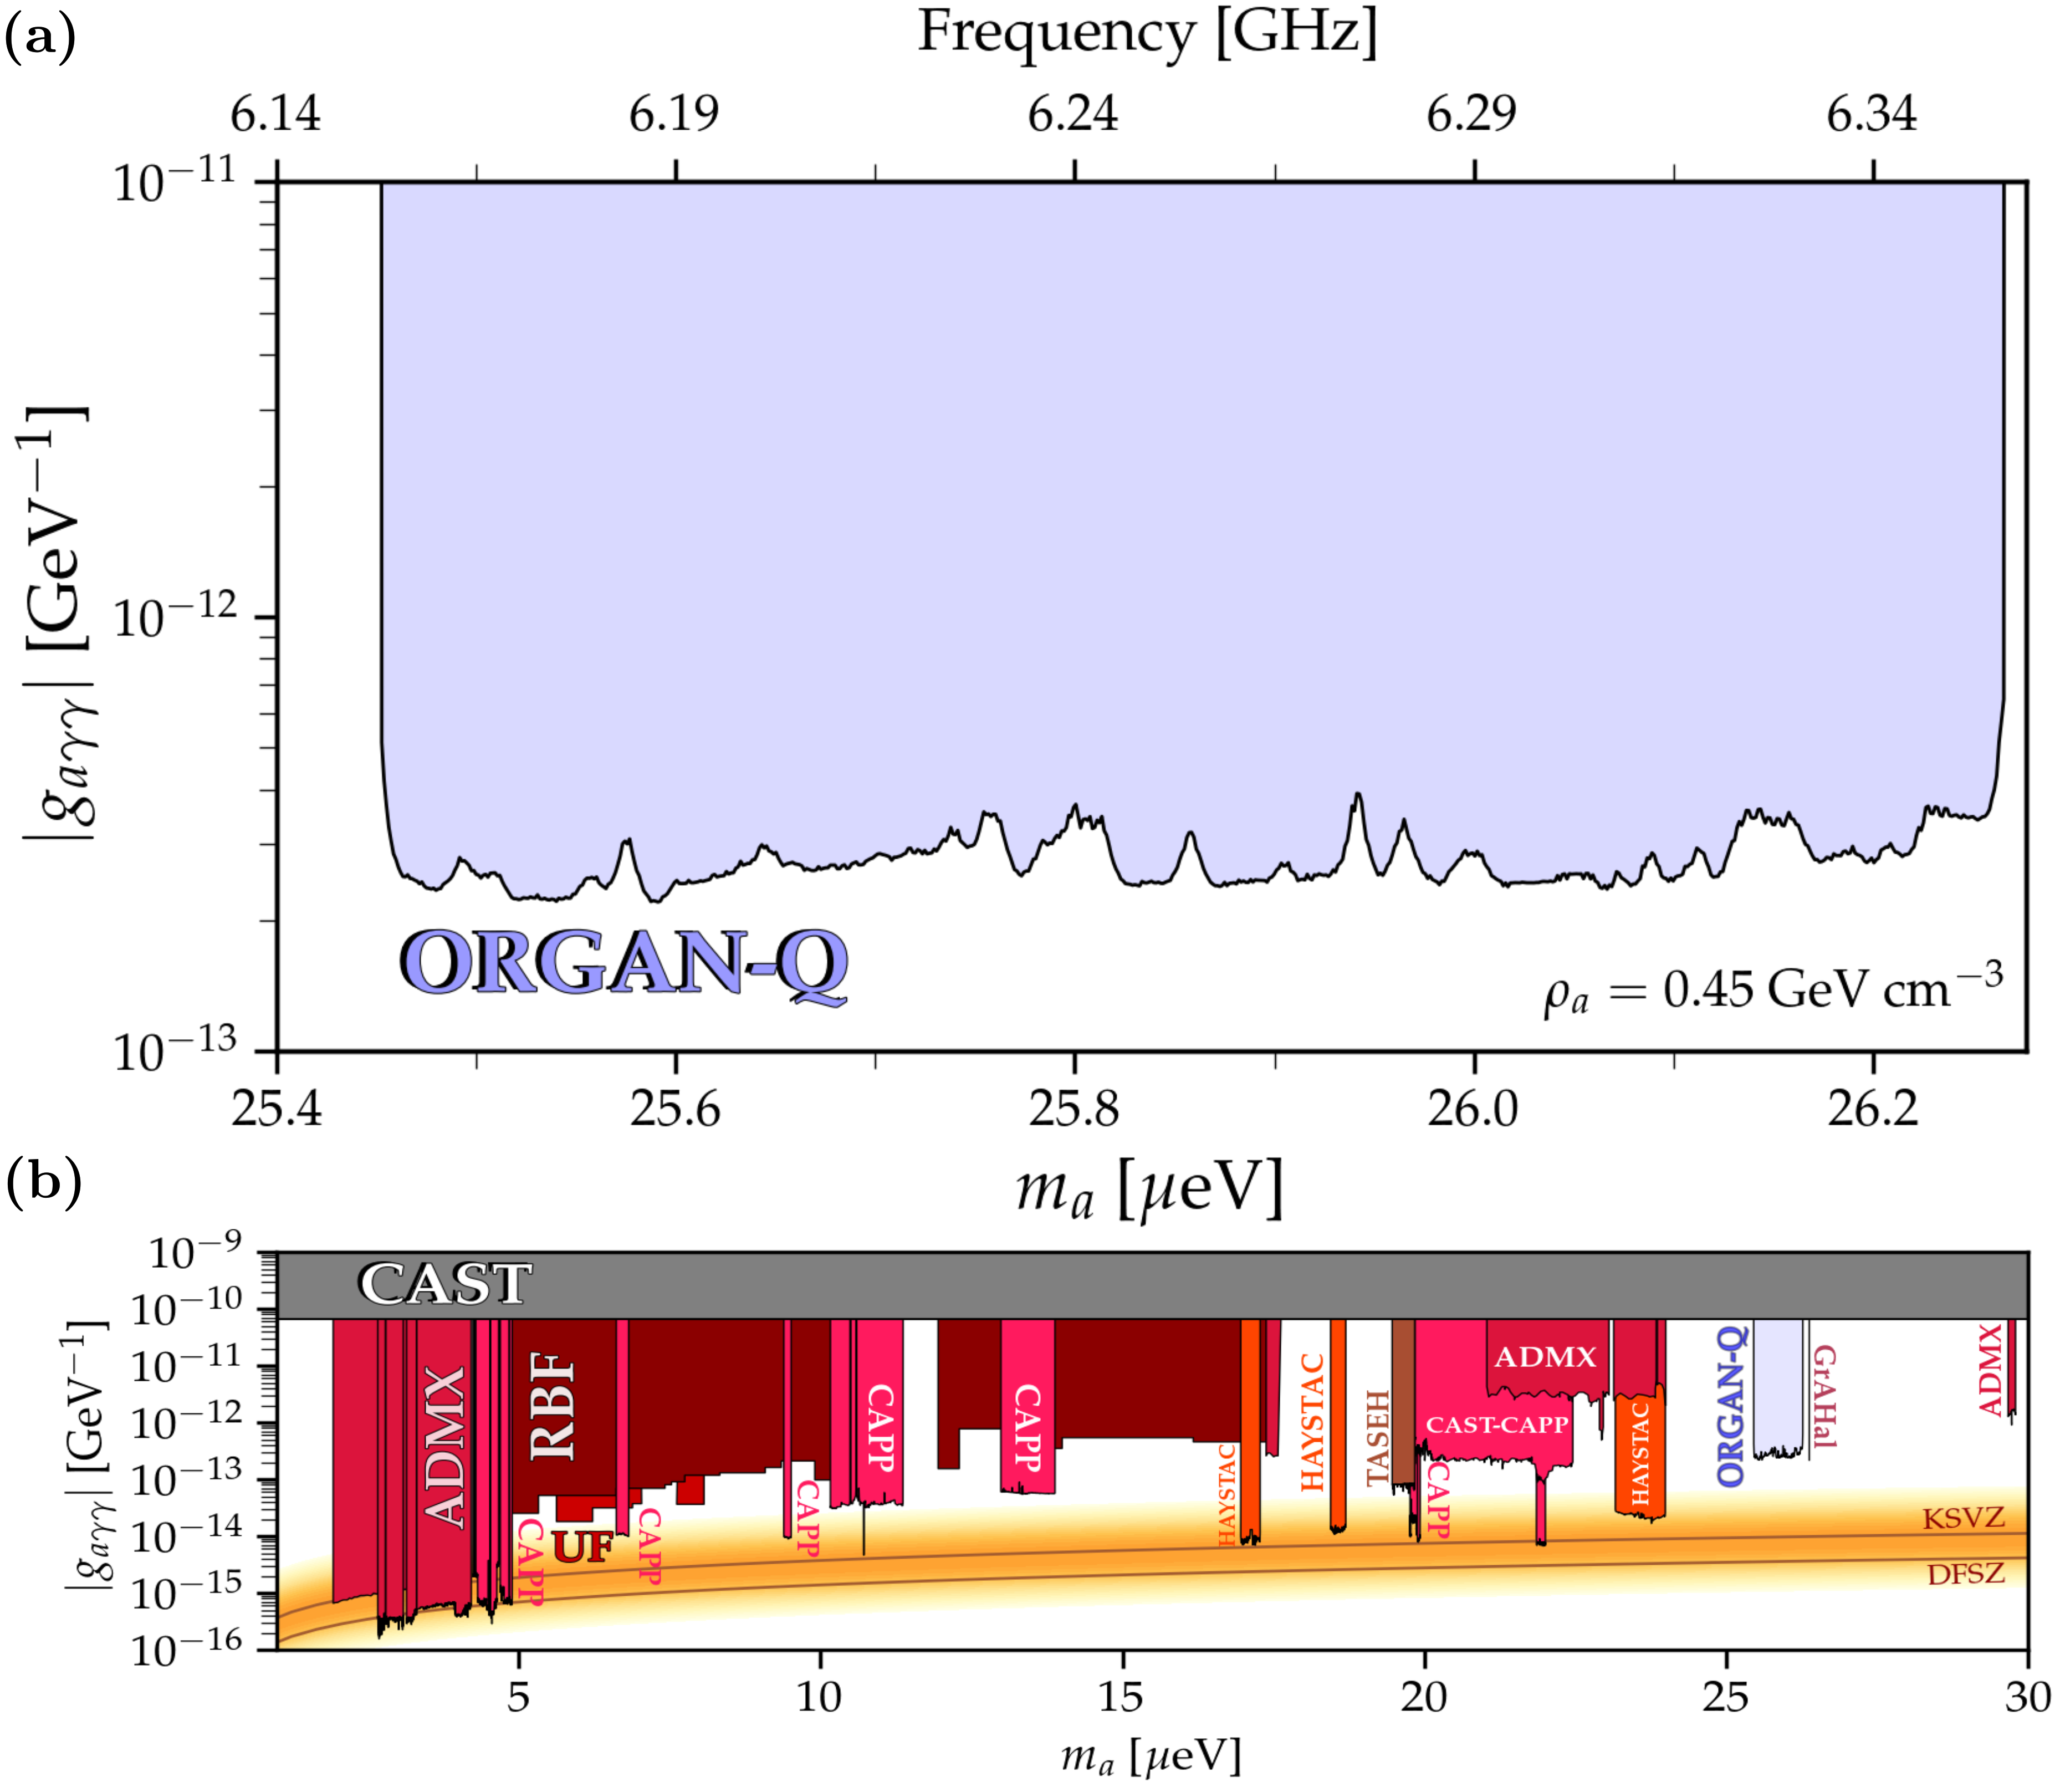
We have reported the results from the first near-quantum limited phase of The ORGAN Experiment, operated at millikelvin temperatures and with a commercially available JPA. It is the most sensitive probe on the axion-photon coupling strength in the mass range between , excluding at a 95% confidence level.
Acknowledgements.
This work is supported by Australian Research Council Grants CE17010009 and CE200100008 as well as the Australian Government’s Research Training Program.References
- Planck Collaboration et al. [2020] Planck Collaboration, N. Aghanim, Y. Akrami, M. Ashdown, J. Aumont, C. Baccigalupi, M. Ballardini, A. J. Banday, R. B. Barreiro, N. Bartolo, S. Basak, R. Battye, K. Benabed, J.-P. Bernard, M. Bersanelli, P. Bielewicz, J. J. Bock, J. R. Bond, J. Borrill, F. R. Bouchet, F. Boulanger, M. Bucher, C. Burigana, R. C. Butler, E. Calabrese, J.-F. Cardoso, J. Carron, A. Challinor, H. C. Chiang, J. Chluba, L. P. L. Colombo, C. Combet, D. Contreras, B. P. Crill, F. Cuttaia, P. De Bernardis, G. De Zotti, J. Delabrouille, J.-M. Delouis, E. Di Valentino, J. M. Diego, O. Doré, M. Douspis, A. Ducout, X. Dupac, S. Dusini, G. Efstathiou, F. Elsner, T. A. Enßlin, H. K. Eriksen, Y. Fantaye, M. Farhang, J. Fergusson, R. Fernandez-Cobos, F. Finelli, F. Forastieri, M. Frailis, A. A. Fraisse, E. Franceschi, A. Frolov, S. Galeotta, S. Galli, K. Ganga, R. T. Génova-Santos, M. Gerbino, T. Ghosh, J. González-Nuevo, K. M. Górski, S. Gratton, A. Gruppuso, J. E. Gudmundsson, J. Hamann, W. Handley, F. K. Hansen, D. Herranz, S. R. Hildebrandt, E. Hivon, Z. Huang, A. H. Jaffe, W. C. Jones, A. Karakci, E. Keihänen, R. Keskitalo, K. Kiiveri, J. Kim, T. S. Kisner, L. Knox, N. Krachmalnicoff, M. Kunz, H. Kurki-Suonio, G. Lagache, J.-M. Lamarre, A. Lasenby, M. Lattanzi, C. R. Lawrence, M. Le Jeune, P. Lemos, J. Lesgourgues, F. Levrier, A. Lewis, M. Liguori, P. B. Lilje, M. Lilley, V. Lindholm, M. López-Caniego, P. M. Lubin, Y.-Z. Ma, J. F. Macías-Pérez, G. Maggio, D. Maino, N. Mandolesi, A. Mangilli, A. Marcos-Caballero, M. Maris, P. G. Martin, M. Martinelli, E. Martínez-González, S. Matarrese, N. Mauri, J. D. McEwen, P. R. Meinhold, A. Melchiorri, A. Mennella, M. Migliaccio, M. Millea, S. Mitra, M.-A. Miville-Deschênes, D. Molinari, L. Montier, G. Morgante, A. Moss, P. Natoli, H. U. Nørgaard-Nielsen, L. Pagano, D. Paoletti, B. Partridge, G. Patanchon, H. V. Peiris, F. Perrotta, V. Pettorino, F. Piacentini, L. Polastri, G. Polenta, J.-L. Puget, J. P. Rachen, M. Reinecke, M. Remazeilles, A. Renzi, G. Rocha, C. Rosset, G. Roudier, J. A. Rubiño-Martín, B. Ruiz-Granados, L. Salvati, M. Sandri, M. Savelainen, D. Scott, E. P. S. Shellard, C. Sirignano, G. Sirri, L. D. Spencer, R. Sunyaev, A.-S. Suur-Uski, J. A. Tauber, D. Tavagnacco, M. Tenti, L. Toffolatti, M. Tomasi, T. Trombetti, L. Valenziano, J. Valiviita, B. Van Tent, L. Vibert, P. Vielva, F. Villa, N. Vittorio, B. D. Wandelt, I. K. Wehus, M. White, S. D. M. White, A. Zacchei, and A. Zonca, Astronomy & Astrophysics 641, A6 (2020).
- Peccei and Quinn [1977a] R. D. Peccei and H. R. Quinn, Physical Review Letters 38, 1440 (1977a).
- Peccei and Quinn [1977b] R. D. Peccei and H. R. Quinn, Physical Review D 16, 1791 (1977b).
- Wilczek [1978] F. Wilczek, Physical Review Letters 40, 279 (1978).
- Weinberg [1978] S. Weinberg, Physical Review Letters 40, 223 (1978).
- Turner [1990a] M. S. Turner, Physics Reports 197, 67 (1990a).
- Dine et al. [1981] M. Dine, W. Fischler, and M. Srednicki, Physics Letters B 104, 199 (1981).
- Sikivie [2008] P. Sikivie (2008) pp. 19–50, arxiv:astro-ph/0610440 .
- Sikivie [1983] P. Sikivie, Physical Review Letters 51, 1415 (1983).
- Kim [1979] J. E. Kim, Physical Review Letters 43, 103 (1979).
- Shifman et al. [1980] M. Shifman, A. Vainshtein, and V. Zakharov, Nuclear Physics B 166, 493 (1980).
- Zhitnitsky [1980] A. R. Zhitnitsky, Soviet Journal of Nuclear Physics [translation of Yadernaya Fizika] 31, 260 (1980).
- Du et al. [2018] N. Du, N. Force, R. Khatiwada, E. Lentz, R. Ottens, L. J. Rosenberg, G. Rybka, G. Carosi, N. Woollett, D. Bowring, A. S. Chou, A. Sonnenschein, W. Wester, C. Boutan, N. S. Oblath, R. Bradley, E. J. Daw, A. V. Dixit, J. Clarke, S. R. O’Kelley, N. Crisosto, J. R. Gleason, S. Jois, P. Sikivie, I. Stern, N. S. Sullivan, D. B. Tanner, G. C. Hilton, and ADMX Collaboration, Physical Review Letters 120, 151301 (2018).
- Braine et al. [2020] T. Braine, R. Cervantes, N. Crisosto, N. Du, S. Kimes, L. J. Rosenberg, G. Rybka, J. Yang, D. Bowring, A. S. Chou, R. Khatiwada, A. Sonnenschein, W. Wester, G. Carosi, N. Woollett, L. D. Duffy, R. Bradley, C. Boutan, M. Jones, B. H. LaRoque, N. S. Oblath, M. S. Taubman, J. Clarke, A. Dove, A. Eddins, S. R. O’Kelley, S. Nawaz, I. Siddiqi, N. Stevenson, A. Agrawal, A. V. Dixit, J. R. Gleason, S. Jois, P. Sikivie, J. A. Solomon, N. S. Sullivan, D. B. Tanner, E. Lentz, E. J. Daw, J. H. Buckley, P. M. Harrington, E. A. Henriksen, K. W. Murch, and ADMX Collaboration, Physical Review Letters 124, 101303 (2020).
- Bartram et al. [2021a] C. Bartram, T. Braine, E. Burns, R. Cervantes, N. Crisosto, N. Du, H. Korandla, G. Leum, P. Mohapatra, T. Nitta, L. J. Rosenberg, G. Rybka, J. Yang, J. Clarke, I. Siddiqi, A. Agrawal, A. V. Dixit, M. H. Awida, A. S. Chou, M. Hollister, S. Knirck, A. Sonnenschein, W. Wester, J. R. Gleason, A. T. Hipp, S. Jois, P. Sikivie, N. S. Sullivan, D. B. Tanner, E. Lentz, R. Khatiwada, G. Carosi, N. Robertson, N. Woollett, L. D. Duffy, C. Boutan, M. Jones, B. H. LaRoque, N. S. Oblath, M. S. Taubman, E. J. Daw, M. G. Perry, J. H. Buckley, C. Gaikwad, J. Hoffman, K. W. Murch, M. Goryachev, B. T. McAllister, A. Quiskamp, C. Thomson, M. E. Tobar, and ADMX Collaboration, Physical Review Letters 127, 261803 (2021a).
- Yi et al. [2023a] A. K. Yi, S. Ahn, Ç. Kutlu, J. Kim, B. R. Ko, B. I. Ivanov, H. Byun, A. F. Van Loo, S. Park, J. Jeong, O. Kwon, Y. Nakamura, S. V. Uchaikin, J. Choi, S. Lee, M. Lee, Y. C. Shin, J. Kim, D. Lee, D. Ahn, S. Bae, J. Lee, Y. Kim, V. Gkika, K. W. Lee, S. Oh, T. Seong, D. Kim, W. Chung, A. Matlashov, S. Youn, and Y. K. Semertzidis, Physical Review Letters 130, 071002 (2023a).
- Ahn et al. [2024] S. Ahn, J. Kim, B. I. Ivanov, O. Kwon, H. Byun, A. F. van Loo, S. Par, J. Jeong, S. Lee, J. Kim, Ç. Kutlu, A. K. Yi, Y. Nakamura, S. Oh, D. Ahn, S. Bae, H. Choi, J. Choi, Y. Chong, W. Chung, V. Gkika, J. E. Kim, Y. Kim, B. R. Ko, L. Miceli, D. Lee, J. Lee, K. W. Lee, M. Lee, A. Matlashov, P. Parashar, T. Seong, Y. C. Shin, S. V. Uchaikin, S. Youn, and Y. K. Semertzidis, “Extensive search for axion dark matter over 1\,GHz with CAPP’s Main Axion eXperiment,” (2024), arxiv:2402.12892 [hep-ex, physics:hep-ph] .
- Borsanyi et al. [2016] S. Borsanyi, Z. Fodor, J. Guenther, K.-H. Kampert, S. D. Katz, T. Kawanai, T. G. Kovacs, S. W. Mages, A. Pasztor, F. Pittler, J. Redondo, A. Ringwald, and K. K. Szabo, Nature 539, 69 (2016).
- Dine et al. [2017] M. Dine, P. Draper, L. Stephenson-Haskins, and D. Xu, Physical Review D 96, 095001 (2017).
- Buschmann et al. [2022] M. Buschmann, J. W. Foster, A. Hook, A. Peterson, D. E. Willcox, W. Zhang, and B. R. Safdi, Nature Communications 13, 1049 (2022).
- Ballesteros et al. [2019] G. Ballesteros, J. Redondo, A. Ringwald, and C. Tamarit, Frontiers in Astronomy and Space Sciences 6, 55 (2019).
- Berkowitz et al. [2015] E. Berkowitz, M. I. Buchoff, and E. Rinaldi, Physical Review D 92, 034507 (2015).
- [23] “Direct search for dark matter axions excluding ALP cogenesis in the 63- to 67-eV range with the ORGAN experiment,” https://www.science.org/doi/epdf/10.1126/sciadv.abq3765.
- Quiskamp et al. [2024] A. Quiskamp, B. T. McAllister, P. Altin, E. N. Ivanov, M. Goryachev, and M. E. Tobar, Physical Review Letters 132, 031601 (2024).
- McAllister et al. [2017] B. T. McAllister, G. Flower, E. N. Ivanov, M. Goryachev, J. Bourhill, and M. E. Tobar, Physics of the Dark Universe 18, 67 (2017).
- Brubaker et al. [2017a] B. M. Brubaker, L. Zhong, Y. V. Gurevich, S. B. Cahn, S. K. Lamoreaux, M. Simanovskaia, J. R. Root, S. M. Lewis, S. Al Kenany, K. M. Backes, I. Urdinaran, N. M. Rapidis, T. M. Shokair, K. A. Van Bibber, D. A. Palken, M. Malnou, W. F. Kindel, M. A. Anil, K. W. Lehnert, and G. Carosi, Physical Review Letters 118, 061302 (2017a).
- Backes et al. [2021] K. M. Backes, D. A. Palken, S. A. Kenany, B. M. Brubaker, S. B. Cahn, A. Droster, G. C. Hilton, S. Ghosh, H. Jackson, S. K. Lamoreaux, A. F. Leder, K. W. Lehnert, S. M. Lewis, M. Malnou, R. H. Maruyama, N. M. Rapidis, M. Simanovskaia, S. Singh, D. H. Speller, I. Urdinaran, L. R. Vale, E. C. Van Assendelft, K. Van Bibber, and H. Wang, Nature 590, 238 (2021).
- Jewell et al. [2023] M. J. Jewell, A. F. Leder, K. M. Backes, X. Bai, K. Van Bibber, B. M. Brubaker, S. B. Cahn, A. Droster, M. H. Esmat, S. Ghosh, E. Graham, G. C. Hilton, H. Jackson, C. Laffan, S. K. Lamoreaux, K. W. Lehnert, S. M. Lewis, M. Malnou, R. H. Maruyama, D. A. Palken, N. M. Rapidis, E. P. Ruddy, M. Simanovskaia, S. Singh, D. H. Speller, L. R. Vale, H. Wang, Y. Zhu, and HAYSTAC Collaboration, Physical Review D 107, 072007 (2023).
- Alesini et al. [2019] D. Alesini, C. Braggio, G. Carugno, N. Crescini, D. D’Agostino, D. Di Gioacchino, R. Di Vora, P. Falferi, S. Gallo, U. Gambardella, C. Gatti, G. Iannone, G. Lamanna, C. Ligi, A. Lombardi, R. Mezzena, A. Ortolan, R. Pengo, N. Pompeo, A. Rettaroli, G. Ruoso, E. Silva, C. C. Speake, L. Taffarello, and S. Tocci, Physical Review D 99, 101101 (2019).
- Alesini et al. [2021] D. Alesini, C. Braggio, G. Carugno, N. Crescini, D. D’Agostino, D. Di Gioacchino, R. Di Vora, P. Falferi, U. Gambardella, C. Gatti, G. Iannone, C. Ligi, A. Lombardi, G. Maccarrone, A. Ortolan, R. Pengo, A. Rettaroli, G. Ruoso, L. Taffarello, and S. Tocci, Physical Review D 103, 102004 (2021).
- Caldwell et al. [2017] A. Caldwell, G. Dvali, B. Majorovits, A. Millar, G. Raffelt, J. Redondo, O. Reimann, F. Simon, F. Steffen, and MADMAX Working Group, Physical Review Letters 118, 091801 (2017).
- Chang et al. [2022] H. Chang, J.-Y. Chang, Y.-C. Chang, Y.-H. Chang, Y.-H. Chang, C.-H. Chen, C.-F. Chen, K.-Y. Chen, Y.-F. Chen, W.-Y. Chiang, W.-C. Chien, H. T. Doan, W.-C. Hung, W. Kuo, S.-B. Lai, H.-W. Liu, M.-W. OuYang, P.-I. Wu, S.-S. Yu, and TASEH Collaboration, Physical Review D 106, 052002 (2022).
- Melcón et al. [2018] A. Á. Melcón, S. A. Cuendis, C. Cogollos, A. Díaz-Morcillo, B. Döbrich, J. D. Gallego, B. Gimeno, I. G. Irastorza, A. J. Lozano-Guerrero, C. Malbrunot, P. Navarro, C. P. Garay, J. Redondo, T. Vafeiadis, and W. Wuensch, Journal of Cosmology and Astroparticle Physics 2018, 040 (2018).
- Álvarez Melcón et al. [2021] A. Álvarez Melcón, S. Arguedas Cuendis, J. Baier, K. Barth, H. Bräuninger, S. Calatroni, G. Cantatore, F. Caspers, J. F. Castel, S. A. Cetin, C. Cogollos, T. Dafni, M. Davenport, A. Dermenev, K. Desch, A. Díaz-Morcillo, B. Döbrich, H. Fischer, W. Funk, J. D. Gallego, J. M. García Barceló, A. Gardikiotis, J. G. Garza, B. Gimeno, S. Gninenko, J. Golm, M. D. Hasinoff, D. H. H. Hoffmann, I. G. Irastorza, K. Jakovčić, J. Kaminski, M. Karuza, B. Lakić, J. M. Laurent, A. J. Lozano-Guerrero, G. Luzón, C. Malbrunot, M. Maroudas, J. Miralda-Escudé, H. Mirallas, L. Miceli, P. Navarro, A. Ozbey, K. Özbozduman, C. Peña Garay, M. J. Pivovaroff, J. Redondo, J. Ruz, E. Ruiz Chóliz, S. Schmidt, M. Schumann, Y. K. Semertzidis, S. K. Solanki, L. Stewart, I. Tsagris, T. Vafeiadis, J. K. Vogel, E. Widmann, W. Wuensch, and K. Zioutas, Journal of High Energy Physics 2021, 75 (2021).
- Kim et al. [2024] Y. Kim, J. Jeong, S. Youn, S. Bae, K. Lee, A. F. van Loo, Y. Nakamura, S. Oh, T. Seong, S. Uchaikin, J. E. Kim, and Y. K. Semertzidis, “Experimental search for invisible dark matter axions around 22 ev,” (2024), arXiv:2312.11003 [hep-ex] .
- Grenet et al. [2021] T. Grenet, R. Ballou, Q. Basto, K. Martineau, P. Perrier, P. Pugnat, J. Quevillon, N. Roch, and C. Smith, (2021), 10.48550/ARXIV.2110.14406.
- Ranzani et al. [2022] L. Ranzani, G. Ribeill, B. Hassick, and K. C. Fong, in 2022 IEEE International Conference on Quantum Computing and Engineering (QCE) (IEEE, Broomfield, CO, USA, 2022) pp. 314–319.
- Grebel et al. [2021] J. Grebel, A. Bienfait, É. Dumur, H.-S. Chang, M.-H. Chou, C. R. Conner, G. A. Peairs, R. G. Povey, Y. P. Zhong, and A. N. Cleland, Applied Physics Letters 118, 142601 (2021).
- Roy et al. [2015] T. Roy, S. Kundu, M. Chand, A. M. Vadiraj, A. Ranadive, N. Nehra, M. P. Patankar, J. Aumentado, A. A. Clerk, and R. Vijay, Applied Physics Letters 107, 262601 (2015).
- Turner [1990b] M. S. Turner, Physical Review D 42, 3572 (1990b).
- Brubaker et al. [2017b] B. M. Brubaker, L. Zhong, S. K. Lamoreaux, K. W. Lehnert, and K. A. Van Bibber, Physical Review D 96, 123008 (2017b).
- Bartram et al. [2021b] C. Bartram, T. Braine, R. Cervantes, N. Crisosto, N. Du, G. Leum, L. J. Rosenberg, G. Rybka, J. Yang, D. Bowring, A. S. Chou, R. Khatiwada, A. Sonnenschein, W. Wester, G. Carosi, N. Woollett, L. D. Duffy, M. Goryachev, B. McAllister, M. E. Tobar, C. Boutan, M. Jones, B. H. LaRoque, N. S. Oblath, M. S. Taubman, J. Clarke, A. Dove, A. Eddins, S. R. O’Kelley, S. Nawaz, I. Siddiqi, N. Stevenson, A. Agrawal, A. V. Dixit, J. R. Gleason, S. Jois, P. Sikivie, J. A. Solomon, N. S. Sullivan, D. B. Tanner, E. Lentz, E. J. Daw, M. G. Perry, J. H. Buckley, P. M. Harrington, E. A. Henriksen, K. W. Murch, and ADMX Collaboration, Physical Review D 103, 032002 (2021b).
- Kwon et al. [2021] O. Kwon, D. Lee, W. Chung, D. Ahn, H. Byun, F. Caspers, H. Choi, J. Choi, Y. Chong, H. Jeong, J. Jeong, J. E. Kim, J. Kim, Ç. Kutlu, J. Lee, M. Lee, S. Lee, A. Matlashov, S. Oh, S. Park, S. Uchaikin, S. Youn, and Y. K. Semertzidis, Physical Review Letters 126, 191802 (2021).
- Yoon et al. [2022] H. Yoon, M. Ahn, B. Yang, Y. Lee, D. Kim, H. Park, B. Min, and J. Yoo, Physical Review D 106, 092007 (2022).
- Sikivie [1998] P. Sikivie, Physics Letters B 432, 139 (1998).
- Sikivie [2003] P. Sikivie, Physics Letters B 567, 1 (2003).
- Duffy and Sikivie [2008] L. D. Duffy and P. Sikivie, Physical Review D 78, 063508 (2008).
- Chakrabarty et al. [2021] S. S. Chakrabarty, Y. Han, A. H. Gonzalez, and P. Sikivie, Physics of the Dark Universe 33, 100838 (2021).
- O’Hare et al. [2023] C. A. J. O’Hare, G. Pierobon, and J. Redondo, “Axion minicluster streams in the solar neighbourhood,” (2023), arxiv:2311.17367 [astro-ph, physics:hep-ph] .
- Yi et al. [2023b] A. K. Yi, S. Ahn, B. R. Ko, and Y. K. Semertzidis, Journal of High Energy Physics 2023, 115 (2023b).
- CAST Collaboration [2017] CAST Collaboration, Nature Physics 13, 584 (2017).
- Bartram et al. [2023] C. Bartram, T. Braine, R. Cervantes, N. Crisosto, N. Du, G. Leum, P. Mohapatra, T. Nitta, L. J. Rosenberg, G. Rybka, J. Yang, J. Clarke, I. Siddiqi, A. Agrawal, A. V. Dixit, M. H. Awida, A. S. Chou, M. Hollister, S. Knirck, A. Sonnenschein, W. Wester, J. R. Gleason, A. T. Hipp, S. Jois, P. Sikivie, N. S. Sullivan, D. B. Tanner, E. Lentz, R. Khatiwada, G. Carosi, C. Cisneros, N. Robertson, N. Woollett, L. D. Duffy, C. Boutan, M. Jones, B. H. LaRoque, N. S. Oblath, M. S. Taubman, E. J. Daw, M. G. Perry, J. H. Buckley, C. Gaikwad, J. Hoffman, K. Murch, M. Goryachev, B. T. McAllister, A. Quiskamp, C. Thomson, M. E. Tobar, V. Bolkhovsky, G. Calusine, W. Oliver, and K. Serniak, Review of Scientific Instruments 94, 044703 (2023).
- Boutan et al. [2018] C. Boutan, M. Jones, B. H. LaRoque, N. S. Oblath, R. Cervantes, N. Du, N. Force, S. Kimes, R. Ottens, L. J. Rosenberg, G. Rybka, J. Yang, G. Carosi, N. Woollett, D. Bowring, A. S. Chou, R. Khatiwada, A. Sonnenschein, W. Wester, R. Bradley, E. J. Daw, A. Agrawal, A. V. Dixit, J. Clarke, S. R. O’Kelley, N. Crisosto, J. R. Gleason, S. Jois, P. Sikivie, I. Stern, N. S. Sullivan, D. B. Tanner, P. M. Harrington, E. Lentz, and ADMX Collaboration, Physical Review Letters 121, 261302 (2018).
- Kim et al. [2023] J. Kim, O. Kwon, Ç. Kutlu, W. Chung, A. Matlashov, S. Uchaikin, A. F. Van Loo, Y. Nakamura, S. Oh, H. Byun, D. Ahn, and Y. K. Semertzidis, Physical Review Letters 130, 091602 (2023).
Supplementary Material for: Near-quantum limited axion dark matter search with the ORGAN experiment around 26 eV
Aaron P. Quiskamp,1,* Graeme R. Flower,1 Steven Samuels,1 Ben T. McAllister,1,2, Paul Altin,3 Eugene N. Ivanov,1 Maxim Goryachev,1 Michael E. Tobar1,
1Quantum Technologies and Dark Matter Laboratory,
Department of Physics, University of Western Australia,
35 Stirling Highway, Crawley WA 6009, Australia.
2ARC Centre of Excellence for Dark Matter Particle Physics,
Swinburne University of Technology, John St, Hawthorn VIC 3122, Australia
3ARC Centre of Excellence For Engineered Quantum Systems,
The Australian National University, Canberra ACT 2600 Australia
I JPA characterisation
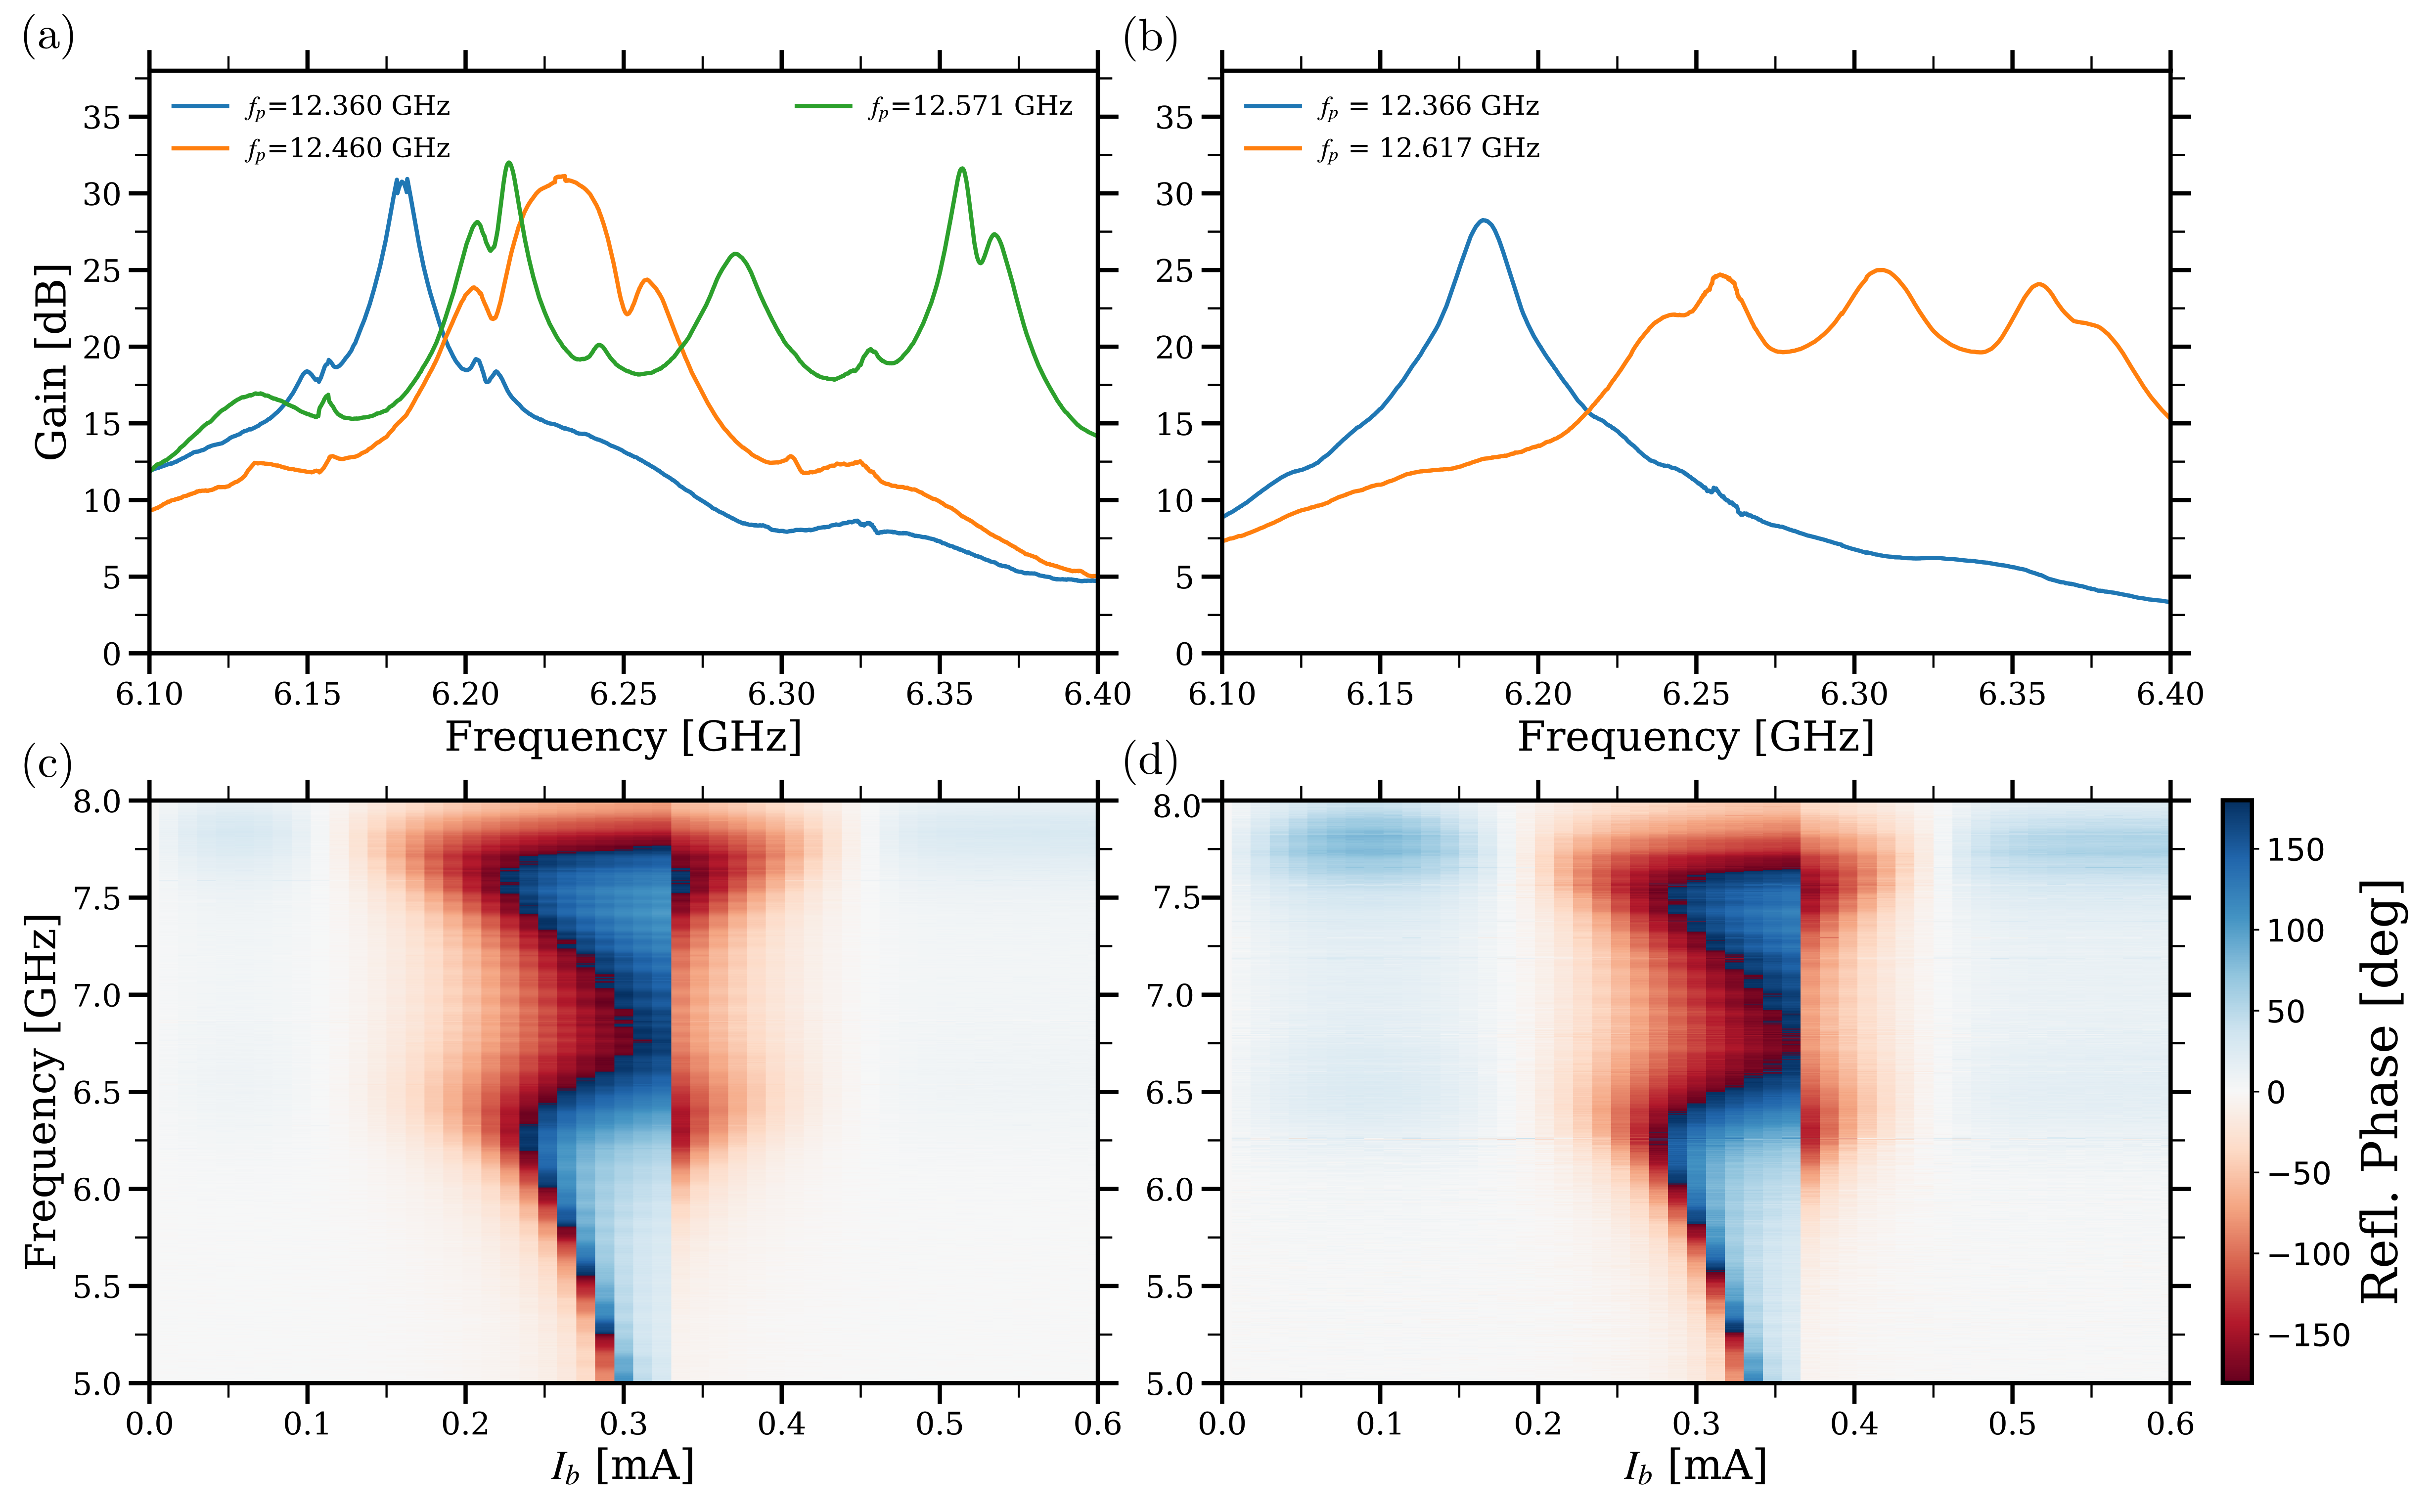
Supplementing the main text, some further details as to the characterisation and use of the JPA are provided. As discussed in the main text, the first stage amplifier used in the experimental run was a commercially available JPA from Raytheon [37]. Due to the non-standard nature of the input coupling (a broadband impedance transformer to the junction resonator), the JPA is operated in a different way to typical capacitively coupled JPAs. This has the significant benefit of producing broadband gain beyond the gain bandwidth product - but does complicate tune up, as optimal gain and noise performance is often achieved with pump tones significantly detuned from resonance.
| (mA) | (GHz) | (dBm) | (GHz) |
|---|---|---|---|
| 12th Feb - 27th Feb | |||
| 0.235 | 12.36 | -48.9 | 6.15-6.195 |
| 0.228 | 12.46 | -41.6 | 6.195-6.275 |
| 0.228 | 12.571 | -39.7 | 6.275-6.35 |
| 6th March - 10th March | |||
| 0.264 | 12.366 | -49.1 | 6.14-6.20 |
| 0.252 | 12.617 | -40.6 | 6.2-6.35 |
The junction is in a SQUID configuration, with flux through the loop driven by the pump port, whilst DC current applied to the flux port tunes the JPA resonance. Due to the resonance being highly over-coupled to a 50 load, it is characterized via the normalised reflected phase as shown in Fig. 4.
As the device is cooled from above the transition temperature of aluminium (approximately 1.2K) to below, it traps a random quantity of flux in the SQUID loop resulting in small changes to the tuning parameters of the device compared to previous cools, requiring re-characterisation each time the device makes that transition. Unfortunately, due to magnet quenches that occurred during the run resulting in a rapid warm up of the dilution refrigerator, the JPA required re-characterisation. A list of JPA pump and bias parameters used over particular frequencies is presented in table 2. Additionally, gains associated with these pump and bias parameters are noted in Fig. 4.
II Data Analysis
As discussed in the main text, we follow the HAYSTAC analysis procedure [41]. The analysis window is restricted to an IF bandwidth of , and the cropped spectra are subsequently normalized using a Savitsky-Golay (SG) filter with a 101-point window and a polynomial degree of 4. The SG filter removes the slowly varying baseline from the raw spectra whilst preserving narrow spectral features on the scale of the axion width . Overlapping power spectra are then vertically combined using a maximum likelihood weighted sum of contributing spectra to maximize the SNR. The weights for this sum are determined according to the expected axion power in the th IF bin of the th spectrum and the bin-dependent value.
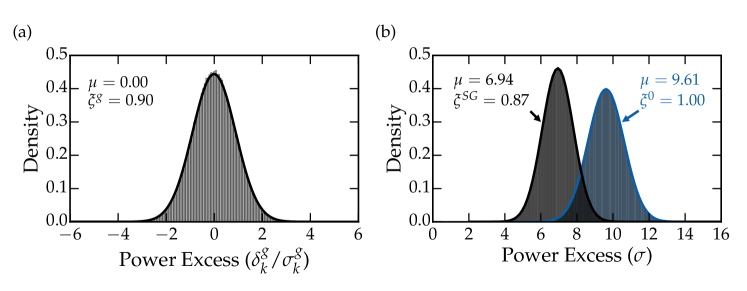
The “grand power spectrum” is constructed by optimally filtering sets of 9 consecutive bins with the expected Maxwellian lineshape in the boosted lab frame, retaining of the axion signal [41]. The standard deviation for the th grand spectrum bin is then the quadrature weighted sum of contributing combined spectra standard deviations, denoted as . The grand power spectra are normalized to and shown histogrammed in panel (a) of Fig. 5. The width of this distribution is reduced to due to the negative correlations induced by the SG filter among neighbouring bins. The SG filter is also known to attenuate potential axion signals, and is a function of the choice of filter parameters. This effect is simulated 1,000,000 times by injecting synthetic axions into the ORGAN-Q analysis pipeline and comparing it with unfiltered data [41, 23]. The result is shown in panel (b) of Fig. 5, where the ratio of the two means gives the SG-filter-induced attenuation. This factor is reduced by to give , which represents the total reduction in SNR of each grand bin to a given axion signal [41]. To validate the simulation, we also compute analytically based on the recent work in [50], and find .
We chose to forgo rescans due to multiple magnet quenches during the data-taking run, which significantly extended the experimental time. Bin-by-bin exclusion limits on axion-photon coupling are placed based on the maximum normalized power excess of , which corresponds to an SNR target of at 95% confidence level [41]. Exclusion limits are then calculated based on that and presented in the main text.