Accretion properties of soft X-ray transient XTE J1856+053 during its 2023 Outburst
Abstract
Soft X-ray transients are a subclass of the low mass X-ray binaries that occasionally show a sudden rise in their soft X-ray luminosity; otherwise, they remain in an extremely faint state. We investigate the accretion properties of the soft X-ray transient XTE J1856+053 during its 2023 outburst obtained by NICER and NuSTAR data in July. We present detailed results on the timing and spectral analysis of the X-ray emission during the outburst. The power spectral density shows no quasi-periodic oscillation features. The source’s spectrum on July 19 can be well-fitted with a multi-color blackbody component, a power-law component, and a reflection component with a broadened iron emission line. NICER spectra can be well-fitted by considering a combination of a blackbody and a power-law. The source exhibits a transition within just five days from a soft state to an intermediate state during the outburst decline phase. The inner accretion disk has a low inclination angle (). The spectral analysis also suggests a high-spin () BH as the central accreting object.
1 Introduction
X-ray binaries (XRBs) are astrophysical systems emitting high levels of X-ray radiation, comprising a normal star and a compact object, which can be either a black hole (BH) or a neutron star (NS). The categorization of XRBs into high-mass (HMXBs) and low-mass (LMXBs) depends upon the mass of the companion star (White et al., 1995; Remillard & McClintock, 2006). Specifically, HMXBs feature companion stars of O- or B-type, while LMXBs involve A-type or later stars (Tetarenko et al., 2016). While HMXBs generally exhibit sustained brightness, a substantial portion of LMXBs display transient behavior. LMXBs may remain in a state of quiescence, falling below the detection threshold of monitoring instruments, for extensive periods before transitioning into a transient phase marked by a sudden increase of flux (called an outburst). This increase in flux endures for a span of weeks to months, followed by a gradual decline. An updated catalog 111http://astro.uni-tuebingen.de/ xrbcat/222https://binary-revolution.github.io/ of the LMXBs and HMXBs can be found in Fortin et al. (2022, 2023); Avakyan et al. (2023); Neumann et al. (2023).
During an outburst, the spectral composition of a black hole X-ray binary (BHXRB) is primarily attributed to two key components: a multi-color disk blackbody and a power-law tail. The thin Keplerian accretion disk (Shakura & Sunyaev, 1973; Novikov & Thorne, 1973) around a BH is considered to be composed of annular regions with different temperatures, each radiating thermally, and its total spectrum is approximated by a multi-color disk blackbody (Mitsuda et al., 1984). The origin of the power law tail is considered to be from a hot Compton corona (Sunyaev & Titarchuk, 1980, 1985). Inverse Comptonization of the soft X-ray photons from the accretion disk by the hot electrons in the Compton cloud contributes to the high energy non-thermal emission from the XRB (Haardt & Maraschi, 1993; Zdziarski et al., 1993; Titarchuk, 1994; Chakrabarti & Titarchuk, 1995; Życki et al., 1999). As the outburst progresses, the relative contribution of these two primary components changes. These dynamic events encompass several distinctive spectral phases (Fender et al., 2004; Remillard & McClintock, 2006; Done et al., 2007).
At the onset of an outburst, the system enters a hard state (HS) characterized by a dominant hard power-law component, possibly accompanied by the presence of a steady jet (Fender et al., 2004; Belloni, 2010). As the rate of accretion intensifies, the source transitions through a hard and soft intermediate state (HIMS and SIMS) before eventually reaching a soft state (SS). In this latter phase, the accretion disk predominantly governs the emission, resulting in a considerably softer power-law component, while the jet activity subsides (Miyamoto et al., 1991; Remillard & McClintock, 2006). This soft state persists until the late fading stages of the outburst, after which the system reverts to an intermediate state with a lower intensity compared to the preceding intermediate phase (Homan et al., 2001). Finally, at the end of the outburst, the system reverts back to the hard state. This cyclical progression traces a counterclockwise ‘q’-shaped trajectory in the hardness-intensity diagram (HID) (Homan & Belloni, 2005; Belloni et al., 2005; Nandi et al., 2012).
Low-frequency quasi-periodic oscillations (LFQPOs) are a very common observable feature in the power density spectrum (PDS) of stellar-mass BHs. A few BHs exhibit high-frequency QPOs in their PDSs. The frequency of the QPOs in these transient X-ray sources ranges from mHz to a few hundred. In general, LFQPOs are classified into three types (A, B, C) based on the centroid frequency, Q-value, noise, and root-mean-square (rms) amplitude (Casella et al., 2005). It is observed that these LFQPOs correlated with the spectral states (Remillard & McClintock, 2006).
Not all BHXRB systems follow the typical ‘q’ pattern observed in the HID during outbursts. Some transient systems undergo ‘hard-only’ outbursts, where the source remains in the HS throughout the outburst or transitions only as far as the IMS without reaching the softer thermally dominant states (e.g.,Hynes et al. 2000, Brocksopp et al. 2001, Belloni et al. 2002, Sidoli et al. 2011, Curran & Chaty 2013, Chatterjee et al. 2019, Alabarta et al. 2021). This behavior is also observed in some persistently accreting systems, which either remain in the HS for extended periods or periodically undergo incomplete state transitions (Churazov et al., 1993; del Santo et al., 2004; Soleri et al., 2012; Froning et al., 2014; Tetarenko et al., 2016; Debnath et al., 2020; Chatterjee et al., 2021).
Soft X-ray transients (SXTs) are a subclass of XRBs, characterized by their episodic and dramatic increases in soft (low-energy) X-ray luminosity (Tanaka & Shibazaki, 1996). SXTs show a soft X-ray spectrum during outbursts, with the emission primarily from the accretion disk. Typically, SXTs consist of a compact object, such as a NS or a BH, accreting material from a companion star via an accretion disk (Charles & Coe, 2006; Remillard & McClintock, 2006). SXTs, particularly those containing BHs, often remain undetected until an outburst occurs. During such an outburst, the soft X-ray luminosity of an SXT can increase by several orders of magnitude ( erg s-1), ranging from hundreds to thousands of times the quiescent level ( erg s-1) (Chen et al., 1997; Esin et al., 1997; Lasota, 2001; Tetarenko et al., 2016). Typically, these outbursts exhibit a rapid rise in luminosity over a few days, followed by a slower decline that spans approximately 30 days, often accompanied by a rebrightening phase in the X-ray light curve (Chen et al., 1997). These outbursts are believed to be triggered by thermal-viscous instabilities within the accretion disk, leading to rapid accretion onto the compact object and subsequent X-ray emission (Lasota, 2001; Dubus et al., 2001).
SXTs play a crucial role in understanding accretion processes, compact object formation, and the physics of extreme environments (Remillard & McClintock, 2006). The study of SXTs has provided insights into the nature of accretion disks, jet formation, and the properties of BHs and NSs (Casares et al., 1992; McClintock & Remillard, 2003; Fender et al., 2004).
The SXT, XTE J1856+053 was initially discovered during a survey of the Galactic ridge in 1996 using the RXTE/PCA instrument (Marshall et al., 1996). The source has exhibited intriguing outburst behavior over the years. The 1996 outburst displayed a distinctive light curve with two prominent peaks. The first peak, starting on April 4, 1996 (MJD 50177), demonstrated a symmetric rise and decline, lasting for 27 days and reaching a flux of 75 mCrab ( erg s-1) in the 2–12 keV energy range. Following this, the second peak, displaying a fast rise–slow decay (FRED) profile began on September 9, 1996 (MJD 50335), extended over 70 days, and reached its maximum flux of 79 mCrab ( erg s-1). This second X-ray peak was preceded by a precursor event 8 days earlier, featuring a flux of 30–60 mCrab ( erg s-1) in higher energies (20–100 keV), as detected by BATSE on September 7–9, 1996 (MJD 50333–50335, Barret et al. 1996).
In February 2007, a new outburst of XTE J1856+053 was observed, again with two peaks. This 2007 outburst was detected by RXTE (Levine & Remillard, 2007) and featured a precursor event occurring on January 10–15, 2007 (MJD 54110–54115). The first peak of the 2007 outburst began on February 28, 2007 (MJD 54159), achieving a maximum flux of approximately 85 mCrab on March 12, 2007 (MJD 54171), and extended for about 65 days. The subsequent peak started on May 21, 2007 (MJD 54241), exhibiting a rapid rise to approximately 110 mCrab within 7 days and lasting for approximately 55 days. Similar to the 1996 outburst, both peaks in 2007 were preceded by hard X-ray precursor events detected by Swift/BAT in the energy range of 10–200 keV, occurring from February 22 to March 1, 2007 (MJD 54153–54160), and on May 28–30, 2007 (MJD 54248–54250, Krimm et al. 2007). Furthermore, the hardness vs. intensity diagrams of both the 1996 and 2007 outbursts exhibited remarkable similarities.
A detailed study of the X-ray characteristics of XTE J1856+053 during its outburst events in 2007 using XMM-Newton Target of Opportunity (ToO) observation conducted on March 14, 2007, was done by Sala et al. (2008). It is noted that the X-ray light curve for both outbursts exhibited two distinct peaks (Sala et al., 2008). The X-ray spectrum of XTE J1856+053 was modeled using a thermal accretion disk model, revealing a central temperature () of keV and a foreground absorption column density () of . The authors have considered infrared (IR) upper limits along with the high value to infer that XTE J1856+053 is most probably a BH.
Another outburst was reported in 2020 (Negoro et al., 2015) using MAXI/GSC. The recent outburst was reported on July 12. 2023 by MAXI/GSC, and it is suggested that the outburst started on July 9, 2023 (Kobayashi et al., 2023).
In this paper, we study the outburst of XTE J1856+053 in the 2023. The paper is organized in the following way. In the next section (§2), we describe the observation and data reduction procedures. In Section §3, we present the timing and spectral results. We discuss our results in Section §4 and make a summary of the results in Section §5.
| Satellite/ | Obs ID | Date | MJD Start | MJD End | Avg MJD | Exposure |
|---|---|---|---|---|---|---|
| Instrument | (dd-mm-yyyy) | Time (ks) | ||||
| Col. 1 | Col. 2 | Col. 3 | Col. 4 | Col. 5 | Col. 6 | Col. 7 |
| NuSTAR | 90901325002 (NuSTAR) | 19-07-2023 | 60144.065 | 60144.771 | 60144.418 | 30.892 |
| NICER | 6100560101 (NICER1) | 14-07-2023 | 60139.024 | 60139.543 | 60139.284 | 2.146 |
| 6100560102 (NICER2) | 15-07-2023 | 60140.237 | 60140.633 | 60140.435 | 1.440 | |
| 6100560103 (NICER3) | 16-07-2023 | 60141.400 | 60141.668 | 60141.534 | 2.281 | |
| 6100560104 (NICER4) | 19-07-2023 | 60144.051 | 60144.768 | 60144.409 | 4.591 |
The details of the studied observations. The columns. 1, 2 & 3 represent the satellites, observation IDs, and observation date, respectively. The start, the end and the average of the observations (in MJD) are given in Cols. 4, 5, and 6. The corresponding exposure time (in ks) is given in Col. 7. The only NuSTAR observation (90901325002) is combined with the NICER4 observation (6100560104) of the same day (July 19, 2023) for spectral study.
2 Observations and Data Reduction
We used the archival data of four NICER observations and one NuSTAR observation of XTE J1856+053 during its 2023 X-ray activity. The publicly available data were downloaded from the HeaSARC website 333https://heasarc.gsfc.nasa.gov/cgi-bin/W3Browse/w3browse.pl. The detailed observation log is given in Table 1.
2.1 NuSTAR
NuSTAR observed XTE J1856+053 on July 19, 2023. NuSTAR consists of two identical focal plane modules- FPMA and FPMB (Harrison et al., 2013). The NuSTAR raw data was reprocessed using the NuSTAR Data Analysis Software (NuSTARDAS version 2.1.2). Calibrated and cleaned event files were generated by nupipeline task. We used 20200912 version of calibration files from NuSTAR calibration database444http://heasarc.gsfc.nasa.gov/FTP/caldb/data/nustar/fpm/. We used 40” circular regions for extracting the source, while the background region was selected with 60” circle far from the source. The light curves and spectra were produced from the cleaned science mode event files through nuproducts task. We rebinned the keV spectra with min 25 counts using grppha task. Light curves were extracted with 100 sec time binning. The background-subtracted light curves from the two modules were combined with lcmath task.
2.2 NICER
After the reported outburst of XTE J1856+053 on July 12, 2023, NICER observed the source on July 14, 15, 16, and 19. We used nicerl2555https://heasarc.gsfc.nasa.gov/docs/nicer/analysis_threads/nicerl2/ task to produce standard, calibrated, cleaned event files for each NICER observations. We used nicerl3-lc666https://heasarc.gsfc.nasa.gov/docs/nicer/analysis_threads/nicerl3-lc/ and nicerl3-spect777https://heasarc.gsfc.nasa.gov/docs/nicer/analysis_threads/nicerl3-spect/ for further extraction of the light curve and spectrum, respectively. During the generation of spectra, we used scorpeon model for background calculation. The light curves were generated with 400 s and 100 s binning. The spectra are grouped with a minimum of 25 counts/sec. PDSs were generated by applying the Fast Fourier Transformation (FFT) technique on the 400 light curves using powspec task of FTOOLS. We divided the light curves into 8192 intervals and computed the Poisson noise subtracted PDS for each interval. Then, we averaged all the PDS to obtain the final PDS for each observation. The final PDS are normalized to give the fractional rms spectra in unit. Then, we geometric-binned the PDS with a factor of 0.07.
3 Results
We investigate the temporal and spectral properties of the soft X-ray transient XTE J1856+053 during its 2023 X-ray outburst using NICER and NuSTAR data. Among the four NICER observations during this period, one observation (NICER4; Obs Id. 6100560104) coincides with the only NuSTAR observation (Obs Id. 90901325002) on July 19, 2023. Three more observations of NICER are taken from July 14 (NICER1), July 15 (NICER2), and July 16 (NICER3), 2023.
3.1 Timing analysis
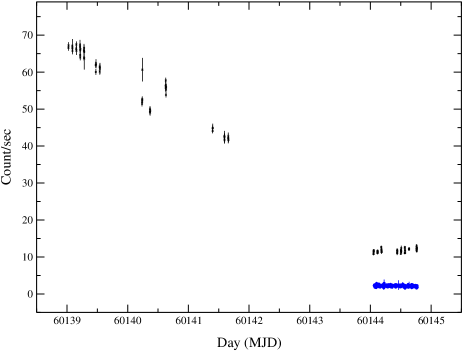
During our studied period (from July 14 July 19) of the outburst in 2023, we noticed that the source count rate decreased consistently. In Fig.1, we show the keV light curve during the observation period. We also show the keV light curve of NuSTAR (online blue curve) on July 19, 2023. In the case of NuSTAR light curves, the soft energy band count rate is approximately twice the hard-band count. No variation can be seen in any of the soft or hard band light curves.
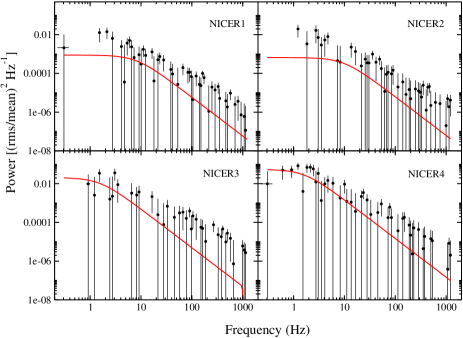
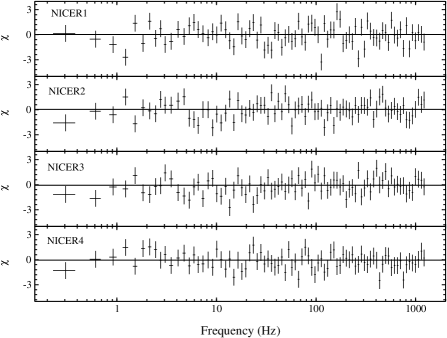
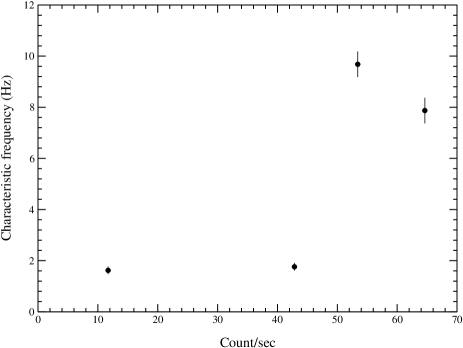
To study the variability, we study the PDSs of the four NICER light curves generated from 400 s light curves. These high-resolution light curves allowed us to investigate the QPO feature in the PDSs up to 1250 Hz. The PDSs do not show any QPO features. We fit the PDSs with Lorentzian models. The four PDSs and their corresponding residuals are presented in Fig. 2. The zero-centered Lorentzian model is shown with the red curves in Fig. 2. We calculate the characteristic frequency () of the broad-band noise of those PDSs in the Hz frequency range. The characteristic frequency () is the frequency where the component contributes the most of its variance per frequency. If the centroid frequency is and the full-width at half-maximum is , then the characteristic frequency () is (Nowak, 2000; Belloni et al., 2002). The variation of with NICER count rate is shown in Fig. 3.
3.2 Spectral analysis
We study the 2013 outburst of the source using combined NICER4 and NuSTAR on July 19, 2023. We also fit the four NICER data on July 14, July 15, and July 16 observations. The keV energy range of NICER4 and keV energy range of NuSTAR are selected. We use xspec (Arnaud, 1996) for the spectral fit.
We use a combination of phenomenological and physical models to fit the spectra. We use disk blackbody (DiskBB) and power-law (PL) models to obtain an overview of the accretion properties. The DiskBB model is used to describe the thermal emission from the accretion disk around a BH or NS. It is based on the multi-color disk blackbody model, which assumes the disk consists of multiple concentric annuli, each emitting as a blackbody with a different temperature (Mitsuda et al., 1984). The input parameters of this model include the inner disk temperature (), which represents the temperature at the inner disk radius, and the normalization (), which is proportional to the square of the inner disk radius () and inversely proportional to the distance to the source (in 10 kpc unit). The normalization also depends on the inclination angle of the disk ().
Later, the spectra are fitted with more physical models (e.g., ThComp and relxill). ThComp (Zdziarski et al., 2020) is an improved version of nthComp model (Zdziarski et al., 1996) with actual Monte Carlo spectra from Comptonization (Niedźwiecki et al., 2019). The ThComp model characterizes spectra resulting from Comptonization by thermal electrons emanating from a spherical source. These electrons interact with seed photons distributed sinusoidally, similar to the CompST model (Sunyaev & Titarchuk, 1980). ThComp operates as a convolution model, enabling the Comptonization of various seed photon distributions, whether they are hard or soft. It adeptly accounts for both the up-scattering and down-scattering processes. In scenarios where certain seed photons, such as those from a blackbody or a disk blackbody, are up-scattered, ThComp offers a superior representation of the continuum shape resulting from thermal Comptonization compared to an exponentially cutoff power law. ThComp exhibits a considerably sharper cutoff compared to the exponential model. Additionally, the model furnishes an accurate portrayal of Comptonized spectra at energies that are in the same range as those of the seed photons. This model does not have a normalization parameter since its normalization follows from that of the seed photons.
relxill model combines the relconv relativistic convolution model with the xillver reflection model, effectively accounting for the relativistic effects and the ionization state of the accretion disk material (García et al., 2014; Dauser et al., 2014). Key parameters of the relxill model include the emissivity indices (Index1, Index2), which describe how the intensity of the reflected emission falls off with distance from the BH. The spin parameter () quantifies the dimensionless spin of the BH, ranging from ‘0’ (non-rotating) to ‘1’ (maximally rotating). The inclination angle () specifies the angle of the accretion disk relative to the observer’s line of sight. The inner () and outer () disk radii define the spatial extent of the disk contributing to the reflection spectrum. The break radius () is the boundary between and defined by the two emissivity indices. The photon index () characterizes the power-law shape of the primary X-ray source’s spectrum, while the high-energy cutoff () indicates the energy at which the spectrum steepens, often related to the coronal temperature. The iron abundance () and ionization parameter () influence the strength and shape of the reflection features, particularly the Fe K line. The reflection fraction () specifies the proportion of the reflection component relative to the direct power-law emission. The model’s normalization () scales the overall flux of the reflected component (Dauser et al., 2016).
We use vern cross-section (Verner et al., 1996) and wilm’s abundance (Wilms et al., 2000) for the spectral fit. The constant parameter is used for combining the three spectra of NICER, NuSTAR/FPMA and NuSTAR/FPMB on July 19 observations. We fixed the value of the constant to 1 for NICER spectra and kept it free for FPMA and FPMB spectra. In this way, we get the same normalization value of the model parameters. The parameters for the different combinations of models are given in Table 2 and Table 3. The errors are calculated using xspec’s fit err command with 90% confidence.
3.2.1 Model 1
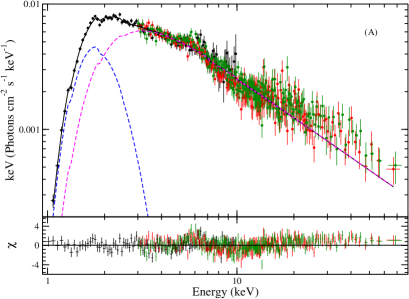
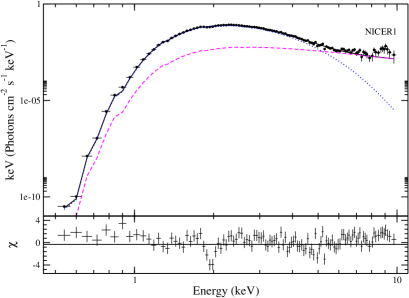
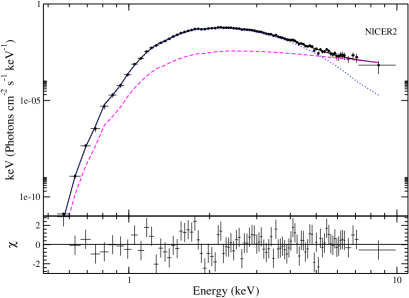
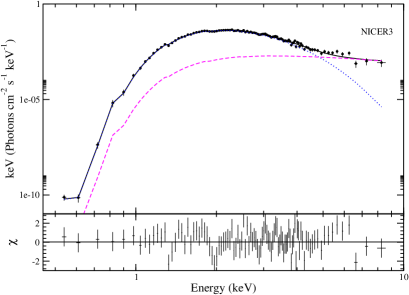
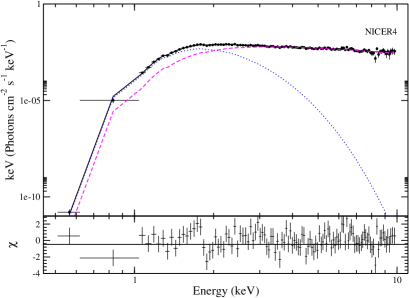
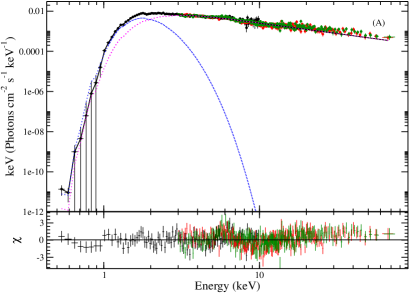
First, we fit the combined spectra with the absorbed multi-color DiskBB(Mitsuda et al., 1984; Makishima et al., 1986) and PL model. We use Tbabs for the absorption component to find the neutral hydrogen column density along the line of sight. This parameter is kept free during the fit. The total model can be represented as: Tbabs*(DiskBB+PL). A gabs model is used to incorporate the prominent Si edge feature around 1.8 keV. The obtained parameter values are line energy 1.900.02 keV, width keV, and strength . The parameters of gabs are then fixed during the analysis with other combinations of models. We obtain the hydrogen column density () for the best-fit spectra for the four epochs as . The inner disk temperature () are , , , and keV. The normalization of DiskBB model () of these four epochs are , , , and respectively. For the NICER1 observation, we obtained =0.2, which is unphysical. Hence, we fixed it at 2.5 following the fit from the next observation on July 15. The NICER2, NICER3, and NICER4+NuSTAR give values of , and , respectively. The best-fit spectrum (with ) of July 19 is given in Fig. 4A.
3.2.2 Model 2
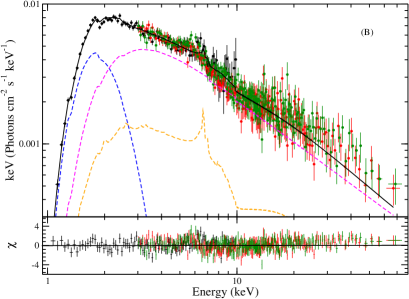
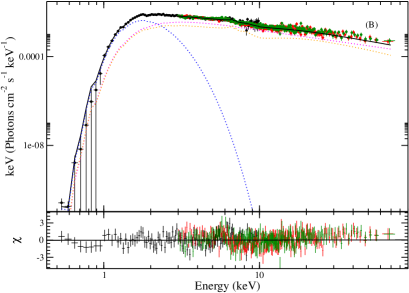
In the case of the first three NICER observations, we do not see any significant contribution of Fe K line around 6 keV. Although, for combined spectra on July 19, we see a hump around 6 keV (see Fig. 4A). To consider the iron emission line contribution around 6 keV we add Gaussian component. We do not add the Gaussian to the best-fit NICER observations because the contribution is insignificant. We obtain a very broad line width (1.51 keV) for the Gaussian with a line energy of keV. Hence, we replace the Gaussian with xillver model (García et al., 2013; Dauser et al., 2013). The Tbabs(DiskBB+PL+xillver) best-fit spectrum is shown in the Fig. 4B. The fitted model parameters are given in Table 3. We obtain an iron abundance of 1.0 solar value. The ionization parameter retains a value of 3.30.1. The inclination angle () obtained is 20∘. With a free high-energy cut parameter, the best fit is obtained at 1000 keV, which is well outside the NuSTAR energy range. So, we fixed the high energy cut to 1000 keV in the next study. The reflection fraction is fixed at -1, to consider only the contribution from the line emission. This fit gives a of 1.07.
3.2.3 Model 3
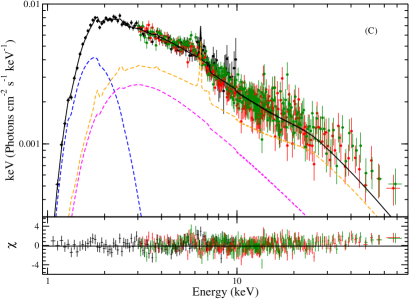
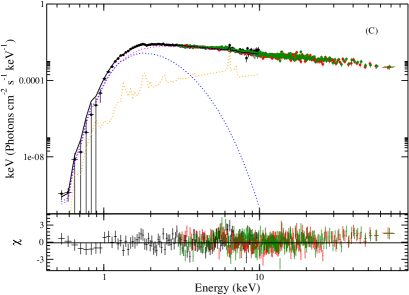
Next, we replace the phenomenological PL model (see, Model 1) with a more physical ThComp model (Zdziarski et al., 2020). We fit the spectra with Tbabs(DiskBB+ThComp DiskBB). We set the energy range from 0.01 to 1000.0, as the model requires, to give the correct result. The convolution model’s is set to the value of the DiskBB model temperature. xillver model is also included for the NICER4+NuSTAR spectrum fit. Since, for the case of the first three NICER observations, the energy range considered is keV, we fixed the to 50 keV. We noticed that the and values retain similar results as Model 1 for these spectra. The for the combined spectra is . The xillver model parameters for the combined spectra are , log , . The best-fit spectrum of July 19 is given in Fig. 4C. We present the combined spectral fitted results of the NICER4+NuSTAR observation in Table 3.
3.2.4 Model 4
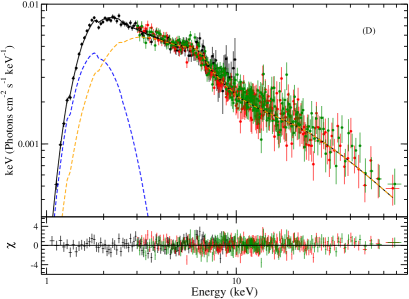
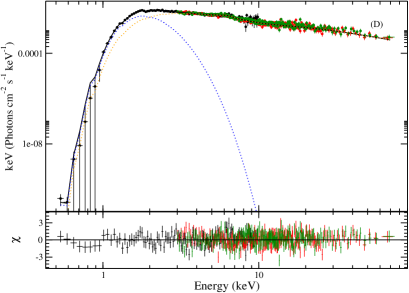
We also fit the July 19’s combined spectra with tbabs(Diskbb+relxill) model. Since the first three spectra do not show any significant iron emission line features and no reflection features can be seen, we have not fit these three NICER observations with this model combinations. The DiskBB model gives similar results to the previous combinations with keV. We fixed the emissivity indices (Index1 and Index2) to 3, to Newtonian emissivity. The outer radius () is fixed at 400 . Increasing the does not change the results. Fig. 4D represents the best-fit spectrum. We obtain the best-fit model parameters to be spin (a) , of the inner accretion disk , inner accretion disk radius (Rin) ( is the inner stable circular orbit’s radius), . The and log for the best fit are and respectively. The best fit gives a value of 0.98. The best-fit parameters are given in Table 3.
From the values of the different combinations of models, we conclude that for the NICER1-3 observations Model 1 gives the best-fit. For combined NICER4 and NuSTAR observation, Model 4 is the better model for explaining the spectra with fewer (physical) parameters and satisfactory statistics.
| DiskBB+PL (Model 1) | NICER1 | NICER2 | NICER3 |
|---|---|---|---|
| Parameters | 14/07/2023 | 15/07/2023 | 16/07/2023 |
| NH () | 4.30.1 | 4.30.1 | 4.30.1 |
| Tin (keV) | 0.570.01 | 0.520.01 | 0.480.01 |
| NormDiskBB | 82040 | 980100 | 111080 |
| 2.501.00 | 2.300.40 | ||
| NormPL () | 4.00.3 | 3.00.3 | 2.01.0 |
| 1.68 | 1.03 | 1.00 |
The best-fit parameters of the three NICER observations using DiskBB+PL model. The errors are calculated using fit err command and represent 90% confidence level. The ‘∗’ denotes the frozen/fixed parameters. The first column represents the parameters of the respective models. Absorption models Tbabs is used for all model combinations as a multiplicative model.
| Model/ | Model 1 | Model 2 | Model 3 | Model 4 |
| Parameters | (DiskBB+PL) | (DiskBB+PL | (DiskBB+xillver | (DiskBB |
| +xillver) | +ThCompDiskBB) | +relxill) | ||
| TBabs | ||||
| () | 4.50.2 | 4.30.2 | 4.00.1 | 4.30.1 |
| DiskBB | ||||
| (keV) | 0.280.01 | 0.300.01 | 0.330.01 | 0.320.01 |
| 3900900 | 2500 | 7700 | 1500 | |
| PL | ||||
| 2.050.01 | 2.000.02 | - | - | |
| () | 301 | 211 | - | - |
| ThComp | ||||
| (keV) | - | - | 1490.4 | - |
| - | - | 2.070.01 | - | |
| - | - | 1.00 | - | |
| - | - | 2350 | - | |
| xillver | ||||
| (in ) | - | 1.0 | 4.0 | - |
| (keV) | - | 1000∗ | 1000∗ | - |
| log (erg cm s-1) | - | 3.3 | 1.7 | - |
| Inclination () | - | 20 | 27 | - |
| () | - | 2.00.2 | 735 | - |
| relxill | ||||
| Index1 | - | - | - | 3∗ |
| Index2 | - | - | - | 3∗ |
| - | - | - | 0.980.01 | |
| Inclination () | - | - | - | 18 |
| () | - | - | - | 4.5 |
| (GM/c2) | - | - | - | 400∗ |
| - | - | - | 1.940.02 | |
| (in ) | - | - | - | 5.50.4 |
| (keV) | - | - | - | 1000∗ |
| log (erg cm s-1) | - | - | - | 3.4 |
| - | - | - | 0.540.01 | |
| () | - | - | - | 3321 |
| 1304.42/964 | 1035.14/959 | 1178.16/955 | 942.37/957 | |
| 1.35 | 1.07 | 1.23 | 0.98 | |
The superscripts and subscripts represent the positive and negative errors, respectively, and are calculated using fit err command. The errors are estimated at 90% confidence level. The ‘∗’ denotes the frozen/fixed parameters. The first column represents the parameters of the respective models. The combinations of models are given in the first row. The individual models are also given in the first row before the parameters of the model are given. Absorption models Tbabs is used for all model combinations as a multiplicative model.
4 Discussions
We study the accretion properties of XTE J1856+053 during its 2023 outburst using four NICER and one NuSTAR data from July 14 to July 19, 2023. The timing properties are investigated with high resolution NICER data to search for the QPOs during the outburst period. For the spectral study with different models, the keV NICER4 spectrum is combined with the keV NuSTAR spectrum. We also use three other NICER data for spectral study.
4.1 PDS with no QPO features
We noticed that the source count rate decreased consistently from the start of our observation period. The nature of the compact X-ray object is not confirmed via any dynamical mass estimation. The spectral study of the 2007 outburst using XMM-Newton observation suggested it to be a BH of mass (Sala et al., 2008). No pulsations or thermonuclear bursts have been detected in any of the previous outbursts or in it’s recent outburst, which is a clear signature of the NS binary. The kHz oscillation is a common feature for NS binaries (Di Salvo et al., 2001; Bult et al., 2018; Méndez & Belloni, 2021), which is also absent in the PDSs of our studied observations. However, the absence of kHz oscillations does not totally discard the system to host an NS. We searched for low-frequency and high-frequency QPOs using 400 light curves of NICER, but found none. The power of the PDS is decreased after 10 Hz. In general, the power of the PDSs of a stellar-mass BH decreases after 10-50 Hz (Sunyaev & Revnivtsev, 2000), showing a steep decreasing trend compared to NS binaries. The absence of the kHz oscillations and the decrease of the power after 10 Hz support it to be a potential BH candidate from the timing analysis. We calculate the characteristic frequencies () for the four NICER observations from Hz. The shows correlations with the count rate. Since, in the SS, the disk would be much closer to the BH, it shows more variability than in the HS. A positive correlation of the with the count rate thus indicates the evolution of the source from SS to HS. A similar correlation has been noticed in MAXI J0637-430 during the 2019 outburst along different spectral states (Jana et al., 2021).
4.2 Spectral state transition
We fit the spectra with different combinations of phenomenological and physical models to understand the accretion properties during the outburst. We use a total of four NICER spectra and one NuSTAR spectra for the spectral analysis. One of the NICER observation times overlapped with the NuSTAR observation, so we simultaneously analyzed the combined NICER and NuSTAR spectra. From the overall analysis with DiskBB and PL model of the four observations, we noticed that the decreases consistently from 0.57 to 0.28 keV. Also, decreases during this period. A similar trend was observed during the transition from SS towards HS for other BHCs (see, Remillard & McClintock 2006; Cadolle Bel et al. 2004; Wang et al. 2018 and reference therein). The high values of (2-2.5) indicate the source is in the SS during the first three observations. Also, the decreasing count rate (see Fig 1) supports that the source is in the declining phase. The rising phase of the outburst was not detected, which is also observed in some outbursts of other BHs showing a fast-rising (missed) state (e.g., XTE J1755–324 in 1997; Revnivtsev et al. 1998, XTE J1720-318 in 2003; Cadolle Bel et al. 2004, XTE J1726-476 in 2005; Levine et al. 2005). The value even decreases when we fit the last observation with the relxill model. The decreasing nature of the and implies the source is transitioning from SS to IMS. Since we have only four observations (from July 14 to July 19), we could not confirm the exact state transition (whether in HIMS or SIMS on the last observation day).
4.3 Reflection and iron emission line
We notice a prominent iron emission line feature in the NuSTAR spectrum. The emission line of iron is a result of the irradiation of the inner accretion disk by a hot X-ray source. The shape of the line is determined by the gravitational redshifts, light bending, and Doppler effects. Since the iron emission line originates from the innermost region of the accretion disk, it serves to probe the strong gravitational environment in the vicinity of the compact object. A Compton hump around 20-30 keV is also a reflection feature that is commonly observed in BH binary spectra. For our studied observations, the Compton hump is not significant in the spectra. The iron line profile is also not significant in the first three NICER observations, possibly because these three observations are in SS. The weak power-law component in the SS results in a weak irradiation of the accretion disk and, thus, a weak or none reflection component. The iron line emission is broad in the last observation while fitting with a Gaussian component. Similar properties are observed in BHC XTE J1908+094 during 2002 outburst. The Fe K line disappears in the SS due to the weak PL component (Göǧüş et al., 2004). The best fit with xillver or relxill models give high ionization parameter values as well as a double-peaked profile of the emission line. This feature also suggests the source is in the IMS, and the inner accretion disk is very close to the BH. The high ionization parameters implied that the irradiation is high and the emission lines come from a larger optical depth (Thompson optical depth) and get thermally broadened (Fabian & Ross, 2010).
4.4 Inner accretion properties and Spin
From the spectral analysis, we notice a decreasing inner disk temperature, which means the inner disk radius increases during our studied observation period. We obtain the inner disk radius is on the last observation day from the relxill model. During the whole outburst, the spectra are dominated by the thermal component. The apparent inner accretion disk radius () can be estimated from the DiskBB model normalization parameter () as
| (1) |
where is the inclination of the accretion disk and is the distance in 10 kpc. To correct the spectral hardening (Shimura & Takahara, 1995) and inner boundary correction (Kubota et al., 1998), we consider a constant spectral hardening factor and inner boundary correction factor . The corrected inner radius is, thus,
| (2) |
Assuming a disk inclination () of 18∘, and 10 kpc distance, we obtain to vary from 351 km, 382 km, 401 km, and 475 km respectively during the four observations.
One of the crucial parameters of a BH is spin, which can also be modeled by the iron line emission profile (Fabian et al., 2012). The broadening of the line profile gives the gravitational redshift resulting from the inner accretion disk. The spin can be estimated from the inner radius compared to the ISCO (). The is a monotonic function of dimensionless spin parameters. This method of spin calculation is independent of the mass of the BH and distance to the system. We fit the spectra with angle-dependent model relxill to obtain the spin parameter. The obtained BH spin is , implying a maximally rotating Kerr BH. We also obtain the inclination angle of the inner accretion disk to be .
We also obtain the inner accretion radius, from Model 4. We estimate the from (See, Eq. 2). From the spectral fits of the two models, we can write,
| (3) |
where, for a maximally rotating Kerr BH is considered to be between GM/c2 and 9GM/c2. For a Schwarzschild BH, is fixed at 6GM/c2. We can estimate the mass of the BH () considering the BH to be a maximally rotating Kerr BH with prograde motion. Considering 5 kpc, 10 kpc, and 15 kpc distances, we obtain the mass of the BH to be , , and , respectively.
Although this result does not make any concrete conclusion regarding the , it is evident that the mass value resides in a range of a stellar-mass BH candidate. Further successful optical observations in the quiescent state would enable the mass of the BH to be determined more accurately.
5 Summary
We investigated the accretion properties of the soft X-ray transient XTE J1856+053 during its 2023 outburst using NICER and NuSTAR data. Our analysis revealed several key findings:
-
•
We observed a consistent decrease in the source count rate throughout the observation period. We did not detect QPOs during our observation period.
-
•
The spectral analysis indicated a transition from the Soft State (SS) to the Intermediate State (IMS) based on decreasing inner disk temperatures () and power-law indices (). However, due to limited observations, the exact state transition (HIMS or SIMS) couldn’t be confirmed.
-
•
We observed a prominent iron emission line in the NuSTAR spectrum, indicative of a strong gravitational environment near the compact object. The iron line profile suggested the source was in the IMS, with a close inner accretion disk.
-
•
The decreasing inner disk temperature implied an increasing inner disk radius. The estimated BH spin parameter () from the iron line profile suggested a maximally rotating Kerr BH. However, further observations are needed to determine the BH mass more precisely.
References
- Alabarta et al. (2021) Alabarta, K., Altamirano, D., Méndez, M., et al. 2021, MNRAS, 507, 5507, doi: 10.1093/mnras/stab2241
- Arnaud (1996) Arnaud, K. A. 1996, in Astronomical Society of the Pacific Conference Series, Vol. 101, Astronomical Data Analysis Software and Systems V, ed. G. H. Jacoby & J. Barnes, 17
- Avakyan et al. (2023) Avakyan, A., Neumann, M., Zainab, A., et al. 2023, A&A, 675, A199, doi: 10.1051/0004-6361/202346522
- Barret et al. (1996) Barret, D., Grindlay, J. E., Bloser, P. F., et al. 1996, IAU Circ., 6519, 2
- Belloni et al. (2005) Belloni, T., Homan, J., Casella, P., et al. 2005, A&A, 440, 207, doi: 10.1051/0004-6361:20042457
- Belloni et al. (2002) Belloni, T., Psaltis, D., & van der Klis, M. 2002, ApJ, 572, 392, doi: 10.1086/340290
- Belloni (2010) Belloni, T. M. 2010, Lecture Notes in Physics, Vol. 794, States and Transitions in Black Hole Binaries, ed. T. Belloni (Springer), 53–84
- Brocksopp et al. (2001) Brocksopp, C., Jonker, P. G., Fender, R. P., et al. 2001, Monthly Notices of the Royal Astronomical Society, 323, 517, doi: 10.1046/j.1365-8711.2001.04268.x
- Bult et al. (2018) Bult, P., Altamirano, D., Arzoumanian, Z., et al. 2018, ApJ, 860, L9, doi: 10.3847/2041-8213/aac893
- Cadolle Bel et al. (2004) Cadolle Bel, M., Rodriguez, J., Sizun, P., et al. 2004, A&A, 426, 659, doi: 10.1051/0004-6361:20041292
- Casares et al. (1992) Casares, J., Charles, P. A., & Naylor, T. 1992, Nature, 355, 614
- Casella et al. (2005) Casella, P., Belloni, T., & Stella, L. 2005, ApJ, 629, 403, doi: 10.1086/431174
- Chakrabarti & Titarchuk (1995) Chakrabarti, S., & Titarchuk, L. G. 1995, ApJ, 455, 623, doi: 10.1086/176610
- Charles & Coe (2006) Charles, P. A., & Coe, M. J. 2006, in Compact Stellar X-ray Sources, ed. W. H. G. Lewin & M. van der Klis (Cambridge University Press), 215–265
- Chatterjee et al. (2019) Chatterjee, D., Debnath, D., Jana, A., & Chakrabarti, S. K. 2019, Ap&SS, 364, 14, doi: 10.1007/s10509-019-3495-2
- Chatterjee et al. (2021) Chatterjee, D., Jana, A., Chatterjee, K., et al. 2021, Galaxies, 9, 25, doi: 10.3390/galaxies9020025
- Chen et al. (1997) Chen, W., Shrader, C. R., & Livio, M. 1997, The Astrophysical Journal, 491, 312
- Churazov et al. (1993) Churazov, E., Gilfanov, M., Sunyaev, R., & et al. 1993, Astrophysical Journal, 407, 752, doi: 10.1086/172552
- Curran & Chaty (2013) Curran, P. A., & Chaty, S. 2013, Astronomy & Astrophysics, 557, A45, doi: 10.1051/0004-6361/201321548
- Dauser et al. (2013) Dauser, T., Garcia, J., Wilms, J., et al. 2013, MNRAS, 430, 1694, doi: 10.1093/mnras/sts710
- Dauser et al. (2014) Dauser, T., García, J., Parker, M. L., Fabian, A. C., & Wilms, J. 2014, Monthly Notices of the Royal Astronomical Society, 444, doi: 10.1093/mnras/stu2599
- Dauser et al. (2016) Dauser, T., García, J., Wilms, J., et al. 2016, Astronomy & Astrophysics, 590, A76, doi: 10.1051/0004-6361/201528248
- Debnath et al. (2020) Debnath, D., Chatterjee, D., Jana, A., Chakrabarti, S. K., & Chatterjee, K. 2020, Research in Astronomy and Astrophysics, 20, 175, doi: 10.1088/1674-4527/20/11/175
- del Santo et al. (2004) del Santo, M., Bazzano, A., Zdziarski, A. A., & et al. 2004, Astronomy & Astrophysics, 433, 613, doi: 10.1051/0004-6361:20040317
- Di Salvo et al. (2001) Di Salvo, T., Méndez, M., van der Klis, M., Ford, E., & Robba, N. R. 2001, ApJ, 546, 1107, doi: 10.1086/318278
- Done et al. (2007) Done, C., Gierliński, M., & Kubota, A. 2007, A&A Rev., 15, 1, doi: 10.1007/s00159-007-0006-1
- Dubus et al. (2001) Dubus, G., Hameury, J.-M., & Lasota, J.-P. 2001, Astronomy & Astrophysics, 373, 251
- Esin et al. (1997) Esin, A. A., McClintock, J. E., & Narayan, R. 1997, The Astrophysical Journal, 489, 865
- Fabian & Ross (2010) Fabian, A. C., & Ross, R. R. 2010, Space Sci. Rev., 157, 167, doi: 10.1007/s11214-010-9699-y
- Fabian et al. (2012) Fabian, A. C., Wilkins, D. R., Miller, J. M., et al. 2012, MNRAS, 424, 217, doi: 10.1111/j.1365-2966.2012.21185.x
- Fender et al. (2004) Fender, R. P., Belloni, T. M., & Gallo, E. 2004, MNRAS, 355, 1105, doi: 10.1111/j.1365-2966.2004.08384.x
- Fortin et al. (2022) Fortin, F., García, F., & Chaty, S. 2022, A&A, 665, A69, doi: 10.1051/0004-6361/202244048
- Fortin et al. (2023) Fortin, F., García, F., Simaz Bunzel, A., & Chaty, S. 2023, A&A, 671, A149, doi: 10.1051/0004-6361/202245236
- Froning et al. (2014) Froning, C. S., Maccarone, T. J., France, K., & et al. 2014, Astrophysical Journal, 780, 48, doi: 10.1088/0004-637X/780/1/48
- García et al. (2013) García, J., Dauser, T., Reynolds, C. S., et al. 2013, ApJ, 768, 146, doi: 10.1088/0004-637X/768/2/146
- García et al. (2014) García, J., Dauser, T., Lohfink, A., et al. 2014, The Astrophysical Journal, 782, 76, doi: 10.1088/0004-637X/782/2/76
- Göǧüş et al. (2004) Göǧüş, E., Finger, M. H., Kouveliotou, C., et al. 2004, ApJ, 609, 977, doi: 10.1086/421255
- Haardt & Maraschi (1993) Haardt, F., & Maraschi, L. 1993, ApJ, 413, 507, doi: 10.1086/173020
- Harrison et al. (2013) Harrison, F. A., Craig, W. W., Christensen, F. E., et al. 2013, ApJ, 770, 103, doi: 10.1088/0004-637X/770/2/103
- Homan & Belloni (2005) Homan, J., & Belloni, T. 2005, Ap&SS, 300, 107, doi: 10.1007/s10509-005-1197-4
- Homan et al. (2001) Homan, J., Wijnands, R., van der Klis, M., et al. 2001, ApJS, 132, 377, doi: 10.1086/318954
- Hynes et al. (2000) Hynes, R. I., Mauche, C. W., Haswell, C. A., & et al. 2000, Astrophysical Journal, 539, L37, doi: 10.1086/312842
- Jana et al. (2021) Jana, A., Jaisawal, G. K., Naik, S., et al. 2021, MNRAS, 504, 4793, doi: 10.1093/mnras/stab1231
- Kobayashi et al. (2023) Kobayashi, K., Negoro, H., Nakajima, M., et al. 2023, The Astronomer’s Telegram, 16131, 1
- Krimm et al. (2007) Krimm, H. A., Barthelmy, S. D., Barbier, L., et al. 2007, The Astronomer’s Telegram, 1093, 1
- Kubota et al. (1998) Kubota, A., Tanaka, Y., Makishima, K., et al. 1998, PASJ, 50, 667, doi: 10.1093/pasj/50.6.667
- Lasota (2001) Lasota, J.-P. 2001, New Astronomy Reviews, 45, 449
- Levine et al. (2005) Levine, A. M., Lin, D., & Remillard, R. A. 2005, The Astronomer’s Telegram, 623, 1
- Levine & Remillard (2007) Levine, A. M., & Remillard, R. A. 2007, The Astronomer’s Telegram, 1024, 1
- Makishima et al. (1986) Makishima, K., Maejima, Y., Mitsuda, K., et al. 1986, ApJ, 308, 635, doi: 10.1086/164534
- Marshall et al. (1996) Marshall, F. E., Ebisawa, K., Remillard, R., & Valinia, A. 1996, IAU Circ., 6504, 2
- McClintock & Remillard (2003) McClintock, J. E., & Remillard, R. A. 2003, in Compact Stellar X-ray Sources, ed. W. H. G. Lewin & M. van der Klis (Cambridge University Press), 157–214
- Méndez & Belloni (2021) Méndez, M., & Belloni, T. M. 2021, in Astrophysics and Space Science Library, Vol. 461, Timing Neutron Stars: Pulsations, Oscillations and Explosions, ed. T. M. Belloni, M. Méndez, & C. Zhang, 263–331, doi: 10.1007/978-3-662-62110-3_6
- Mitsuda et al. (1984) Mitsuda, K., Inoue, H., Koyama, K., et al. 1984, PASJ, 36, 741
- Miyamoto et al. (1991) Miyamoto, S., Kitamoto, S., Iga, S., Negoro, H., & Terada, K. 1991, The Astrophysical Journal, 383, 784
- Nandi et al. (2012) Nandi, A., Debnath, D., Mandal, S., & Chakrabarti, S. K. 2012, A&A, 542, A56, doi: 10.1051/0004-6361/201117844
- Negoro et al. (2015) Negoro, H., Itoh, D., Ueno, S., et al. 2015, The Astronomer’s Telegram, 7579, 1
- Neumann et al. (2023) Neumann, M., Avakyan, A., Doroshenko, V., & Santangelo, A. 2023, A&A, 677, A134, doi: 10.1051/0004-6361/202245728
- Niedźwiecki et al. (2019) Niedźwiecki, A., Szanecki, M., & Zdziarski, A. A. 2019, MNRAS, 485, 2942, doi: 10.1093/mnras/stz487
- Novikov & Thorne (1973) Novikov, I. D., & Thorne, K. S. 1973, in Black Holes (Les Astres Occlus), 343–450
- Nowak (2000) Nowak, M. A. 2000, MNRAS, 318, 361, doi: 10.1046/j.1365-8711.2000.03668.x
- Remillard & McClintock (2006) Remillard, R. A., & McClintock, J. E. 2006, ARA&A, 44, 49, doi: 10.1146/annurev.astro.44.051905.092532
- Remillard & McClintock (2006) Remillard, R. A., & McClintock, J. E. 2006, Annual Review of Astronomy and Astrophysics, 44, 49
- Revnivtsev et al. (1998) Revnivtsev, M., Gilfanov, M., & Churazov, E. 1998, A&A, 339, 483, doi: 10.48550/arXiv.astro-ph/9804173
- Sala et al. (2008) Sala, G., Greiner, J., Ajello, M., & Primak, N. 2008, A&A, 489, 1239, doi: 10.1051/0004-6361:200809875
- Shakura & Sunyaev (1973) Shakura, N. I., & Sunyaev, R. A. 1973, A&A, 500, 33
- Shimura & Takahara (1995) Shimura, T., & Takahara, F. 1995, ApJ, 445, 780, doi: 10.1086/175740
- Sidoli et al. (2011) Sidoli, L., Esposito, P., Sguera, V., & et al. 2011, Astronomy & Astrophysics, 527, A87, doi: 10.1051/0004-6361/201015738
- Soleri et al. (2012) Soleri, P., Belloni, T., Casella, P., & et al. 2012, Monthly Notices of the Royal Astronomical Society, 426, L66, doi: 10.1111/j.1745-3933.2012.01316.x
- Sunyaev & Revnivtsev (2000) Sunyaev, R., & Revnivtsev, M. 2000, A&A, 358, 617. https://arxiv.org/abs/astro-ph/0003308
- Sunyaev & Titarchuk (1980) Sunyaev, R. A., & Titarchuk, L. G. 1980, A&A, 86, 121
- Sunyaev & Titarchuk (1985) —. 1985, A&A, 143, 374
- Tanaka & Shibazaki (1996) Tanaka, Y., & Shibazaki, N. 1996, Annual Review of Astronomy and Astrophysics, 34, 607
- Tetarenko et al. (2016) Tetarenko, B. E., Sivakoff, G. R., Heinke, C. O., & Gladstone, J. C. 2016, ApJS, 222, 15, doi: 10.3847/0067-0049/222/2/15
- Titarchuk (1994) Titarchuk, L. 1994, ApJ, 434, 570, doi: 10.1086/174760
- Verner et al. (1996) Verner, D. A., Ferland, G. J., Korista, K. T., & Yakovlev, D. G. 1996, ApJ, 465, 487, doi: 10.1086/177435
- Wang et al. (2018) Wang, S., Kawai, N., Shidatsu, M., et al. 2018, PASJ, 70, 67, doi: 10.1093/pasj/psy058
- White et al. (1995) White, N. E., Nagase, F., & Parmar, A. N. 1995, in X-ray Binaries, 1–57
- Wilms et al. (2000) Wilms, J., Allen, A., & McCray, R. 2000, ApJ, 542, 914, doi: 10.1086/317016
- Zdziarski et al. (1996) Zdziarski, A. A., Johnson, W. N., & Magdziarz, P. 1996, MNRAS, 283, 193, doi: 10.1093/mnras/283.1.193
- Zdziarski et al. (2020) Zdziarski, A. A., Szanecki, M., Poutanen, J., Gierliński, M., & Biernacki, P. 2020, MNRAS, 492, 5234, doi: 10.1093/mnras/staa159
- Zdziarski et al. (1993) Zdziarski, A. A., Zycki, P. T., Svensson, R., & Boldt, E. 1993, ApJ, 405, 125, doi: 10.1086/172345
- Życki et al. (1999) Życki, P. T., Done, C., & Smith, D. A. 1999, MNRAS, 309, 561, doi: 10.1046/j.1365-8711.1999.02885.x