Lattice distortion leads to glassy thermal transport in crystalline Cs3Bi2I6Cl3
Abstract
The glassy thermal conductivities observed in crystalline inorganic perovskites such as Cs3Bi2I6Cl3 is perplexing and lacking theoretical explanations. Here, we first experimentally measure such its thermal transport behavior from 20 K to 300 K, after synthesizing Cs3Bi2I6Cl3 single crystals. Using path-integral molecular dynamics simulations driven by machine learning potentials, we reveal that Cs3Bi2I6Cl3 has large lattice distortions at low temperatures, which may be related to the large atomic size mismatch. Employing the regularized Wigner thermal transport theory, we reproduce the experimental thermal conductivities based on lattice-distorted structures. This study thus provides a framework for predicting and understanding glassy thermal transport in materials with strong lattice disorder.
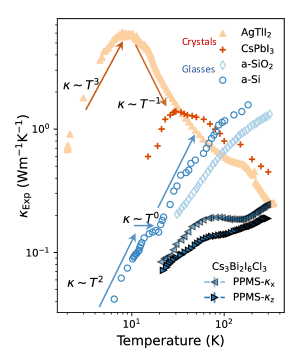
A foundational theory for the lattice thermal conductivity () in crystals was proposed by Peierls in 1929 Peierls (1929) based on the phonon gas picture: has a behavior at low temperatures, followed by a decrease with a dependence due to Umklapp phonon scattering. This behavior is observed in many materials, such as thermoelectric AgTlI2 Zeng et al. (2024) and inorganic perovskite CsPbI3 Lee et al. (2017), as illustrated in Fig. 1.
For glasses, such as amorphous Si Zink et al. (2006) and SiO2 Cahill (1990), the behavior of is distinct (see Fig. 1): At low temperatures ( K), , which may be explained by quantum tunneling Anderson et al. (1972); between K and K, plateaus, which may be related to the boson peak of glasses Schirmacher et al. (2007); At higher , increases with temperature, which can be explained by the Allen-Feldman (AF) model Allen and Feldman (1989, 1993) based on decoupled harmonic oscillators.
However, of some crystalline materials do not follow the typical behavior of crystals but are rather glassy, e.g. layered perovskite Cs3Bi2I6Cl3 Acharyya et al. (2022), quasi-one-dimensional perovskite BaTiS3 Sun et al. (2020); Zhao et al. (2022), and Ruddlesden-Popper perovskites Ba3Zr2S7 and Ba4Zr2S10 Hoque et al. (2023). In this study, we synthesized a high-quality single crystal (see Methods section for details) of Cs3Bi2I6Cl3 (space group ) and measured its from 20 K to 300 K (see Fig. 1) . Interestingly, both and in Cs3Bi2I6Cl3 deviate from the expected dependence at low and lack crystalline-like peak in the entire temperature range. In addition, exhibits an unusual wide plateau region (60–150 K), while steadily increases with increasing temperature.
Some other materials also exhibit measured glassy below room temperature. For example, (KBr)1-x(KCN)x Cahill et al. (1992); Beekman and Cahill (2017) transitions from crystalline to glassy with an increase in the molar fraction of KCN, which was attributed to binary doping. The glassy in clathrates Sr8Ga16Ge30 and Eu8Ga16Ge30 Sales et al. (2001) was rationalized by the rattling atoms within cage-like structures. In contrast, Cs3Bi2I6Cl3 lacks the binary doping as mixed crystals or a cage-like structure, suggesting a distinct mechanism behind its glassy . Acharyya et al. Acharyya et al. (2022) first reported the glassy of crystalline Cs3Bi2I6Cl3, and rationalized the slow increase of near room temperature based on local atomic disorder and low sound velocity, but the mechanism governing the glassy at lower temperatures remains unclear.
It is challenging to calculate for solids with strong anharmonicity at low temperatures: Regular molecular dynamics (MD) does not consider nuclear quantum effects (NQE), while quantum MD methods, such as path integral MD (PIMD) Parrinello and Rahman (1984); Feynman et al. (2010), centroid MD (CMD) Cao and Voth (1994), ring polymer MD (RPMD) Habershon et al. (2013), and thermostatted ring polymer MD (TRPMD) Rossi et al. (2014), can incorporate NQE but need to make approximations on the non-linear heat flux operator Luo and Yu (2020); Sutherland et al. (2021). On the other hand, recent advancements Caldarelli et al. (2022) in lattice dynamics such as Wigner transport equation (WTE) Simoncelli et al. (2019, 2022); Caldarelli et al. (2022) and quasi harmonic Green-Kubo (QHGK) theory Isaeva et al. (2019); Barbalinardo et al. (2020) offer new methods to compute of complex materials with strong anharmonicity by considering both propagative () and diffusive () thermal conductivities. However, a previous study Simoncelli et al. (2023) reported the divergence of at low when computing of vitreous silica using WTE, due to the finite-size effects. Although WTE can further simplify to the AF model via considering all harmonic modes with infinitesimal linewidth at the center of Brillouin zone to compute of glasses and thus avoid divergence, the AF model neglects anharmonic atomic vibrations Allen and Feldman (1989); Fiorentino et al. (2024). Very recently, regularized WTE (rWTE) Simoncelli et al. (2023) was proposed to overcome the divergence and thus can compute the of glasses accounting for both anharmonicity and quantum Bose-Einstein statistics of atomic vibrations.
.1 Lattice distortion at low temperatures
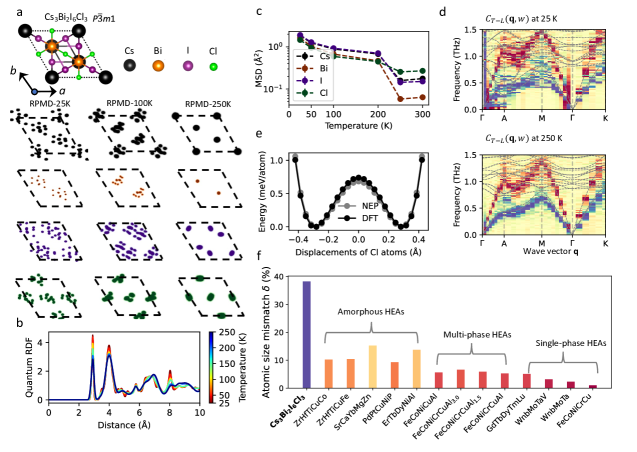
We first constructed a machine-learning-based neuroevolution potential (NEP) Fan et al. (2021, 2022), for Cs3Bi2I6Cl3 across a broad range of temperature and strain, based on the PBEsol functional Perdew et al. (2008) with the D3 dispersion correction Grimme et al. (2011). We then simulated the crystal structure of Cs3Bi2I6Cl3 between 25 K and 300 K, using PIMD simulations driven by the NEP. Fig. 2a shows the projection of atom positions onto the two-dimensional - plane in the unit cell. At 250 K, all atoms vibrate near their equilibrium lattice positions in the crystal structure, consistent with results of the crystal structure characterization from our single-crystal XRD experiment at 300 K (Table S2 of Supplementary Information). In contrast, at 25 K the atomic position distributions have multiple peaks. At 100 K, the peaks grow in size but become closer together, suggesting a reduction in lattice distortion but with stronger thermal vibrations. Note that the scattered spots at 25 K and 100 K still cluster around the lattice sites, thus the calculated radial distribution functions in Fig. 2b show characteristic peaks associated with crystals across the whole temperature range.
To further quantify the lattice distortion, we computed the mean square displacement (MSD) of the four elements using the structure as a reference. As shown in Fig. 2c, MSD decreases with increasing temperature, with a notable drop between 200 K and 250 K that corresponds to the structure transition from disorder to order. Above 250 K, as the crystal structure reverts to the phase, MSD values increase with temperature, which is a typical tendency in ordered crystals.
The strong disorder in crystalline Cs3Bi2I6Cl3 at low temperatures is unusual for two reasons: First, in many disordered crystals, only a part of elements exhibit correlated disorder Keen and Goodwin (2015); Simonov and Goodwin (2020); Liang et al. (2023), where lattice distortions follow a specific pattern with spatial correlations, e.g. in thermoelectric PbTe the Pb atoms exhibit large deviation along specific 100 directions Božin et al. (2010), in metal-organic frameworks Meekel and Goodwin (2021) the correlated distribution of linker vacancies leads to a patterned disordering. In contrast, all elements in Cs3Bi2I6Cl3 have uncorrelated disorder. Second, the other disordered crystals are typically ordered at low and become disordered at high Keen and Goodwin (2015), while Cs3Bi2I6Cl3 is opposite.
Strong lattice distortion can lead to substantial phonon-disorder scatterings. To investigate this, we used a 16 16 16 supercell with 57344 atoms to compute the longitudinal and transverse current correlation functions based on RPMD trajectories at 25 K and 250 K (as shown in Fig. 2d with heatmaps), which incorporates both full-order lattice anharmonicity and NQE. The longitudinal and transverse current correlation functions Fransson et al. (2021), and are
| (1) | ||||
where and are given by
| (2) | ||||
with , , , and representing the total number of atoms, wave vector, atomic position vector, and velocity vector, respectively. For comparison, Fig. 2d also shows the renormalized phonon dispersions at 25 K and 250 K using gray lines, calculated using the temperature-dependent effective potential (TDEP) Hellman et al. (2013) based on the structure. TDEP incorporates temperature-dependent phonon frequency correction arising from lattice anharmonicity beyond the third order. At 250 K, the phonon modes are well-defined and all real, with frequencies from current correlation functions closely matching those derived from TDEP calculations, which reveals that higher-than-third-order anharmonic renormalization to harmonic phonon frequencies (see Fig. S12) at 0 K. In contrast, phonon scattering at 25 K is significantly more severe than at 250 K, especially along the wave vector paths from to A and from M to in the first Brillouin zone, indicating substantial phonon-disorder interactions. Additionally, we observe unusual overdamped modes near the Brillouin zone center at 25 K, as previously noted in perovskite CsPbBr3 Lanigan-Atkins et al. (2021), while no imaginary modes are observed in TDEP results. This comparison suggests that lattice dynamics with low-order perturbation is not suitable for comprehending vibrational modes and heat transport of strongly disordered Cs3Bi2I6Cl3 at low temperatures.
To rationalize the large lattice distortion, we computed potential energy surfaces (PES) of the imaginary phonon modes at high-symmetry points by displacing corresponding atoms along their eigenvectors. We found shallow and double-well PES shown in Fig. 2e (for point) and Fig. S12 (for other high-symmetry points), leading to significant atomic displacements towards two local minima with large distances of about 0.7 Å. In Fig. 2e, the energy barrier along the imaginary mode of point is only 0.7 meV/atom, which is about energy associated with thermal fluctuation at about 10 K. At temperatures below or similar to this, the atoms tends to stay in the local minima, and at high temperatures the atoms can overcome the energy barrier and vibrate around the lattice positions. This may explain the multiple peaks at 25 K in Fig. 2a, with cluster into a single peak upon heating to 250 K.
Lattice distortions in crystals are often attributed to atomic size mismatch Zhang et al. (2008), i.e.
| (3) |
where and denote the atomic fraction and atomic radius of the th element, respectively. High-entropy alloys (HEAs) with large often have strong lattice distortions Song et al. (2017). In comparison, the of Cs3Bi2I6Cl3 is larger than that of typical HEAs, as shown in Fig. 2f. The mainly come from the large difference in atomic radii of Cs and Cl. The large not only shed light on the large lattice distortions, but also help explain why the of Cs3Bi2I9 exhibits typical crystalline behavior Acharyya et al. (2023) while the of Cs3Bi2I6Cl3 is glassy.
.2 Thermal conductivity follows a glass-like mechanism
We computed the of Cs3Bi2I6Cl3 using both molecular dynamics and lattice dynamics. Classical MD simulations with Green-Kubo (GK) theory offer a straightforward method to compute the of disordered crystals, as atomic disorder is inherently included. At above 150 K, the computed (see Fig. S9) agree well with our experimental data. However, below 150 K, the calculations show an distinct overestimation, due to the lack of NQE in classical MD. To include NQEs, we also performed TRPMD simulations with GK theory. The calculated from TRPMD (see Fig. S9) does not show considerable differences from those computed using classical MD (i.e., still overestimating the experimental at below 150 K), indicating potential limitations of the GK method within TRPMD for accurately assessing at low . This limitation arises from the ambiguous definition of the non-linear heat flux operator in PIMD-based simulations Luo and Yu (2020); Sutherland et al. (2021).
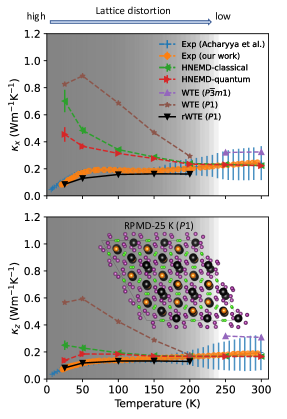
Classical homogeneous non-equilibrium MD (HNEMD) simulations Fan et al. (2019); Evans (1982), with an empirical quantum correction Wang et al. (2023) (detailed in Methods), provide an alternative way to assess without defining the heat flux in the PIMD-based framework. The from HNEMD are shown in Fig. 3. Classical HNEMD show an overestimation along both the and directions at below 150 K compared to the measurements, similar to the observation from the GK results with classical MD. After applying the harmonic quantum correction Wang et al. (2023) accounting for the modal heat capacity, the corrected agrees well with the experimental data. However, remains overestimated and fails to reproduce the glassy behavior. This could be due to the limited scope of the harmonic quantum correction, which considers only the quantum effects on the heat capacity, but does not address mode-mode occupations that can affect phonon coupling.
As the MD based methods are not able to reproduce the experimental glassy of Cs3Bi2I6Cl3, we resorted to lattice dynamics, which can incorporate the NQE. We first employed the WTE Simoncelli et al. (2019, 2023):
| (4) | ||||
where is the volume of the unit cell, is the number of -points in the summation, and are band indices at the wave vector (with derived when and derived when ), is the vibrational frequency, is the specific heat, and is the velocity operator. is the anharmonic linewidth, and the Lorentzian distribution , having a full width at half maximum (FWHM) equal to , is defined as:
| (5) |
At high (250 K and 300 K), the structure of Cs3Bi2I6Cl3 is the crystal (see Fig. 2a). We used this structure in the WTE calculation, which accounts for thermal expansion, renormalized phonon frequencies using TDEP Hellman et al. (2013), and four-phonon interactions Feng and Ruan (2016); Feng et al. (2017), essential corrections to accurately treat perovskites with strong lattice anharmonicity Klarbring et al. (2020); Li et al. (2023a). The calculated values of are consistent with the experimental observations as shown in Fig. 3. Further insights into thermal transport are obtained from the spectral- at 300 K, as shown in Fig. S10. Notably, exhibits an extremely low value of 0.18 W/mK at 300 K along both and directions, and along the -axis is almost equal to along the -axis, implying considerable diffusive heat transport in Cs3Bi2I6Cl3 at room temperature.
Note that WTE can only simplify to the AF model to compute of glasses Simoncelli et al. (2023), thus this simplification ignores the anharmonic atomic vibration in glasses. To address these limitations, Simoncelli et al. Simoncelli et al. (2023) proposed a regularization to WTE (rWTE) to compute the of glasses including the anharmonicity using a finite-size model with Fourier interpolation. This method introduces a two-parameter distribution for , denoted as , which is derived by convolving a Lorentzian with a full width at half maximum of and a Gaussian with a variance of . The convolution is often referred to as the Voigt function (see the Methods section for more details).
The order-to-disorder transition in Cs3Bi2I6Cl3 raises a question about the nature of its thermal transport below 200 K: Is the mechanism crystal-like or glass-like? If the former, can be calculated using WTE. If the latter, should follow the thermal transport mechanism of amorphous solids outlined in the rWTE.
To answer this, we used both the WTE and rWTE to calculate the of Cs3Bi2I6Cl3 below 200 K (the rWTE calculation workflow is detailed in Fig. S4). In theory, an infinitely large supercell would be required to capture the global lattice disorder. In practice, we performed an approximation using a supercell with 252 atoms and 3 3 3 -meshes coupled with Fourier interpolations Simoncelli et al. (2023), after a convergence test (see Fig. S7 of SI). This supercell was used to run PIMD simulations at temperatures from 25 K to 200 K. After equilibration, a snapshot was randomly taken from the PIMD trajectories and then relaxed using the NEP. The relaxed structure (shown in Fig. 3) has inherent lattice distortion, with its symmetry classified as 1. This 1 structure then served as the initial equilibrium configuration for computing both WTE and rWTE . Another challenge is that computing anharmonic linewidths with perturbation theory is extremely time-consuming for a unit cell with hundreds of atoms. We thus applied an analytical function (see the Methods section) to fit the linewidths as functions of frequency.
The WTE and rWTE are shown in Fig. 3. At temperatures below 200 K, the computed using WTE for the 1 structure is overestimated. In contrast, computed using rWTE for the 1 structure aligns closely with experimental results in both magnitude and temperature trends. The reason why rWTE is better suited to predict the of Cs3Bi2I6Cl3 at low could be attributed to the significant atomic disorder in Cs3Bi2I6Cl3 at low temperatures, which disrupts the lattice definition. This disruption indicates that heat carriers are likely not phonons (collective lattice vibrations), further suggesting the material exhibits glassy heat transport characteristics.
Finally, we rule out two other possible factors that may affect the comparisons between calculations and measurements. To examine phonon-boundary scattering effects, we computed the spectral mean free path (MFP) of Cs3Bi2I6Cl3 at 25 K. At 25 K, the maximum MFP (Fig. S11) along the direction is approximately 400 nm, which is significantly shorter than the dimensions of the single crystal sample (2.5 2.5 6 mm3) used to measure . We also examined the phonon-isotope effects Lindsay et al. (2013) by considering different isotope masses in HNEMD simulations, and find that these effects are negligible for . Therefore, neither grain size effects nor phonon-isotope scatterings can account for the overestimated WTE with the 1 structure below 200 K, further indicating the necessity of using rWTE to correctly comprehend glassy of Cs3Bi2I6Cl3 below 200 K.
I Conclusion
In summary, we synthesized a single-crystal inorganic halide perovskite Cs3Bi2I6Cl3 and measure its glassy from 20 to 300 K. We developed a machine-learning neuroevolution potential and performed PIMD simulations to investigate its atomic structure. The atomic probability distribution from PIMD trajectories reveal an order-to-disorder transition at 200 K, indicating significant uncorrelated lattice distortion in Cs3Bi2I6Cl3. Given the disordered structure in Cs3Bi2I6Cl3 at low temperatures, we employed both lattice dynamics and molecular dynamics approaches to compute its . We concluded that regularized WTE is best suited to rationalize its glassy at low temperatures, suggesting that the heat transport mechanism of Cs3Bi2I6Cl3 is akin to that of amorphous materials. Our computation workflow considers both nuclear quantum effects and atomic disorder, providing a framework for comprehending and modeling heat transport in strongly disordered materials.
II Methods
II.1 Experiments
Sample preparation
The raw materials CsCl (99.9%, Innochem) and BiI3 (99.99%, Aladdin) were sealed in a quartz tube and placed in a two-zone vertical furnace. The tube was gradually heated to 1023 K, where it was maintained for 40 hours. Subsequently, the lower zone of the furnace was cooled to 903 K over an 8-hour period. The temperatures in both zones were then decreased at a rate of 3 K/h for a total of 90 hours. Finally, the heating was turned off to complete the cooling process, allowing the resulting Cs3Bi2I6Cl3 to crystallize.
Sample characterization
Single-crystal X-ray diffraction (XRD) studies were performed on a Bruker D8 QUEST diffractometer equipped with a Mo K radiation source ( = 0.71073 Å) at room temperature. The crystal structure solution and refinements of Cs3Bi2I6Cl3 is carried out using single crystal XRD at room temperature, as shown in Table S2. The Cs3Bi2I6Cl3 sample possesses the trigonal structure with a space group . As presented in Figure S1, all the peaks of powder XRD pattern fit well with the Cs3Bi2I6Cl3 pattern. The XRD pattern tested on the cleavage plane shows that the crystal is liable to fracture along the crystal plane due to the weak chemical bonds between the layers.
Thermal conductivity measurement
The cleavage plane of crystalline Cs3Bi2I6Cl3 is the ( is an integer) plane. To measure the in the cleavage plane ( or ) and across the cleavage plane (), two cubes (sectional area: 2.5 mm 2.5 mm; height: 6 mm) were cut from the obtained crystal for the thermal conductivity measurement. The low-temperature was measured using a physical properties measurement system (PPMS, Quantum Design). The Cs3Bi2I6Cl3 crystal is nonconductive Acharyya et al. (2022), so the measured thermal conductivity is equal to the lattice thermal conductivity. Our measurements of agree very well with the previous experiments Acharyya et al. (2022).
II.2 Calculations
Constructing the MLP.
We utilized the neural-network-based neuroevolution potential (NEP) approach Fan et al. (2021, 2022) to develop a MLP for Cs3Bi2I6Cl3. The procedure begins with obtaining the relaxed structure at 0 K using the VASP package Kresse and Furthmüller (1996); Kresse and Joubert (1999). Subsequently, we conducted ab initio molecular dynamics (AIMD) simulations in the NVT ensemble with a 2 2 2 supercell (112 atoms) at temperatures of 20 K, 50 K, 100 K, 200 K, 300 K, 400 K, 500 K, and 600 K, randomly selecting 50 configurations for training at each temperature. Furthermore, AIMD simulations with the NPT ensemble, varying pressure ( 1 Gpa and 2.5 Gpa) at specific temperatures (25 K, 150 K and 300 K), were performed and 30 configurations were randomly chosen for each condition to account for lattice thermal expansion. Taking into account the two-dimensional layered structure of Cs3Bi2I6Cl3, we further selected configurations using the initial NEP, conducting MD simulations with D3 dispersion correction Ying and Fan (2023) at 25 K, 100 K, 200 K, and 300 K. The final training set comprises 1000 configurations. We used the PBEsol functional Perdew et al. (2008) in the DFT calculations, known for its accuracy in predicting lattice constants and in strongly anharmonic crystals Wei et al. (2024). All AIMD simulations employ an energy cutoff value of 400 eV and a -centered 1 1 1 -point mesh with the PBEsol Perdew et al. (2008) functional. We raised the energy cutoff to 550 eV with a denser 3 3 3 -point mesh to perform accurate single-point DFT calculations and obtain the energies and atomic forces of the selected configurations. We used the GPUMD package Fan et al. (2017, 2022) to train the NEP model, and the final training/test root mean square errors (RMSEs) for energy, atomic force, and virial are 0.35/0.33 meV/atom, 0.027/0.026 eV/Å, and 3.79/3.33 meV/atom, respectively.
Cross validation of the NEP model.
To validate our NEP model, we performed path integral molecular dynamics (PIMD) simulations at selected temperatures (25 K, 100 K, 300 K, and 400 K), both with and without the D3 correction, and sampled a number of configurations for subsequent single-point DFT calculations. Parity plots between NEP and DFT for the energies and forces of the sampled configurations are presented in Figs. S2 and S3. Without the D3 correction, The RMSEs for energy and force are 0.36 meV/atom and 0.025 eV/Å, respectively, while they are 0.31 meV/atom and 0.021 eV/Å, respectively, with the D3 correction. The lattice constants (Table S1) and atomic potential energy surfaces of some soft modes (Fig. S12) from DFT and NEP calculations are in good agreement.
MD simulations
We performed path-integral-based and classical MD simulations using the GPUMD package Fan et al. (2017, 2022), with a timestep of 1 fs. PIMD/RPMD simulations were conducted at 25 K and 50 K with 64 beads, at 100 K, 150 K, and 200 K with 32 beads, and at 250 K and 300 K with 16 beads. Convergence tests for the number of beads in these simulations are provided in Fig. S6. For quantum MD simulations, we started with PIMD simulations in an NPT ensemble to obtain equilibrium structures at the specified temperatures. Following this, we run 0.5 ns RPMD simulations to collect atomic trajectories to calculate atomic probability distributions and radial distribution functions, or TRPMD simulations to compute based on the Green-Kubo relationship. Further details on the computation of using Green-Kubo theory with TRPMD simulations are available in Fig. S9 and Note S1 of SI. For classical HNEMD simulations, we used an NPT ensemble, employing a stochastic cell rescaling barostat Bernetti and Bussi (2020) in combination with the stochastic velocity rescaling thermostat Bussi et al. (2007) to calculate . We conducted a thorough examination of size effects and the selection of external forces during HNEMD simulations.
Anharmonic linewidths and its analytical function
Calculating vibrational linewidths rigorously in a complex, atom-heavy primitive cell is highly time-consuming. To address this challenge, previous studies Simoncelli et al. (2023); Thebaud et al. (2022); Harper et al. (2024) introduced a coarse-grained function, , in various formats to reduce computational demands. The only required input to obtain is the exact linewidths at q = 0. Simoncelli et al. Simoncelli et al. (2023) demonstrated that the use of the single-valued function leads to practically identical results for the conductivity of rWTE compared to exact linewidths. This fitting was demonstrated to reliably capture the linewidths of -SiO2 Simoncelli et al. (2023), Mg2Si1-xSnx Thebaud et al. (2022), amorphous Si Fiorentino et al. (2023) and Al2O3 Harper et al. (2024).
Here we used the RPMD simulations with normal mode decomposition method McGaughey and Larkin (2014); Carreras et al. (2017) to obtain the exact anharmonic linewidths of all vibrational modes at q = 0, and then we fit Simoncelli et al. (2023) the as
| (6) |
where and are defined as
| (7) |
| (8) | ||||
Here, is the smallest non-zero frequency when , and = 70 cm-1 is a broadening parameter set large enough to ensure smooth averaging of linewidths. The full-order lattice anharmonicity is intrinsically considered for anharmonic linewidths extracted from the normal mode decomposition with ring-polymer or classical MD simulations (see Fig. S5 of SI for comparisons).
Voigt function
A two-parameter distribution, denoted as , is derived by convolving a Lorentzian with a full width at half maximum of and a Gaussian with a variance of . This replaces the one-parameter distribution found in Eq. 4 within the WTE. Specifically, it involves a Gaussian distribution with a height of (FWHM ) and a Lorentzian distribution with a height of (FWHM ). The convolution of these distributions is often expressed as the extended pseudo-Voigt function, employing an accurate and efficient numerical approximation. A detailed discussion can be found in refs. Ida et al. (2000); Simoncelli et al. (2023). The convergence test with respect to the broadening parameter is shown in Fig. S8 of SI. In this work, is equal to 5 cm-1 to compute rWTE .
WTE thermal conductivity of crystal Cs3Bi2I6Cl3
We obtained the temperature-dependent cubic and quartic interatomic force constants (IFCs) at 250 K and 300 K using the hiPhive package Eriksson et al. (2019). The harmonic terms at 0 K calculated using Phonopy Togo and Tanaka (2015) were subtracted from the atomic forces and only cubic and quartic IFCs were extracted to the residual force-displacement data. We collected the force-displacement data from RPMD simulations Li et al. (2023b). Three-phonon linewidths were calculated using the ShengBTE Li et al. (2014) package. Four-phonon linewidths were calculated using our code based on the formulae developed by Feng et al. Feng and Ruan (2016); Feng et al. (2017). We carefully tested the relation between -point mesh and , and a 6 6 6 -point mesh was used to compute the phonon linewidths and the of Cs3Bi2I6Cl3. The scarebroad in the ShengBTE package, which determines the width of the Gaussian smearing function for numerically ensuring the energy conservation process in phonon-phonon scatterings, was set to 1 and 0.1 for the calculations of the three- and four-phonon scatterings, respectively. We also calculated the WTE conductivity based on our experimental lattice constants at 300 K, and the calculated WTE ( = 0.227 Wm-1K-1; = 0.231 Wm-1K-1) based on experimental lattice constants show a better agreement with the measurements, compared to those based on the predicted lattice constants of NEP.
HNEMD and its quantum correction
In HNEMD Fan et al. (2019); Evans (1982), one applies an external driving force
| (9) |
to generate a nonzero heat current. Here is the driving force parameter and is the virial tensor for atom . Within the linear-response regime, the heat current is proportional to the driving force parameter as
| (10) |
where is the volume of the simulated system, and and are Cartesian directions. Considering diagonal elements of the thermal conductivity tensor and dropping the tensor indices, the cumulative thermal conductivity in one direction can be expressed as
| (11) |
The HNEMD approach Fan et al. (2019) also allows for obtaining the spectral thermal conductivity
| (12) |
Here, is the virial-velocity correlation function and its vectorial version is defined as
| (13) |
The classical spectral thermal conductivity can be quantum-corrected Turney et al. (2009); Wang et al. (2023) by multiplying it with the ratio of quantum-to-classical modal heat capacity:
| (14) |
where .
Spectral Mean free path
To compute the vibrational mean free paths (MFPs) of the vibrational modes, we first perform a single NEMD simulation in the ballistic limit (low and short supercell length ), equivalent to the atomistic Green’s function approach, and then employ the same spectral decomposition method as in HNEMD to obtain the spectral thermal conductance Wang et al. (2023):
| (15) |
where is the temperature difference between the heat source and the heat sink in the NEMD setup. Then we can derive the spectral MFP as Fan et al. (2019)
| (16) |
Acknowledgments ZZ acknowledges the European Union’s Horizon 2020 research and innovation programme under the Marie Skłodowska-Curie grant agreement No 101034413. The authors acknowledge the research computing facilities offered by HPC ISTA and ITS HKU.
References
- Peierls (1929) R. Peierls, “Zur kinetischen theorie der wärmeleitung in kristallen,” Annalen der Physik 395, 1055 (1929).
- Zeng et al. (2024) Z. Zeng, X. Shen, R. Cheng, O. Perez, N. Ouyang, Z. Fan, P. Lemoine, B. Raveau, E. Guilmeau, and Y. Chen, “Pushing thermal conductivity to its lower limit in crystals with simple structures,” Nature Communications 15, 3007 (2024).
- Lee et al. (2017) W. Lee, H. Li, A. B. Wong, D. Zhang, M. Lai, Y. Yu, Q. Kong, E. Lin, J. J. Urban, J. C. Grossman, et al., “Ultralow thermal conductivity in all-inorganic halide perovskites,” Proceedings of the National Academy of Sciences 114, 8693 (2017).
- Zink et al. (2006) B. Zink, R. Pietri, and F. Hellman, “Thermal conductivity and specific heat of thin-film amorphous silicon,” Physical review letters 96, 055902 (2006).
- Cahill (1990) D. G. Cahill, “Thermal conductivity measurement from 30 to 750 k: the 3 method,” Review of scientific instruments 61, 802 (1990).
- Anderson et al. (1972) P. W. Anderson, B. I. Halperin, and C. M. Varma, “Anomalous low-temperature thermal properties of glasses and spin glasses,” Philosophical Magazine 25, 1 (1972).
- Schirmacher et al. (2007) W. Schirmacher, G. Ruocco, and T. Scopigno, “Acoustic attenuation in glasses and its relation with the boson peak,” Physical review letters 98, 025501 (2007).
- Allen and Feldman (1989) P. B. Allen and J. L. Feldman, “Thermal conductivity of glasses: Theory and application to amorphous si,” Physical review letters 62, 645 (1989).
- Allen and Feldman (1993) P. B. Allen and J. L. Feldman, “Thermal conductivity of disordered harmonic solids,” Physical Review B 48, 12581 (1993).
- Acharyya et al. (2022) P. Acharyya, T. Ghosh, K. Pal, K. S. Rana, M. Dutta, D. Swain, M. Etter, A. Soni, U. V. Waghmare, and K. Biswas, “Glassy thermal conductivity in cs3bi2i6cl3 single crystal,” Nature communications 13, 5053 (2022).
- Sun et al. (2020) B. Sun, S. Niu, R. P. Hermann, J. Moon, N. Shulumba, K. Page, B. Zhao, A. S. Thind, K. Mahalingam, J. Milam-Guerrero, et al., “High frequency atomic tunneling yields ultralow and glass-like thermal conductivity in chalcogenide single crystals,” Nature Communications 11, 6039 (2020).
- Zhao et al. (2022) B. Zhao, M. S. B. Hoque, G. Y. Jung, H. Mei, S. Singh, G. Ren, M. Milich, Q. Zhao, N. Wang, H. Chen, et al., “Orientation-controlled anisotropy in single crystals of quasi-1d batis3,” Chemistry of Materials 34, 5680 (2022).
- Hoque et al. (2023) M. S. B. Hoque, E. R. Hoglund, B. Zhao, D.-L. Bao, H. Zhou, S. Thakur, E. Osei-Agyemang, K. Hattar, E. A. Scott, M. Surendran, et al., “Ruddlesden-popper chalcogenides push the limit of mechanical stiffness and glass-like thermal conductivity in crystals,” arXiv preprint arXiv:2312.02534 (2023).
- Cahill et al. (1992) D. G. Cahill, S. K. Watson, and R. O. Pohl, “Lower limit to the thermal conductivity of disordered crystals,” Physical Review B 46, 6131 (1992).
- Beekman and Cahill (2017) M. Beekman and D. G. Cahill, “Inorganic crystals with glass-like and ultralow thermal conductivities,” Crystal Research and Technology 52, 1700114 (2017).
- Sales et al. (2001) B. C. Sales, B. Chakoumakos, R. Jin, J. Thompson, and D. Mandrus, “Structural, magnetic, thermal, and transport properties of x 8 ga 16 ge 30 (x= e u, s r, ba) single crystals,” Physical Review B 63, 245113 (2001).
- Parrinello and Rahman (1984) M. Parrinello and A. Rahman, “Study of an F center in molten KCl,” The Journal of Chemical Physics 80, 860 (1984).
- Feynman et al. (2010) R. P. Feynman, A. R. Hibbs, and D. F. Styer, Quantum mechanics and path integrals (Courier Corporation, 2010).
- Cao and Voth (1994) J. Cao and G. A. Voth, “The formulation of quantum statistical mechanics based on the feynman path centroid density. iv. algorithms for centroid molecular dynamics,” The Journal of chemical physics 101, 6168 (1994).
- Habershon et al. (2013) S. Habershon, D. E. Manolopoulos, T. E. Markland, and T. F. Miller III, “Ring-polymer molecular dynamics: Quantum effects in chemical dynamics from classical trajectories in an extended phase space,” Annual review of physical chemistry 64, 387 (2013).
- Rossi et al. (2014) M. Rossi, M. Ceriotti, and D. E. Manolopoulos, “How to remove the spurious resonances from ring polymer molecular dynamics,” The Journal of chemical physics 140 (2014).
- Luo and Yu (2020) R. Luo and K. Yu, “Capturing the nuclear quantum effects in molecular dynamics for lattice thermal conductivity calculations: Using ice as example,” The Journal of Chemical Physics 153 (2020).
- Sutherland et al. (2021) B. J. Sutherland, W. H. Moore, and D. E. Manolopoulos, “Nuclear quantum effects in thermal conductivity from centroid molecular dynamics,” The Journal of Chemical Physics 154 (2021).
- Caldarelli et al. (2022) G. Caldarelli, M. Simoncelli, N. Marzari, F. Mauri, and L. Benfatto, “Many-body green’s function approach to lattice thermal transport,” Physical Review B 106, 024312 (2022).
- Simoncelli et al. (2019) M. Simoncelli, N. Marzari, and F. Mauri, “Unified theory of thermal transport in crystals and glasses,” Nature Physics 15, 809 (2019).
- Simoncelli et al. (2022) M. Simoncelli, N. Marzari, and F. Mauri, “Wigner formulation of thermal transport in solids,” Physical Review X 12, 041011 (2022).
- Isaeva et al. (2019) L. Isaeva, G. Barbalinardo, D. Donadio, and S. Baroni, “Modeling heat transport in crystals and glasses from a unified lattice-dynamical approach,” Nature communications 10, 3853 (2019).
- Barbalinardo et al. (2020) G. Barbalinardo, Z. Chen, N. W. Lundgren, and D. Donadio, “Efficient anharmonic lattice dynamics calculations of thermal transport in crystalline and disordered solids,” Journal of Applied Physics 128 (2020).
- Simoncelli et al. (2023) M. Simoncelli, F. Mauri, and N. Marzari, “Thermal conductivity of glasses: first-principles theory and applications,” npj Computational Materials 9, 106 (2023).
- Fiorentino et al. (2024) A. Fiorentino, E. Drigo, S. Baroni, and P. Pegolo, “Unearthing the foundational role of anharmonicity in heat transport in glasses,” Physical Review B 109, 224202 (2024).
- He and Yang (2018) Q. He and Y. Yang, “On lattice distortion in high entropy alloys,” Frontiers in Materials 5, 42 (2018).
- Fan et al. (2021) Z. Fan, Z. Zeng, C. Zhang, Y. Wang, K. Song, H. Dong, Y. Chen, and T. Ala-Nissila, “Neuroevolution machine learning potentials: Combining high accuracy and low cost in atomistic simulations and application to heat transport,” Physical Review B 104, 104309 (2021).
- Fan et al. (2022) Z. Fan, Y. Wang, P. Ying, K. Song, J. Wang, Y. Wang, Z. Zeng, K. Xu, E. Lindgren, J. M. Rahm, et al., “Gpumd: A package for constructing accurate machine-learned potentials and performing highly efficient atomistic simulations,” The Journal of Chemical Physics 157 (2022).
- Perdew et al. (2008) J. P. Perdew, A. Ruzsinszky, G. I. Csonka, O. A. Vydrov, G. E. Scuseria, L. A. Constantin, X. Zhou, and K. Burke, “Restoring the density-gradient expansion for exchange in solids and surfaces,” Physical review letters 100, 136406 (2008).
- Grimme et al. (2011) S. Grimme, S. Ehrlich, and L. Goerigk, “Effect of the damping function in dispersion corrected density functional theory,” Journal of computational chemistry 32, 1456 (2011).
- Keen and Goodwin (2015) D. A. Keen and A. L. Goodwin, “The crystallography of correlated disorder,” Nature 521, 303 (2015).
- Simonov and Goodwin (2020) A. Simonov and A. L. Goodwin, “Designing disorder into crystalline materials,” Nature Reviews Chemistry 4, 657 (2020).
- Liang et al. (2023) X. Liang, J. Klarbring, W. J. Baldwin, Z. Li, G. Csányi, and A. Walsh, “Structural dynamics descriptors for metal halide perovskites,” The Journal of Physical Chemistry C 127, 19141 (2023).
- Božin et al. (2010) E. S. Božin, C. D. Malliakas, P. Souvatzis, T. Proffen, N. A. Spaldin, M. G. Kanatzidis, and S. J. Billinge, “Entropically stabilized local dipole formation in lead chalcogenides,” Science 330, 1660 (2010).
- Meekel and Goodwin (2021) E. G. Meekel and A. L. Goodwin, “Correlated disorder in metal–organic frameworks,” CrystEngComm 23, 2915 (2021).
- Fransson et al. (2021) E. Fransson, M. Slabanja, P. Erhart, and G. Wahnström, “Dynasor—a tool for extracting dynamical structure factors and current correlation functions from molecular dynamics simulations,” Advanced Theory and Simulations 4, 2000240 (2021).
- Hellman et al. (2013) O. Hellman, P. Steneteg, I. A. Abrikosov, and S. I. Simak, “Temperature dependent effective potential method for accurate free energy calculations of solids,” Physical Review B 87, 104111 (2013).
- Lanigan-Atkins et al. (2021) T. Lanigan-Atkins, X. He, M. Krogstad, D. Pajerowski, D. Abernathy, G. N. Xu, Z. Xu, D.-Y. Chung, M. Kanatzidis, S. Rosenkranz, et al., “Two-dimensional overdamped fluctuations of the soft perovskite lattice in cspbbr3,” Nature materials 20, 977 (2021).
- Zhang et al. (2008) Y. Zhang, Y. J. Zhou, J. P. Lin, G. L. Chen, and P. K. Liaw, “Solid-solution phase formation rules for multi-component alloys,” Advanced engineering materials 10, 534 (2008).
- Song et al. (2017) H. Song, F. Tian, Q.-M. Hu, L. Vitos, Y. Wang, J. Shen, and N. Chen, “Local lattice distortion in high-entropy alloys,” Physical Review Materials 1, 023404 (2017).
- Acharyya et al. (2023) P. Acharyya, K. Pal, A. Ahad, D. Sarkar, K. S. Rana, M. Dutta, A. Soni, U. V. Waghmare, and K. Biswas, “Extended antibonding states and phonon localization induce ultralow thermal conductivity in low dimensional metal halide,” Advanced Functional Materials 33, 2304607 (2023).
- Fan et al. (2019) Z. Fan, H. Dong, A. Harju, and T. Ala-Nissila, “Homogeneous nonequilibrium molecular dynamics method for heat transport and spectral decomposition with many-body potentials,” Physical Review B 99, 064308 (2019).
- Evans (1982) D. J. Evans, “Homogeneous nemd algorithm for thermal conductivity—application of non-canonical linear response theory,” Physics Letters A 91, 457 (1982).
- Wang et al. (2023) Y. Wang, Z. Fan, P. Qian, M. A. Caro, and T. Ala-Nissila, “Quantum-corrected thickness-dependent thermal conductivity in amorphous silicon predicted by machine learning molecular dynamics simulations,” Physical Review B 107, 054303 (2023).
- Feng and Ruan (2016) T. Feng and X. Ruan, “Quantum mechanical prediction of four-phonon scattering rates and reduced thermal conductivity of solids,” Physical Review B 93, 045202 (2016).
- Feng et al. (2017) T. Feng, L. Lindsay, and X. Ruan, “Four-phonon scattering significantly reduces intrinsic thermal conductivity of solids,” Physical Review B 96, 161201 (2017).
- Klarbring et al. (2020) J. Klarbring, O. Hellman, I. A. Abrikosov, and S. I. Simak, “Anharmonicity and ultralow thermal conductivity in lead-free halide double perovskites,” Physical Review Letters 125, 045701 (2020).
- Li et al. (2023a) J. Li, L. Wei, Z. Ti, L. Ma, Y. Yan, G. Zhang, and P.-F. Liu, “Wavelike tunneling of phonons dominates glassy thermal conductivity in crystalline cs 3 bi 2 i 6 cl 3,” Physical Review B 108, 224302 (2023a).
- Lindsay et al. (2013) L. Lindsay, D. Broido, and T. Reinecke, “Phonon-isotope scattering and thermal conductivity in materials with a large isotope effect: A first-principles study,” Physical review B 88, 144306 (2013).
- Kresse and Furthmüller (1996) G. Kresse and J. Furthmüller, “Efficient iterative schemes for ab initio total-energy calculations using a plane-wave basis set,” Physical review B 54, 11169 (1996).
- Kresse and Joubert (1999) G. Kresse and D. Joubert, “From ultrasoft pseudopotentials to the projector augmented-wave method,” Physical review b 59, 1758 (1999).
- Ying and Fan (2023) P. Ying and Z. Fan, “Combining the d3 dispersion correction with the neuroevolution machine-learned potential,” Journal of Physics: Condensed Matter 36, 125901 (2023).
- Wei et al. (2024) J. Wei, Z. Xia, Y. Xia, and J. He, “Hierarchy of exchange-correlation functionals in computing lattice thermal conductivities of rocksalt and zincblende semiconductors,” arXiv preprint arXiv:2404.06346 (2024).
- Fan et al. (2017) Z. Fan, W. Chen, V. Vierimaa, and A. Harju, “Efficient molecular dynamics simulations with many-body potentials on graphics processing units,” Computer Physics Communications 218, 10 (2017).
- Bernetti and Bussi (2020) M. Bernetti and G. Bussi, “Pressure control using stochastic cell rescaling,” The Journal of Chemical Physics 153 (2020).
- Bussi et al. (2007) G. Bussi, D. Donadio, and M. Parrinello, “Canonical sampling through velocity rescaling,” The Journal of chemical physics 126 (2007).
- Thebaud et al. (2022) S. Thebaud, T. Berlijn, and L. Lindsay, “Perturbation theory and thermal transport in mass-disordered alloys: Insights from green’s function methods,” Physical Review B 105, 134202 (2022).
- Harper et al. (2024) A. F. Harper, K. Iwanowski, W. C. Witt, M. C. Payne, and M. Simoncelli, “Vibrational and thermal properties of amorphous alumina from first principles,” Physical Review Materials 8, 043601 (2024).
- Fiorentino et al. (2023) A. Fiorentino, P. Pegolo, and S. Baroni, “Hydrodynamic finite-size scaling of the thermal conductivity in glasses,” npj Computational Materials 9, 157 (2023).
- McGaughey and Larkin (2014) A. J. McGaughey and J. M. Larkin, “Predicting phonon properties from equilibrium molecular dynamics simulations,” Annual review of heat transfer 17 (2014).
- Carreras et al. (2017) A. Carreras, A. Togo, and I. Tanaka, “Dynaphopy: A code for extracting phonon quasiparticles from molecular dynamics simulations,” Computer Physics Communications 221, 221 (2017).
- Ida et al. (2000) T. Ida, M. Ando, and H. Toraya, “Extended pseudo-voigt function for approximating the voigt profile,” Journal of Applied Crystallography 33, 1311 (2000).
- Eriksson et al. (2019) F. Eriksson, E. Fransson, and P. Erhart, “The hiphive package for the extraction of high-order force constants by machine learning,” Advanced Theory and Simulations 2, 1800184 (2019).
- Togo and Tanaka (2015) A. Togo and I. Tanaka, “First principles phonon calculations in materials science,” Scripta Materialia 108, 1 (2015).
- Li et al. (2023b) Z. Li, Y. Xia, and C. Wolverton, “First-principles calculations of lattice thermal conductivity in tl 3 vse 4: Uncertainties from different approaches of force constants,” Physical Review B 108, 184307 (2023b).
- Li et al. (2014) W. Li, J. Carrete, N. A. Katcho, and N. Mingo, “Shengbte: A solver of the boltzmann transport equation for phonons,” Computer Physics Communications 185, 1747 (2014).
- Turney et al. (2009) J. Turney, A. McGaughey, and C. Amon, “Assessing the applicability of quantum corrections to classical thermal conductivity predictions,” Physical Review B 79, 224305 (2009).