Stirring the cosmic pot: how black hole feedback shapes the matter power spectrum in the fable simulations
Abstract
Understanding the impact of baryonic physics on cosmic structure formation is crucial for accurate cosmological predictions, especially as we usher in the era of large galaxy surveys with the Rubin Observatory as well as the Euclid and Roman Space Telescopes. A key process that can redistribute matter across a large range of scales is feedback from accreting supermassive black holes. How exactly these active galactic nuclei (AGN) operate from sub-parsec to Mega-parsec scales however remains largely unknown. To understand this, we investigate how different AGN feedback models in the fable simulation suite affect the cosmic evolution of the matter power spectrum (MPS). Our analysis reveals that AGN feedback significantly suppresses clustering at scales , with the strongest effect at redshift causing a reduction of with respect to the dark matter-only simulation. This is due to the efficient feedback in both radio (low Eddington ratio) and quasar (high Eddington ratio) modes in our fiducial fable model. We find that variations of the quasar and radio mode feedback with respect to the fiducial fable model have distinct effects on the MPS redshift evolution, with radio mode being more effective on larger scales and later epochs. Furthermore, MPS suppression is dominated by AGN feedback effects inside haloes at , while for the matter distribution both inside and outside of haloes shapes the MPS suppression. Hence, future observations probing earlier cosmic times beyond will be instrumental in constraining the nature of AGN feedback.
keywords:
methods: numerical – large-scale structure of Universe – galaxies: clusters: general – galaxies: formation1 Introduction
The underlying cosmology of our Universe dictates the properties and evolution of cosmic structure. One of these is the distribution of mass in our Universe, which has been mapped through both structure formation and late-time surveys (e.g., Heymans et al., 2021; Abbott et al., 2022; Qu et al., 2024), and early Universe observations of the Cosmic Microwave Background (Hinshaw et al., 2013; Ade et al., 2016). Numerical and observational studies have shown that baryonic physics, specifically feedback processes from stars and black holes, may significantly impact the distribution of matter across the cosmic web (e.g., Seljak, 2000; van Daalen et al., 2011; Chisari et al., 2018; Secco et al., 2022). With programmes like the Vera C. Rubin Observatory (Ivezić et al., 2019), the Euclid Space Telescope (Laureijs et al., 2011) and the Roman Space Telescope (Spergel et al., 2013) preparing to map the Large-Scale Structure (LSS) with unprecedented accuracy, precise theoretical model predictions are urgently required to understand the processes that shape the distribution of galaxies and the underlying matter across cosmic time.
Baryonic feedback plays a crucial role in the formation of individual galaxies, where supernovae and AGN activity have been identified as some of the key processes (e.g., White & Frenk, 1991; Sijacki et al., 2007; Hopkins et al., 2014; Habouzit et al., 2017; Rosdahl et al., 2018; Trebitsch et al., 2020). Such feedback is required to reconcile local observations with small-scale challenges to our CDM model (Bullock & Boylan-Kolchin, 2017) as well as to produce a realistic global star formation history (Madau & Dickinson, 2014), or massive quenched elliptical galaxies and the brightest cluster galaxies (McNamara & Nulsen, 2007; Fabian, 2012). Through galactic outflows and AGN-driven winds, these feedback processes also provide a channel for galaxies to interact with their larger-scale environment and the local distribution of matter, and influence statistics such as the matter power spectrum (MPS) (van Daalen et al., 2011; Chisari et al., 2019). Moreover, a wide range of not-so-well-understood baryonic feedback processes such as cosmic rays or magnetism are gaining popularity in the realistic modelling of outflows from galaxies (e.g., Pakmor et al., 2016; Girichidis et al., 2018; Martin-Alvarez et al., 2020; Hopkins et al., 2020; Farcy et al., 2022; Beckmann et al., 2022; Martin-Alvarez et al., 2023; Rodríguez et al., 2024), and may significantly affect how galaxies shape the local distribution of matter.
AGN feedback is the main process regulating the evolution of the most massive galaxies, galaxy groups, and galaxy clusters (Sijacki et al., 2007; Cavagnolo et al., 2010; Bourne & Sijacki, 2017; Chisari et al., 2018; Beckmann et al., 2019; Bourne & Yang, 2023). The outflows driven by AGN are extremely energetic and can reach scales up to Mpc, making this form of feedback the most important for the cosmic distribution of matter (e.g., van Daalen et al., 2011; Mead et al., 2015; McCarthy et al., 2018; Chisari et al., 2019), primarily through redistribution of matter within and beyond the largest haloes (e.g., van Daalen & Schaye, 2015; van Daalen et al., 2020; van Loon & van Daalen, 2023). While the influence of AGN feedback can be captured through simple halo models (Seljak, 2000; Mead et al., 2021), due to the complex relationship between the small-scale regulation of accretion onto supermassive black holes (SMBHs), galaxy formation physics, and the large-scale effects of AGN feedback, cosmological simulations are required to understand its effect on the MPS.
Multiple studies employing some of the largest and most sophisticated cosmological simulations to date (e.g., Vogelsberger et al., 2014c; Hellwing et al., 2016; Springel et al., 2018; Chisari et al., 2018; van Daalen et al., 2020; Sorini et al., 2022; van Loon & van Daalen, 2023; Schaye et al., 2023; Gebhardt et al., 2024) have established that AGN feedback affects the MPS at scales . The resulting power suppression with respect to the dark matter non-linear prediction in these models reaches up to (Chisari et al., 2019). While these different simulations display similar qualitative behaviour, quantitative differences across results are significant, emerging from different feedback implementation strategies and configurations, as well as from different model resolutions and numerical solvers.
To better comprehend the discrepancies between different simulations, a more detailed understanding of how different AGN feedback models affect the MPS is required, and how this impact emerges around different galaxies and environments. AGN feedback is an inherently multi-scale phenomenon, spanning from event horizon and accretion disc scales at which the feedback (in the form of radiation, winds and jets) is produced, out to scales beyond the host galaxy itself. As such, modelling this process in full is virtually impossible within a single simulation. Instead, cosmological simulations have to employ sub-grid models that can capture the effects of AGN feedback and how it couples to baryons at resolvable scales. These models can vary in their sophistication and their made assumptions. The simplest approach is direct thermal energy injection into cells or particles close to the black hole (Springel et al., 2005; Booth & Schaye, 2009; Schaye et al., 2015; Tremmel et al., 2019), often combined with numerically-motivated modifications, such as minimum heating temperatures (Booth & Schaye, 2009; Schaye et al., 2015; McCarthy et al., 2017), fixed duty cycles (Henden et al., 2018; Koudmani et al., 2022) or artificial prevention of radiative cooling (Tremmel et al., 2017, 2019) in order to avoid over-cooling (see discussions in Bourne et al., 2015; Schaye et al., 2015; Crain et al., 2015; Zubovas et al., 2016). Other models inject momentum to surrounding gas as bipolar wind or jet-like outflows (Dubois et al., 2014; Weinberger et al., 2018; Davé et al., 2019), with several works including separate quasar and radio mode phases that use different energy injection schemes for each (Sijacki et al., 2007; Dubois et al., 2014; Sijacki et al., 2015; Henden et al., 2018; Dubois et al., 2021). Simulations are additionally performed over a wide range of resolutions, which itself can impact the range of gas phases captured and how feedback couples to these different phases (e.g., Bourne et al., 2015; Beckmann et al., 2019; Koudmani et al., 2019; Talbot et al., 2024; Hopkins et al., 2024a). Taking this into account, as well as the use of different codes to perform cosmological simulations, model parameters are typically calibrated to match low-redshift observables such as the galaxy stellar mass function and BH scaling relations (Dubois et al., 2014; Schaye et al., 2015; Sijacki et al., 2015; Pillepich et al., 2018) meaning that different feedback models, in different codes and at different resolutions can result in comparable galaxy populations. As such it is the galaxy properties to which simulation parameters are not tuned that can be used to differentiate between models.
One such quantity is the gas content of groups and clusters, which has been suggested as a proxy for the expected suppression in the MPS (McCarthy et al. 2018; Schneider et al. 2019; and see figures 16 and 17 by van Daalen et al. 2020). The AGN model in the original Illustris suite of simulations was too effective at expelling gas from groups and low mass clusters (Genel et al., 2014), and indeed, the MPS suppression found in Illustris is more extreme than that found in other simulations that retain higher baryon fractions (Chisari et al., 2019; van Daalen et al., 2020). The fable simulation suite remedied this problem by modifying the feedback models employed in Illustris, making the quasar mode more effective and the radio mode less explosive (Henden et al., 2018) to achieve a better agreement to observations of group and cluster baryon content. In determining their fiducial AGN model, other variations were performed with a total of four presented in Appendix A of Henden et al. (2018), which result in different present-day stellar and gas fractions in groups and clusters. These variations provide an ideal testbed to study the effect of different AGN feedback models on the MPS, which provides a key motivation for the work presented here.
We describe the fable simulations in Section 2.1, and our procedure to MPS in Section 2.2. Our main results are explored in Section 3, where we compare various AGN feedback models (Section 3.2), comparing its effect on fable with previous simulations (Section 3.3). We explore in more detail how feedback effects vary around galaxies under different selections (halo mass, stellar mass, and black hole mass) in Section 3.4. Section 3.5 briefly reviews how different halo mass components trace the MPS suppression from AGN at different scales and times. Finally, we conclude this manuscript in Section 4 with a summary of our work.
2 Numerical methods
| Name | Feedback | Radiative | QM | QM | RM | RM fractional | Comments |
|---|---|---|---|---|---|---|---|
| switch | efficiency | efficiency | duty cycle | efficiency | mass increase | ||
| [Myr] | |||||||
| Fiducial (QuasarDutyRadioStrong) | 0.01 | 0.1 | 0.1 | 25 | 0.8 | 0.01 | standard fable set-up |
| RadioWeak (NoDutyRadioWeak) | 0.05 | 0.1 | 0.1 | - | 0.4 | 0.001 | no QM duty, weak RM |
| RadioStrong (NoDutyRadioStrong) | 0.05 | 0.1 | 0.1 | - | 0.8 | 0.01 | no QM duty, strong RM |
| Quasar (QuasarDutyRadioWeak) | 0.05 | 0.1 | 0.1 | 25 | 0.4 | 0.001 | QM duty, weak RM |
| NoFeedback (NoAGNFeedback) | - | - | - | - | - | - | no AGN feedback |
| DMO (Dark matter only) | - | - | - | - | - | - | no baryons |
| Illustris | 0.05 | 0.2 | 0.05 | - | 0.35 | 0.15 | Illustris set-up for reference |
2.1 fable simulations
In this section, we provide a brief summary of the fable simulation suite (Henden et al., 2018, 2019, 2020), which we employ for our investigation into the impact of AGN feedback models on the MPS and the galaxy bias. For a detailed description of the fable set-up and the calibration of the simulations see Henden et al. (2018).
2.1.1 Basic simulation properties
The fable simulations were performed with the arepo code (Springel, 2010), where the equations of hydrodynamics are solved on a moving unstructured mesh defined by the Voronoi tessellation of a set of discrete points which (approximately) move with the velocity of the local flow. The gravitational interactions are modelled via the TreePM method with stars and DM represented by collisionless particles.
The fable simulation suite comprises large cosmological volumes as well as zoom-in simulations of groups and clusters. Here we focus on the large cosmological volume simulations to investigate the clustering of matter at large scales (rather than examining individual haloes). These 40 () boxes are evolved using initial conditions for a uniformly sampled cosmological volume based on the Planck cosmology (Planck Collaboration XIII, 2016) with DM particles, yielding a resolution of , and initially gas elements with target gas mass resolution . The gravitational softening is set to in physical coordinates below and held fixed in comoving coordinates at higher redshifts.
The fable galaxy formation model is based on Illustris (Vogelsberger et al., 2013; Vogelsberger et al., 2014a; Genel et al., 2014; Torrey et al., 2014; Sijacki et al., 2015), with the prescriptions for radiative cooling (Katz et al., 1996; Wiersma et al., 2009a), uniform ultraviolet background (Faucher-Giguère et al., 2009), chemical enrichment (Wiersma et al., 2009b) and star formation (Springel & Hernquist, 2003) unchanged from the Illustris model. The stellar and AGN feedback prescriptions, on the other hand, are modified to improve agreement with the present-day galaxy stellar mass function and to match the gas mass fractions in observed massive haloes.
2.1.2 Stellar feedback
In the Illustris galactic wind model (Vogelsberger et al., 2013), wind particles are launched from star-forming regions driven by the available energy from core-collapse SNe.
This model is also adopted in fable with a few modifications to the parameters that govern the wind energetics. Specifically, the wind energy factor , which gives the fraction of energy available from each core collapse supernova, is increased to in fable compared to the Illustris value of . Furthermore, one-third of the wind energy is injected as thermal energy in fable, whilst in Illustris the stellar-feedback-driven winds are purely kinetic. Overall, this leads to more energetic stellar feedback which more efficiently dissipates the released energy to the gas, and somewhat more effectively regulating star formation in low-mass haloes (see Henden et al. 2018 for details; the same method is used by Marinacci et al. 2014).
2.1.3 Black hole seeding and growth
BHs are modelled as collisionless particles and are seeded into DM haloes above a mass threshold of with a seed mass of .
Subsequently, these BHs may grow via BH – BH mergers and gas accretion following the Eddington-limited Bondi-Hoyle-Lyttleton accretion rate with boost factor (Hoyle & Lyttleton, 1939; Bondi & Hoyle, 1944; Springel et al., 2005). For all AGN models the radiative efficiency is set to a constant and of the accreted mass is added to the BH particle mass at each timestep.
2.1.4 AGN feedback
Analogously to Illustris, the AGN feedback in fable is based on a two-mode model, with the quasar mode operating at high Eddington ratios (see Di Matteo et al., 2005; Springel et al., 2005) and the radio mode being activated at low Eddington ratios (see Sijacki et al., 2007). For the fiducial fable simulation set-up, this switch occurs at an Eddington ratio of (compared to in Illustris).
In the quasar mode, a fraction of the AGN luminosity is isotropically injected as thermal energy. In Illustris, this thermal energy injection happens continuously, which can lead to artificial overcooling as small amounts of energy are distributed preferentially into the densest material over a large gas mass due to the limited gas mass resolution. In fable, this issue is alleviated by introducing a duty cycle with an approach similar to that of Booth & Schaye (2009), whereby thermal energy is accumulated over Myr before being released in a single event, allowing high feedback temperatures, and hence longer cooling times, to be reached. Such a feedback cycle is also, at least qualitatively, consistent with episodic accretion observed in high-resolution simulations (Ciotti et al., 2010; Torrey et al., 2017; Costa et al., 2018).
In the radio mode, the feedback energy is coupled to the gas as hot buoyantly-rising bubbles to mimic those inflated by jets (McNamara & Nulsen, 2007; Fabian, 2012; Bourne & Yang, 2023), with the duty cycle of these bubble injections set by the fractional BH mass growth . In fable, this threshold is set to – much smaller than the Illustris value of . The bubble energy content is determined as with the radio mode coupling efficiency set to in the fiducial fable model. This yields a similar effective radio mode efficiency as in the Illustris model (where the effective radio mode efficiency is set to 7 percent). The lower then results in more frequent and less energetic bubbles in fable compared to the Illustris set-up.
2.1.5 AGN model variations
In addition to the fiducial fable model, Henden et al. (2018) explore three additional AGN feedback parametrizations:
-
–
The RadioStrong set-up, which has the same radio mode parameters as the fiducial run but no quasar duty cycle.
-
–
The Quasar set-up, which employs a quasar duty cycle but has significantly weaker radio mode feedback with a lower threshold for bubble injections () and a lower coupling efficiency ().
-
–
The RadioWeak set-up, which does not have a quasar duty cycle and employs the weaker radio mode feedback.
Together with the fiducial run, these three alternative AGN set-ups then allow us to isolate the impact of the quasar duty cycle and increasing the strength of the radio mode feedback. Note that all of the additional runs also have a higher critical Eddington fraction for switching to the quasar mode (, as in Illustris).
Furthermore, we also analyse the results from an additional fable model variation, NoFeedback, which was performed without seeding any black holes, therefore providing a useful reference run without any AGN feedback.
The four AGN runs and the no-AGN run form the core of our analysis and the corresponding AGN parameters for these five set-ups are listed in Table 1. For reference, the corresponding parameters for the original Illustris simulation set-up are also given.
2.1.6 Halo and galaxy identification
For our analysis, we identify DM haloes (‘groups’) and galaxies (‘subhaloes’) via the friends-of-friends (FoF) and subfind algorithms (Davis et al., 1985; Springel et al., 2001; Dolag et al., 2009), respectively. The FoF search linking length is set to 0.2 times the mean particle separation. Within the FoF groups gravitationally bound systems are identified as subhaloes, as found by subfind. The central subhalo corresponds to the subhalo at the minimum potential of the FoF group whilst all other subhaloes in the same group are categorised as satellites.
We characterise the galaxy properties employing the total stellar mass of each subhalo as the stellar mass of each galaxy , the central black hole mass in each subhalo as , and the subhalo total mass as . For the NoFeedback and DMO models, we estimate the and of each galaxy interpolating its in the Fiducial model relationships. These relationships are presented and described in Section 3.4.
2.2 Power spectra
We focus our investigation on the matter power spectrum, which provides information of the matter clustering at different scales, studied here in Fourier space and characterised by a wavelength in units of . In order to extract from the fable simulations the studied matter power spectra and cross-correlations between quantities, we make use of the FFTW library111The FFTW library can be found at http://www.fftw.org/.. We project the entire computational domain of the simulation onto a uniform grid of cells. Hence the computational domain with a physical size of () is resolved down to (). Consequently, each of our spectra spans from to . To obtain the MPS, we project onto a 3D grid all the particles included in fable (i.e. dark matter, stars, gas and black holes), employing a simple nearest grid point (NGP) interpolation. Finally, whenever performing a cross-correlation between two scalar fields, we compute this through their multiplication in Fourier space, finally averaging onto a 1D k-space binning.
3 Results
3.1 A qualitative comparison of AGN impact around massive galaxies

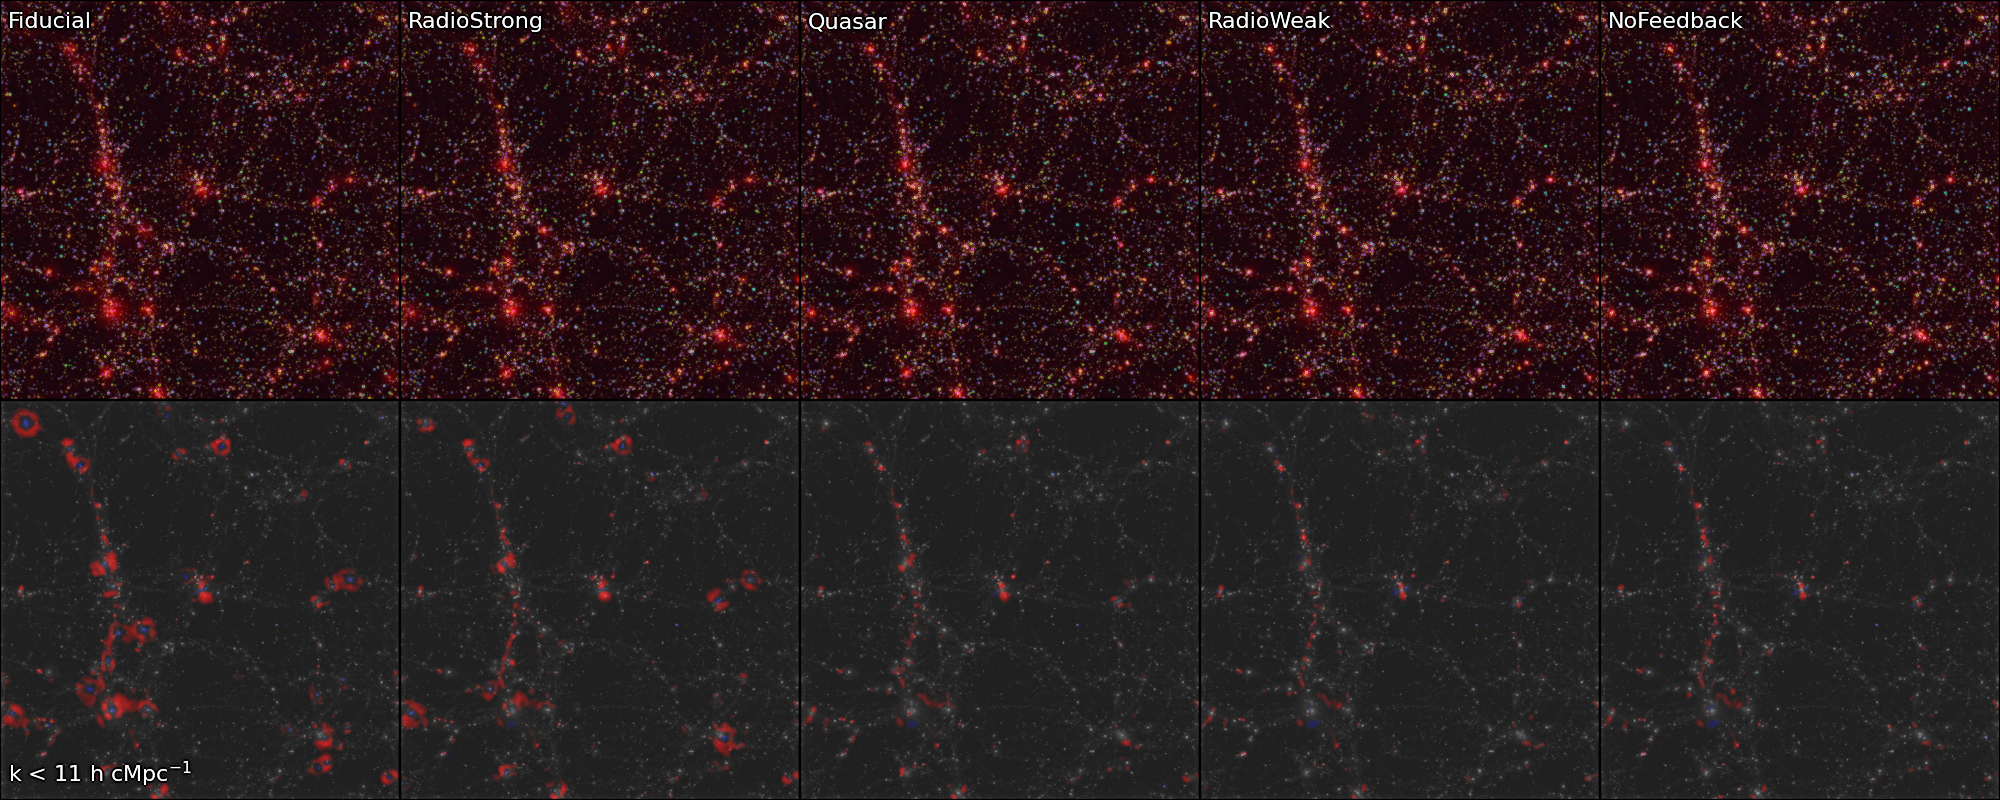

As the hot gas ejected by AGN feedback escapes from galaxies and expands against the circumgalactic and intergalactic medium, it leads to the ejection of gas from the densest regions of the cosmic web, reducing the amount of clustering on the smallest scales. To provide a qualitative visualization of this effect, we display in Figure 1 overdensity and density contrast maps, with each of the studied simulations corresponding to a different column. The first row of panels shows RGB projections where the overdensity at different scales is represented in colours: large (red; ), intermediate (green; ) and small (blue; ). Such separation is generated in 3D Fourier space, through a band-pass filter that isolates a specific range of scales applied to the entire simulated domain. The resulting remaining power is then converted back to configuration space, and the corresponding overdensity field employed to generate the projections. As the baryonic impact amounts to proportions of no more than in most simulations (e.g., the set compiled by Chisari et al., 2019), the overdensity projections in this first row show only subtle differences across simulations.
To explore the impact of different AGN feedback models, we focus on relative changes between simulations, which are normalised with respect to the dark matter only (DMO) fable model (Figure 1) . Accordingly, the bottom row of Figure 1 shows the overdensity contrast for the gas mass with respect to the DMO model, , calculated as:
| (1) |
where is the overdensity of a given component, computed for a given simulation sim with respect to a reference model ref. In Figure 1, positive values (shown in blue) indicate that the baryonic gas has a higher overdensity than the (total) overdensity of the DMO case, whereas negative values (shown in red) indicate a lower overdensity instead. The colour scales are fixed equally for all panels in each row, and we separate large scales in the bottom row, following the Fourier low-k-pass filter method outlined above. We include the underlying gas overdensity distribution in gray to guide the eye. All models show some increase of power with respect to the DMO simulation within densest nodes of the cosmic web. Such denser structures are primarily driven by baryonic cooling. The NoFeedback panel (rightmost column; note that NoFeedback does not include AGN feedback but still has supernova stellar feedback), illustrates how baryonic cooling and SN feedback suffice to drive some local mild power suppression with respect to the DMO scenario. However, models with strong AGN feedback show clear circular red structures around massive galaxies. These are associated with a considerable reduction of power at large scales, driven by AGN activity evacuating matter towards larger radii. The Quasar model appears to mostly enhance events of bi-directional power suppression. By combining the duty cycle (Quasar) and increased radio mode strength (RadioStrong) modifications to the AGN model, the Fiducial simulation has an enhanced suppression of power, where both the characteristic large-scale ring-like structures from a stronger AGN and the bi-channel ejection of the duty-cycle are intensified. We note that the isotropic or anisotropic impact of the feedback is also driven by the environment impacted, the scales reached by the AGN feedback, and even the redshift when the effect takes place (see Section 3.5).
Overall, the presence of ring-like structures for the efficient AGN models in such large-scale projections (e.g., central object in top panels), illustrates how AGN feedback is responsible for re-shaping the distribution of matter around the clusters and galaxies of the cosmic web. These structures suggest an approximately isotropic displacement of gas for the strongest AGN models (Fiducial and RadioStrong), and more anisotropic effects for the duty-cycle model (Quasar). We will show below how simulations with these spherical matter ejections display a larger power suppression at intermediate cosmological scales, whereas our duty cycle model is more efficient in driving small-scale effects, and has a more complex redshift evolution. The lack of significant power suppression in the NoFeedback and RadioWeak models suggests that in the absence of efficient AGN models, other baryonic physics may only have marginal effects.
3.2 The impact of baryons on the matter power spectrum of the fable simulations
The main statistic of interest to understand how baryonic feedback affects the distribution of matter is the MPS, which we compute as described in Section 2.2. The resulting MPS for some representative fable models at are presented in the top panel of Figure 2, which includes the camb prediction for the fable cosmology. The full-physics fable MPS significantly deviates from the non-linear prediction at scales due to clustering from the collapse of baryons into haloes.
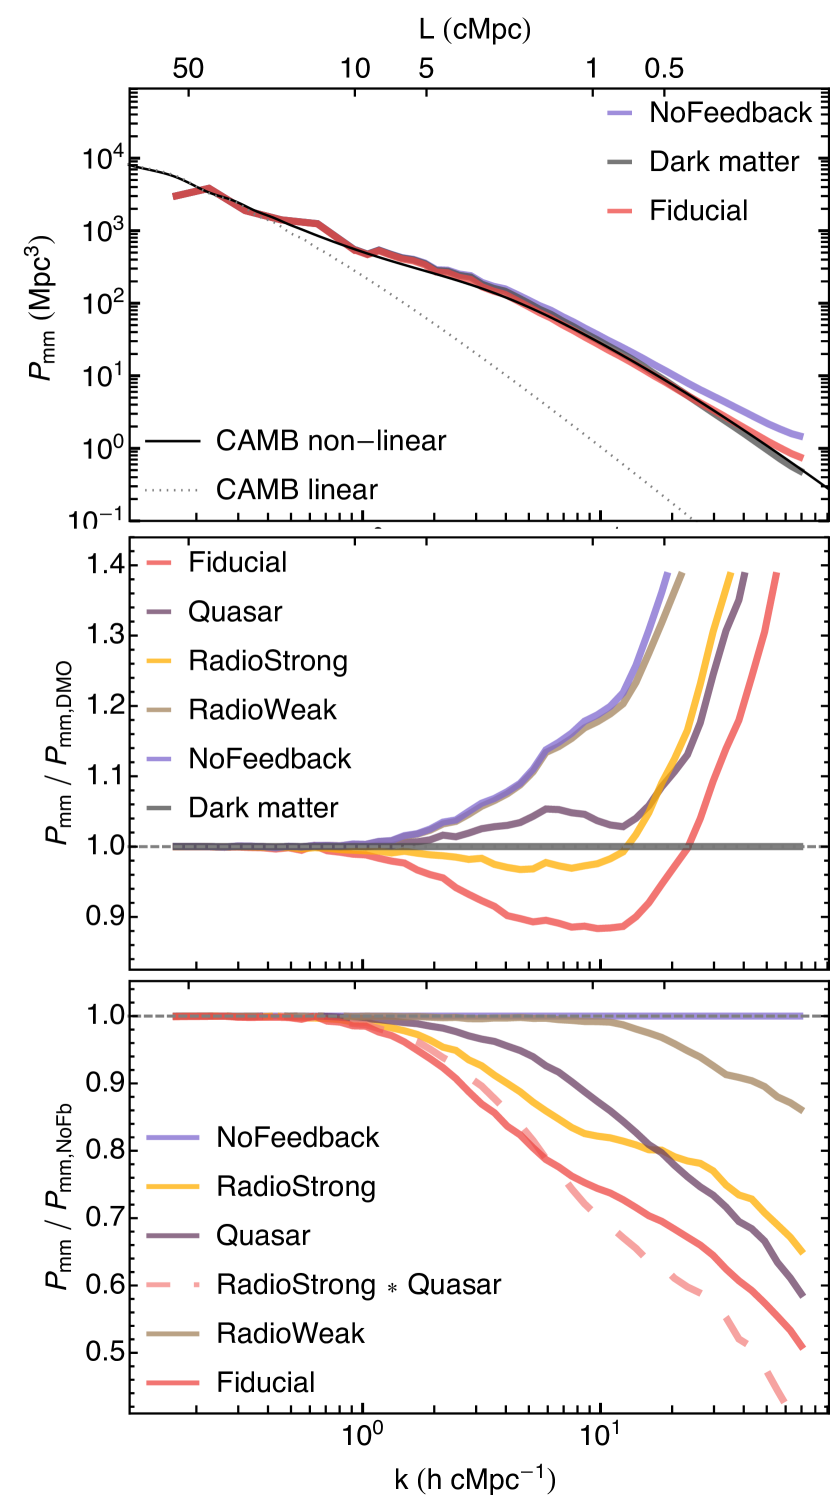
The impact of baryonic feedback on the MPS is typically concentrated on relatively small cosmological scales (Chisari et al., 2019). In order to study such impact in fable in more detail, we show in Figure 2 the ratio of the different studied models with respect to the DMO case (central panel) and with respect to the NoFeedback model (bottom panel). We find the baryonic feedback in fable to only have a significant effect for scales . The clustering effect of baryons dominates for scales in all our models. Amongst all the simulations with AGN feedback, the RadioWeak model shows the lowest suppression of power, with an MPS almost equivalent to that of the NoFeedback model. The Quasar and RadioStrong models both significantly suppress the amount of baryonic clustering. This leads to a large deviation from the NoFeedback simulation, reaching a MPS comparable to the DMO case at scales . These two models also show an interesting power cross-over at scales of approximately , where the Quasar model yields a lower power suppression at scales larger than this cross-over. The AGN duty cycle in this model concentrates feedback into periodic bursts, and AGN activity appears particularly efficient at scales . On the other hand, increasing the radio mode feedback strength (RadioStrong model) smoothly suppresses the MPS on scales of . When both a stronger radio mode and quasar duty cycle are combined in the Fiducial model, a maximal power suppression of below the DMO scenario is reached, with the suppression peaking at scales . As expected, the largest relative difference in power between two models with AGN feedback at this suppression peak occurs between the RadioWeak and Fiducial.
Interestingly, the Fiducial power suppression has features characteristic from both models, such as the plateau in power for from RadioStrong and a dip in power at from Quasar. To understand whether the modifications with respect to RadioWeak in each of the two models can be directly combined to recover the suppression observed in Fiducial, we include in the bottom panel of Figure 2 a line for RadioStrongQuasar (pink dashed line). This is computed by removing from the RadioWeak the differences in power between both RadioStrong and RadioWeak, and Quasar and RadioWeak. Overall, ‘RadioStrongQuasar’ traces the Fiducial model well, with only a slight underestimation of the suppression towards large scales (), and a suppression overestimate at . This hints towards an independent impact of applying a quasar duty cycle and increasing the radio mode efficiency, at least within the variation studied in fable. We will show below that this is due to the two modes being active and effective at different redshifts.
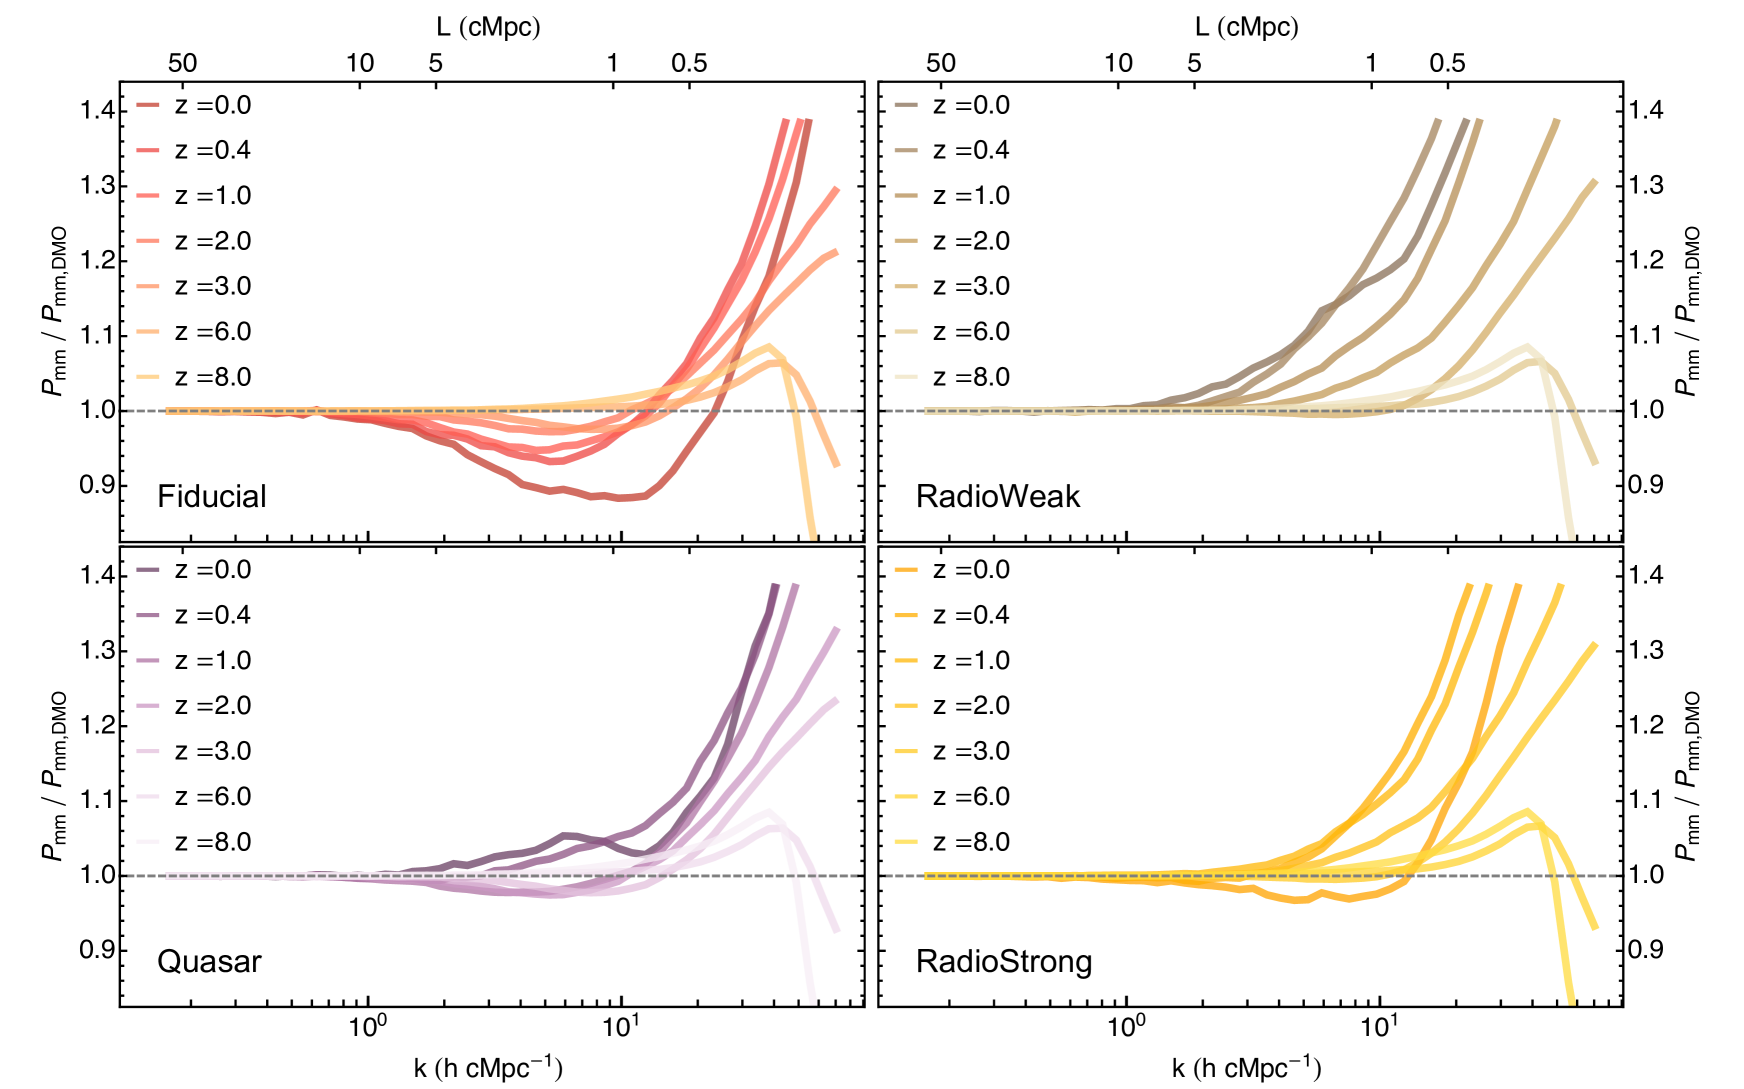
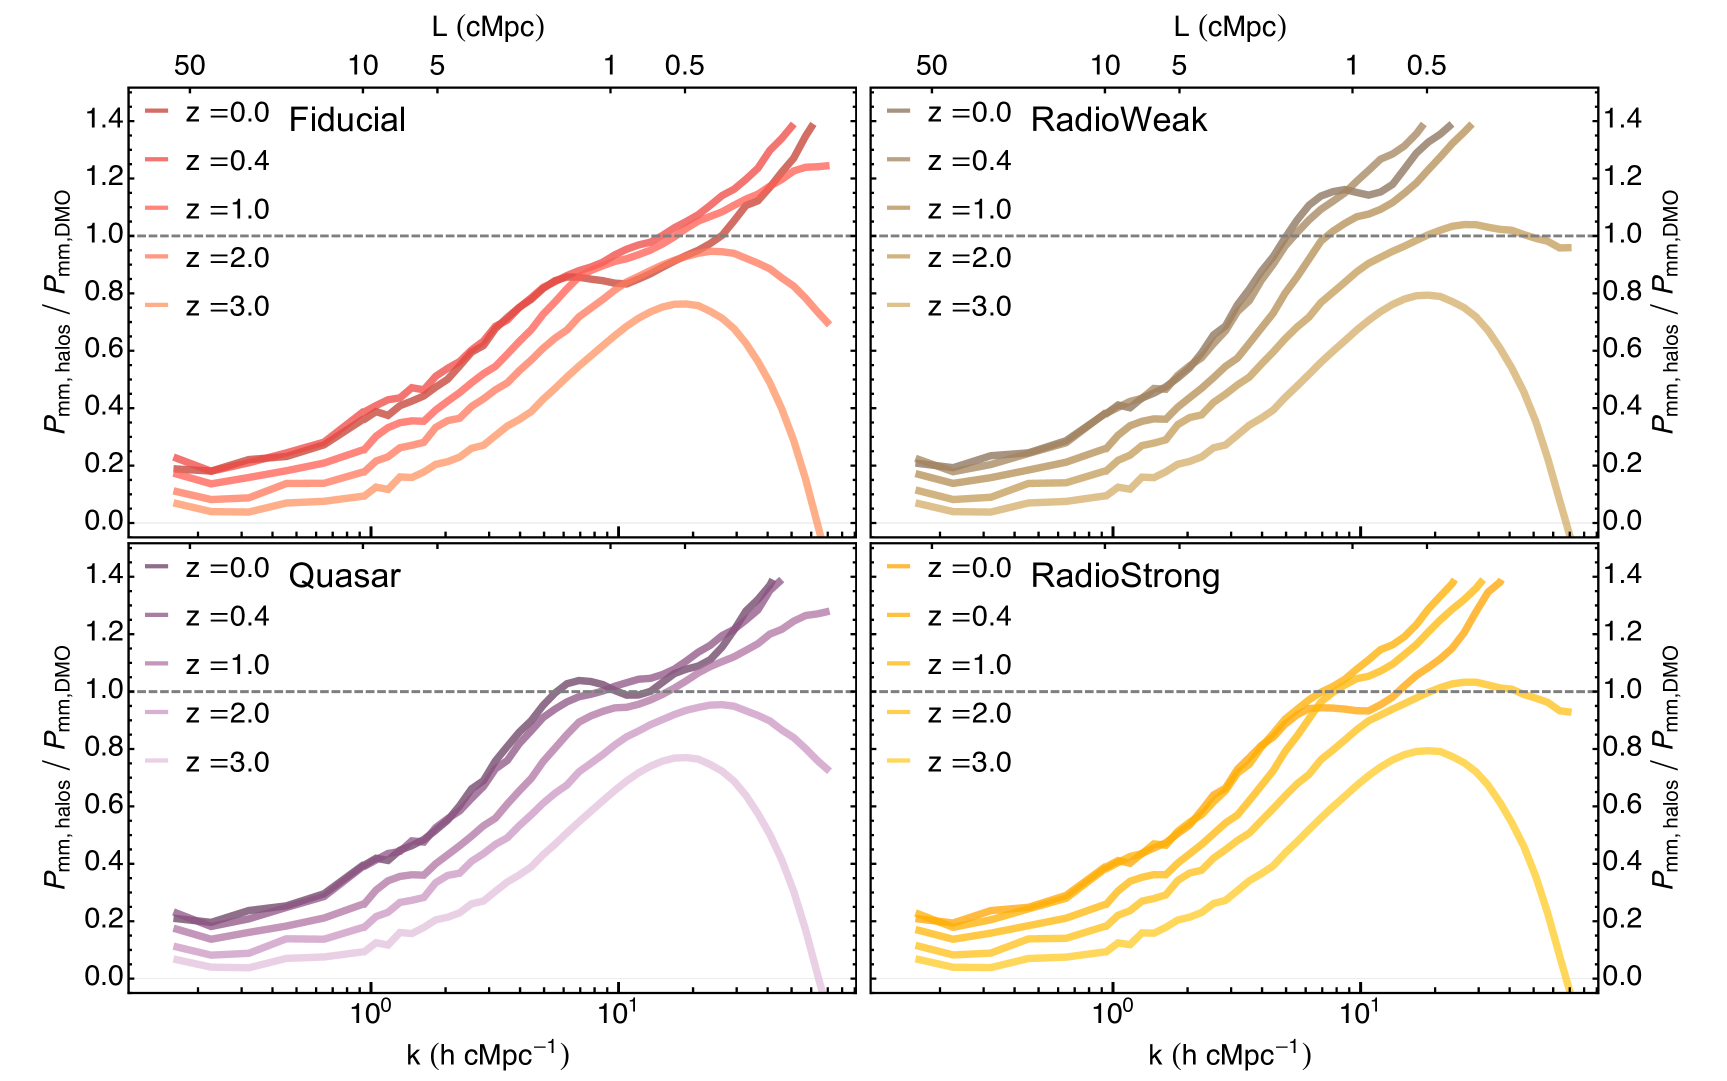
To better understand how AGN feedback, through the two separate modes, progressively carves its impact on the MPS, Figure 3 displays the redshift evolution of this quantity between and in the four studied AGN models. At high redshifts, remains similar to , but as the simulations evolve, clustering is increased at small scales and AGN feedback progressively leads to power suppression at the intermediate scales. In the two simulations without the quasar duty cycle (i.e., RadioWeak and RadioStrong; right column) baryonic cooling leads to higher clustering than in the DMO case down to , with the models being comparable at . After this redshift, the RadioStrong model undergoes a significant power suppression, particularly prominent during the interval. The RadioWeak simulation evolves to closely resemble the NoFeedback case at , with its maximal relative deviation from it at , and with only a mild suppression afterwards.
On the other hand, both models with the quasar duty cycle (i.e., Quasar and Fiducial; left column) display an early suppression of power from onwards. The early impact takes place at larger comoving scales and progressively shifts towards smaller scales as the simulation evolves, to eventually reach the peak of suppression observed at at . Despite this, the AGN feedback in the Quasar model is unable to maintain suppression over the DMO case after , and develops the noticeable peaks in power () and suppression () after . The Fiducial model continuously builds up relative suppression with respect to the DMO model during the to interval, with most of the deviation taking place after as observed in the RadioStrong case.
The differences in the redshift evolution of the matter power spectrum for these different models are primarily driven by the temporal evolution of the quasar mode and radio mode fractions (AGN mode fractions are shown in Figure 11, discussed in Appendix A), with the quasar mode dominating at high redshifts and the radio mode becoming increasingly more important towards low redshift. The quasar duty cycle in combination with strong radio mode feedback, as in the Fiducial model, then ensures efficient AGN feedback injection throughout cosmic history. Consequently, the effective quasar mode will lead to an earlier power suppression () whereas the radio mode will be important at late times (). These introduce an evolutionary degeneracy that should be addressed as upcoming observatories such as the Simons Observatory probe (Ade et al., 2019).
Along these considerations, while matter clustering in the RadioWeak model is always above the DMO case, and comparable to the NoFeedback simulation, all the other models have at some point during their evolution in the interval. The largest power suppression for both Fiducial and RadioStrong models takes place at , whereas it takes place during for the Quasar simulation. When comparing the strongest and weakest AGN feedback models (top row; Fiducial vs RadioWeak) their relative suppression of power at is of the order of , and primarily develops at . The bottom row illustrates how, at small scales () and after , the Quasar AGN model has a considerably higher suppression of power than the RadioStrong model (bottom row). Finally, all AGN simulations, excepts perhaps RadioWeak, have a complex evolution of their MPS with respect to the DMO case.
3.3 Comparing fable with other simulations
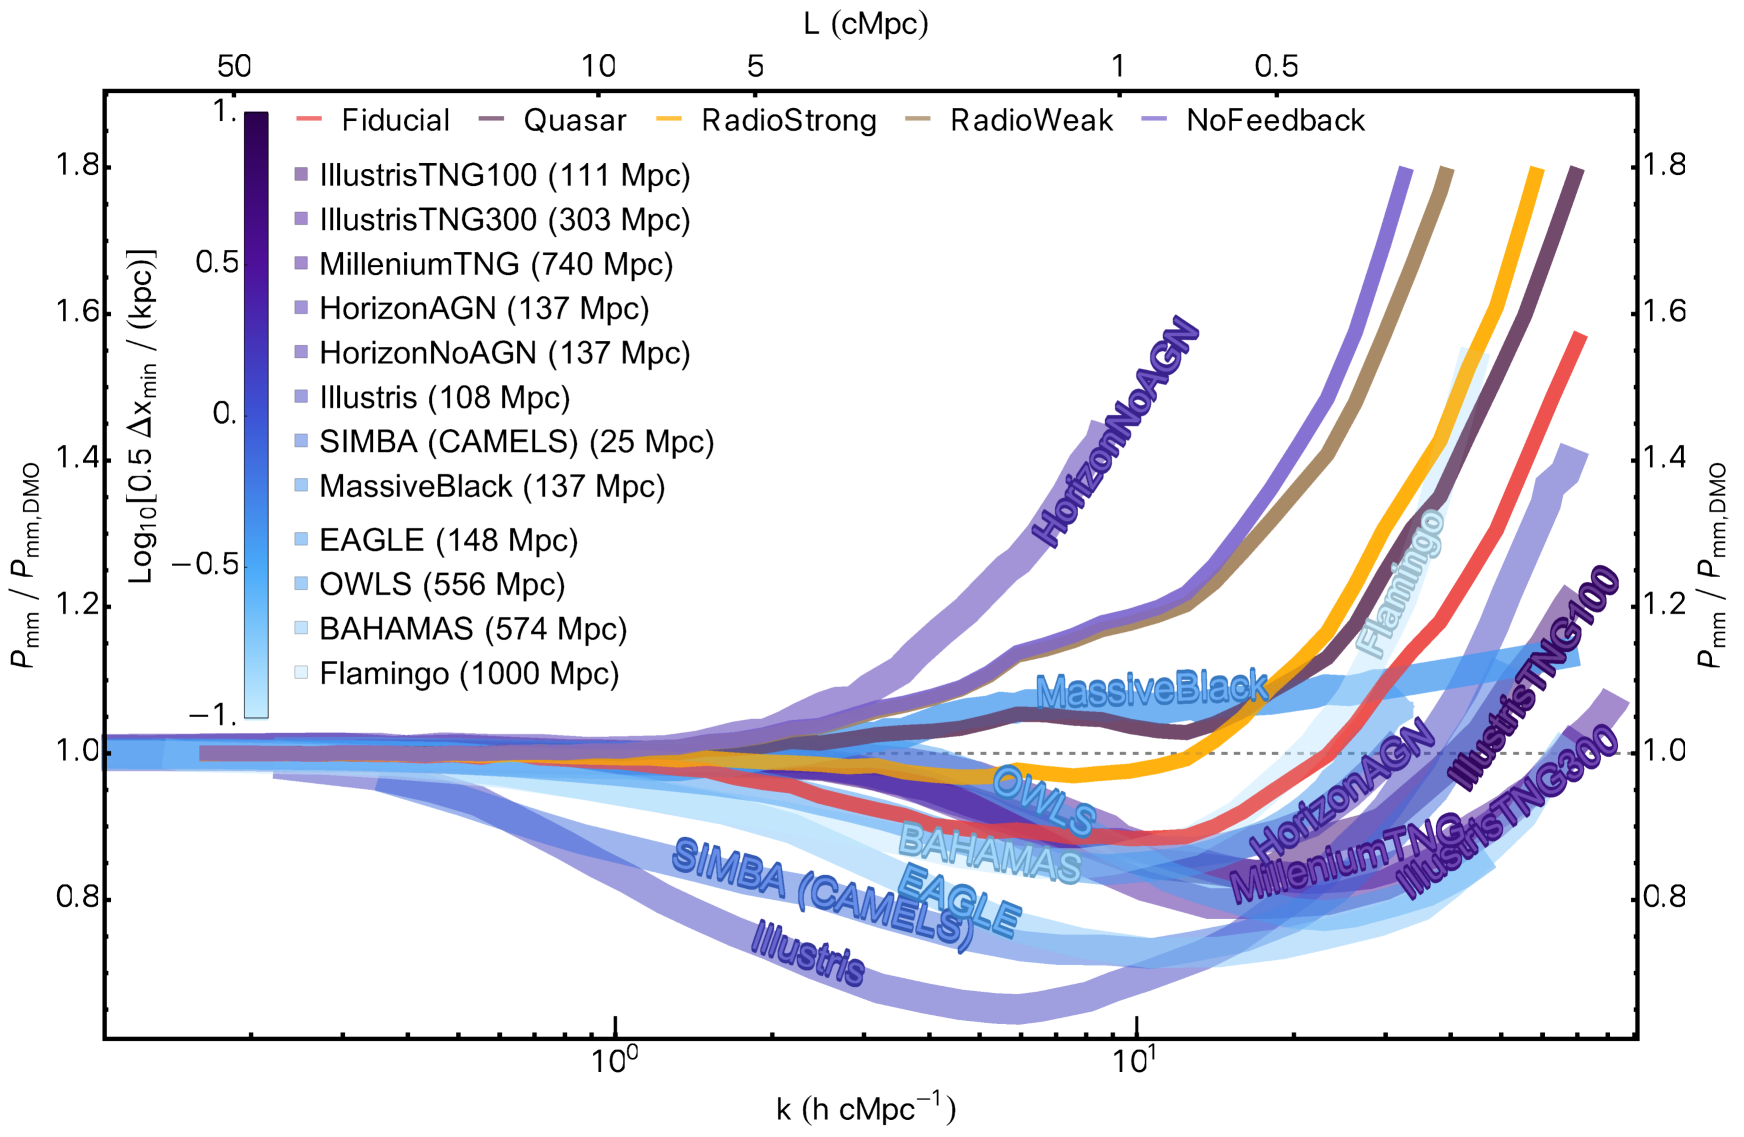
In Figure 4, we compare the relative impact of baryons on the MPS (through ) of fable with their relative impact in other well-known cosmological galaxy formation simulations 222Simulations originally compared by Chisari et al. (2019) are: HorizonAGN (Chisari et al., 2018), Illustris (Vogelsberger et al., 2014c), IllustrisTNG (Springel et al., 2018), OWLS (van Daalen et al., 2011), BAHAMAS (McCarthy et al., 2018), MassiveBlack (Khandai et al., 2015; Huang et al., 2019) and EAGLE (Schaye et al., 2015; Hellwing et al., 2016). We also include FLAMINGO (Schaye et al., 2023), SIMBA (as presented in CAMELS by Villaescusa-Navarro et al. 2021), and MilleniumTNG (Pakmor et al., 2023). Overall, the suppression of the relative MPS in simulations due to baryonic physics, primarily due to AGN feedback, occurs at scales of . Focusing on the fable Fiducial model, the scale of maximal power suppression is comparable to most other simulations (typically ) and the overall shape of the relative MPS lies within the bulk of the outcomes from other simulation projects.
We first compare fable with the HorizonAGN and IllustrisTNG-100 simulations, as they have comparable order of magnitude resolutions, finding that they all have similar maximum power suppression of . Interestingly, fable has a larger impact at scales than IllustrisTNG-100 and especially HorizonAGN, with the latter finding their relative power suppression to be concentrated at . Instead, AGN feedback in fable has a shape of the curve that resembles that of the OWLS or BAHAMAS simulations, but with a lower suppression magnitude. This resemblance is possibly the result of all three of these simulations employing episodic quasar mode feedback.
When comparing alternative fable AGN feedback physics with other simulations, the NoFeedback and the weakest AGN (RadioWeak) models resemble the behaviour of the HorizonNoAGN simulation, although the fable cases have a less pronounced clustering at probably due to stronger SN feedback. This illustrates the weak impact of RadioWeak, despite featuring relatively unchanged galaxy populations (see Henden et al. 2018; or Section 3.4). Instead, RadioWeak and NoFeedback models have higher gas mass fractions within the largest haloes, in some tension with observations. The Fiducial and RadioStrong cases are in good agreement with observations, (see Figure A2 in Henden et al., 2018), and suggest radio mode AGN feedback in fable also leads to the discussed correlation between cluster gas mass fractions and MPS power suppression (van Daalen et al., 2020).
Another interesting comparison is that between our Quasar model and MassiveBlack, where both simulations show a somewhat flatter MPS, with a modest peak in clustering at . MassiveBlack employs a thermal feedback prescription with a constant energy parameter of , and does not include an alternative feedback injection mechanism in the radio mode regime (Khandai et al., 2015). Consequently, it is possible that the comparable behaviour is the result of feedback being predominantly more effective at higher redshifts, whilst at low redshifts, as the BH accretion rate density decreases, the impact of AGN feedback on the MPS declines significantly. In agreement with Chisari et al. (2018), we attribute this behaviour in Quasar (and possibly in MassiveBlack) to a late-time decrease in AGN regulation (due to the lack of effective ’radio-mode’ feedback), where power builds up more rapidly at intermediate scales () when gas is re-accreted into massive haloes (Beckmann et al., 2017; Habouzit et al., 2021).
Finally, we note that the fable AGN model has an impact well below the suppression with respect to the non-linear dark matter-only scenario observed for simulations such as Illustris or OWLS, which likely have ejective feedback that may be too effective (Genel et al., 2014).
3.4 The impact of different galaxies on the matter power spectrum
To understand how different galaxies and AGN feedback from their central SMBHs influences the distribution of matter in our simulations, we explore the variation of the MPS around galaxies separated according to multiple property cuts. We analyse separations according to the halo mass (), stellar mass () and black hole mass () of galaxies, computed as described in Section 2.1.6. We show the distribution of fable galaxies across the parameter space of these properties in Figure 5, where the left panel displays the stellar mass vs halo mass relation, and the right panel displaying the stellar mass vs black hole mass relation.
Overall, fable runs have relatively similar mean relations for the simulated galaxies, with the most important variations taking place for . Simulations with weaker feedback reach higher , but the effects of the duty cycle and increased radio mode strength affect differently systems across various ranges. This effect appears more prominent on the low boundary of the relation (also see Koudmani et al., 2021). We refer the reader to Henden et al. (2018) for further analysis of the galaxy and cluster populations in fable.
Figure 5 includes dashed lines corresponding to the cuts employed to separate our galaxies into different mass ranges. We present only a subset of all the investigated cuts, varying these cuts results only in monotonic and minor variations. Our mass range divisions are first set to separate halo masses (i.e., ). These are then converted to and following the population medians of the Fiducial fable scalings. The intersects across such scalings are shown as orange points in Figure 5, and the resulting range division values correspond to and , where the first cut in separates galaxies with and without a SMBH. These divisions serve to review comparable populations selected under different criteria.
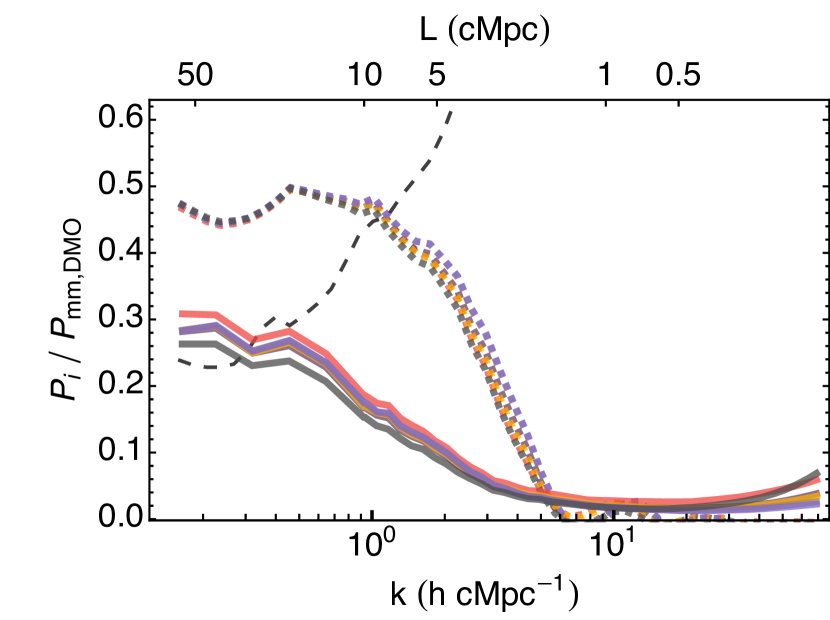
To illustrate the effects of filtering our mass distribution, Figure 6 presents a comparative analysis of the MPS inside and outside of haloes (), along with twice their cross-correlation (i.e. ). The volume outside of haloes constitutes most of the simulation domain, and altogether with the cross correlation, dominates the contribution to at . At these large scales, haloes contribution to is of order of .
Across different AGN models, variations in and are relatively minor, with only a slightly higher amount of power outside of haloes in Fiducial and RadioStrong. Models with stronger radio mode AGN feedback also display somewhat lower cross-correlation in the range, with this quantity rapidly approaching zero towards smaller-scales . It will be important for the analysis below to emphasise that at scales , the mass outside of haloes and its cross-correlation with only constitutes a small fraction of (). Furthermore, differences across models are smaller than the variations observed in or in Figure 4. Consequently, any suppression observed in emerges from variations of the power within haloes.
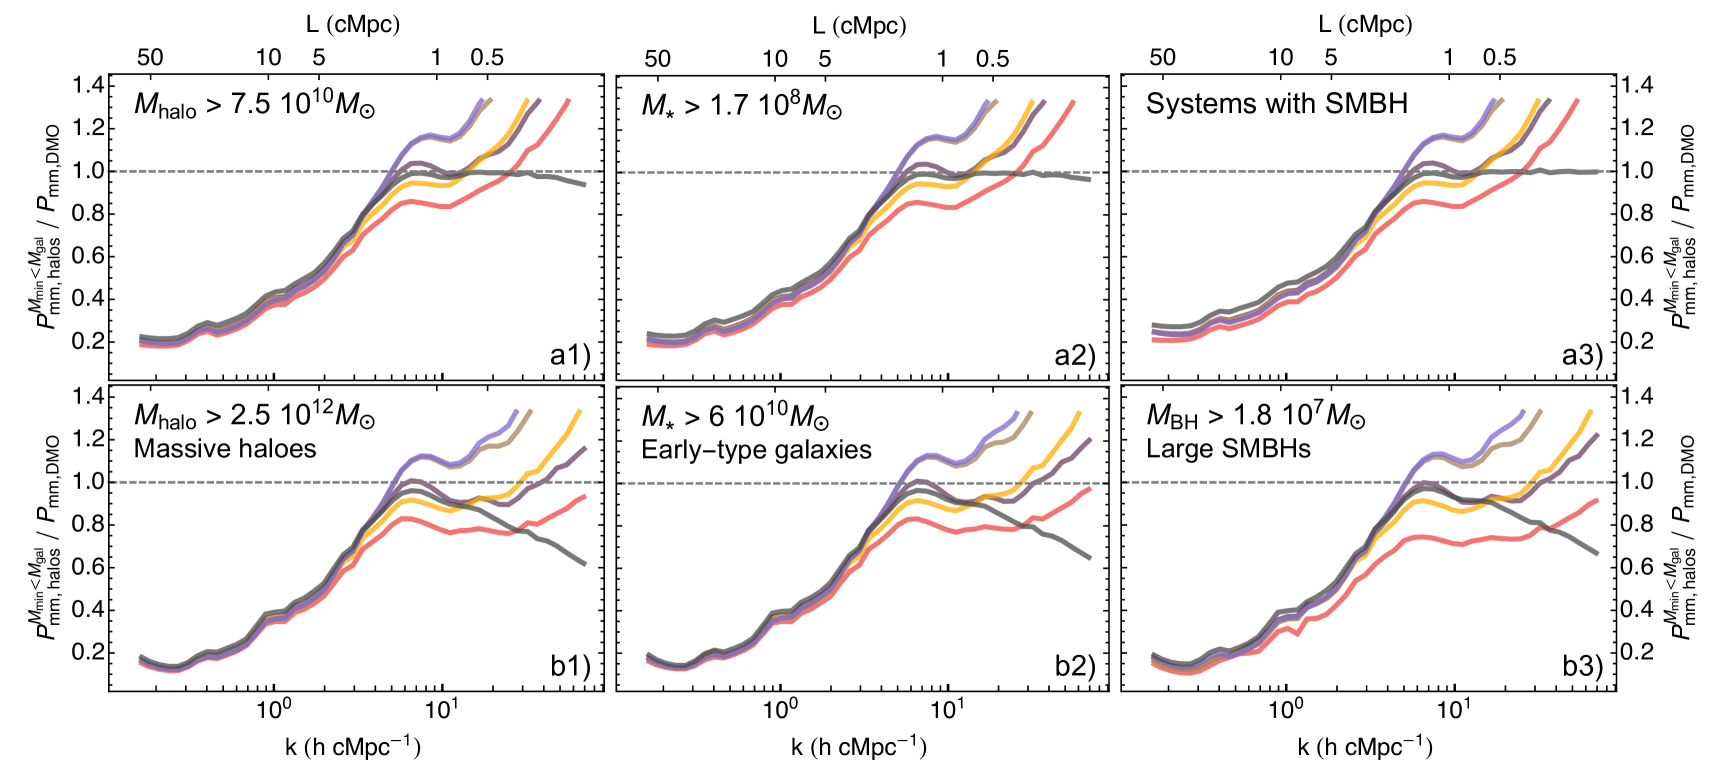
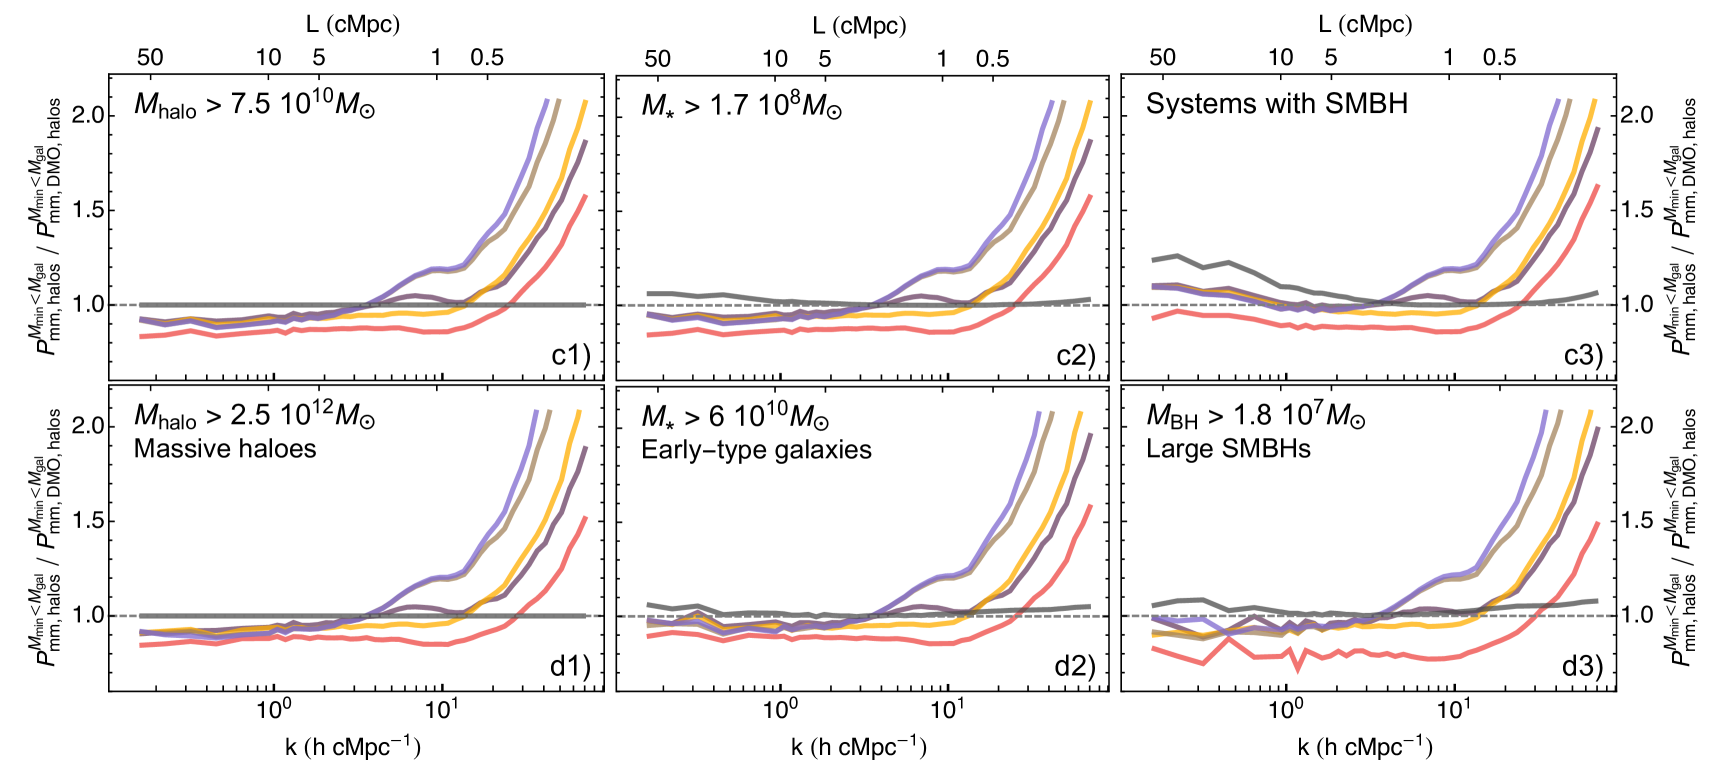

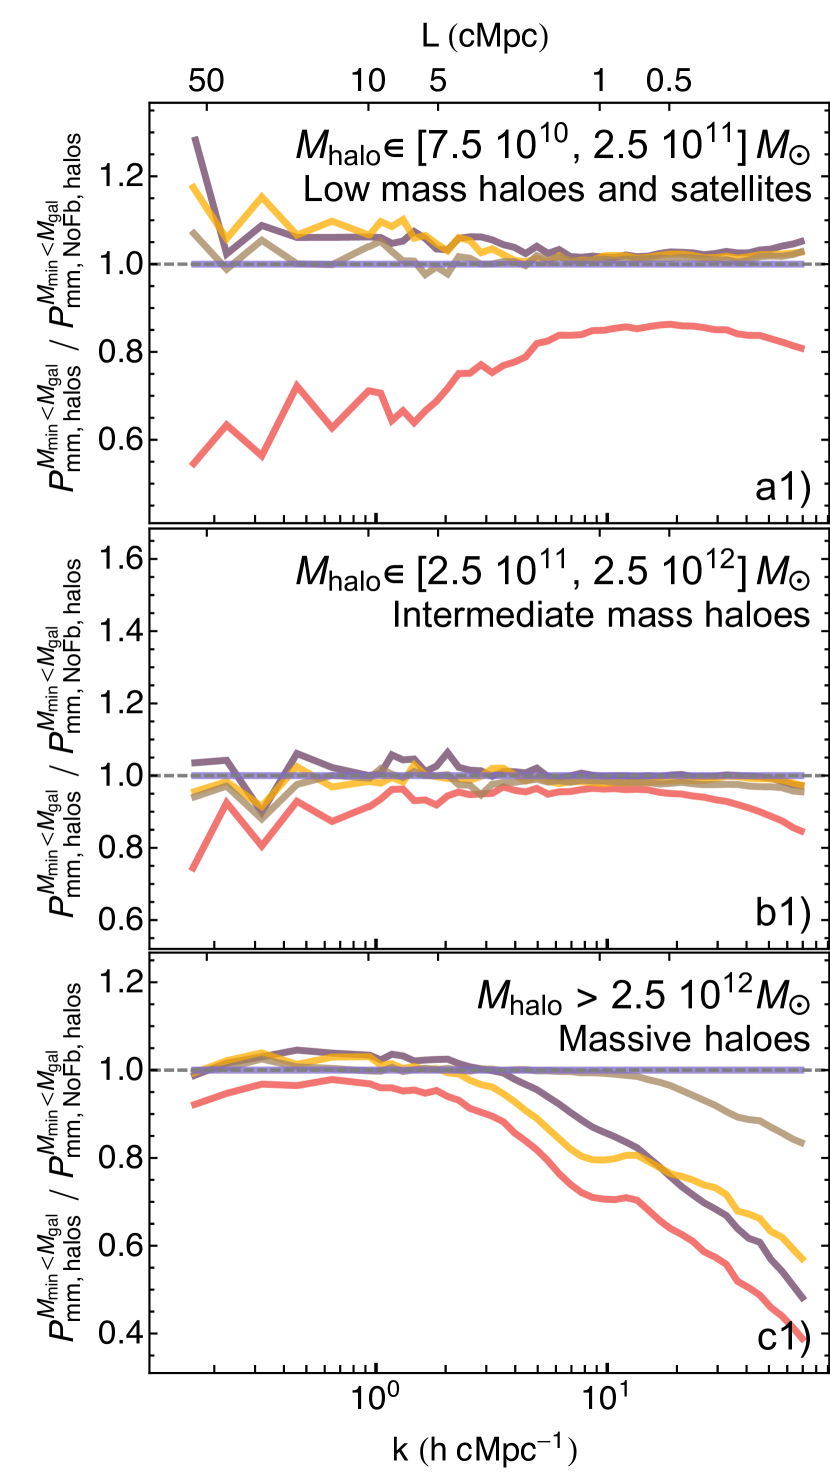
We now focus on the variations of the MPS within haloes, selected according the thresholds describe above. Figure 7 shows the resulting spectra , for our lowest and highest threshold selections: and (leftmost column), as well as their corresponding thresholds in and . From left to right, columns correspond to cuts on , and . The top set of panels show the filtered spectra divided by the total MPS of the DMO model (). For a better view of variations across fable models, the central set of panels shows the same mass thresholds, now divided with respect to the halo mass filtered DMO simulation (). Consequently, the ratio of all panels in a row is computed with respect to the in its leftmost column. This allows for a direct comparison across selection masses and fable models. Finally, and to facilitate further comparison with Figure 2, we show in the bottom row the ratio of with respect to the of the NoFeedback simulation.
The differences across the various models, cuts, and selection mass types are more prominent at small scales (). When all galaxies are considered (a row panels) a trend towards higher clustering of the hydrodynamical runs with respect to the haloes in the DMO model is observed. Such transition from lower to higher clustering occurs at different scales for different models, depending on the efficiency of AGN feedback (a1 and c1 panels). For NoFeedback, RadioWeak, and Quasar, this occurs at . For RadioStrong and Fiducial it takes place at smaller scales, with and , respectively. As haloes are progressively discarded by increasing the threshold mass, the amount of small-scale power is progressively reduced until only the largest haloes are considered (as shown in b row panels). Comparing the least and most restrictive threshold, we find a considerable decrease () of power at scales , but a negligible reduction in the range. The proportional separation between the of the hydrodynamical models and varies differently when increasing mass cuts (c vs d rows), with AGN feedback affecting differently the power clustering contribution from different halo masses (van Loon & van Daalen, 2023). For example, of Fiducial is reduced from about 20% to 10% over at scales of , whereas RadioWeak increases from 55% over to 65% over . We attribute this to AGN feedback in this model becoming less capable of impacting more massive galaxies (panels c1 vs d1). Despite their differences, the scale at which these weaker AGN models (i.e., NoFeedback, RadioWeak, and Quasar) transition from having less power than the DMO case (; large scales) to more power than the DMO case (; small scales) remains approximately unchanged at a scale of . This scale is approximately independent of the mass cut employed. For the models with strongest AGN feedback (RadioStrong and Fiducial), this scale remains unchanged for and sample selections, but shifts to almost a factor higher scales when the galaxies hosting the most massive black holes are selected (panels c3 vs d3). Applying the most stringent mass cut according to rather than (or ) enhances differences between models. This -based selection further increases the power suppression observed due to AGN across all scales (panel d3).
Such lack of variations depending on whether and sample selection criteria are employed reflects a tighter interrelation between these two quantitites at the high mass end of the galaxy population, which dominate the . The enhanced relative power suppression when massive SMBH are selected confirms the mass of SMBHs as an integrated measure of AGN feedback and power suppression. However, the specific implementation of AGN feedback may significantly affect the amount of the MPS suppression, motivating further exploration of more sophisticated AGN model implementations (e.g., Zubovas et al., 2016; Bourne & Sijacki, 2017; Costa et al., 2020; Talbot et al., 2021; Beckmann et al., 2022; Huško et al., 2022; Koudmani et al., 2023; Rennehan et al., 2023).
When reviewing such differences across models, the trends observed in Figure 4 are clearly reflected in the ratio at scales . This is true both for the ratio with respect to (a and b rows) and with respect to the NoFeedback model (e row). As discussed above (Figure 6), haloes dominate MPS power at such scales. Consequently, the suppression observed in emerges necessarily from the effects of AGN inside haloes. The lower power across all scales in Fiducial (c row panels) and RadioStrong to a lower extent, is the result of clustering being reduced at small scales and matter being ejected outside of haloes (van Loon & van Daalen, 2023). This is in agreement with the slight increase of power outside of haloes (Figure 6; top panel) at scales of . As above, whether systems are selected according to their or their does not have a significant effect on these results. Selecting systems according to the SMBH mass accentuates differences between models, with the Fiducial, RadioStrong, and Quasar models exhibiting a lower amount of power at scales . The resulting selection of systems preferentially focuses on haloes from which a larger proportion of matter has been removed or ejected 333We confirmed this is not the result of a lower number of systems being included when performing our analysis assuming the SMBH threshold, where most models actually include slightly more galaxies.. Finally, the peak of power at in the Quasar model is somewhat suppressed by the SMBH selection. We attribute the peak to more inefficient feedback around less massive SMBHs: as the Quasar simulation transitions from a more prevalent quasar mode at high redshift to radio mode dominance (Figure 11), clustering increases around massive haloes with AGN less efficient in mass removal (Beckmann et al., 2017).
To provide further insight into the effect of feedback around smaller galaxies, we repeat a similar analysis now selecting only galaxies within non-intersecting mass intervals, instead of a minimum mass threshold. This isolates their power contribution, as they are secondary when compared with the most massive systems van Daalen & Schaye 2015. The resulting spectra for different haloes are shown in Figure 8, employing a selection. The spectra of haloes is shown as the ratio of each model with respect to the NoFeedback case. Most models do not have any significant effect on around the smallest galaxies (top panel) except Fiducial. In this simulation, a large suppression takes place across all studied scales, and especially at . Due to these systems being hosts of small , with low integrated power budgets, the observed power suppression is potentially driven by AGN residing in large neighbouring galaxies affecting their satellites and nearby smaller galaxies (Dashyan et al., 2019; Martín-Navarro et al., 2021; Shuntov et al., 2022). The lack of any significant suppression around intermediate mass haloes (; central panel) supports a scenario where only the largest SMBH are capable of such clustering suppression. Once again, only the Fiducial simulation experiences some notable clustering reduction, notable at the smallest scales. This lack of suppression around haloes was also found by van Loon & van Daalen (2023). This behaviour remains approximately unchanged regardless of whether an , , or selection is employed.
3.5 Tracing AGN power suppression with haloes at different scales and times
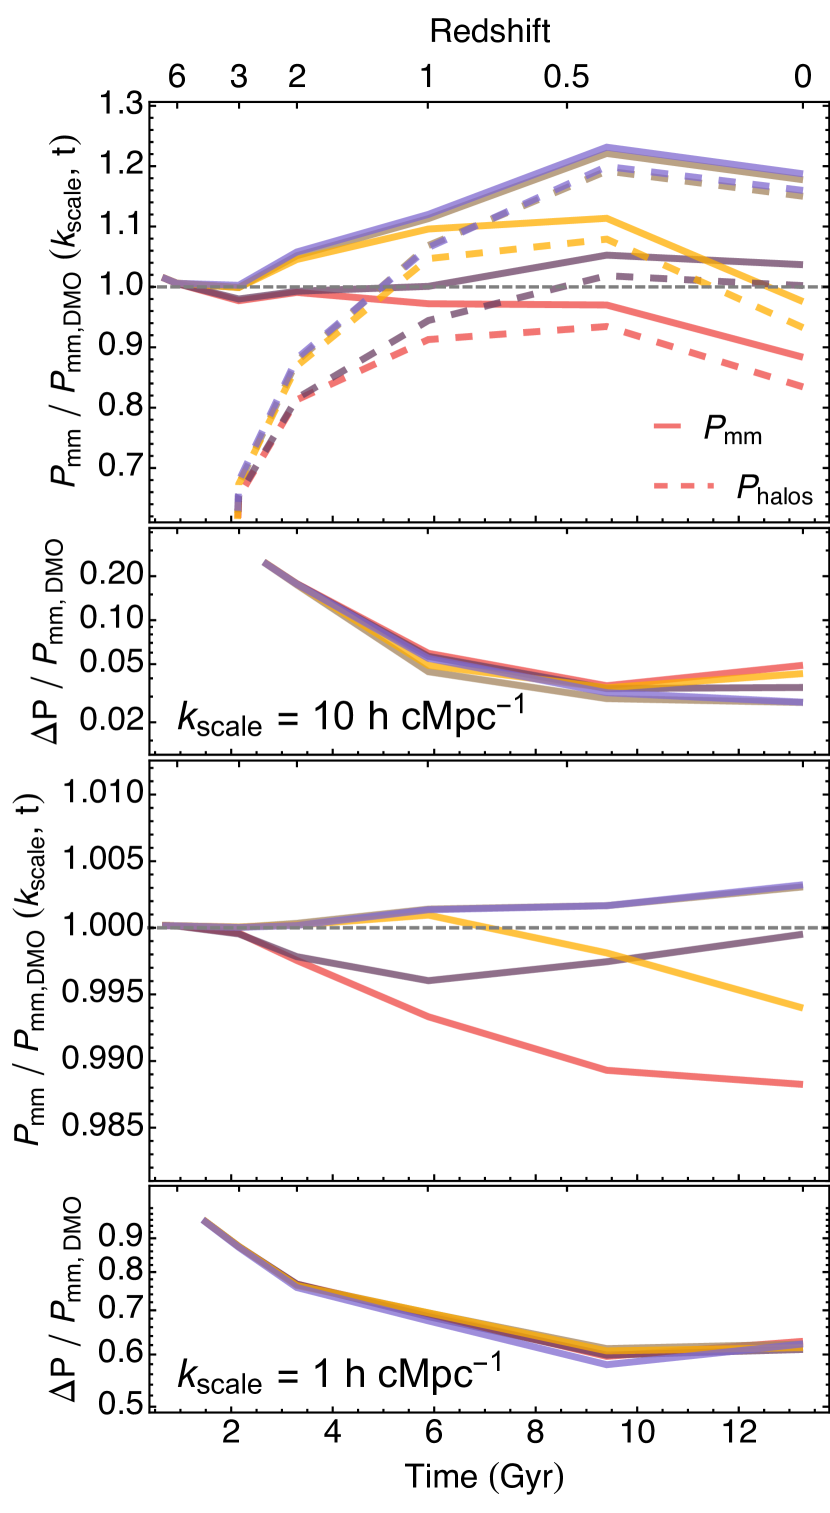
To further understand how baryonic physics modifies clustering inside and outside of haloes across cosmic time, we show the evolution of in Figure 9. The top panel displays our results at . At early times (), the power inside of haloes is the primary contribution to the total , but is not fully dominant. The Quasar and RadioStrong models reveal how clustering is sensitive to the efficiency of the radio versus quasar modes, both inside and outside haloes. As shown in the second panel, by , haloes constitute approximately 95% of , and despite significant variations in total power within haloes across models, the proportion of power outside of haloes remains similar across simulations.
Hence, in our hydrodynamical simulations, any large deviations of (or ) from in the NoFeedback simulation is primarily driven by AGN feedback modifying the clustering of matter. With the Quasar and Fiducial models evolving comparably, the lower at due to the higher efficiency of the implemented quasar duty cycle is driven by a suppression of power inside haloes. In the Quasar model, the enhanced impact due to the quasar duty cycle at early times preserves its imprint down to . After , the enhanced radio feedback power in the Fiducial and RadioStrong simulations leads to a considerable suppression of halo clustering. This drives a late-time decrease of in both models. At , the difference between the total and that of all haloes remains considerably smaller than the deviations across models, and further confirms the impact of baryons at to be driven by AGN feedback, and constrained to the interior of haloes.
At large scales (; third and fourth panel), redshift evolution of all models resembles their counterparts. Quasar and Fiducial feature some power suppression until . However, the effect of the enhanced radio mode is already in place by (instead of for ). It leads to a suppression of power in Fiducial only slightly above 1%. As shown in Figure 6, and reflected by the bottom panel, power at this scales is dominated by matter outside of haloes and its cross-correlation with galaxies. With variations in the fraction of power outside of haloes (bottom panel) being larger than the actual suppression, understanding the power decrease with respect to the DMO requires constraining power both inside and outside of haloes. Overall, Figure 9 illustrates how different AGN implementations will not only modify the details of and at , but also its redshift evolution. Hence, any precision measurements () will require a more detailed understanding of how AGN feedback operates across cosmic time (Semboloni et al., 2011; Huang et al., 2019; Chisari et al., 2019). For the interested reader, the time evolution of across all studied scales is shown in Appendix B.
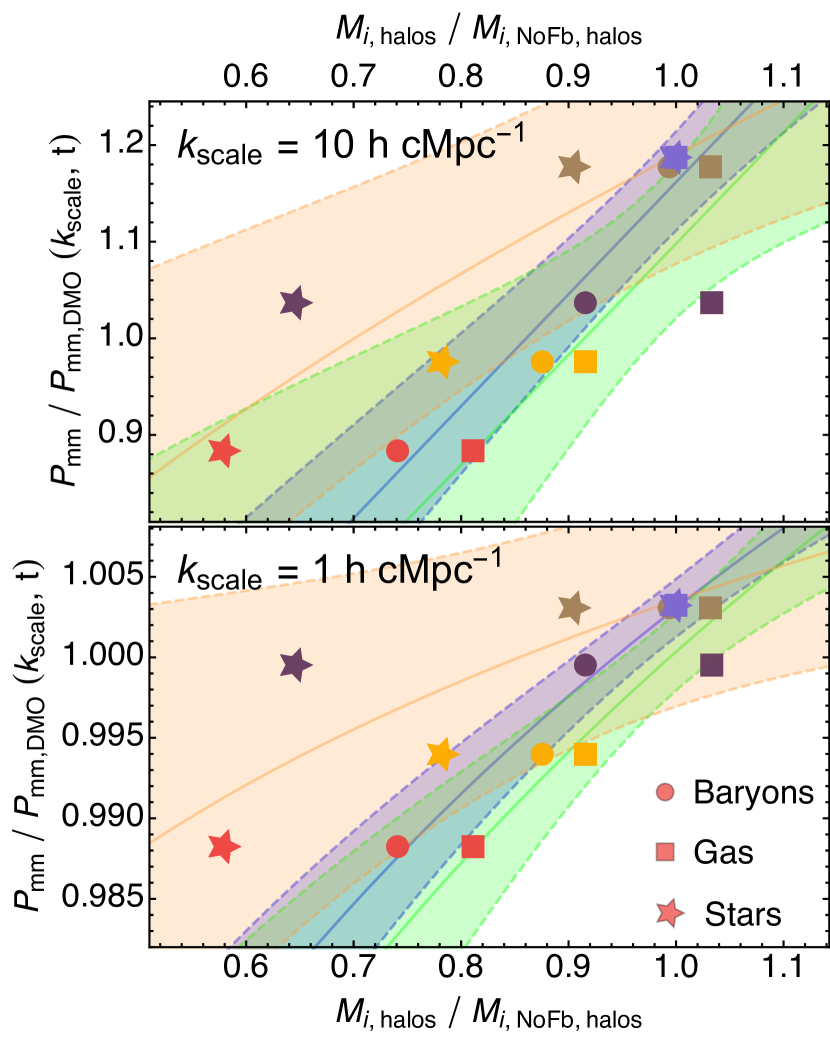

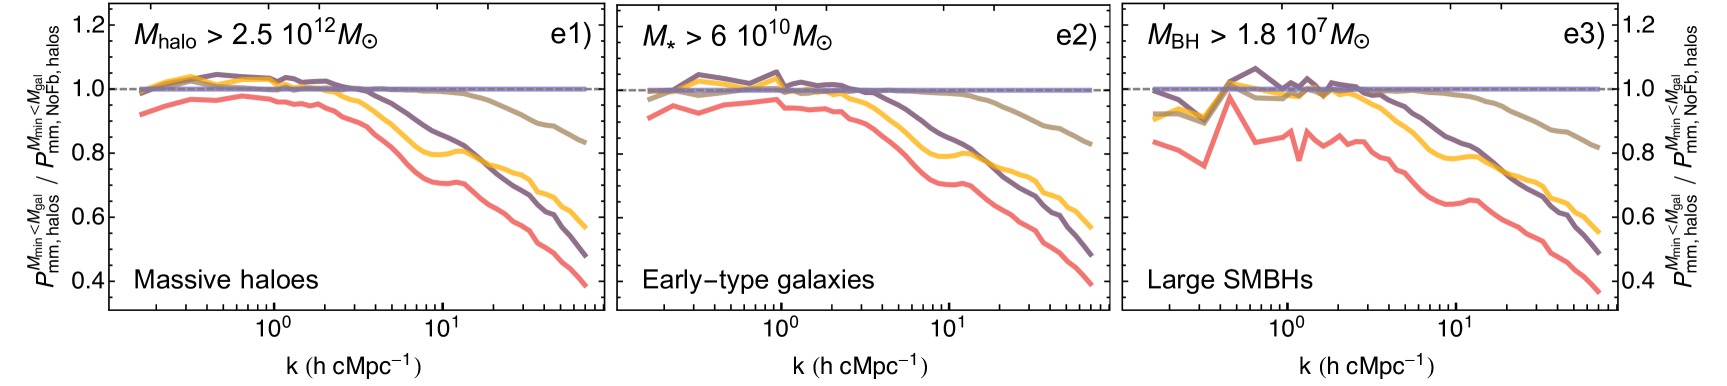
We conclude by studying in Figure 10 how the power suppression at each of these two scales correlates with the mass of baryonic components of the most massive galaxies in fable simulations. These are selected as , to investigate how well the most massive systems trace the power suppression of our different AGN models. Their power suppression is shown as a function of the total mass in the haloes of all selected systems (), separately for baryons (circles), gas (squares) and stars (star symbol). We normalise to their values in the NoFeedback simulation (). In addition, we calculate power-law best fits to the stellar measurements (yellow band), gas measurements (green band) and total baryonic mass measurement (blue band). Note that due to too high star formation rates in massive haloes in NoFeedback model, its gas content is depleted and is somewhat lower than that for RadioWeak and Quasar simulations. The total baryonic component provides an accurate tracer of power suppression at both and (coefficient of determination ), in agreement with van Daalen et al. (2020). Separate baryonic mass components provide a less tight constraint on the amount of suppression explored at these two different scales. Focusing on the specific baryonic components, the gas mass provides a better tracer at (; ), whereas the stellar mass performs better at scales of (; ).
Comparing now the different AGN models, note that the quasar mode duty cycle provides a mechanism that efficiently suppresses the stellar mass of massive haloes with a lower gas ejection than the enhanced radio mode. Hence, the Quasar simulation has a higher suppression at small scales (closer to RadioStrong), whereas it is closer to the RadioWeak case at large scales (). As a result, its large suppression of stellar mass provides a better correlation at , where it displays more clustering suppression. RadioStrong and Quasar feedback models displace the correlation in different directions, once again illustrating how different AGN implementations may allow to modify galaxy properties, mass content and the impact of baryons on the separately.
4 Conclusions
In this work we study how variations in the radio and quasar mode around the fiducial fable AGN model (Henden et al., 2018) impact the distribution of matter at different cosmic times. The fable simulations are performed with the arepo code (Springel, 2010), evolving a uniform cosmological box with on a side and featuring a galaxy formation model following Illustris (Vogelsberger et al., 2014b; Genel et al., 2014; Sijacki et al., 2015). In addition to a dark matter-only simulation, the studied suite of 5 models spans: no AGN feedback (NoFeedback), weak AGN feedback (RadioWeak), stronger AGN radio mode (RadioStrong), a quasar mode duty cycle (Quasar), and a fiducial model combining the stronger radio mode with the quasar duty cycle (Fiducial).
For each of these models, we investigate the matter power spectrum (MPS) and how different haloes selected accordingly to varying , and thresholds contribute to it. Our main findings are summarised as follows:
-
•
The fable AGN models feature the largest MPS power suppression at scales of and at , with a reduction of with respect to the DMO scenario. At , the Fiducial model has a clustering suppression of . The impact of baryonic feedback on the MPS in the fable Fiducial simulation is in general comparable to Horizon-AGN and IllustrisTNG-100, but is more similar to the BAHAMAS and Flamingo simulations at scales .
-
•
Stronger radio mode feedback (RadioStrong) is more effective at suppressing power at large scales (particularly ) and at late cosmic times (). The effects of the quasar duty cycle (Quasar) are complementary to this, being more effective at smaller scales (), and with their most important impact at early cosmic times (). Variations in these two modes allow for comparable impacts at , but importantly lead to significantly different redshift evolution up to , which future observations probing into the high-redshift regime will be able to constrain (Huang et al., 2019).
-
•
Clustering suppression in fable takes place around the most massive galaxies (). This is approximately unchanged whether galaxies are selected employing halo or stellar masses. Smaller galaxies display no significant MPS suppression, except for small haloes () in the Fiducial simulation, which are likely satellites or neighbours of massive galaxies hosting large SMBH. Interestingly, selecting haloes above a given central SMBH mass threshold leads to the highest amount of relative MPS power suppression with respect to the DMO scenario, particularly at scales .
-
•
The baryonic impact on the MPS at scales of is primarily due to clustering suppression within haloes at . At higher redshift, and larger scales, power suppression comes from a combination of modifications of the matter distribution both inside and outside of haloes.
-
•
The total baryonic mass content in the most massive haloes of the fable simulation provides an accurate tracer of MPS power suppression both at large () and small () scales (van Daalen et al., 2020). However, modifications in the quasar and radio AGN modes drive the correlation of the stellar and gaseous components in opposite directions.
Overall, our results illustrate how different AGN implementations, and especially variations of the quasar and radio mode feedback, have distinct effects on the distribution of matter and the MPS redshift evolution. This motivates further exploration of more sophisticated and physically-motivated feedback models, either through enhanced resolution in the innermost regions of galaxies (e.g. Curtis & Sijacki, 2016; Bourne et al., 2019; Beckmann et al., 2019; Bourne & Sijacki, 2021; Martin-Alvarez et al., 2022; Hopkins et al., 2024b), more realistic modelling of SMBH accretion and AGN activity (e.g. Bourne & Sijacki, 2017; Talbot et al., 2021; Huško et al., 2022; Koudmani et al., 2023; Rennehan et al., 2023), or even through the inclusion of non-thermal components (e.g. Pfrommer et al., 2017; Costa et al., 2018; Martin-Alvarez et al., 2021; Su et al., 2021; Beckmann et al., 2022; Wellons et al., 2023; Ruszkowski & Pfrommer, 2023).
Acknowledgements
S.M.A. is supported by a Kavli Institute for Particle Astrophysics and Cosmology (KIPAC) Fellowship, and by the NASA/DLR Stratospheric Observatory for Infrared Astronomy (SOFIA) under the 08_0012 Program. SOFIA is jointly operated by the Universities Space Research Association, Inc. (USRA), under NASA contract NNA17BF53C, and the Deutsches SOFIA Institut (DSI) under DLR contract 50OK0901 to the University of Stuttgart. S.M.A acknowledges visitor support from the Kavli Institute for Cosmology, Cambridge, where part of this work was completed. V.I. acknowledges support by the Kavli Foundation and the KICC Fellowship. S.K. is supported by a Flatiron Research Fellowship at the Flatiron Institute, a division of the Simons Foundation and a Junior Research Fellowship from St Catharine’s College, Cambridge. S.K, M.A.B., and D.S. acknowledge support by European Research Council Starting Grant 638707 ‘Black holes and their host galaxies: coevolution across cosmic time’. M.A.B and D.S. additionally acknowledge support from the Science and Technology Facilities Council (STFC). This work made use of the following DiRAC facilities (www.dirac.ac.uk): the Data Analytic system at the University of Cambridge [funded by a BIS National E-infrastructure capital grant (ST/K001590/1), STFC capital grants ST/H008861/1 and ST/H00887X/1, and STFC DiRAC Operations grant ST/K00333X/1] and the COSMA Data Centric system at Durham University (funded by a BIS National E-infrastructure capital grant ST/K00042X/1, STFC capital grant ST/K00087X/1, DiRAC Operations grant ST/K003267/1 and Durham University). DiRAC is part of the National E-Infrastructure.
Data Availability
Data employed in this manuscript will be shared upon reasonable request by contacting the corresponding author.
The raw Fable MPS data for each of the studied models at is publicly available at:
https://github.com/MartinAlvarezSergio/Fable_MPS
References
- Abbott et al. (2022) Abbott T. M., et al., 2022, Physical Review D, 105, 30
- Ade et al. (2016) Ade P. A., et al., 2016, Astronomy and Astrophysics, 594, A13
- Ade et al. (2019) Ade P., et al., 2019, Journal of Cosmology and Astroparticle Physics, 2019, 056
- Beckmann et al. (2017) Beckmann R. S., et al., 2017, Monthly Notices of the Royal Astronomical Society, 472, 949
- Beckmann et al. (2019) Beckmann R. S., Devriendt J., Slyz A., 2019, Monthly Notices of the Royal Astronomical Society, 483, 3488
- Beckmann et al. (2022) Beckmann R. S., Dubois Y., Pellissier A., Olivares V., Polles F. L., Hahn O., Guillard P., Lehnert M. D., 2022, Astronomy & Astrophysics, 665, A129
- Bondi & Hoyle (1944) Bondi H., Hoyle F., 1944, MNRAS, 104, 273
- Booth & Schaye (2009) Booth C. M., Schaye J., 2009, MNRAS, 398, 53
- Bourne & Sijacki (2017) Bourne M. A., Sijacki D., 2017, Monthly Notices of the Royal Astronomical Society, 472, 4707
- Bourne & Sijacki (2021) Bourne M. A., Sijacki D., 2021, MNRAS, 506, 488
- Bourne & Yang (2023) Bourne M. A., Yang H.-Y. K., 2023, Galaxies, 11, 73
- Bourne et al. (2015) Bourne M. A., Zubovas K., Nayakshin S., 2015, MNRAS, 453, 1829
- Bourne et al. (2019) Bourne M. A., Sijacki D., Puchwein E., 2019, MNRAS, 490, 343
- Bullock & Boylan-Kolchin (2017) Bullock J. S., Boylan-Kolchin M., 2017, Annual Review of Astronomy and Astrophysics, 55, 343
- Cavagnolo et al. (2010) Cavagnolo K. W., McNamara B. R., Nulsen P. E., Carilli C. L., Jones C., Bîrzan L., 2010, Astrophysical Journal, 720, 1066
- Chisari et al. (2018) Chisari N. E., et al., 2018, Monthly Notices of the Royal Astronomical Society, 480, 3962
- Chisari et al. (2019) Chisari N. E., et al., 2019, The Open Journal of Astrophysics, 2, 9452
- Ciotti et al. (2010) Ciotti L., Ostriker J. P., Proga D., 2010, Astrophysical Journal, 717, 708
- Costa et al. (2018) Costa T., Rosdahl J., Sijacki D., Haehnelt M. G., 2018, Monthly Notices of the Royal Astronomical Society, 479, 2079
- Costa et al. (2020) Costa T., Pakmor R., Springel V., 2020, Monthly Notices of the Royal Astronomical Society, 497, 5229
- Crain et al. (2015) Crain R. A., et al., 2015, Monthly Notices of the Royal Astronomical Society, 450, 1937
- Curtis & Sijacki (2016) Curtis M., Sijacki D., 2016, MNRAS, 457, L34
- Dashyan et al. (2019) Dashyan G., Choi E., Somerville R. S., Naab T., Quirk A. C., Hirschmann M., Ostriker J. P., 2019, Monthly Notices of the Royal Astronomical Society, 487, 5889
- Davé et al. (2019) Davé R., Anglés-Alcázar D., Narayanan D., Li Q., Rafieferantsoa M. H., Appleby S., 2019, MNRAS, 486, 2827
- Davis et al. (1985) Davis M., Efstathiou G., Frenk C. S., White S. D. M., 1985, ApJ, 292, 371
- Di Matteo et al. (2005) Di Matteo T., Springel V., Hernquist L., 2005, Nature, 433, 604
- Dolag et al. (2009) Dolag K., Borgani S., Murante G., Springel V., 2009, MNRAS, 399, 497
- Dubois et al. (2014) Dubois Y., et al., 2014, Monthly Notices of the Royal Astronomical Society, 444, 1453
- Dubois et al. (2021) Dubois Y., et al., 2021, Astronomy and Astrophysics, 651
- Fabian (2012) Fabian A. C., 2012, Annual Review of Astronomy and Astrophysics, 50, 455
- Farcy et al. (2022) Farcy M., Rosdahl J., Dubois Y., Blaizot J., Martin-Alvarez S., 2022, Monthly Notices of the Royal Astronomical Society, 513, 5000
- Faucher-Giguère et al. (2009) Faucher-Giguère C. A., Lidz A., Zaldarriaga M., Hernquist L., 2009, Astrophysical Journal, 703, 1416
- Gebhardt et al. (2024) Gebhardt M., et al., 2024, Monthly Notices of the Royal Astronomical Society, 529, 4896
- Genel et al. (2014) Genel S., et al., 2014, MNRAS, 445, 175
- Girichidis et al. (2018) Girichidis P., Naab T., Hanasz M., Walch S., 2018, Monthly Notices of the Royal Astronomical Society, 479, 3042
- Habouzit et al. (2017) Habouzit M., Volonteri M., Dubois Y., 2017, Monthly Notices of the Royal Astronomical Society, 468, 3935
- Habouzit et al. (2021) Habouzit M., et al., 2021, Monthly Notices of the Royal Astronomical Society, 503, 1940
- Hellwing et al. (2016) Hellwing W. A., Schaller M., Frenk C. S., Theuns T., Schaye J., Bower R. G., Crain R. A., 2016, Monthly Notices of the Royal Astronomical Society: Letters, 461, L11
- Henden et al. (2018) Henden N. A., Puchwein E., Shen S., Sijacki D., 2018, Monthly Notices of the Royal Astronomical Society, 479, 5385
- Henden et al. (2019) Henden N. A., Puchwein E., Sijacki D., 2019, MNRAS, 489, 2439
- Henden et al. (2020) Henden N. A., Puchwein E., Sijacki D., 2020, MNRAS, 498, 2114
- Heymans et al. (2021) Heymans C., et al., 2021, Astronomy and Astrophysics, 646, A140
- Hinshaw et al. (2013) Hinshaw G., et al., 2013, Astrophysical Journal, Supplement Series, 208, 19
- Hopkins et al. (2014) Hopkins P. F., Kereš D., Oñorbe J., Faucher-Giguère C. A., Quataert E., Murray N., Bullock J. S., 2014, Monthly Notices of the Royal Astronomical Society, 445, 581
- Hopkins et al. (2020) Hopkins P. F., et al., 2020, MNRAS, 492, 3465
- Hopkins et al. (2024a) Hopkins P. F., et al., 2024a, Open Journal of Astrophysics, 7
- Hopkins et al. (2024b) Hopkins P. F., et al., 2024b, The Open Journal of Astrophysics, 7, 18
- Hoyle & Lyttleton (1939) Hoyle F., Lyttleton R. A., 1939, Math. Proc. Cambridge Philos. Soc., 35, 405
- Huang et al. (2019) Huang H. J., Eifler T., Mandelbaum R., Dodelson S., 2019, Monthly Notices of the Royal Astronomical Society, 488, 1652
- Huško et al. (2022) Huško F., Lacey C. G., Schaye J., Schaller M., Nobels F. S. J., 2022, MNRAS, 516, 3750
- Ivezić et al. (2019) Ivezić Z., et al., 2019, The Astrophysical Journal, 873, 111
- Katz et al. (1996) Katz N., Weinberg D. H., Hernquist L., 1996, ApJS, 105, 19
- Khandai et al. (2015) Khandai N., Di Matteo T., Croft R., Wilkins S., Feng Y., Tucker E., DeGraf C., Liu M. S., 2015, Monthly Notices of the Royal Astronomical Society, 450, 1349
- Koudmani et al. (2019) Koudmani S., Sijacki D., Bourne M. A., Smith M. C., 2019, Monthly Notices of the Royal Astronomical Society, 484, 2047
- Koudmani et al. (2021) Koudmani S., Henden N. A., Sijacki D., 2021, Monthly Notices of the Royal Astronomical Society, 503, 3568
- Koudmani et al. (2022) Koudmani S., Sijacki D., Smith M. C., 2022, Monthly Notices of the Royal Astronomical Society, 516, 2112
- Koudmani et al. (2023) Koudmani S., Somerville R. S., Sijacki D., Bourne M. A., Jiang Y.-F., Profit K., 2023, arXiv e-prints, p. arXiv:2312.08428
- Laureijs et al. (2011) Laureijs R., et al., 2011, arXiv e-prints, p. arXiv:1110.3193
- Madau & Dickinson (2014) Madau P., Dickinson M., 2014, Annual Review of Astronomy and Astrophysics, 52, 415
- Marinacci et al. (2014) Marinacci F., Pakmor R., Springel V., 2014, Monthly Notices of the Royal Astronomical Society, 437, 1750
- Martin-Alvarez et al. (2020) Martin-Alvarez S., Slyz A., Devriendt J., Gómez-Guijarro C., 2020, Monthly Notices of the Royal Astronomical Society, 495, 4475
- Martin-Alvarez et al. (2021) Martin-Alvarez S., Katz H., Sijacki D., Devriendt J., Slyz A., 2021, MNRAS, 504, 2517
- Martin-Alvarez et al. (2022) Martin-Alvarez S., Devriendt J., Slyz A., Sijacki D., Richardson M. L., Katz H., 2022, Monthly Notices of the Royal Astronomical Society, 513, 3326
- Martin-Alvarez et al. (2023) Martin-Alvarez S., Sijacki D., Haehnelt M. G., Farcy M., Dubois Y., Belokurov V., Rosdahl J., Lopez-Rodriguez E., 2023, Monthly Notices of the Royal Astronomical Society, 525, 3806
- Martín-Navarro et al. (2021) Martín-Navarro I., Pillepich A., Nelson D., Rodriguez-Gomez V., Donnari M., Hernquist L., Springel V., 2021, Nature, 594, 187
- McCarthy et al. (2017) McCarthy I. G., Schaye J., Bird S., Le Brun A. M. C., 2017, MNRAS, 465, 2936
- McCarthy et al. (2018) McCarthy I. G., Bird S., Schaye J., Harnois-Deraps J., Font A. S., van Waerbeke L., 2018, Monthly Notices of the Royal Astronomical Society, 476, 2999
- McNamara & Nulsen (2007) McNamara B. R., Nulsen P. E., 2007, Annual Review of Astronomy and Astrophysics, 45, 117
- Mead et al. (2015) Mead A. J., Peacock J. A., Heymans C., Joudaki S., Heavens A. F., 2015, Monthly Notices of the Royal Astronomical Society, 454, 1958
- Mead et al. (2021) Mead A. J., Brieden S., Tröster T., Heymans C., 2021, Monthly Notices of the Royal Astronomical Society, 502, 1401
- Pakmor et al. (2016) Pakmor R., Pfrommer C., Simpson C. M., Springel V., 2016, The Astrophysical Journal, 824, L30
- Pakmor et al. (2023) Pakmor R., et al., 2023, Monthly Notices of the Royal Astronomical Society, 524, 2539
- Pfrommer et al. (2017) Pfrommer C., Pakmor R., Schaal K., Simpson C. M., Springel V., 2017, Monthly Notices of the Royal Astronomical Society, 465, 4500
- Pillepich et al. (2018) Pillepich A., et al., 2018, Monthly Notices of the Royal Astronomical Society, 473, 4077
- Planck Collaboration XIII (2016) Planck Collaboration XIII 2016, Astron. Astrophys., 594
- Qu et al. (2024) Qu F. J., et al., 2024, The Astrophysical Journal, 962, 112
- Rennehan et al. (2023) Rennehan D., Babul A., Moa B., Davé R., 2023, arXiv e-prints, p. arXiv:2309.15898
- Rodríguez et al. (2024) Rodríguez F., Montero R., Martin-Alvarez S., Slyz A., Devriendt J., Dubois Y., Sijacki D., 2024, Monthly Notices of the Royal Astronomical Society, 530, 3617
- Rosdahl et al. (2018) Rosdahl J., et al., 2018, Monthly Notices of the Royal Astronomical Society, 479, 994
- Ruszkowski & Pfrommer (2023) Ruszkowski M., Pfrommer C., 2023, Astronomy and Astrophysics Review, 31
- Schaye et al. (2015) Schaye J., et al., 2015, Monthly Notices of the Royal Astronomical Society, 446, 521
- Schaye et al. (2023) Schaye J., et al., 2023, Monthly Notices of the Royal Astronomical Society, 526, 4978
- Schneider et al. (2019) Schneider A., Teyssier R., Stadel J., Chisari N. E., Brun A. M., Amara A., Refregier A., 2019, Journal of Cosmology and Astroparticle Physics, 2019, 020
- Secco et al. (2022) Secco L. F., et al., 2022, Physical Review D, 105, 023515
- Seljak (2000) Seljak U., 2000, Monthly Notices of the Royal Astronomical Society, 318, 203
- Semboloni et al. (2011) Semboloni E., Hoekstra H., Schaye J., Van Daalen M. P., Mccarthy I. G., 2011, Monthly Notices of the Royal Astronomical Society, 417, 2020
- Shuntov et al. (2022) Shuntov M., et al., 2022, Astronomy and Astrophysics, 664, A61
- Sijacki et al. (2007) Sijacki D., Springel V., Di Matteo T., Hernquist L., 2007, MNRAS, 380, 877
- Sijacki et al. (2015) Sijacki D., Vogelsberger M., Genel S., Springel V., Torrey P., Snyder G. F., Nelson D., Hernquist L., 2015, Monthly Notices of the Royal Astronomical Society, 452, 575
- Sorini et al. (2022) Sorini D., Dav R., Cui W., Appleby S., 2022, Monthly Notices of the Royal Astronomical Society, 516, 883
- Spergel et al. (2013) Spergel D., et al., 2013, arXiv e-prints, p. arXiv:1305.5425
- Springel (2010) Springel V., 2010, MNRAS, 401, 791
- Springel & Hernquist (2003) Springel V., Hernquist L., 2003, MNRAS, 339, 289
- Springel et al. (2001) Springel V., White S. D., Tormen G., Kauffmann G., 2001, MNRAS, 328, 726
- Springel et al. (2005) Springel V., Di Matteo T., Hernquist L., 2005, MNRAS, 361, 776
- Springel et al. (2018) Springel V., et al., 2018, Monthly Notices of the Royal Astronomical Society, 475, 676
- Su et al. (2021) Su K.-Y., et al., 2021, MNRAS, 507, 175
- Talbot et al. (2021) Talbot R. Y., Bourne M. A., Sijacki D., 2021, Monthly Notices of the Royal Astronomical Society, 504, 3619
- Talbot et al. (2024) Talbot R. Y., Sijacki D., Bourne M. A., 2024, Monthly Notices of the Royal Astronomical Society, 528, 5432
- Torrey et al. (2014) Torrey P., Vogelsberger M., Genel S., Sijacki D., Springel V., Hernquist L., 2014, MNRAS, 438, 1985
- Torrey et al. (2017) Torrey P., Hopkins P. F., Faucher-Giguère C. A., Vogelsberger M., Quataert E., Kereš D., Murray N., 2017, Monthly Notices of the Royal Astronomical Society, 467, 2301
- Trebitsch et al. (2020) Trebitsch M., Volonteri M., Dubois Y., 2020, Monthly Notices of the Royal Astronomical Society, 494, 3453
- Tremmel et al. (2017) Tremmel M., Karcher M., Governato F., Volonteri M., Quinn T. R., Pontzen A., Anderson L., Bellovary J., 2017, MNRAS, 470, 1121
- Tremmel et al. (2019) Tremmel M., et al., 2019, MNRAS, 483, 3336
- Villaescusa-Navarro et al. (2021) Villaescusa-Navarro F., et al., 2021, The Astrophysical Journal, 915, 71
- Vogelsberger et al. (2013) Vogelsberger M., Genel S., Sijacki D., Torrey P., Springel V., Hernquist L., 2013, MNRAS, 436, 3031
- Vogelsberger et al. (2014a) Vogelsberger M., et al., 2014a, MNRAS, 444, 1518
- Vogelsberger et al. (2014b) Vogelsberger M., et al., 2014b, Monthly Notices of the Royal Astronomical Society, 444, 1518
- Vogelsberger et al. (2014c) Vogelsberger M., et al., 2014c, Nature, 509, 177
- Weinberger et al. (2018) Weinberger R., et al., 2018, MNRAS, 479, 4056
- Wellons et al. (2023) Wellons S., et al., 2023, MNRAS, 520, 5394
- White & Frenk (1991) White S. D. M., Frenk C. S., 1991, The Astrophysical Journal, 379, 52
- Wiersma et al. (2009a) Wiersma R. P., Schaye J., Smith B. D., 2009a, MNRAS, 393, 99
- Wiersma et al. (2009b) Wiersma R. P., Schaye J., Theuns T., Dalla Vecchia C., Tornatore L., 2009b, MNRAS, 399, 574
- Zubovas et al. (2016) Zubovas K., Bourne M. A., Nayakshin S., 2016, MNRAS, 457, 496
- van Daalen & Schaye (2015) van Daalen M. P., Schaye J., 2015, Monthly Notices of the Royal Astronomical Society, 452, 2247
- van Daalen et al. (2011) van Daalen M. P., Schaye J., Booth C. M., Dalla Vecchia C., 2011, Monthly Notices of the Royal Astronomical Society, 415, 3649
- van Daalen et al. (2020) van Daalen M. P., McCarthy I. G., Schaye J., 2020, Monthly Notices of the Royal Astronomical Society, 491, 2424
- van Loon & van Daalen (2023) van Loon M. L., van Daalen M. P., 2023, Mon. Not. R. Astron. Soc, 000
Appendix A Temporal Evolution of AGN Feedback Modes
In the main body of this work, we found different AGN feedback models to exhibit distinct impacts on the MPS. Here we briefly discuss the evolution of AGN feedback modes (quasar vs radio) across the redshift evolution of fable.
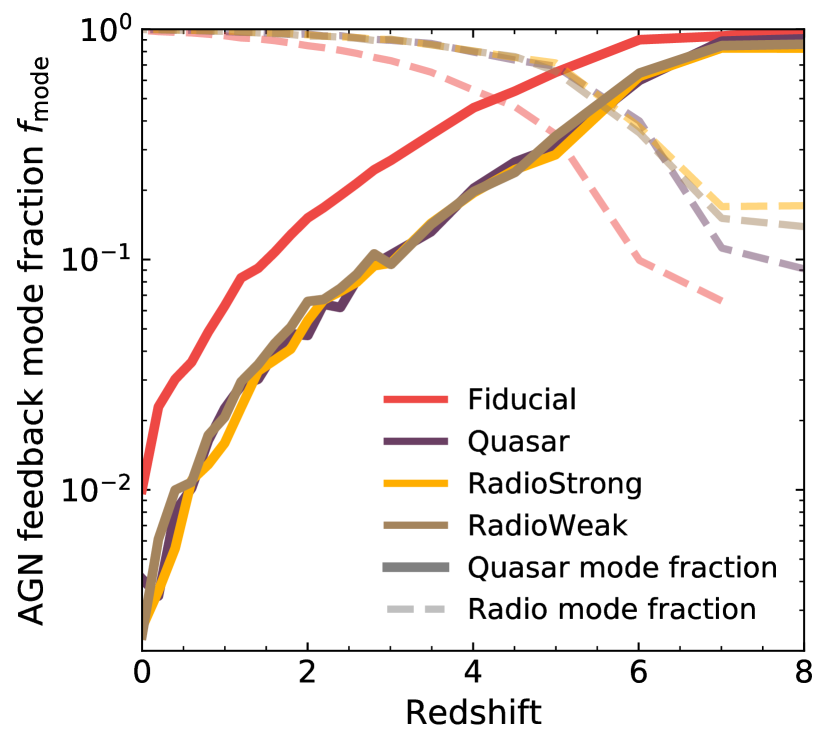
The fraction of AGN in each mode are shown in Figure 11, where solid lines represent the quasar mode and dashed lines denote the radio mode. The quasar mode is predominantly active at higher redshifts. This aligns with the expected behavior where quasar mode, being associated with high accretion rates, is more prevalent during the early, more chaotic epochs of galaxy formation. Conversely, the radio mode, which is often linked to maintenance feedback in more evolved systems, becomes dominant after . Despite a different feedback switch fraction in the Fiducial model, the measured impact on the MPS appears dominated by the combination of its higher radiative efficiency (akin to RadioStrong) and the quasar duty cycle (also included in the Quasar simulation). At high redshift, the largest SMBHs are well within the quasar mode Eddington fraction regimen. Due to these AGN in these haloes being the main drivers of power suppression, we expect the feedback switch fraction to have relatively little effect on the MPS 444The feedback switch mainly affects the AGN in the dwarf regime where there is a much weaker correlation between black hole mass and AGN activity, in particular at low redshifts (see Koudmani et al., 2021). Except for this aspect of the Fiducial model, all simulations exhibit a broadly similar evolution pattern. Such evolutionary trend for the AGN feedback modes provide further context for why our modifications to the quasar mode (Quasar and Fiducial) are particularly important at high redshift (), whereas the so-called ‘maintenance’ radio mode effects reveal themselves after .
Appendix B Redshift Evolution of the Haloes MPS
In Section 3.2 we studied how the total MPS evolved over redshift, whereas Sections 3.4 and 3.5 addressed the effect of halo selection on the MPS, and the evolution of power at a fixed large () and small () scale, respectively. To complement these two aspects, here we provide further detail on the evolution of the haloes MPS. Understanding the evolution of the MPS for matter inside haloes will be particularly important as future observatories probe systems at (Ade et al., 2019).
Figure 12 is complementary to Figure 3, but now shows the MPS from matter within haloes. It displays the redshift evolution of from to in the fable AGN simulations: Fiducial (top left), RadioWeak (top right), Quasar (bottom left), and RadioStrong (bottom right). Overall, the trends observed in the main text regarding the temporal and scale-dependent impacts of different AGN feedback models are reproduced in the autopower of matter inside haloes here. At larger scales (), the amount of power residing within haloes is significantly smaller than the total , but features a comparable evolution of all models.