1Department of Physics, Mar Thoma College, Kuttapuzha P. O. Tiruvalla, PIN 689103, Kerala, India.
Solar activity and extreme rainfall over Kerala, India
Abstract
In this paper, we examine the relationship between solar activity and extreme rainfall events in Kerala, India. Kerala receives minimum and maximum rainfall during the winter and monsoon seasons, respectively. Sunspot number, F10.7 Index, and cosmic ray intensity are the solar indices considered and their variations with rainfall were studied over a period of 57 years (1965-2021), i.e., starting from Solar Cycle 20. For each solar cycle, correlative studies are performed and correlation coefficients are calculated. We find that rainfall in Kerala is correlated with sunspot activity, but with varying degrees of significance. During Solar Cycle 21, rainfall and solar activity are correlated with high significance during both winter and monsoon seasons. The variation of different solar indices with rainfall is studied. The winter season showed a better link between the sun and rainfall than the monsoon season. The years with rainfall surplus and deficiency are calculated and compared with the solar indices. We find that the years with rainfall excess and deficit mostly occur in the years around solar maximum or minimum (within 2 years). We hypothesise a physical relationship between solar activity and extreme rainfall events in Kerala that contributes to their predictability.
keywords:
solar activity—extreme rainfall—sunspot cycle.noblepa@gmail.com
12.3456/s78910-011-012-3 \artcitid#### \volnum000 0000 \pgrange1– \lp1
1 Introduction
The change of the world climate is a serious matter as it affects the existence of mankind. Weather and climate are significantly influenced by the sun, in addition to anthropogenic factors. Solar activity, i.e. magnetic activity inside the Sun, manifests itself in the form of sunspots, solar flares, solar wind, coronal mass ejections, etc [Usoskin, 2017]. Some of the solar indices commonly used to quantify solar activity are total solar irradiance, sunspot number, solar radio flux, cosmic rays, etc. The sunspot number quantifies sunspots and is widely used because of its long-term availability. It is strongly correlated with other solar indices [Hathaway, 2015, Tiwari & Kumar, 2018]. A measure of solar radio flux at 10.7 cm is called the F10.7 index, which originates deep in the corona and high in the chromosphere [Tapping & Charrois, 1994, Tapping, 2013]. Cosmic rays originate outside the solar system and are high-energy particles that reach the Earth. It is observed that cosmic rays are negatively correlated with sunspot number [Gupta et al., 2006].
The Sun’s influence on Earth’s precipitation has long been a topic of concern. Solar activity affects rainfall in a wide variety of ways, which are reflected in the varying correlations based on the time scale and region [Tsiropoula, 2003, Zhao et al., 2004, Wasko & Sharma, 2009, Mauas et al., 2011, Rampelotto et al., 2012]. Some recent work on sun-rainfall link were carried out in China [Zhai, 2017, Yu et al., 2019, Song et al., 2022], the United States [Nitka & Burnecki, 2019], Europe [Laurenz et al., 2019], Argentina [Heredia et al., 2019], Nepal [Tiwari et al., 2021] and Northeast Asia [Song et al., 2022].
Changes in rainfall patterns can severely affect a country like India, posing challenges to its economy, farming, and ecosystem [Doranalu Chandrashekar et al., 2017]. Over India as a whole or in different regions, numerous authors have explored the possibility of an association between solar activity and rainfall [Jagannathan & Bhalme, 1973, Ananthakrishnan & Parthasarathy, 1984, Hiremath & Mandi, 2004, Bhattacharyya & Narasimha, 2005, Agnihotri et al., 2011, Badruddin & Aslam, 2015, Warrier et al., 2017, Thomas & Abraham, 2022b]. The direct and indirect effects were studied. The results were often localised and contradicted other authors [Jagannathan & Parthasarathy, 1973, Bhalme et al., 1981, Hiremath, 2006, Bhattacharyya & Narasimha, 2007, Lihua et al., 2007, Selvaraj et al., 2009a, Selvaraj & Aditya, 2011, Selvaraj et al., 2013, Hiremath et al., 2015, Malik & Brönnimann, 2018, Thomas et al., 2023].
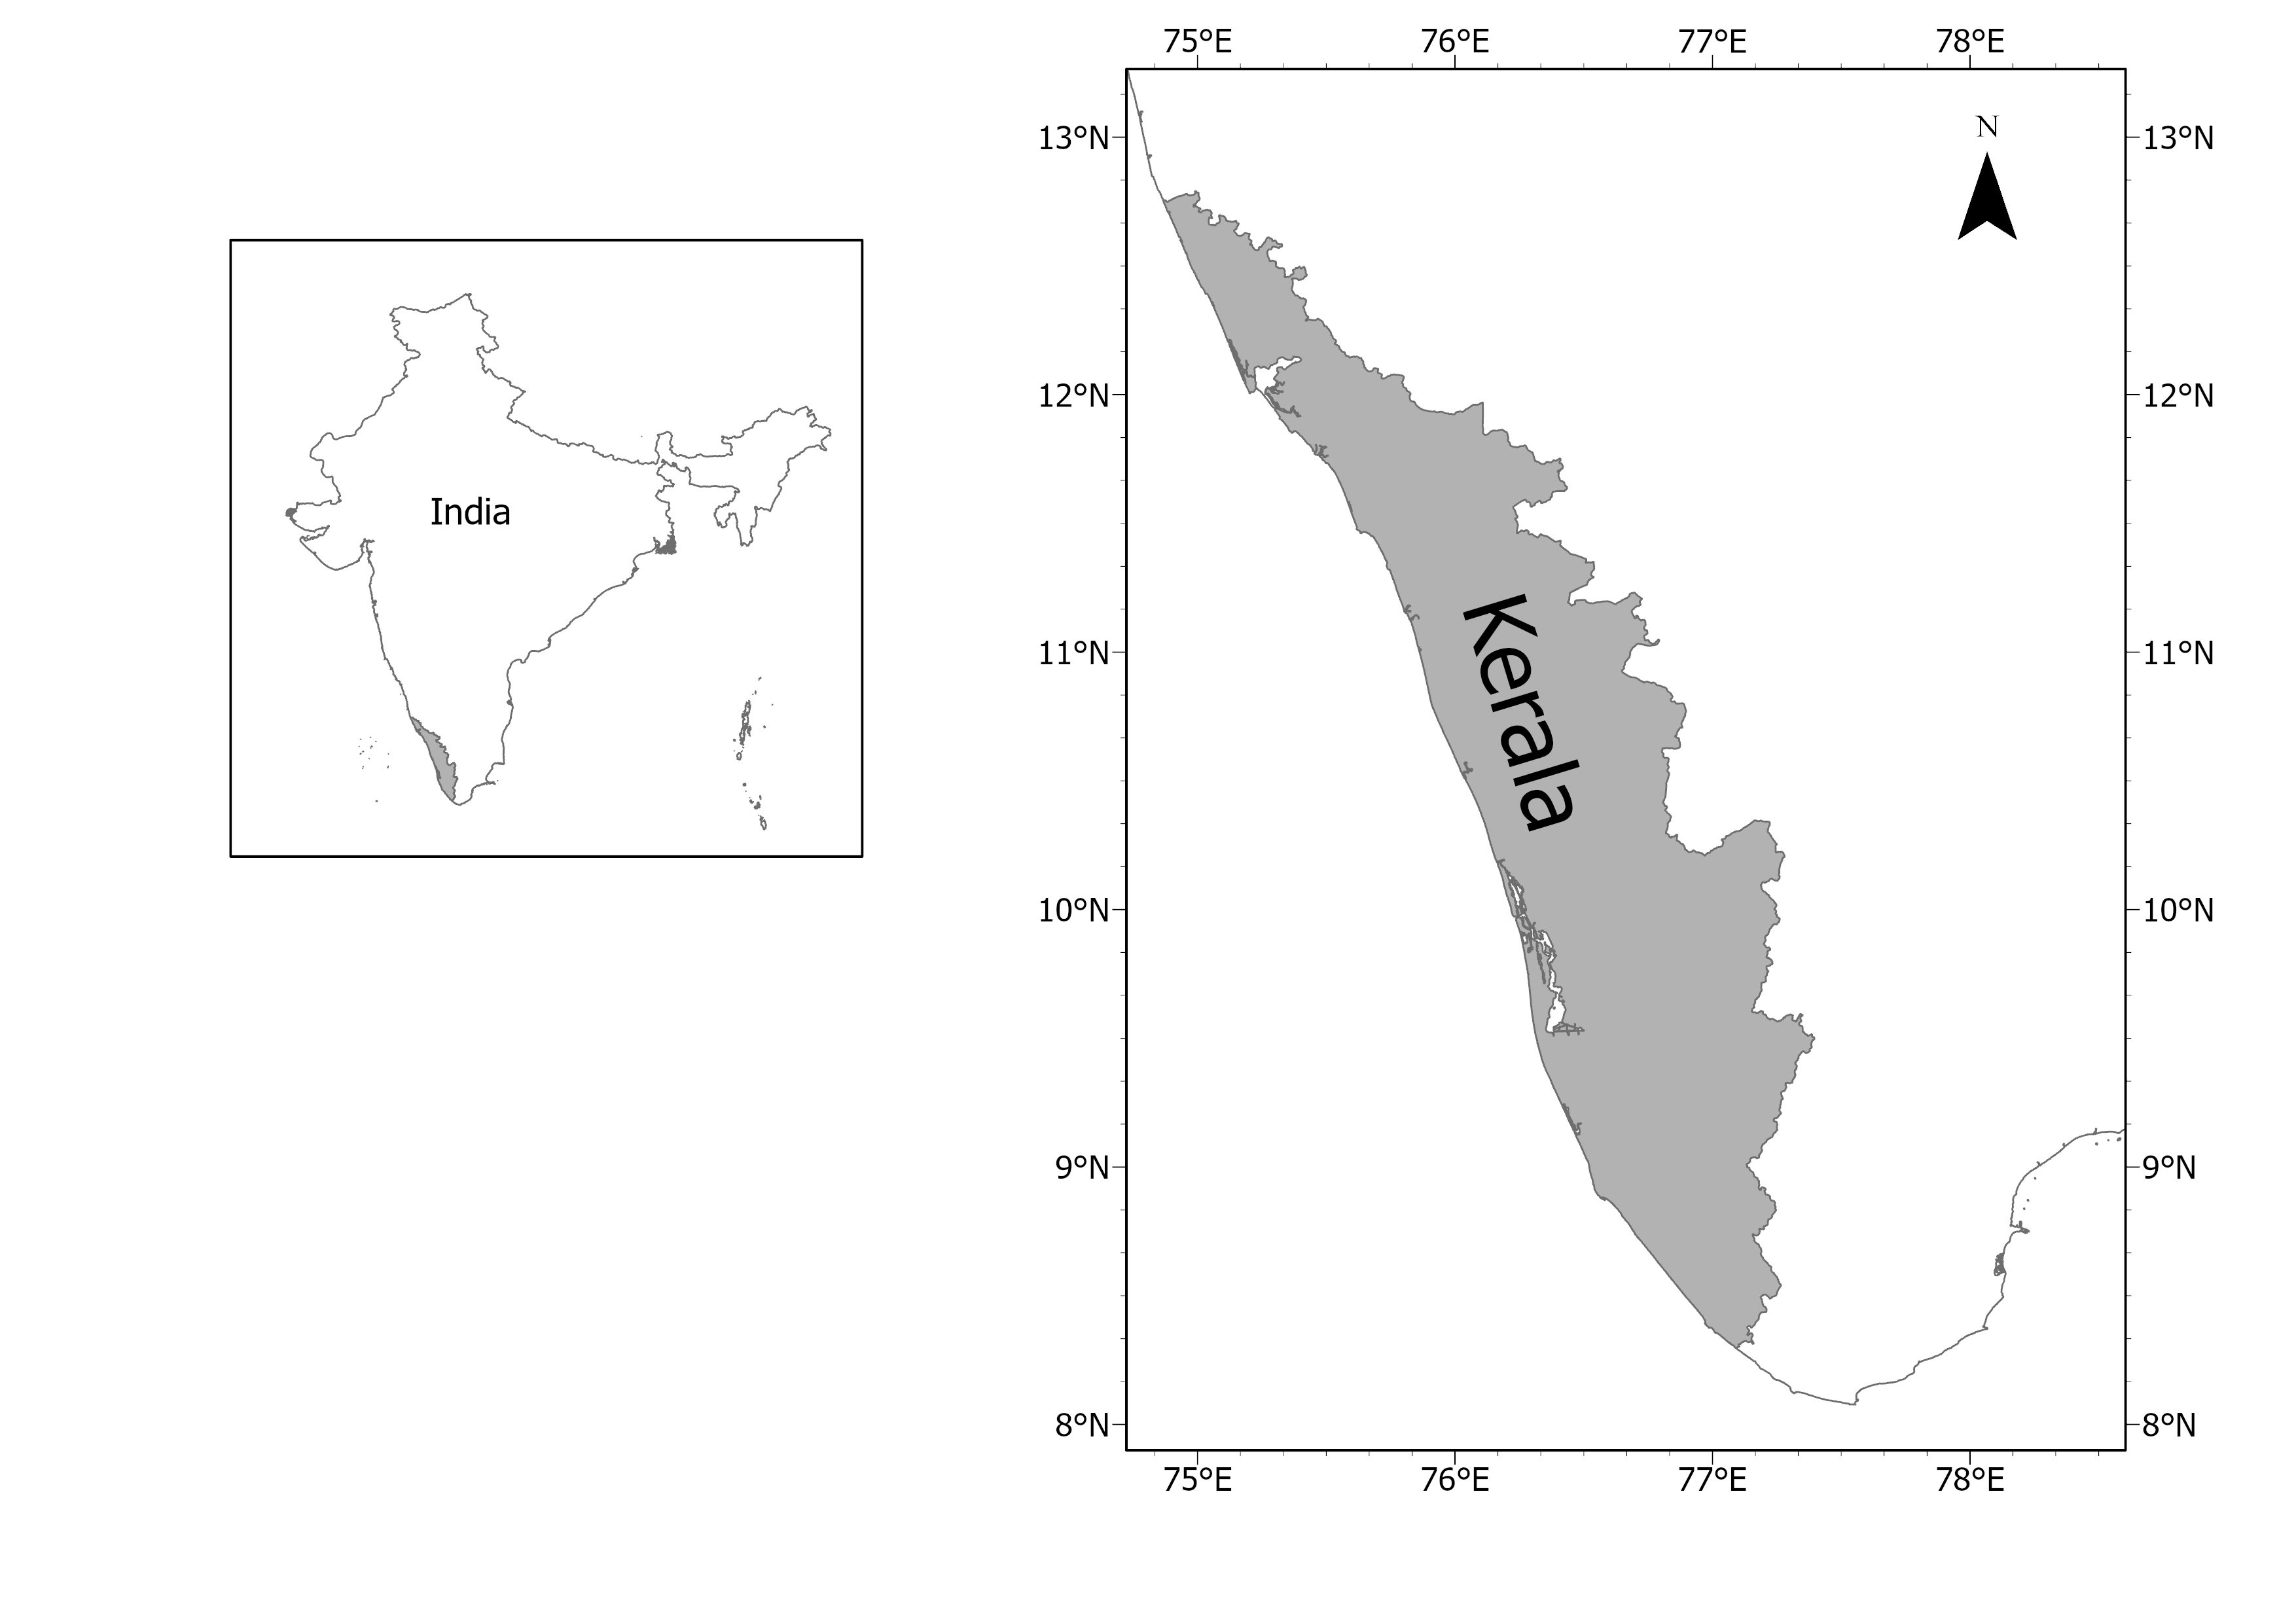
Kerala lies on the southwestern tip of India and is bounded on the east by the Western Ghats and on the west by the Arabian Sea. It extends between 8∘15′ and 12∘50′ northern latitude and between 74∘50′ and 77∘30′ eastern longitude. The climate of Kerala is subtropical, with the eastern highlands (rugged and cool mountainous), the central midlands (rolling hills), and the western lowlands (coastal plains). Kerala’s diverse features make it more vulnerable to climate change. Kerala is known as the ”gateway to the summer monsoon.” Studies on long-term rainfall variability found that southwest monsoon rainfall decreased significantly while post-monsoon rainfall increased [Krishnakumar et al., 2009, Kothawale & Rajeevan, 2017]. Recently, a few studies have reported the influence of sunspot number on rainfall over Kerala [Thomas & Abraham, 2022a, b, Thomas et al., 2023]. The location map of Kerala is shown in Figure 1.
Extreme rainfall events have recently occurred in Kerala, causing floods or landslides that have resulted in the loss of lives and property. In India, several studies have linked solar activity to extreme weather events (see for e.g. Bhalme & Mooley [1981], Azad [2011]). Hence, a study of extreme rainfall over the Kerala region with different solar parameters would be of interest.
Investigating the response of rainfall to different solar indices could reveal subtle differences. In this paper, the influence of different solar indices, i.e., sunspot number, F10.7 Index, and cosmic ray intensity, on the occurrence of extreme precipitation over Kerala is evaluated using correlation studies. Section 2 discusses the data and methodology of the analysis. Section 3 presents the results and discussion on the correlation and variation of different solar indices with rainfall over Kerala. It also includes results on extreme rainfall events. Section 4 contains the conclusions.
2 Data and Methods
2.1 Dataset
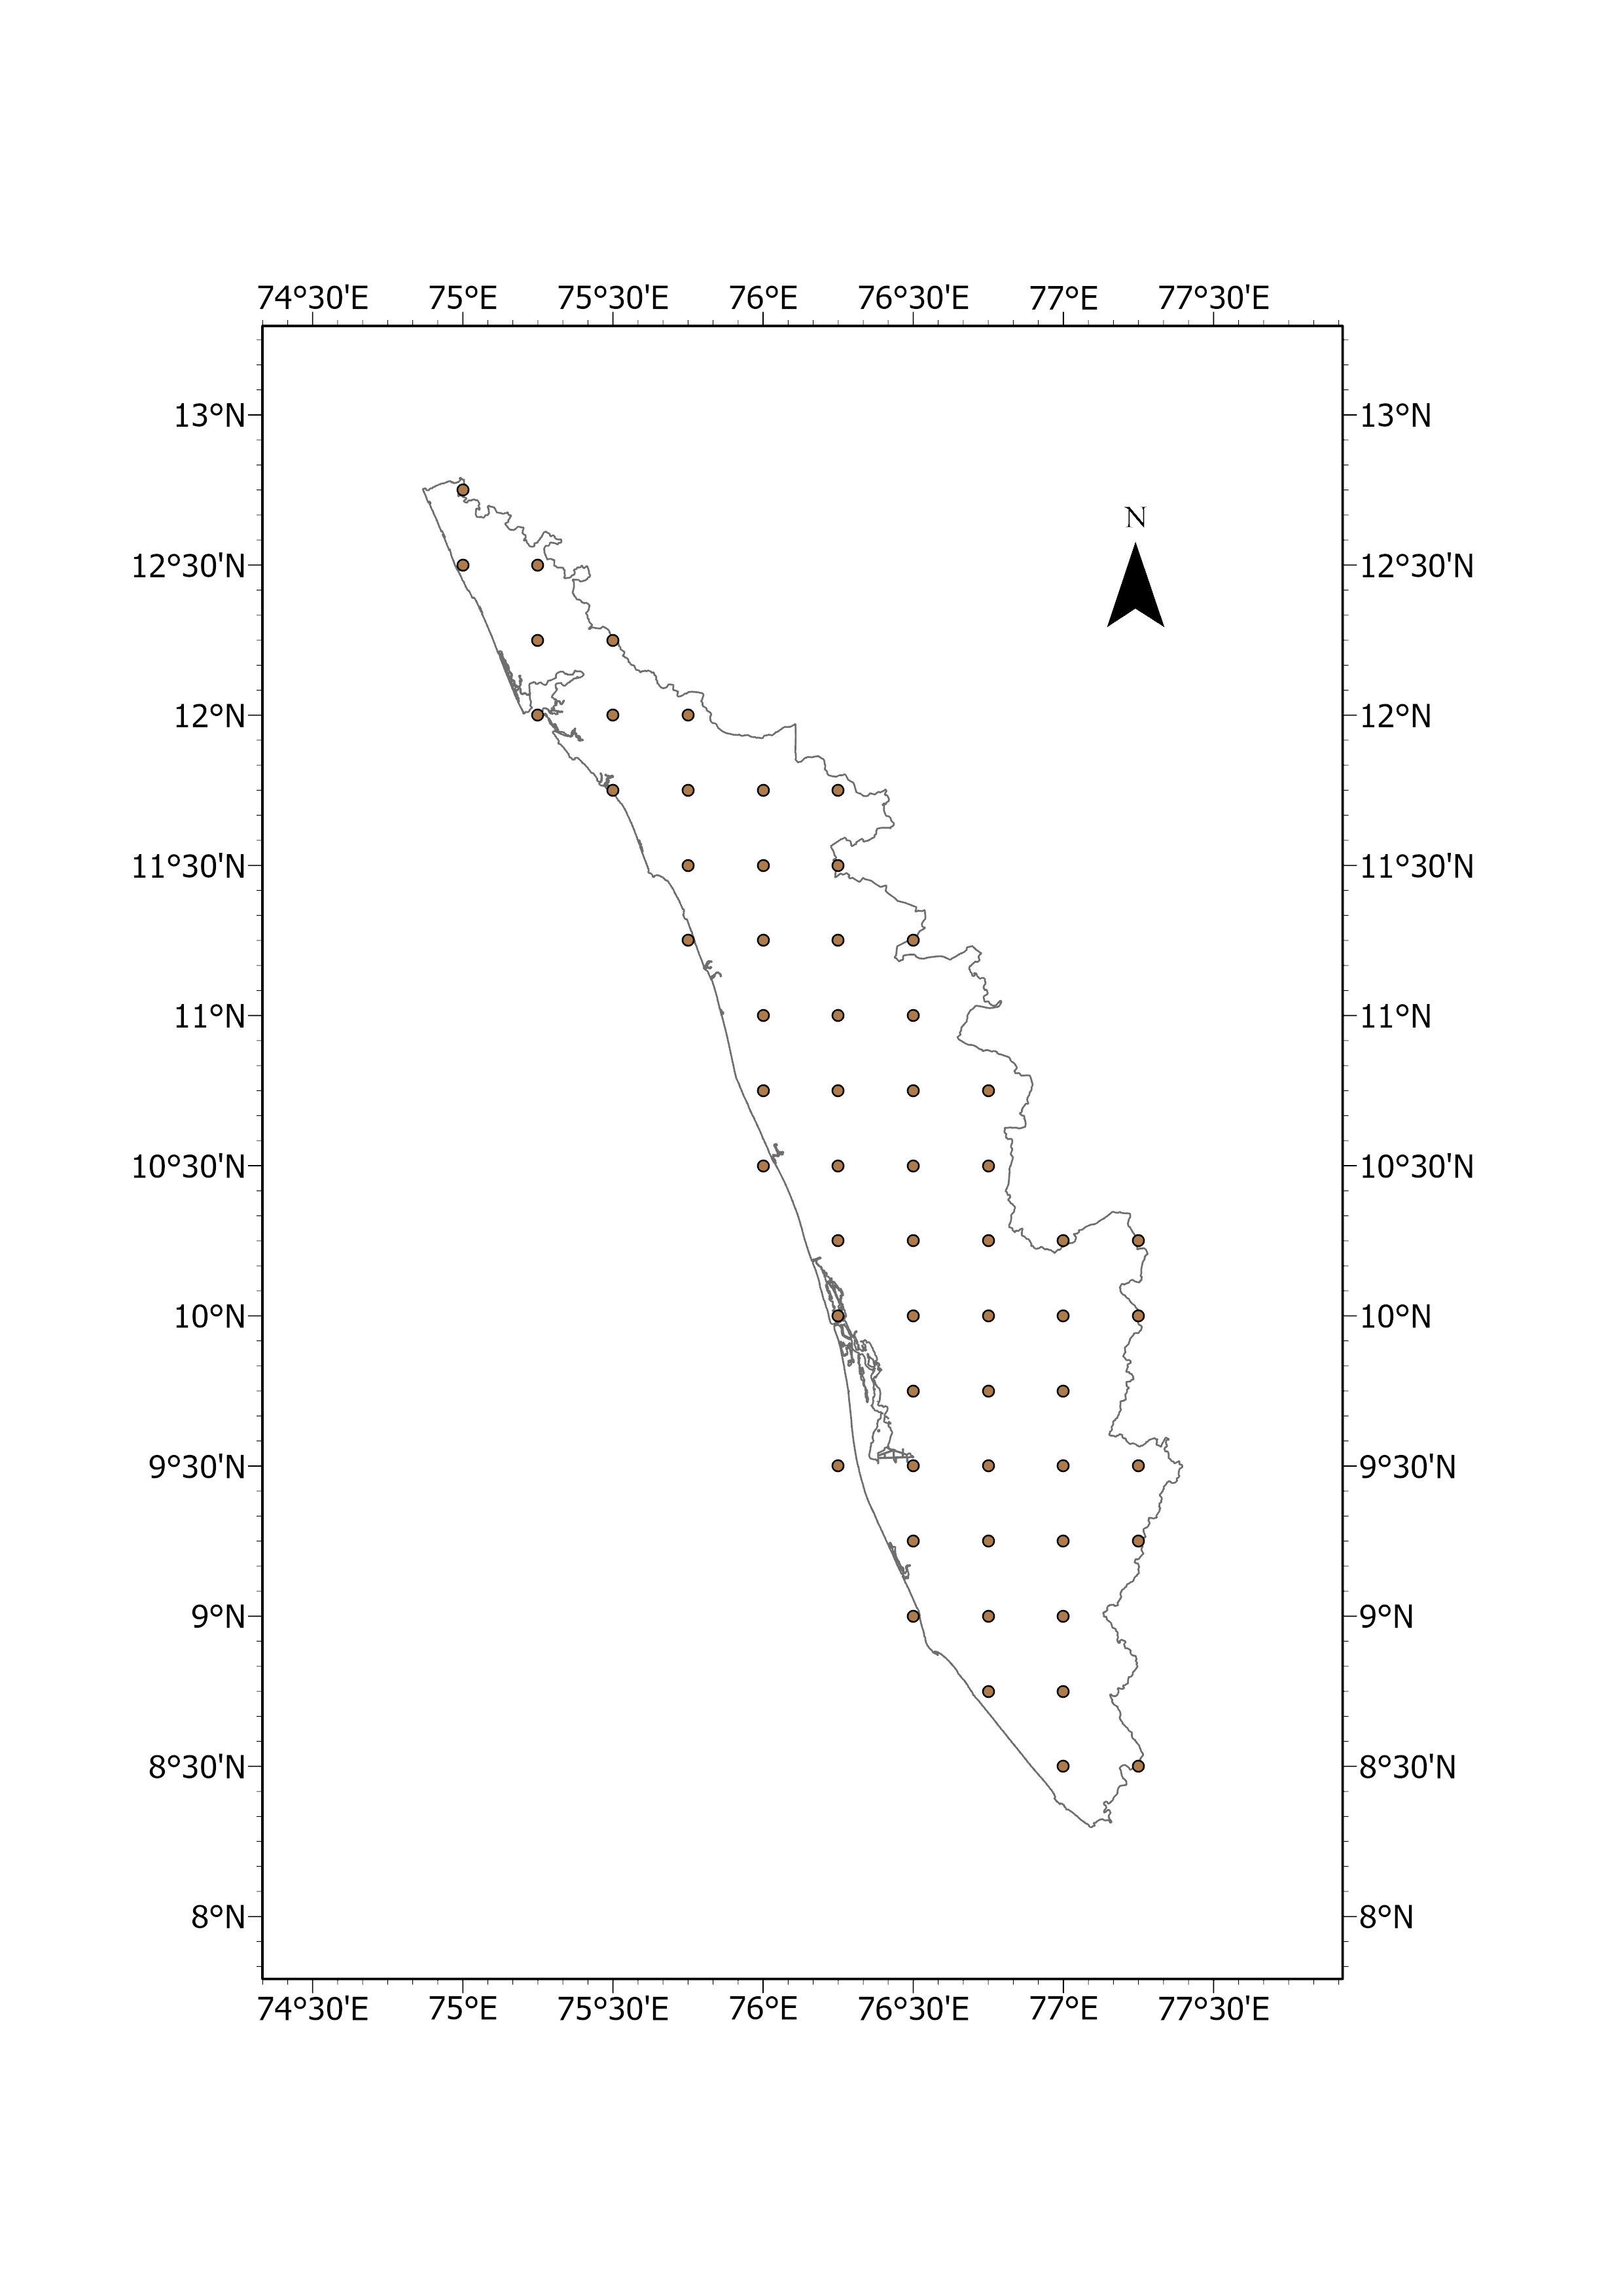
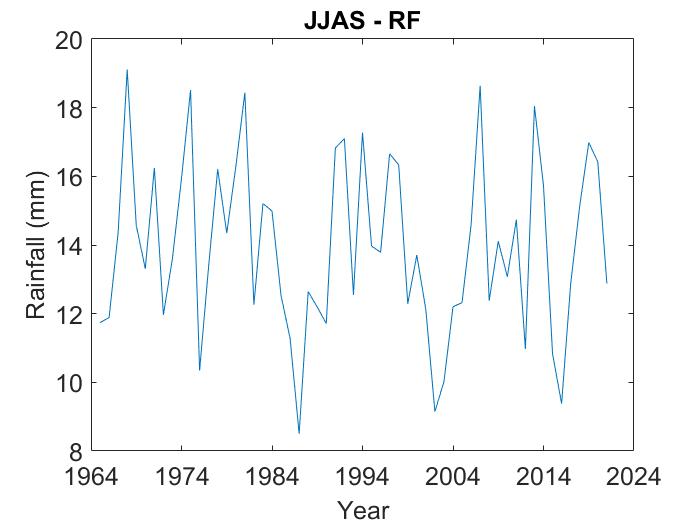
For this study, daily data of various solar indices (sunspot number, F10.7 Index, and cosmic ray intensity) and rainfall over Kerala were used from 1965 to 2021, i.e., from Solar Cycle 20. The sunspot number data was obtained from the World Data Center SILSO, Royal Observatory of Belgium, Brussels. F10.7 Index is the solar flux data (in sfu, 1 sfu = ) and was downloaded from LASP Interactive Solar Irradiance Data Center. Cosmic ray intensity (in counts/min) data was taken from Oulu Cosmic Ray station. Rainfall (in mm) over Kerala was obtained from the India Meteorological Department’s (IMD) daily gridded rainfall dataset of high spatial resolution (0.25∘ × 0.25∘) [Pai et al., 2014]. 59 grid points covering the region of Kerala were used in this study and are shown in Figure 2.
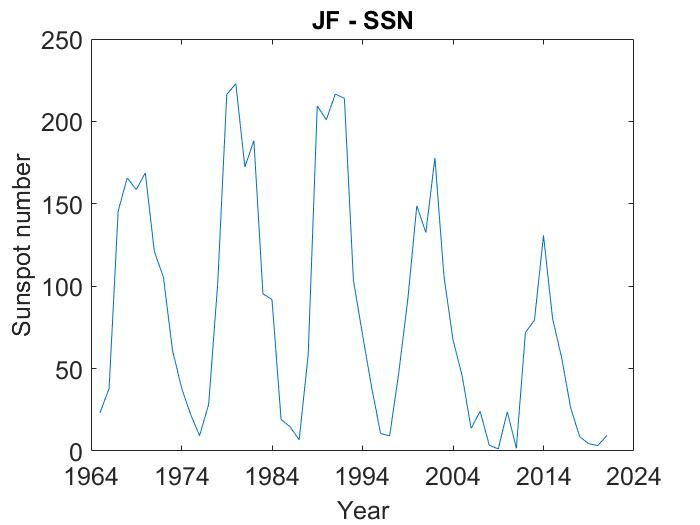
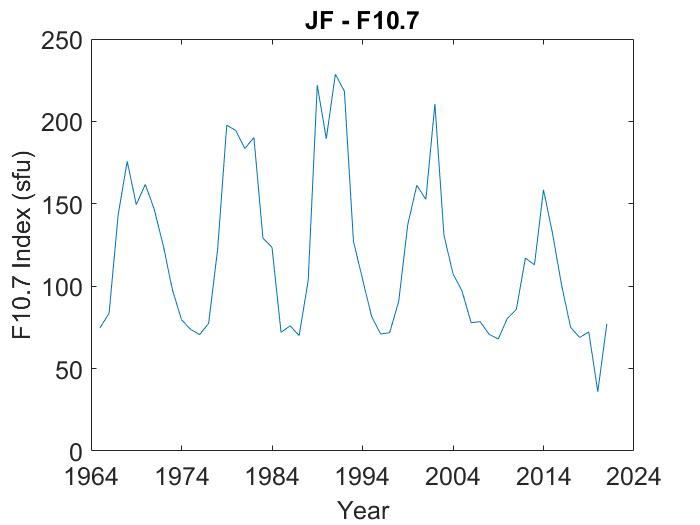
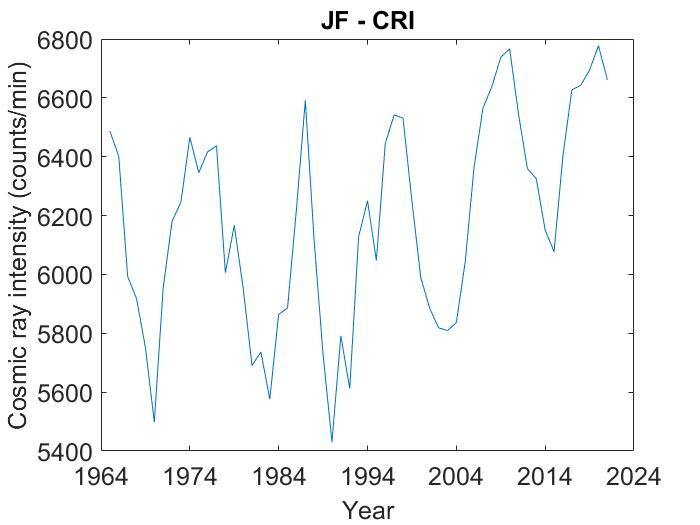
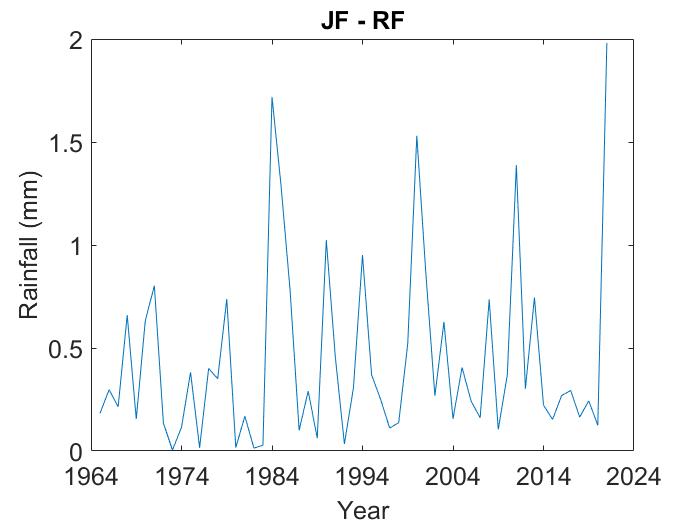
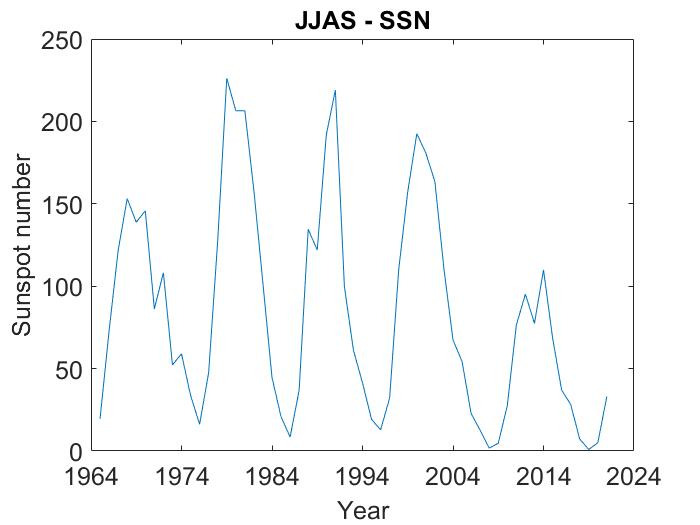
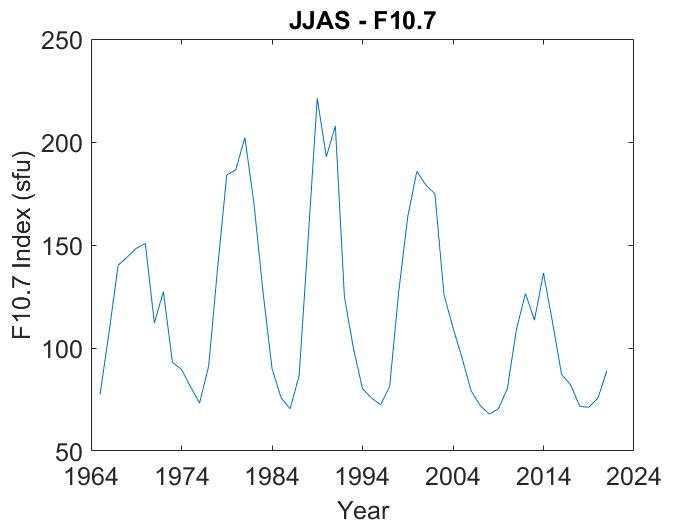
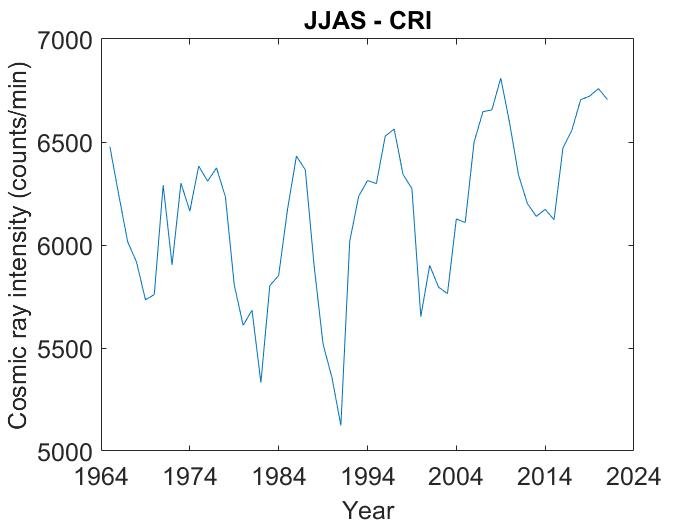
India Meteorological Department (IMD) classifies the seasons of India as Winter (January-February), Pre-monsoon (March-May), Southwest monsoon (June-September), and Post-monsoon (October-December). In this study, Southwest-monsoon season, denoted as JJAS and the winter season, denoted as JF were used, as maximum and minimum rainfall are accounted for during these seasons. Similar grouping (JF and JJAS) was done with the solar activity features (sunspot number, F10.7 index, and cosmic ray intensity) data. The daily data for each parameter were averaged for each season, and the corresponding values for sunspot number are given as SSN (/days), F10.7 Index is given as F10.7 (sfu/days), cosmic ray intensity is given as CRI (count/min/days), and rainfall is given as RF (mm/days). Figure 3 and Figure 4 show the time series of SSN, F10.7, CRI, and RF corresponding to the JF and JJAS seasons respectively.
2.2 Methodology
To observe the relationship between solar indices and rainfall for Solar Cycles 20-24, correlative studies were carried out. Correlation coefficients are usually computed to check whether any relationship exist between the two data sets and how strong the relationship is. Here, Spearman Rank-Order correlation coefficients and their significance were calculated to determine the relationship between different solar indices (SSN, F10.7 and CRI) and rainfall (RF) data. Since this correlation method provides information about monotonic relationships, it is more powerful than linear correlation [Hiremath & Mandi, 2004, Hiremath, 2006, Bankoti et al., 2011]. The p-value obtained gives the significance of the test. The p-values 0.1 gives 10 % significance. Corresponding to all the solar activity indices, correlation coefficients, and their significance were determined for each solar cycle. As the rainfall is noisy, the RF values was smoothened by moving average of two, four and six points and the correlation studies were carried out [Bankoti et al., 2011].
In order to study the relation of extreme rainfall events with the solar activity, the years of excess and deficit rainfall over Kerala were identified. For that, the mean () and standard deviation () of rainfall RF, during both the seasons (JF and JJAS), were determined. A year was labelled as extreme rainfall year when and a year labelled as deficient rainfall year when , where is the rainfall of that year, [Azad, 2011]. In this study, was defined as one. The excess and deficient rainfall years were used to study the relation of rainfall with solar activity.
3 Results and Discussions
The Spearman Rank-Order correlation coefficient and its significance between different solar indices, i.e., sunspot number, F10.7 Index and cosmic ray intensity, and rainfall is shown in Table 1, where * represents 0.1 significance level. The first column represents the solar cycle, the second column represents different types of moving point average and original data set for different seasonal months (JF and JJAS). The correlation coefficients with significance(in brackets) is represented in column three, four, and five of SSN, F10.7, and CRI with RF respectively.
| Solar Cycle | Seasonal months | Solar activity indices | ||
|---|---|---|---|---|
| SSN | F10.7 | CRI | ||
| 20 | JF(original) | 0.43 (0.16) | 0.51 (0.09)* | -0.50 (0.10)* |
| 2 pt | 0.61 (0.04)* | 0.69 (0.02)* | -0.76 (0.01)* | |
| 4 pt | 0.83 (0.001)* | 0.83 (0.001)* | -0.83 (0.002)* | |
| 6 pt | 0.85 (0.001)* | 0.89 (0.0001)* | -0.83 (0.001)* | |
| JJAS(original) | 0.43 (0.16) | 0.34 (0.28) | -0.21 (0.51) | |
| 2 pt | 0.24 (0.46) | 0.17 (0.59) | -0.23 (0.47) | |
| 4 pt | 0.39 (0.20) | 0.41 (0.19) | -0.51 (0.09) | |
| 6 pt | 0.19 (0.54) | 0.34 (0.29) | -0.35 (0.27) | |
| 21 | JF(original) | -0.66 (0.04)* | -0.57 (0.09)* | 0.38 (0.28) |
| 2 pt | -0.54 (0.11) | -0.51 (0.13) | 0.57 (0.09)* | |
| 4 pt | -0.75 (0.02)* | -0.71 (0.03)* | 0.30 (0.41) | |
| 6 pt | -0.87 (0.003)* | -0.76 (0.02)* | 0.15 (0.68) | |
| JJAS(original) | 0.56 (0.09)* | 0.68 (0.03)* | -0.39 (0.26) | |
| 2 pt | 0.76 (0.01)* | 0.83 (0.006)* | -0.83 (0.006)* | |
| 4 pt | 0.82 (0.007)* | 0.87 (0.003)* | -0.88 (0.002)* | |
| 6 pt | 0.95 (0)* | 0.93 (0.0001)* | -0.66 (0.04)* | |
| 22 | JF(original) | 0.06 (0.86) | 0.08 (0.3) | -0.09 (0.81) |
| 2 pt | 0.2 (0.43) | 0.26 (0.47) | -0.31 (0.39) | |
| 4 pt | -0.07 (0.86) | -0.11 (0.76) | -0.15 (0.68) | |
| 6 pt | 0.16 (0.65) | 0.13 (0.73) | 0.05 (0.89) | |
| JJAS(original) | -0.08 (0.84) | -0.30 (0.47) | 0.06 (0.86) | |
| 2 pt | -0.22 (0.53) | -0.30 (0.41) | 0.09 (0.81) | |
| 4 pt | -0.25 (0.49) | -0.38 (0.28) | 0.23 (0.51) | |
| 6 pt | -0.37 (0.29) | -0.50 (0.14) | 0.27 (0.45) | |
| 23 | JF(original) | 0.44 (0.15) | 0.47 (0.13) | -0.30 (0.34) |
| 2 pt | 0.65 (0.03)* | 0.65 (0.03)* | -0.56 (0.06)* | |
| 4 pt | 0.81 (0.002)* | 0.82 (0.002)* | -0.54 (0.07)* | |
| 6 pt | 0.83 (0.001)* | 0.78 (0.004)* | -0.68 (0.02)* | |
| JJAS(original) | -0.56 (0.06)* | -0.51 (0.09)* | 0.67 (0.02)* | |
| 2 pt | -0.50 (0.09)* | -0.44 (0.15) | 0.79 (0.004)* | |
| 4 pt | -0.48 (0.12) | -0.42 (0.17) | 0.76 (0.006)* | |
| 6 pt | -0.42 (0.17) | -0.36 (0.26) | 0.69 (0.001)* | |
| 24 | JF(original) | -0.02 (0.97) | 0.14 (0.70) | 0.03 (0.94) |
| 2 pt | 0.16 (0.65) | 0.34 (0.33) | -0.22 (0.54) | |
| 4 pt | 0.27 (0.44) | 0.47 (0.18) | -0.25 (0.49) | |
| 6 pt | -0.33 (0.35) | -0.07 (0.83) | 0.21 (0.56) | |
| JJAS(original) | 0.16 (0.65) | 0.10 (0.78) | -0.001 (1) | |
| 2 pt | 0.15 (0.68) | 0.13 (0.73) | -0.07 (0.86) | |
| 4 pt | 0.44 (0.20) | 0.45 (0.19) | -0.36 (0.31) | |
| 6 pt | 0.42 (0.23) | 0.34 (0.33) | -0.18 (0.63) | |
Note. * indicates higher than 0.1 significance level.
3.1 Relationship between Sunspot number and Rainfall
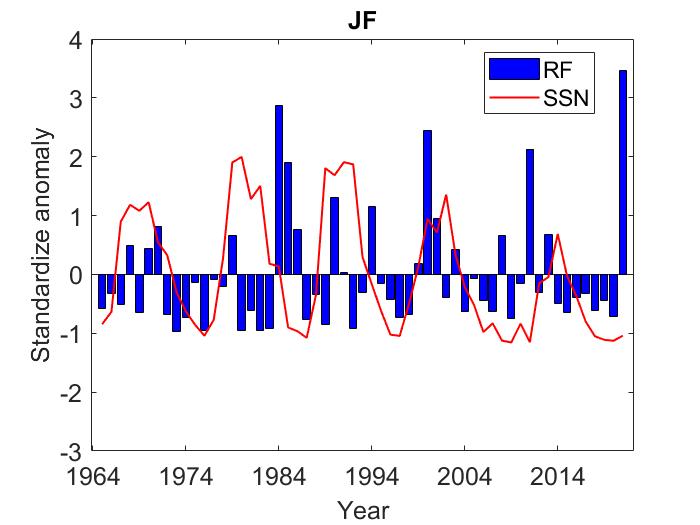

As the dataset was collected from different locations, standardization of data was done. Standardized anomaly was calculated by subtracting the mean and dividing by its standard deviation, for both seasons. The variation in standardized anomaly represents a deviation from the mean state. The anomaly is positive when the data is increasing and negative when decreasing. For easy comparison between the data, the variation in solar indices was represented as a line graph and the rainfall as a bar graph, with each bar representing a year. Figure 5 represents the time series of standardized values of sunspot number (SSN) and rainfall (RF) during the JF and JJAS seasons. Solar cycles 20-24 were covered in this study. To study the response of rainfall over Kerala to the sunspot number, the Spearman rank-order correlation coefficients between SSN and RF were calculated. First, the entire 57 years were considered and the correlation coefficients were found to be low, i.e., 0.03 and 0.002 during the JF and the JJAS seasons respectively. Solar cycle-wise correlation coefficients were then determined and the results are given in Table 1. The rainfall over Kerala was noted to be correlated with sunspot number, with varying significance, irrespective of signs.
For the JF season, significant correlations, irrespective of signs, were observed during Solar cycles 20, 21, and 23. The correlation coefficients were noted to be negative only during Solar cycle 21, positive during Solar cycles 20 and 23, and changed signs on smoothing RF values during Solar cycle 22 and 24. It was seen that the significance of the correlation coefficients improved on smoothing the rainfall RF values by two, four, and six-point moving averages. Among the five solar cycles considered, Solar cycles 22 and 24 showed weak correlation. For the JJAS season, Solar Cycle 21 showed the highest correlation between SSN and RF values with significance for original, two, four, and six-point moving average values. The correlation coefficients were positive during Solar cycles 20, 21, and 24 and negative during Solar cycles 22 and 23. Comparing both seasons, the JF season revealed a better association of sunspot number with the rainfall over Kerala.
3.2 Relationship between F10.7 Index and Rainfall
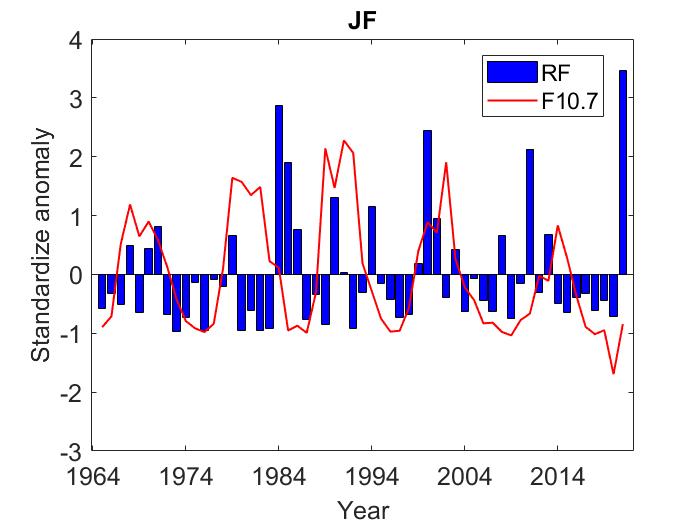

Figure 6 shows the time series of standardized values of the F10.7 Index (F10.7) and rainfall (RF) during the JF and JJAS seasons. Here also correlation coefficient was computed to be 0.09 and -0.03 during the JF and the JJAS seasons respectively, considering the entire period of study. Correlation coefficients corresponding to Solar cycles 20-24 were worked out and the results are given in Table 1. Similar to SSN results, the rainfall values were observed to be correlated with F10.7 Index with varying significance, regardless of the signs. During the JF season, Solar cycles 20, 21, and 23 showed a high correlation with significance. The correlation appeared to improve in smoothing the rainfall values. In the case of the JJAS season, Solar cycle 21 revealed a high significant correlation, compared to other cycles. It can be concluded that rainfall in Kerala is related to solar activity during the JF season, since the F10.7 Index showed a high correlation during three solar cycles during this season, as compared to the JJAS season.
3.3 Relationship between Cosmic ray intensity and Rainfall
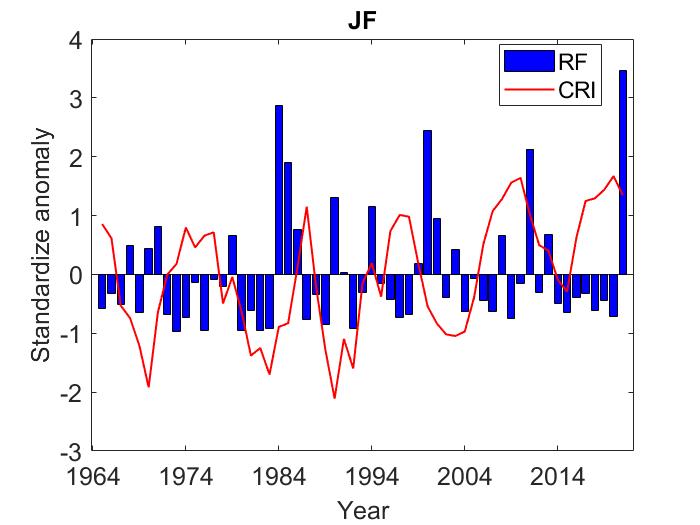

Figure 7 shows the time series of standardized values of cosmic ray intensity (CRI) and rainfall (RF) during the JF and the JJAS seasons. During the JF season, it was observed that during the decreasing phase of CRI in the first solar cycle starting from 1965, the rainfall anomaly is negative. In the next cycle, starting from 1977, again the rainfall anomaly is observed to be negative during the decreasing phase of CRI. Out of the five decreasing phases observed, the first three rainfall anomalies were negative, and the remaining two were positive. In the case of the JJAS season, the rainfall anomalies alternate during each decreasing phase of CRI. During the first cycle, rainfall anomaly is negative and during the next cycle, it is observed to be positive, and so on. Chaudhuri et al. [2015] reported results showing that the decreasing phase of GCR is an important phase to identify rainfall variability.
Correlation coefficients computed between CRI and RF values considering the entire period were found to be -0.08 and 0.10 during the JF and the JJAS seasons respectively. Correlation coefficients were determined for each solar cycle and the results are given in Table 1. Compared to sunspot number and F10.7 Index, cosmic ray intensity showed correlation results that were often opposite in sign. Solar cycles 20 and 23 showed a significant negative correlation between CRI and RF during the JF season, whose significance improved in smoothing the rainfall data. Solar cycles 21 and 23 revealed a significant correlation during the JJAS season, for smoothed values of rainfall.
Out of the five solar cycles considered, Solar Cycle 21 (1977-1986) was the strongest, and Solar Cycle 24 (2009-2018) was the weakest, in terms of SSN. It was noted that when the solar activity was maximum, a high correlation with significance was observed in the JF season. A weak correlation between sunspot number and rainfall was found during periods of low solar activity, i.e., during Solar Cycle 24. Solar cycles 20, 21, and 23 showed a good association between SSN and RF, and after smoothing the data, the correlation improved. As for the JJAS season, Solar Cycle 21 showed a positive correlation, but this correlation decreased during Solar Cycle 24 when solar activity was lower. These results are consistent with the earlier results. Thomas & Abraham [2022b] analyzed the relationship between sunspot number and rainfall over Kerala during varying levels of solar activity using wavelet coherence and noted higher coherence during the high solar activity period than during low solar activity, during winter (JF) and monsoon (JJAS) seasons. On considering F10.7 Index and Cosmic ray intensity parameters, the results were similar and the correlation results were weaker than those of sunspot number. When comparing the two seasons, the JF season had a stronger solar influence on its rainfall than the JJAS season.
In India, several correlative studies have been conducted in an attempt to determine if solar influences affect rainfall there. Ananthakrishnan & Parthasarathy [1984] reported both positive and negative correlation coefficients while considering 306 stations in India. Hiremath & Mandi [2004] investigated the correlative effects of sunspot number on the seasonal and annual Indian monsoon rainfall and found that the pre-monsoon and monsoon rainfall showed significant positive correlations. Hiremath [2006] analyzed correlative effects of sunspot number over the Indian rainfall corresponding to each solar cycle and noted correlation irrespective of the signs, with a moderate to high significance. When solar activity was low, rainfall was higher than when solar activity was high. Bal & Bose [2010] reported the existence of weak positive and negative correlations during different seasons. Bankoti et al. [2011] conducted several statistical studies between the solar parameters (Sunspot number, solar active prominences, and H alpha solar flares) and All India homogeneous rainfall and noted that the correlation varied its sign with different seasons and also with different solar parameters. Chaudhuri et al. [2015] performed seasonal correlation and observed a possible association between cosmic rays and rainfall during the post-monsoon season. Several correlative studies were carried out in different states to find a possible sun-rainfall link, ie, in West Bengal [Chakraborty & Bondyopadhyay, 1986], Rajasthan [Jain & Tripathy, 1997b], Tamil Nadu [Selvaraj et al., 2009a, Selvaraj & Aditya, 2011, 2012a] and Kerala [Thomas & Abraham, 2022a].
3.4 Solar activity indices and extreme rainfall in Kerala
A study was conducted to examine the possible relationship between solar activity and extreme rainfall events in Kerala during the JF and JJAS seasons. For that, the years of excess rainfall and deficient rainfall were identified, as explained in Section 2.2 [Azad, 2011]. During the JF season, six excess rainfall events were visible during the years 1984, 1990, 1994, 2000, 2011, and 2021. This season was not marked by deficient rainfall. In the case of the JJAS season, both excess and deficient rainfall events were observable. Ten years of excess rainfall were recorded during the years 1968, 1975, 1981, 1991, 1992, 1994, 1997, 2007, 2013 and 2019. Similarly, five years of deficient rainfall were observed during the years 1976, 1987, 2002, 2012, and 2016.
A study of the relative timing of solar activity and extreme rainfall was conducted using curves of different solar activity features, corresponding to different seasons. Figure 8, 9 and 10 represent the extreme rainfall events with SSN, F10.7, and CRI respectively. The black circles denote excess rainfall years and the red circle denotes deficient rainfall years. The present study covers five complete solar cycles (Solar cycles 20-24). Tables 2, 4 and 6 list the extreme rainfall events during the JF season, and Tables 3, 5 and 7 lists the extreme rainfall events during the JJAS season. The first column represents the years of extreme of each solar activity feature (denoted as ) and second column, the excess rainfall years, and the third column, the deficient rainfall years. Values given in brackets indicate variation concerning solar extremes.
3.4.1 Relation of extreme rainfall years with Sunspot number
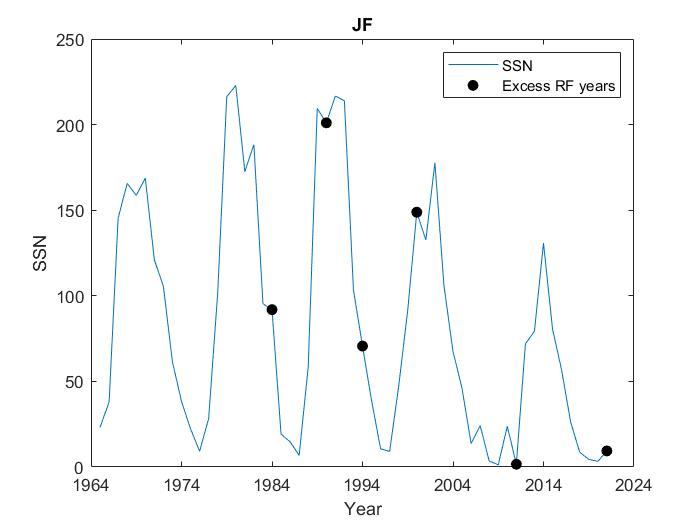
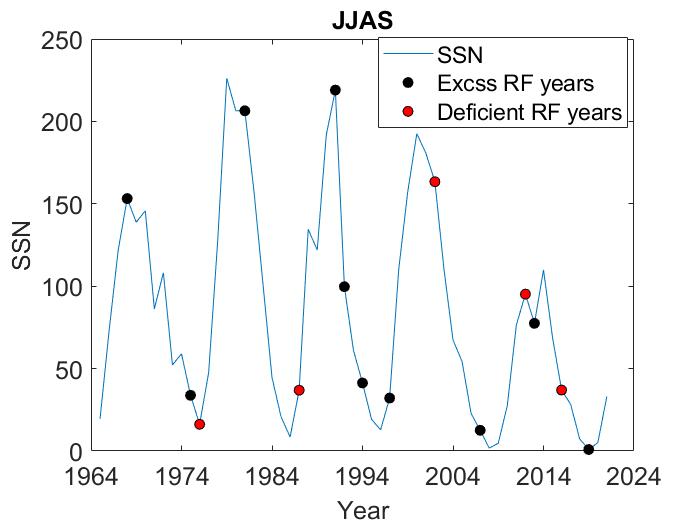
The sunspot number SSN was considered first. Figure 8 gives the extreme rainfall years during the JF and JJAS seasons plotted on the SSN curve. In this figure, slight variations in the maximum and minimum values of SSN during the JF and JJAS seasons were visible. During the JF season, the SSN showed a maximum during the years 1970, 1980, 1991, 2002, and 2014 and a minimum during the years 1965, 1976, 1987, 1997, 2009, and 2020. In the JJAS season, maximum SSNs occurred in 1968, 1979, 1991, 2000, and 2014, and minimum SSNs occurred in 1965, 1976, 1986, 1996, 2008, and 2019.
-
•
Excess rainfall studies
The six excess rainfall years observed during the JF season are listed in Table 2. Two of these occurred around 1 year and the other two around 2 years of extreme solar activity (solar maximum/solar minimum). The remaining two excess rainfall years were observed a bit further from the solar minimum, i.e., three years before the solar minimum. Ten excess rainfall years were identified during the JJAS season and given in Table 3. Three of them occurred at solar extremes, five around 1 years of solar extremes, and remaining two around 2 years of solar extremes. -
•
Deficient rainfall studies
During the JF season, there were no years with deficient rainfall. Five deficient rainfall events were noted during the JJAS season and are listed in Table 3. One occurred at the extreme of the solar cycle, another one a year later, and the remaining three occurred around 2 years of solar extreme.
| Years of extreme SSN (y) | Excess rainfall years |
|---|---|
| 1965 (min) | |
| 1970 (max) | |
| 1976 (min) | |
| 1980 (max) | |
| 1987 (min) | 1984 (y-3) |
| 1991 (max) | 1990 (y-1) |
| 1997 (min) | 1994 (y-3) |
| 2002 (max) | 2000 (y-2) |
| 2009 (min) | 2011 (y+2) |
| 2014 (max) | |
| 2020 (min) | 2021 (y+1) |
| Years of extreme SSN (y) | Excess rainfall years | Deficient rainfall years |
|---|---|---|
| 1965 (min) | ||
| 1968 (max) | 1968 (y) | |
| 1976 (min) | 1975 (y-1) | 1976 (y) |
| 1979 (max) | 1981 (y+2) | |
| 1986 (min) | 1987 (y+1) | |
| 1991 (max) | 1991 (y), 1992 (y+1) | |
| 1996 (min) | 1994 (y-2), 1997 (y+1) | |
| 2000 (max) | 2002 (y+2) | |
| 2008 (min) | 2007 (y-1) | |
| 2014 (max) | 2013 (y-1) | 2012 (y-2), 2016 (y+2) |
| 2019 (min) | 2019 (y) |
3.4.2 Relation of extreme rainfall years with F10.7 Index
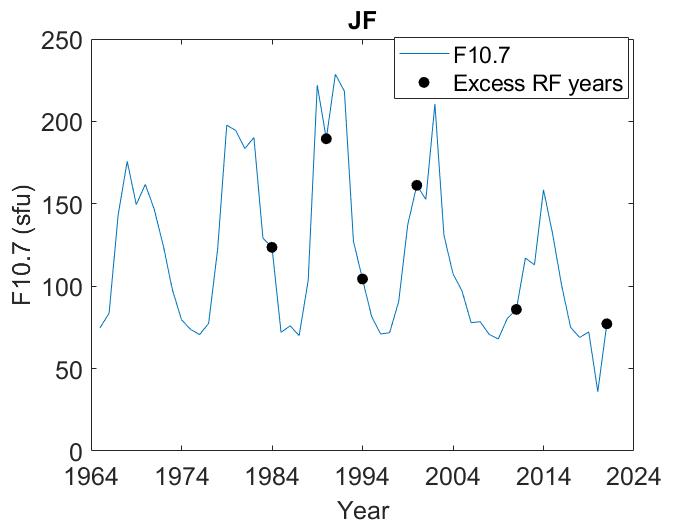
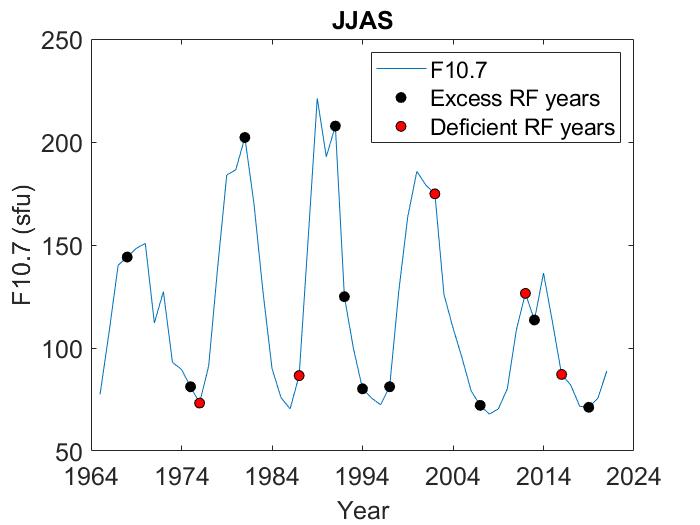
The extreme rainfall years were then analyzed in terms of the F10.7 Index. Figure 9 shows the extreme rainfall years during the JF and JJAS seasons plotted on the F10.7 curve. The two seasons show different maximum and minimum values for each solar cycle. During the JF season, F10.7 showed peak values in 1968, 1979, 1991, 2002, and 2014 and trough values in 1965, 1976, 1987, 1996, 2009, and 2020. In the JJAS season, F10.7 revealed maximum values in 1970, 1981, 1989, 2000, and 2014 and minimum values in 1965, 1976, 1986, 1996, 2008, and 2019.
-
•
Excess rainfall studies
During the JF season, six years of excess rainfall were noticed and are listed in Table 4. It was noted that four out of these occurred around solar minimum and the remaining two around solar maximum. The two years of excess rainfall were around 1 years of solar extreme and the three were around 2 years of solar extreme. Details of the excess rainfall events during the JJAS season are listed in Table 5. Out of the ten years of excess rainfall, two occurred at the solar extreme, four of them at around 1 years of solar extreme and the three around 2 years of solar extreme. One of them was visible a bit further from the solar extreme, i.e.,3 years after the solar maximum. -
•
Deficient rainfall studies
During the JJAS season, five years of deficient rainfall was observed and details are given in Table 5. One of them occurred at solar extreme, i.e., at solar minimum. The remaining one is at a year after solar extreme, i.e., solar minimum, and the other two are around 2 years of solar extreme, i.e., solar maximum.
| Years of extreme F10.7 (y) | Excess rainfall years |
|---|---|
| 1965 (min) | |
| 1968 (max) | |
| 1976 (min) | |
| 1979 (max) | |
| 1987 (min) | 1984 (y-3) |
| 1991 (max) | 1990 (y-1) |
| 1996 (min) | 1994 (y-2) |
| 2002 (max) | 2000 (y-2) |
| 2009 (min) | 2011 (y+2) |
| 2014 (max) | |
| 2020 (min) | 2021 (y+1) |
| Years of extreme F10.7 (y) | Excess rainfall years | Deficient rainfall years |
|---|---|---|
| 1965 (min) | ||
| 1970 (max) | 1968 (y-2) | |
| 1976 (min) | 1975 (y-1) | 1976 (y) |
| 1981 (max) | 1981 (y) | |
| 1986 (min) | 1987 (y+1) | |
| 1989 (max) | 1991 (y+2), 1992 (y+3) | |
| 1996 (min) | 1994 (y-2), 1997 (y+1) | |
| 2000 (max) | 2002 (y+2) | |
| 2008 (min) | 2007 (y-1) | |
| 2014 (max) | 2013 (y-1) | 2012 (y-2), 2016 (y+2) |
| 2019 (min) | 2019 (y) |
3.4.3 Relation of extreme rainfall years with Cosmic ray intensity
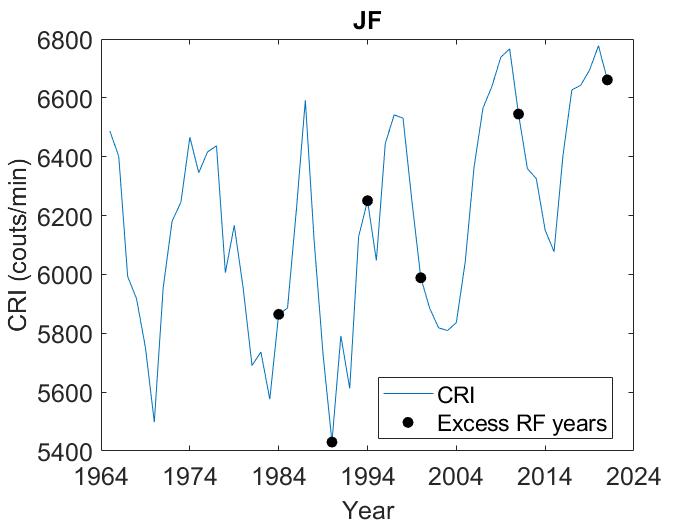
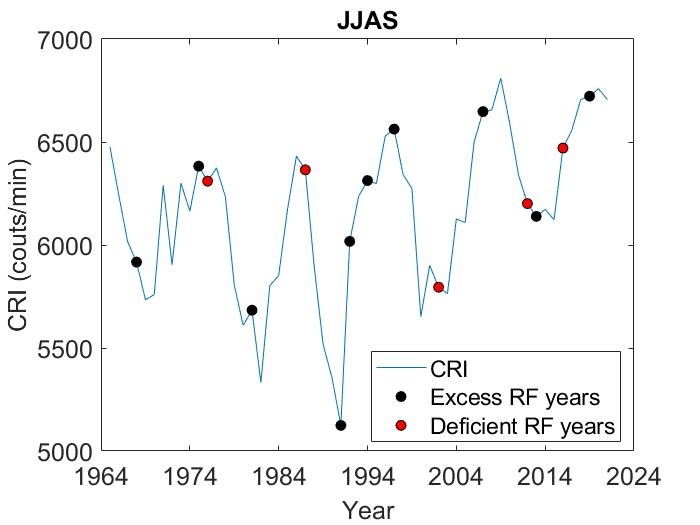
Lastly, the relationship of extreme rainfall years with CRI was studied. Figure 10 depicts the extreme rainfall years during the JF and JJAS seasons plotted on CRI curves. During the JF season, CRI displayed minimum values during the years 1970, 1983, 1990, 2003, and 2015, and maximum values during the years 1965, 1974, 1987, 1997, 2010, and 2020. In the JJAS season, CRI showed minimum values in 1969, 1982, 1991, 2000, and 2015 and maximum values in 1965, 1975, 1986, 1997, 2009, and 2020.
-
•
Excess rainfall studies
A list of the extreme rainfall years during the JF and JJAS seasons is given in Tables 6 and 7 respectively. Out of the six years of excess rainfall during the JF season, one was observed at solar extreme, three at around 1 years of solar extreme, and the rest further away around 3 years of solar extreme. During the JJAS season, three years of excess rainfall occurred at the solar extreme, four at around 1 years of solar extreme, and the rest at around 2 years of solar extreme. -
•
Deficient rainfall studies
Five years of deficient rainfall was observed in the JJAS season, given in Table 7. Out of them, three were observed at around 1 years of solar extreme, one a year after solar extreme, i.e., solar minimum, and one three years after solar extreme, i.e., solar minimum.
| Years of extreme CRI (y) | Excess rainfall years |
|---|---|
| 1965 (max) | |
| 1970 (min) | |
| 1974 (max) | |
| 1983 (min) | 1984 (y+1) |
| 1987 (max) | |
| 1990 (min) | 1990 (y) |
| 1997 (max) | 1994 (y-3) |
| 2003 (min) | 2000 (y-3) |
| 2010 (max) | 2011 (y+1) |
| 2015 (min) | |
| 2020 (max) | 2021 (y+1) |
| Years of extreme CRI (y) | Excess rainfall years | Deficient rainfall years |
|---|---|---|
| 1965 (max) | ||
| 1969 (min) | 1968 (y-1) | |
| 1975 (max) | 1975 (y) | 1976 (y+1) |
| 1982 (min) | 1981 (y-1) | |
| 1986 (max) | 1987 (y+1) | |
| 1991 (min) | 1991 (y), 1992 (y+1) | |
| 1997 (max) | 1994 (y-3), 1997 (y) | |
| 2000 (min) | 2002 (y+2) | |
| 2009 (max) | 2007 (y-2) | 2012 (y+3) |
| 2015 (min) | 2013 (y-2) | 2016 (y+1) |
| 2020 (max) | 2019 (y-1) |
When looking at the results related to sunspot number, F10.7 Index, and cosmic ray intensity, we could conclude that Kerala experienced extreme rainfall, mostly when solar activity was at its extreme, i.e. when solar maximum or minimum occurred or within 2 years of solar extremes. It is therefore possible to predict extreme rainfall events in Kerala by understanding the extreme variability of solar activity. As the rainfall deficiency/excess was observed almost equally around both extremes, it was impossible to determine if the extreme events were more prevalent during solar maximum or minimum.
According to the SSN and F10.7 analyses, excessive rainfall was more prevalent during solar minimum during the JF season and solar maximum during the JJAS season. The deficient rainfall events were noted more around solar maximum according to the SSN and F10.7 results.
The results obtained are in agreement with earlier studies carried out in India. Bhalme & Mooley [1981] reported that Flood Area Index over India was associated with the double sunspot cycle. During alternate solar cycles, Ananthakrishnan & Parthasarathy [1984] observed significantly more excess rainfall years during the ascending phase. Jain & Tripathy [1997b] considered Udaipur subtropical region in Rajasthan to check any possible relation between solar activity and its rainfall and noted that the periodicity of floods and droughts are well correlated with sunspot main periods and/or quasi-periods. Bhattacharyya & Narasimha [2005] revealed that high rainfall is linked with high solar activity and low rainfall with low solar activity. Azad [2011] while studying the relation of extreme Indian monsoon rainfall over sub-divisions from west central and peninsular India with sunspots, reported that the maxima of even sunspot cycles coincided with excess rainfall (with +1 year error) and the minima of odd sunspot cycles coincided with deficit rainfall (with 2 year error).
Several studies have reported how solar activity affects extreme rainfall events around the world. In the United States, it was observed that the drought cycle is related to the double (Hale) sunspot cycle [Mitchell et al., 1979, Cook et al., 1997]. Vaquero [2004] evaluated the number of floods recorded for the Tagus river basin, Central Spain, and it was noted that the probability of floods increased during the episodes of high solar activity. A study on the levels of Lake Victoria, East Africa revealed the influence of solar activity on the levels through rainfall. The rainfall maxima had a lagged relationship with the sunspot maxima by one year, leading to the lake level maxima [Stager et al., 2007]. Sunspot number showed a direct correlation with the flood/drought of the Second Songhua river basin, China, and flood years appeared in Solar Maximum Year, years after Solar Maximum Year, and Solar Minimum Year [Hong-yan et al., 2015]. Studies relating the response of extreme precipitation to solar activity in typical regions of the Loess Plateau, in Yan’an, China observed that the maximum precipitation occurred mainly during solar maximum and was correlated [Li et al., 2017]. Yu et al. [2019] also reported that the occurrences of droughts and floods in the Southern Chinese Loess Plateau were synchronous with solar activities, at least on decadal timescales.
There are instances of opposing results, as well, being reported. Wirth et al. [2013] found that flood frequency in the European Alps increased during cool periods, which coincided with low solar activity. In studies relating to River Ammer floods in Germany, Rimbu et al. [2021] observed the frequency of flood years is relatively high with the solar activity is low and vice versa. Li et al. [2023] investigated the time-lagged correlations between solar activity and summer precipitation in the mid-lower reaches of the Yangtze River, China and it was observed that the sunspot number has a negative correlation with precipitation, with a time lag of 11 months.
The solar influence on rainfall has been a matter of concern for long and many possible links have been discussed in different works [Li et al., 2023]. The presence of similar periods in the time series of rainfall and the solar activity implied a possible relation between them [Nitka & Burnecki, 2019, Heredia et al., 2019]. Sea surface temperature can be influenced by the total solar irradiance (TSI), which alters atmospheric circulation and modulates rainfall [Soon et al., 1996]. Stratospheric ozone absorbs ultraviolet radiation from the sun, causing a temperature gradient. This, in turn, affects Brewer-Dobson circulation and further alters the lower atmosphere through interaction between troposphere and stratosphere [Baldwin & Dunkerton, 2005].
4 Conclusions
We have evaluated the possible impact of solar activity on extreme rainfall events, over a period of 57 years, in Kerala, India. Different solar indices, i.e., Sunspot number, F10.7 Index, and cosmic ray intensity were used, and their variation with rainfall was studied. Correlation studies were performed for each solar cycle starting with Solar Cycle 20. It was observed that the rainfall in Kerala is correlated with sunspot activity, with varying significance. Among the three solar activity indices, SSN, F10.7, and CRI, the SSN showed the strongest correlation with rainfall. A significant correlation exists between rainfall and solar activity during both the winter and monsoon seasons of Solar Cycle 21. In comparison to the monsoon season, the winter season revealed stronger solar influences on its rainfall. The years when rainfall in Kerala was excess or deficient were identified, and its connection with the different solar indices was studied. Most of the years with excess or deficient rainfall have been observed to coincide with solar extremes, such as solar maximum or solar minimum (within 2 years). It is possible to predict extreme rainfall events in Kerala based on the coincidence and reduce their disastrous impacts.
Acknowledgements
First author acknowledges the financial assistance from the University Grants Commission (UGC), India, under Savitribai Jyotirao Phule Fellowship for Single Girl Child (SJSGC) (F. No. 82-7/2022(SA-III) dated 07/02/2023). Second author acknowledges the financial assistance from Department of Science and Technology (DST), Ministry of Science and Technology, India under INSPIRE Fellowship (Award Letter No. IF180235 dated 08/02/2019).
References
- Agnihotri & Dutta [2003] Agnihotri, R., & Dutta, K. 2003, Curr. Sci., 85, 459
- Agnihotri et al. [2002] Agnihotri, R., Dutta, K., Bhushan, R., & Somayajulu, B. 2002, Earth Planet. Sci. Lett., 198, 521
- Agnihotri et al. [2011] Agnihotri, R., Dutta, K., & Soon, W. 2011, J. Atmos. Sol.-Terr. Phys., 73, 1980
- Ananthakrishnan & Parthasarathy [1984] Ananthakrishnan, R., & Parthasarathy, B. 1984, J. Climatol., 4, 149
- Azad [2011] Azad, S. 2011, Adv. Sci. Lett., 4, 159
- Azad et al. [2010] Azad, S., Vignesh, T. S., & Narasimha, R. 2010, Int. J. Climatol., 30, 2289
- Badruddin & Aslam [2015] Badruddin, & Aslam, O. P. 2015, J. Atmos. Sol.-Terr. Phys., 122, 86
- Bal & Bose [2010] Bal, S., & Bose, M. 2010, J. Earth Syst. Sci., 119, 201
- Baldwin & Dunkerton [2005] Baldwin, M. P., & Dunkerton, T. J. 2005, J. Atmos. Sol. Terr. Phys., 67, 71
- Bankoti et al. [2011] Bankoti, N. S., Joshi, N. C., Pande, S., Pande, B., & Pandey, K. 2011, Quat. Int, 229, 8
- Bazilevskaya et al. [2014] Bazilevskaya, G., Broomhall, A. M., Elsworth, Y., & Nakariakov, V. M. 2014, Space Sci. Rev., 186, 359
- Bazilevskaya et al. [2000] Bazilevskaya, G. A., Krainev, M. B., Makhmutov, V. S., et al. 2000, Sol. Phys., 197, 157
- Bhalme & Mooley [1981] Bhalme, H., & Mooley, D. 1981, J. Appl. Meteorol.(1962-1982), 1041
- Bhalme et al. [1981] Bhalme, H., Reddy, R., Mooley, D., & Murty, B. V. R. 1981, Proc. Indian Acad, Sci. (Earth Planet. Sci.), 90, 245
- Bhattacharyya & Narasimha [2005] Bhattacharyya, S., & Narasimha, R. 2005, Geophysical Research Letters, 32, 1
- Bhattacharyya & Narasimha [2007] Bhattacharyya, S., & Narasimha, R. 2007, J. Geophys. Res. Atmos., 112, 1
- Bollasina et al. [2011] Bollasina, M. A., Ming, Y., & Ramaswamy, V. 2011, Science, 334, 502
- Chakraborty & Bandyopadhaya [1989] Chakraborty, P., & Bandyopadhaya, R. 1989, Mausam, 40
- Chakraborty & Bondyopadhyay [1986] Chakraborty, P., & Bondyopadhyay, R. 1986, Mausam, 37, 251
- Chakraborty & Bondyopadhaya [1986] Chakraborty, P. K., & Bondyopadhaya, R. 1986, Mausam, 37, 251
- Chang et al. [2019] Chang, X., Wang, B., Yan, Y., Hao, Y., & Zhang, M. 2019, Clim. Dyn., 52, 5213
- Chaudhuri et al. [2015] Chaudhuri, S., Pal, J., & Guhathakurta, S. 2015, Adv. Space Res., 55, 1158
- Choudhary et al. [2018] Choudhary, A., Dimri, A. P., & Maharana, P. 2018, Theor. Appl. Climatol., 134, 283
- Chowdhury et al. [2016] Chowdhury, P., Gokhale, M. H., Singh, J., & Moon, Y. J. 2016, Astrophys. Space Sci., 361, 1
- Cook et al. [1997] Cook, E. R., Meko, D. M., & Stockton, C. W. 1997, J. Clim., 10, 1343
- Danilovic et al. [2005] Danilovic, S., Vince, I., Vitas, N., & Jovanovic, P. 2005, Serbian Astronomical Journal, 170, 79
- Dash et al. [2007] Dash, S. K., Jenamani, R. K., Kalsi, S. R., & Panda, S. K. 2007, Climatic Change, 85, 299
- Djurovic D. [1993] Djurovic D., P. P. 1993, Astronomy, 277, 669
- Doranalu Chandrashekar et al. [2017] Doranalu Chandrashekar, V., Shetty, A., Singh, B. B., & Sharma, S. 2017, Model. Earth Syst. Environ., 3, 1611
- Eddy [1977] Eddy, J. A. 1977, Climatic Change, 1, 173
- Gray et al. [2010] Gray, L. J., Beer, J., Geller, M., et al. 2010, Rev. Geophys., 48
- Grinsted et al. [2004a] Grinsted, A., Moore, J., & Jevrejeva, S. 2004a, Nonlinear Process. Geophys., 11, doi:10.5194/npg-11-561-2004
- Grinsted et al. [2004b] Grinsted, A., Moore, J. C., & Jevrejeva, S. 2004b, Nonlinear Processes in Geophysics, 11, 561
- Gupta et al. [2005] Gupta, A. K., Das, M., & Anderson, D. M. 2005, Geophys. Res. Lett., 32, 1
- Gupta [1957] Gupta, D. P. K. 1957, Weather, 12, 322
- Gupta et al. [2006] Gupta, M., Mishra, V. K., & Mishra, A. P. 2006, Indian J. Radio Space Phys, 35, 387
- Haigh [2003] Haigh, J. D. 2003, Philos. Trans. Royal Soc. A, 361, 95
- Haigh [2007] Haigh, J. D. 2007, Living Rev. Sol. Phys., 4
- Hathaway [2015] Hathaway, D. H. 2015, Living Rev. Sol. Phys., 12, 4
- Heredia et al. [2019] Heredia, T., Bazzano, F. M., Cionco, R. G., et al. 2019, J. Atmos. Sol.-Terr. Phys, 193, 105094
- Hiremath [2006] Hiremath, K. M. 2006, J. Astrophys. Astr., 27, 367
- Hiremath & Mandi [2004] Hiremath, K. M., & Mandi, P. I. 2004, New Astron., 9, 651
- Hiremath et al. [2015] Hiremath, K. M., Manjunath, H., & Soon, W. 2015, New Astron., 35, 8
- Hong-yan et al. [2015] Hong-yan, L., Li-jun, X., & Wang, X. 2015, J. Water Clim. Chang., 6, 578
- Howe et al. [2000] Howe, R., Christensen-Dalsgaard, J., Hill, F., et al. 2000, Science, 287, 2456
- Hunter [1877] Hunter, W. W. 1877, Nature, 16, 14
- Jagannathan & Bhalme [1973] Jagannathan, P., & Bhalme, H. 1973, Mon. Weather Rev., 101, 691
- Jagannathan et al. [1978] Jagannathan, P., Bhalme, H. N., & Rakhehcha, P. R. 1978, Proc. Indian Natn. Sci. Acad., 44, 364
- Jagannathan & Parthasarathy [1973] Jagannathan, P., & Parthasarathy, B. 1973, Mon. Weather Rev., 101, 371
- Jain & Tripathy [1997a] Jain, R., & Tripathy, S. C. 1997a, Mausam, 48, 405
- Jain & Tripathy [1997b] Jain, R., & Tripathy, S. C. 1997b, Mausam, 48, 405
- Jevrejeva et al. [2003] Jevrejeva, S., Moore, J. C., & Grinsted, A. 2003, J. Geophys. Res. Atmos., 108, 1
- John [2018] John, S. 2018, Engineering and Mathematical Topics in Rainfall
- Kane [2005] Kane, R. P. 2005, Sol. Phys., 227, 155
- Kodera [2004] Kodera, K. 2004, Geophys. Res. Lett, 31, 1
- Koteswaram & Alvi [1969] Koteswaram, P., & Alvi, S. 1969, Curr. Sci., 38, 229
- Kothawale & Rajeevan [2017] Kothawale, D. R., & Rajeevan, M. 2017, Indian Institute of Tropical Meteorology (IITM) Earth System Science Organization, Ministry of Earth Sciences, 02, 1
- Krishnakumar et al. [2009] Krishnakumar, K. N., Prasada Rao, G. S., & Gopakumar, C. S. 2009, Atmos. Environ, 43, 1940
- Krivova & Solanki [2002] Krivova, N. A., & Solanki, S. K. 2002, Astron. Astrophys., 394, 701
- Labitzke [1987] Labitzke, K. 1987, Geophys. Res. Lett., 14, 535
- Labitzke [2005] Labitzke, K. 2005, J. Atmos. Sol.-Terr. Phys., 67, 45
- Lassen & Friis-Christensen [1995] Lassen, K., & Friis-Christensen, E. 1995, J. Atmos. Terr. Phys., 57, 835
- Lau & Kim [2006] Lau, K. M., & Kim, K. M. 2006, Geophys. Res. Lett., 33, 1
- Laurenz et al. [2019] Laurenz, L., Lüdecke, H. J., & Lüning, S. 2019, J. Atmos. Sol.-Terr. Phys., 185, 29
- Li et al. [2023] Li, H., Wang, Y., & Wang, C. 2023, Front. Earth Sci., 10, 1
- Li et al. [2017] Li, H. J., Gao, J. E., Zhang, H. C., Zhang, Y. X., & Zhang, Y. Y. 2017, Advances in Meteorology, 2017
- Lihua et al. [2007] Lihua, M., Yanben, H., & Zhiqiang, Y. 2007, Appl. Geophys., 4, 231
- Loon & Labitzke [1988] Loon, H. V., & Labitzke, K. 1988, J. Clim., 1, 905
- Malik & Brönnimann [2018] Malik, A., & Brönnimann, S. 2018, Clim. Dyn., 50, 4347
- Mauas et al. [2011] Mauas, P. J., Buccino, A. P., & Flamenco, E. 2011, J. Atmos. Sol.-Terr. Phys., 73, 377
- Meehl et al. [2009] Meehl, G., Arblaster, J., Matthes, K., Sassi, F., & van Loon, H. 2009, Science, 325, 1114
- Meehl et al. [2008] Meehl, G. A., Arblaster, J. M., Branstator, G., & van Loon, H. 2008, J. Clim., 21, 2883
- Mehta & Lau [1997a] Mehta, V. M., & Lau, K.-M. 1997a, Geophysical Research Letters, 24, 159
- Mehta & Lau [1997b] Mehta, V. M., & Lau, K. M. 1997b, Geophys. Res. Lett., 24, 159
- Mitchell et al. [1979] Mitchell, J. M., Stockton, C. W., & Meko, D. M. 1979, in Solar-Terrestrial Influences on Weather and Climate, ed. B. M. McCormac & T. A. Seliga (Dordrecht: Springer Netherlands), 125–143
- Naidu et al. [2009] Naidu, C. V., Durgalakshmi, K., Krishna, K. M., et al. 2009, J. Geophys. Res. Atmos., 114, 1
- Naidu et al. [1999] Naidu, C. V., Srinivasa Rao, B. R., & Bhaskar Rao, D. V. 1999, Meteorol. Appl., 6, 395
- Nandy et al. [2021] Nandy, D., Martens, C. H., Obridko, V., Dash, S., & Georgieva, K. 2021, Prog. Earth Planet Sci., 8, 40
- Narasimha & Bhattacharyya [2010] Narasimha, R., & Bhattacharyya, S. 2010, Appl. Comput. Harmon. Anal., 28, 285
- Nazari-Sharabian & Karakouzian [2020] Nazari-Sharabian, M., & Karakouzian, M. 2020, J. Multidisciplinary Scientific Journal, 3, 67
- Neff et al. [2001] Neff, U., Burns, S. J., Mangini, A., et al. 2001, Nature, 411, 290
- Nitka & Burnecki [2019] Nitka, W., & Burnecki, K. 2019, Physica A: Statistical Mechanics and its Applications, 527, 121387
- Pai et al. [2014] Pai, D. S., Sridhar, L., Rajeevan, M., et al. 2014, Mausam, 65, 1
- Parthasarathy [1984] Parthasarathy, B. 1984, Proc. Indian Acad. Sci. (Earth Planet Sci.), 93, 371
- Parthasarathy & Dhar [1974] Parthasarathy, B., & Dhar, O. N. 1974, Q. J. R. Meteorol. Soc., 100, 245
- Parthasarathy & Mooley [1978] Parthasarathy, B., & Mooley, D. 1978, Mon. Weather Rev., 106, 771
- Pérez-Peraza et al. [2012] Pérez-Peraza, J., Velasco, V., Libin, I. Y., & Yudakhin, K. F. 2012, Adv. Astron., 2012, doi:10.1155/2012/691408
- R Core Team [2013] R Core Team. 2013, R: A Language and Environment for Statistical Computing, R Foundation for Statistical Computing, Vienna, Austria
- Rai & Dimri [2020] Rai, P., & Dimri, A. P. 2020, Meteorol. Appl., 27, doi:10.1002/met.1823
- Rampelotto et al. [2012] Rampelotto, P. H., Rigozo, N. R., da Rosa, M. B., et al. 2012, J. Atmos. Sol.-Terr. Phys., 77, 152
- Rathinasamy et al. [2019] Rathinasamy, M., Agarwal, A., Sivakumar, B., Marwan, N., & Kurths, J. 2019, Stoch. Environ. Res. Risk Assess., 33, 2053
- Reddy, R S, Ramana Murty [1978] Reddy, R S, Ramana Murty, B. V. 1978, Indian J. Radio Space Phys., 7, 215
- Reid [1999] Reid, G. C. 1999, Nature, 401, 764
- Reidmiller et al. [2018] Reidmiller, D., Avery, C., Easterling, D., et al. 2018, Volume II: Impacts, Risks, and Adaptation in the United States, 72
- Rimbu et al. [2021] Rimbu, N., Lohmann, G., Ionita, M., Czymzik, M., & Brauer, A. 2021, Int J Climatol ., 41, E644
- Sakurai [1981] Sakurai, K. 1981, Sol. Phys., 74, 35
- Salby & Callaghan [2000] Salby, M., & Callaghan, P. 2000, J. Clim., 13, 2652
- Schwabe [1844] Schwabe, H. 1844, Astronomische Nachrichten, 21, 233
- Selvaraj & Aditya [2011] Selvaraj, R. S., & Aditya, R. 2011, Univers. J. Environ. Res. Technol., 1
- Selvaraj & Aditya [2012a] Selvaraj, R. S., & Aditya, R. 2012a, J. Ind. Geophys. Union, 16, 107
- Selvaraj et al. [2009a] Selvaraj, R. S., Muthuchami, A., & Nancharaiah, M. 2009a, Indian J. Phys., 83, 1251
- Selvaraj et al. [2013] Selvaraj, R. S., Umarani, R., Mahalakshmi, N., & May, M. A. 2013, J. Ind. Geophys. Union, 17, 59
- Solanki [2002] Solanki, S. K. 2002, Astron. Geophys., 43, 5.09
- Song et al. [2019] Song, Y., Li, Z., Gu, Y., et al. 2019, J. Meteorol. Res., 33, 885
- Song et al. [2022] Song, Y., Li, Z., Gu, Y., & Xiao, Z. 2022, Front. Earth Sci., 9
- Soon et al. [1996] Soon, W. H., Posmentier, E. S., & Baliunas, S. L. 1996, Astrophys. J., 472, 891
- Souza Echer et al. [2008] Souza Echer, M. P., Echer, E., Nordemann, D. J., Rigozo, N. R., & Prestes, A. 2008, Climatic Change, 87, 489
- Stager et al. [2007] Stager, J. C., Ruzmaikin, A., Conway, D., Verburg, P., & Mason, P. J. 2007, J. Geophys. Res. Atmos., 112, 1
- Svensmark [1998] Svensmark, H. 1998, Phys. Rev. Lett., 81, 5027
- Svensmark [2007] Svensmark, H. 2007, Astron. Geophys., 48, 18
- Svensmark, H., Friis-Christensen [1997] Svensmark, H., Friis-Christensen, E. 1997, J. Atmos. Sol.-Terr. Phys., 59, 1225
- Sýkora & Rybák [2010] Sýkora, J., & Rybák, J. 2010, Sol. Phys., 261, 321
- Tapping & Charrois [1994] Tapping, K., & Charrois, D. 1994, Sol. Phys., 150, 305
- Tapping [2013] Tapping, K. F. 2013, Space Weather, 11, 394
- Thamban et al. [2007] Thamban, M., Kawahata, H., & Rao, V. P. 2007, J Oceanogr., 63, 1009
- Thomas & Abraham [2022a] Thomas, E., & Abraham, N. P. 2022a, India (January 26, 2022), doi:dx.doi.org/10.2139/ssrn.4102224
- Thomas & Abraham [2022b] Thomas, E., & Abraham, N. P. 2022b, J. Atmos. Sol.-Terr. Phys, 240, 105943
- Thomas et al. [2023] Thomas, E., Joseph, I., & Abraham, N. P. 2023, New Astron, 98, doi:10.1016/j.newast.2022.101944
- Tiwari & Kumar [2018] Tiwari, B., & Kumar, M. 2018, International Annals of Science, 5, 47
- Tiwari et al. [2021] Tiwari, B., Xu, J., Adhikari, B., & Chapagain, N. 2021, BIBECHANA, 18, 105
- Tiwari et al. [2005] Tiwari, M., Ramesh, R., Somayajulu, B. L. K., Jull, A. J. T., & Burr, G. S. 2005, Curr. Sci., 89, 1583
- Torrence & Compo [1998] Torrence, C., & Compo, G. P. 1998, Bull. Amer. Meteor., 79, 61
- Tsiropoula [2003] Tsiropoula, G. 2003, J. Atmos. Sol.-Terr. Phys., 65, 469
- Usoskin [2017] Usoskin, I. G. 2017, Living Rev. Solar Phys, 14, 3
- Valdés-Galicia & Velasco [2008] Valdés-Galicia, J. F., & Velasco, V. M. 2008, Adv. Space Res., 41, 297
- Van Loon et al. [2007] Van Loon, H., Meehl, G., & Shea, D. 2007, J. Geophys. Res., 112, doi:10.1029/2006JD007378
- Vaquero [2004] Vaquero, J. M. 2004, Climatic Change, 66, 23
- Vecchio & Carbone [2009] Vecchio, A., & Carbone, V. 2009, Astron. Astrophys., 502, 981
- Vecchio et al. [2010] Vecchio, A., Laurenza, M., Carbone, V., & Storini, M. 2010, Astrophys. J. Lett., 709, L1
- Vijay & Varija [2022] Vijay, A., & Varija, K. 2022, Environ. Monit. Assess., 194, 0
- Vinoj et al. [2014] Vinoj, V., Rasch, P. J., Wang, H., et al. 2014, Nat. Geosci., 7, 308
- Warrier et al. [2017] Warrier, A. K., Sandeep, K., & Shankar, R. 2017, Geosci. Front., 8, 1349
- Wasko & Sharma [2009] Wasko, C., & Sharma, A. 2009, Geophys. Res. Lett., 36, doi:10.1029/2008GL036310
- Wirth et al. [2013] Wirth, S. B., Glur, L., Gilli, A., & Anselmetti, F. S. 2013, Quat. Sci. Rev., 80, 112
- Yadava & Ramesh [2007] Yadava, M. G., & Ramesh, R. 2007, New Astron., 12, 544
- Yu et al. [2019] Yu, X., Wang, Y., Yu, S., & Kang, Z. 2019, Glob Planet Change, 183, 103033
- Zaqarashvili et al. [2010] Zaqarashvili, T. V., Carbonell, M., Oliver, R., & Ballester, J. L. 2010, Astrophys. J. Lett., 724, 2
- Zhai [2017] Zhai, Q. 2017, New Astron., 51, 1339
- Zhao et al. [2004] Zhao, J., Han, Y.-B., & Li, Z.-A. 2004, Chin. J. Astron. and Astrophys., 4, 189