A second view on the X-ray polarization of NGC 4151 with IXPE
We report on the second observing program of the active galactic nucleus NGC 4151 with simultaneous Imaging X-ray Polarimetry Explorer (IXPE; 750 ks), NuSTAR ( 60 ks), XMM-Newton (75 ks), and NICER (65 ks) pointings. NGC 4151 is the first Type-1 radio-quiet Seyfert galaxy with constrained polarization properties for the X-ray corona. Despite the lower flux state in which the source is re-observed and the resulting higher contribution of the constant reflection component in the IXPE energy band, our results are in agreement with the first detection. From the polarimetric analysis, a polarization degree = 4.7 1.3 per cent and angle = 77° 8°east of north (68 per cent confidence level) are derived in the 2.0 – 8.0 keV energy range. Combining the two observations leads to polarization properties that are more constrained than those of the individual detections, showing = 4.5 0.9 per cent and = 81° 6°(with detection significance 4.6). The observed polarization angle aligns very well with the radio emission in this source, supporting, together with the significant polarization degree, a slab or wedge geometry for the X-ray corona. However, a switch in the polarization angle at low energies ( in the 2-3.5 keV bin) suggests the presence of another component. When it is included in the spectro-polarimetric fit, a high polarization degree disfavors an interpretation in terms of a leakage through the absorbers, rather pointing to scattering from some kind of mirror.
Key Words.:
polarization – X-rays: galaxies – X-rays: individuals: NGC 4151 – galaxies: active – galaxies: Seyfert1 Introduction
X-ray polarimetry has emerged as a powerful tool in unveiling the geometry of one of the innermost and most enigmatic regions of active galactic nuclei (AGN): the X-ray corona. According to the Unified Model of AGN, the corona is composed of hot (with a typical temperature of kT 10 – 100 keV, e.g., Fabian et al., 2015, 2017; Tortosa et al., 2018) and rarefied optically thin electron plasma situated in the innermost region of the accretion flow. This region up-scatters the UV photons emitted by the disk, producing the primary X-ray emission (Sunyaev & Titarchuk, 1980; Zdziarski et al., 2000). The polarization signal of the coronal emission is very sensitive to the geometry of the scattering material (e.g., Schnittman & Krolik, 2010; Tamborra et al., 2018; Zhang et al., 2019; Marinucci et al., 2022; Ursini et al., 2022; Gianolli et al., 2023; Ingram et al., 2023; Tagliacozzo et al., 2023). In the past, multiple studies on the physical properties of the X-ray corona (i.e., the optical depth and the electron temperature kTe, Shapiro et al., 1976) have been performed (e.g., Petrucci et al., 2001; Matt et al., 2015; Ricci et al., 2018; Tortosa et al., 2018; Kamraj et al., 2022; Kang & Wang, 2022; Serafinelli et al., 2024, and references therein). However, only with the launch of the Imaging X-ray Polarimeter Explorer (IXPE, Weisskopf et al., 2022) mission and with its synergy together with simultaneous observations of NuSTAR and XMM-Newton, new insights have been obtained on the geometry of this region in type-1 AGN (Gianolli et al., 2024; Marin et al., 2024).
NGC 4151 is one of the X-ray brightest Seyfert galaxies in the local Universe. Intensively studied, it shows different layers of absorption, from both neutral and ionized gas (e.g., Beuchert et al., 2017; Gianolli et al., 2023). Archival observations of the source reveal significant spectral variability in the range. Furthermore, the source shows transitions from optical type 1.5 during high-flux states, where the AGN can reach a flux level as high as 2.8 10-10 erg s-1 cm-2, to optical type 1.8 during low-flux states ( 8.7 10-11 erg s-1 cm-2; see Antonucci & Cohen, 1983; Shapovalova et al., 2012; Beuchert et al., 2017).
NGC 4151 is the first Type-1 radio-quiet AGN with constrained polarization properties for the X-ray corona. From the polarimetric analysis, a polarization degree (PD) of per cent (68 per cent confidence level) and a polarization angle (PA) of have been measured with a significance above 99.99 per cent (Gianolli et al., 2023, “G23” hereafter). Given that the primary X-ray emission was the dominant component in the IXPE energy band and the reflection, arising from the reprocessing of the primary continuum off surrounding material (such as the torus), contributed only up to 6 per cent, the observed PD and PA refer to the primary continuum. When taken into account in the spectro-polarimetric analysis, and setting the primary continuum and reflection PAs to differ by 90 degrees, a PD = 7.7 1.5 per cent and PA= 87° 6° for the X-ray primary emission are found. Numerical simulations in G23 show that, based on the observed X-ray polarization properties, a radially-extended slab geometry is preferred for the corona. Interestingly, a further component with different polarization properties may be the cause of the observed change in polarization properties in the 2-3.5 keV band (PD = 4.3 1.6 per cent and PA = 42° 11°). Due to its high variability in the X-ray band, NGC 4151 is an excellent candidate for studying potential changes in the observed polarization properties.
In the following, we present the spectral and spectro-polarimetric analyses of the simultaneous IXPE, NuSTAR, and XMM-Newton data and the results of the NICER monitoring. The structure of this paper is as follows. Sect. 2, we provide details on the observations and data reduction processes for IXPE, XMM-Newton, NuSTAR, and NICER. Sect. 3, we present the findings of the polarimetric, spectral, and spectro-polarimetric analyses. In Sect. 4 the results are discussed.
2 Observing campaign and data reduction
The second IXPE observation of NGC 4151 was performed during the 1st Cycle of the IXPE General Observer program111https://heasarc.gsfc.nasa.gov/docs/ixpe/proposals/ao1/c1_targets.html. Due to the long exposure time (750 ks), it has been divided into two segments: 23rd to 28th April and 15th to 26th May 2024. We used the level 2 event files, which are calibrated adopting a standard IXPE pipeline from the Science Operation Center (SOC)222https://heasarc.gsfc.nasa.gov/docs/ixpe/analysis/IXPE-SOC-DOC-009-UserGuide-Software.pdf. We apply the background rejection method following Di Marco et al. (2023)’s guidelines for faint sources. To extract the source (background) data in the three detector units (DUs), a 68″ circle (annulus with internal radius of 180″ and outer of 240″) was adopted. The source extraction radius was derived iteratively to maximize the signal-to-noise ratio in the 2.0 – 8.0 keV band, similar to the procedure described in Piconcelli et al. (2004). Any remaining background contribution is subtracted during the polarimetric analysis. Subsequently, to estimate the polarization properties, we employ two methods: (1) creating the polarization cube (PCUBE; using the ixpeobssim software version 31.0.1; Baldini et al., 2022), and (2) generating , , and spectra using xselect (from the heasoft package version 6.33.2; NASA Heasarc, 2014) considering the weighted analysis method with the parameters stokes=Neff (Di Marco et al., 2022). Both methods adopt the latest available calibration file, i.e. version 13 (20240101) in ixpeobssim and CALDB 20240125 for xselect. The Ancillary Response File (ARF) and Modulation Response File (MRF) for each detector unit are generated using the ixpecalcarf task and considering the same extraction radius used for the source region.
To constrain the physical properties of the X-ray corona and disentangle the contribution of each spectral component, we requested simultaneous NuSTAR and XMM-Newton observations. However, due to a NuSTAR star tracker blockage for the target and other time-constrained NuSTAR and XMM observations during the second window of the scheduled IXPE observation, both observations have been divided into two pointings.
XMM-Newton observed NGC 4151 on May 21st-22nd (“X1” hereafter) and on May 24th-25th (“X2” hereafter), 2024 for 14 ks and 25 ks (effective exposure times after filtering process) of exposure time using the EPIC pn (Strüder et al., 2001). For both observations, the source and background spectra were extracted following G23 extraction radii. A correction for effective area was applied using the SAS keyword, applyabsfluxcorr, specifically designed to improve consistency with simultaneous NuSTAR data.
The NuSTAR (Harrison et al., 2013) observations have been carried out from May 22nd to 23rd (“N1” hereafter) and from May 25th to 27th (“N2” hereafter), 2024, adopting both coaligned X-ray telescopes equipped with Focal Plane Module A (FPMA) and B (FPMB). The Nupipeline task was employed alongside the latest calibration files from the database (CALDB 20221229) to generate and calibrate cleaned event files. Extraction radii for source and background were set as those adopted by G23, i.e. 2 ′and 1.22 ′, respectively. The net exposure times for FPMA and FPMB during N1 resulted to be 25 and 24 ks, while for N2 are 34 and 33 ks. As found in the previous campaign, significant deviations from the pn spectrum are still present in the NuSTAR spectra below 4 keV. Hence, NuSTAR data will be considered only above 4 keV (see e.g., G23, ). We account for an energy shift of around 2000 km s-1 at the iron line using vashift to address lingering calibration issues, which have also been observed in the past (Gianolli et al., 2023; Ingram et al., 2023; Serafinelli et al., 2023).
Given that the coverage of XMM and NuSTAR observations is limited to the second IXPE observing window and due to the highly variable nature of NGC 4151, it is essential to track its absorption/flux state also during the first segment. Hence, we requested a daily monitoring of the source with the Neutron Star Interior Composition Explorer (NICER, Gendreau et al., 2012; Arzoumanian et al., 2014; Gendreau et al., 2016) from April 22 to April 30, 2024 for a total of 35 ks. NICER data were also collected between May 1st and 14th (other 30 ks), allowing us to check for any changes during the time-frame between each IXPE pointing.
The NICER unfiltered data events were reprocessed using the nicerl2 tool included in the HEASoft software package using the latest software and calibration files (27/02/2024). We applied the nicerl3-spect task to the clean event files to obtain the spectra. For the background we used the SCORPEON model, which includes contributions from many physically-motivated components. It takes into account sky-related components such as the cosmic X-ray background, local hot bubble and galactic halo, and also non X-ray background components such as cosmic rays, South Atlantic Anomaly, trapped electrons, precipitating electrons, and low energy storm-related electrons.
The extracted spectra have been binned following Kaastra & Bleeker (2016) method. All uncertainties are provided at a 68 per cent (1) c.l., unless otherwise specified, and upper/lower limits are reported at a 99 per cent (2.6) c.l. for one single parameter. Throughout our analysis, we consider a redshift of (Wolfinger et al., 2013), along with cosmological parameters = 70 km s-1 Mpc-1, = 0.73 and = 0.27.
3 Data analysis
3.1 IXPE polarimetric analysis
We report the results of the unweighted PCUBE analysis on the second IXPE observation of NGC 4151. For the two segments separately, we obtain in the 2–8 keV energy band (from the three combined DUs), after background subtraction, only an upper limit for the polarization degree (i.e., per cent) in the first, and a significant detection (with per cent and polarization angle ) in the second. Given the consistency of the PDs in the two segments, we proceed by summing them together, finding per cent and , with a detection significance at 99.84 per cent confidence level ( 3.2). In Table 1 (middle part), we show the and obtained in the 3 energy bands adopted in G23: 2.0 – 3.5, 3.5 – 5.0, and 5.0 – 8.0 keV. However, we found only for the last energy bin a significant detection (at 3.3) and marginal detections for the first and middle bins (at 2.6 and 1.2, respectively).
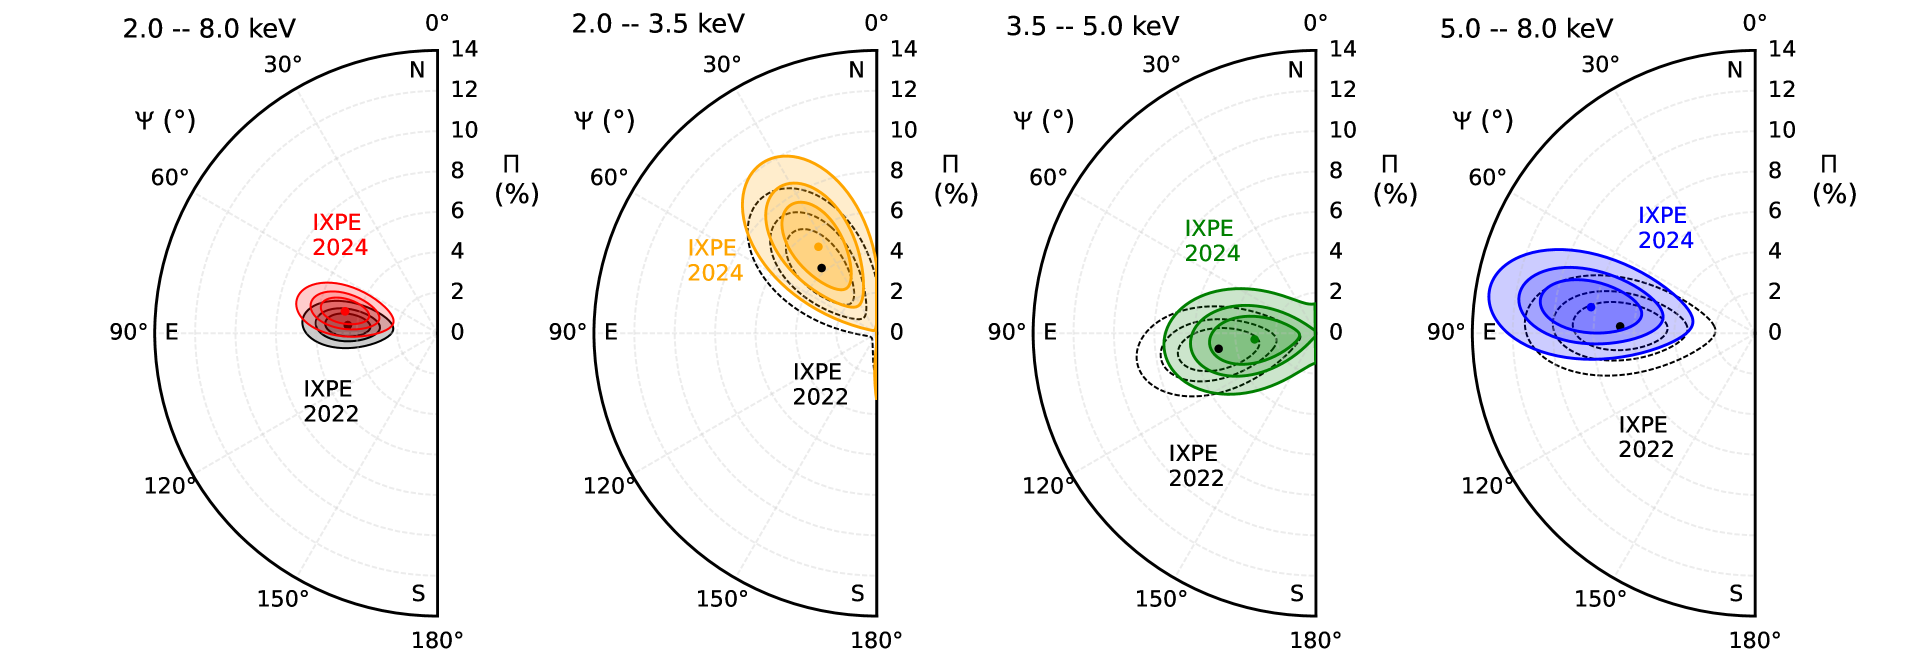
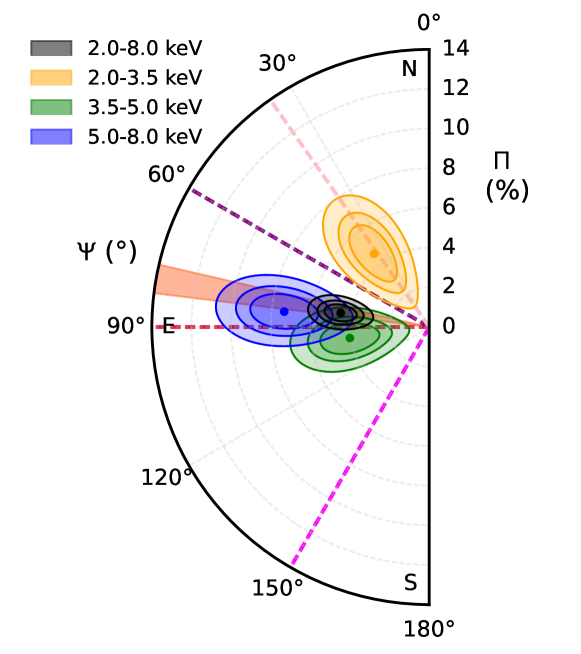
To compare the results of the second observation with those of the first, we have also re-extracted the PCUBE of the latter, adopting the new calibration files available in ixpeobssim. We report the derived polarization properties in Table 1, upper part. In Figure 1, left panel, we present the comparison between the polarization contours of the first and second detections in the full energy band of IXPE. Meanwhile, in the right panels of Figure 1, we show the polarization contours obtained for the three energy bins in the first and second observations. We observe that the polarization properties of the second observation (for both the 2.0 – 8.0 keV energy band and the individual bins) are always well consistent with those found during the first detection. Hence, we combined the PCUBE of both observations. In Fig. 2, we report the contours of the polarimetric properties obtained in the full energy band and for the three bins. We observe that, once the two observations are combined together, all PDs and PAs are more constrained than in the individual observations. Particularly, for the full energy band of IXPE we obtain per cent and (with detection significance 4.6). For the three energy bins, we present in Table 1 the polarization degrees, now significantly detected (at 3.5, 3.3, and 4.5, respectively) in each energy bin, and the polarization angles. In both the second and combined observations, the peculiar behavior detected by G23 in the 2.0 – 3.5 keV energy bin remains evident and a difference of between the PA in this bin and that derived for the full band is present. Meanwhile, a difference of is observed between the polarization angles of the 2.0–3.5 keV and 3.5–5.0 keV energy bins.
| Obs | Energy range | ||
|---|---|---|---|
| [keV] | [] | [deg] | |
| 1st | |||
| 2.0 – 8.0 | 4.6 1.2 | 85 8 | |
| 2.0 – 3.5 | 4.2 1.6 | 40 11 | |
| 3.5 – 5.0 | 4.9 1.4 | 99 8 | |
| 5.0 – 8.0 | 6.7 2.0 | 87 9 | |
| \cdashline1-4[2pt/5pt] 2nd | |||
| 2.0 – 8.0 | 4.7 1.3 | 77 8 | |
| 2.0 – 3.5 | 5.2 1.7 | 34 10 | |
| 3.5 – 5.0 | 3.1 1.5 | 96 14 | |
| 5.0 – 8.0 | 8.2 2.2 | 81 8 | |
| \cdashline1-4[2pt/5pt] Combined | |||
| 2.0 – 8.0 | 4.5 0.9 | 81 6 | |
| 2.0 – 3.5 | 4.6 1.1 | 37 7 | |
| 3.5 – 5.0 | 4.0 1.0 | 98 7 | |
| 5.0 – 8.0 | 7.2 1.4 | 84 6 |
3.2 Spectral Analysis: XMM-Newton, NuSTAR, and NICER
To perform the spectral analysis of NGC 4151, we use xspec version 12.13.0 (Arnaud, 1996), considering the 0.5 – 10.0 keV XMM-Newton and 4.0 – 79.0 keV NuSTAR spectra simultaneously. The source is detected in an average flux state, with 10-10 erg s-1 cm-2 for X1+N1 (X2+N2), lower than the first campaign ( 10-10 erg s-1 cm-2). We show in Fig. 3 the XMM and NuSTAR spectra of the first and second observational campaigns. The spectra appear consistent below 1 keV and exhibit a similar spectral shape at high energies. Most of the spectral variability is concentrated between 2.0 and 6.0 keV, suggesting variability in obscuration. Hence, given the complexity of modeling the X-ray spectrum of NGC 4151 (e.g., Weaver et al., 1994; Zdziarski et al., 1996; Yang et al., 2001; De Rosa et al., 2007; Kraemer et al., 2008; Lubiński et al., 2010; Gianolli et al., 2023), we adopt the same model used in G23: (tbabs)*(CLOUDY + zgauss + PC*PC*WA*(BORUS 1 + BORUS 2 + nthcomp)). tbabs models the Galactic absorption, a thermally Comptonized continuum (nthcomp; Zdziarski et al., 1996; Życki et al., 1999) represents the primary X-ray emission, and BORUS (Baloković et al., 2018, 2019) is used for modeling the reflection component. Following G23 approach, we separate the reflection component (i.e., the emission reprocessed by a torus) from the fluorescent lines by using specific BORUS tables. Soft X-ray emission is accounted for by incorporating a photoionized plasma emission component generated with CLOUDY (Ferland et al., 1998; Bianchi et al., 2010) and the residuals around the O vii emission line triplet are mitigated using a Gaussian line. The different layers of absorption (e.g., Keck et al., 2015; Gianolli et al., 2023) are modeled by two neutral partial-coverers (PC, zpcfabs), along with a warm absorber (WA, modeled with zxipcf and covering factor fixed to 1). The applied multiplicative constants (which accommodate cross-calibration uncertainties between FPM modules and EPIC pn, and marginal flux variability of the source as the observations are not strictly simultaneous) are of the order of 1.20.
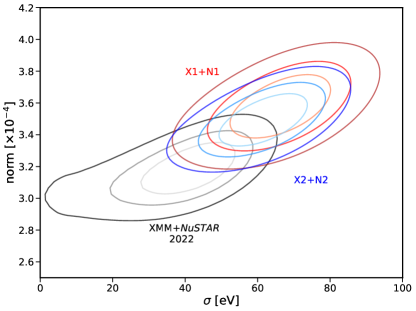
As a first step, we analyzed the Fe K emission line by focusing on the 5.0 – 10.0 keV energy band. By doing so, we aim at assessing the possible presence of a significant relativistic reflection component and variability of the line. As found by G23 for the first campaign, NGC 4151 does not show a clear relativistic component in the new data, differently from what found in some previous observations of the source (e.g., Yaqoob et al., 1995; Zoghbi et al., 2019, and references therein). The line can be modeled with a single Gaussian, only slightly resolved ( eV). We find no evidence of variability in line parameters (intensity and width) either between X1+N1 and X2+N2, or with respect to the first campaign (Fig. 4). Consequently, the equivalent width of the iron line anti-correlates with the flux of the source, being EW () eV in the X1+N1 (X2+N2) data, and EW eV in the 2022 data.
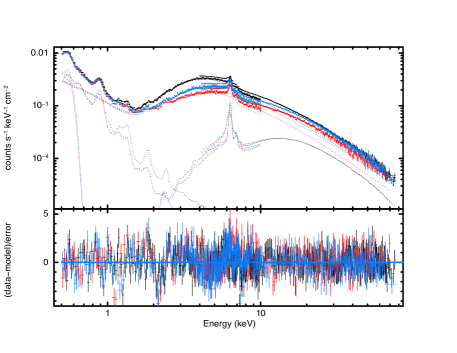
Subsequently, we consider the full broad-band X1+N1 and X2+N2 data, and we fit them together with the XMM+NuSTAR data from the 1st campaign to identify any variability in the spectral components. We assume that the reflection component did not change, as evidenced by the absence of variation in the Fe K emission line. Meanwhile, we allow the photon index and the normalization of the primary continuum to vary. Furthermore, all absorbers (both neutral and ionized) show a significant variation between X1+N1 and the 2022 campaign, with only the first neutral PC (column density and covering factor) differing between X1+N1 and X2+N2 (see Table 2). A small, but significant change is also observed for the parameters of the photoionized gas that models the soft X-ray emission, confirming a similar variability noted by Zoghbi et al. (2019). In the end, we obtain an acceptable best-fit with /d.o.f = 5878/5208. We show the best-fit parameters in Table 2 (those of the 2022 campaign are also reported), and the spectra with residuals in Fig. 3.
Whereas in G23 the reflection (reprocessed continuum and fluorescent lines) contribution was only about 6 per cent in the 2–8 keV energy band, we now find it to be 26 per cent for X1+N1 and 21 per cent for X2+N2. The contribution of the Fe K line is 8 (7) per cent in the 5.0 – 8.0 keV for the two new observations. We note that the observed trend, i.e. as flux increases (from X1+N1 to X2+N2 and up to the 2022 level) the contribution of the reflection is decreasing, is in agreement with our assumption on the constant reflection (which is justified via the iron line). Moreover, as also obtained in G23, the contribution of the photoionized emission in the 2–3.5 keV band is not significant and becomes so only at lower energies. On the other hand, the 2–3.5 keV band manifests an excess relative to the absorbed primary continuum, which has been interpreted in this model as the primary emission leakage through the partial coverers. Its contribution is around 15 (22) per cent in the X1+N1 (X2+N2) observation, becoming 7 (8) per cent for X1+N1 (X2+N2) in the 3.5 – 5.0 keV, and 2 (3) per cent for X1+N1 (X2+N2) in the 5.0 – 8.0 keV bin.
| Parameter | Value | Value | Value |
|---|---|---|---|
| 1st obs | X1+N1 | X2+N2 | |
| CLOUDY (Photoionized emitter) | |||
| 1.35 0.01 | 1.11 | ||
| / cm-2) | 21.63 0.02 | 21.54 | |
| PC 1 (Neutral absorber 1) | |||
| /cm-2) | 23.02 0.01 | 23.27 0.01 | 23.18 0.01 |
| C | 0.78 0.01 | 0.73 0.01 | 0.75 0.01 |
| PC 2 (Neutral absorber 2) | |||
| / cm-2) | 22.64 0.01 | 22.68 0.01 | |
| C | 0.95 0.01 | 0.93 0.01 | |
| WA (Warm absorber) | |||
| / cm-2) | 23.13 0.03 | 23.59 | |
| / erg cm s-1) | 4.12 0.02 | 4.31 0.03 | |
| BORUS 1/2 (Neutral reflector 1/2) | |||
| / cm-2) | 24.45 0.01 | 24.45 | |
| / | 0.62 0.01 | 0.62 | |
| norm | 0.09 0.01 | 0.09 | |
| nthcomp (Comptonized primary continuum) | |||
| 1.85 0.01 | 1.88 0.01 | 1.82 0.01 | |
| [keV] | 60 | 60 | |
| norm | 0.093 0.001 | 0.067 0.002 | 0.071 0.001 |
| /d.o.f. | 743/660 | 2556/2245 | 2576/2255 |
| F / [10-10 erg cm-2 s-1] | 1.680 0.003 | 1.025 0.004 | 1.277 0.004 |
| L / [1042 erg s-1] | 4.060 0.006 | 2.477 0.010 | 3.085 0.009 |
Notes.
∗: during X1+N1 and X2+N2 data fitting, we fix these values to those obtained in G23 best-fit (we report for the first observation the uncertainties obtained in G23, ).
: during data fitting, we fix the values of X2+N2 to those obtained for X1+N1, as they do not vary when left free.
Normalization in units of photons s-1 cm-2 keV-1.
The best-fit values are adopted in the spectro-polarimetric analysis.
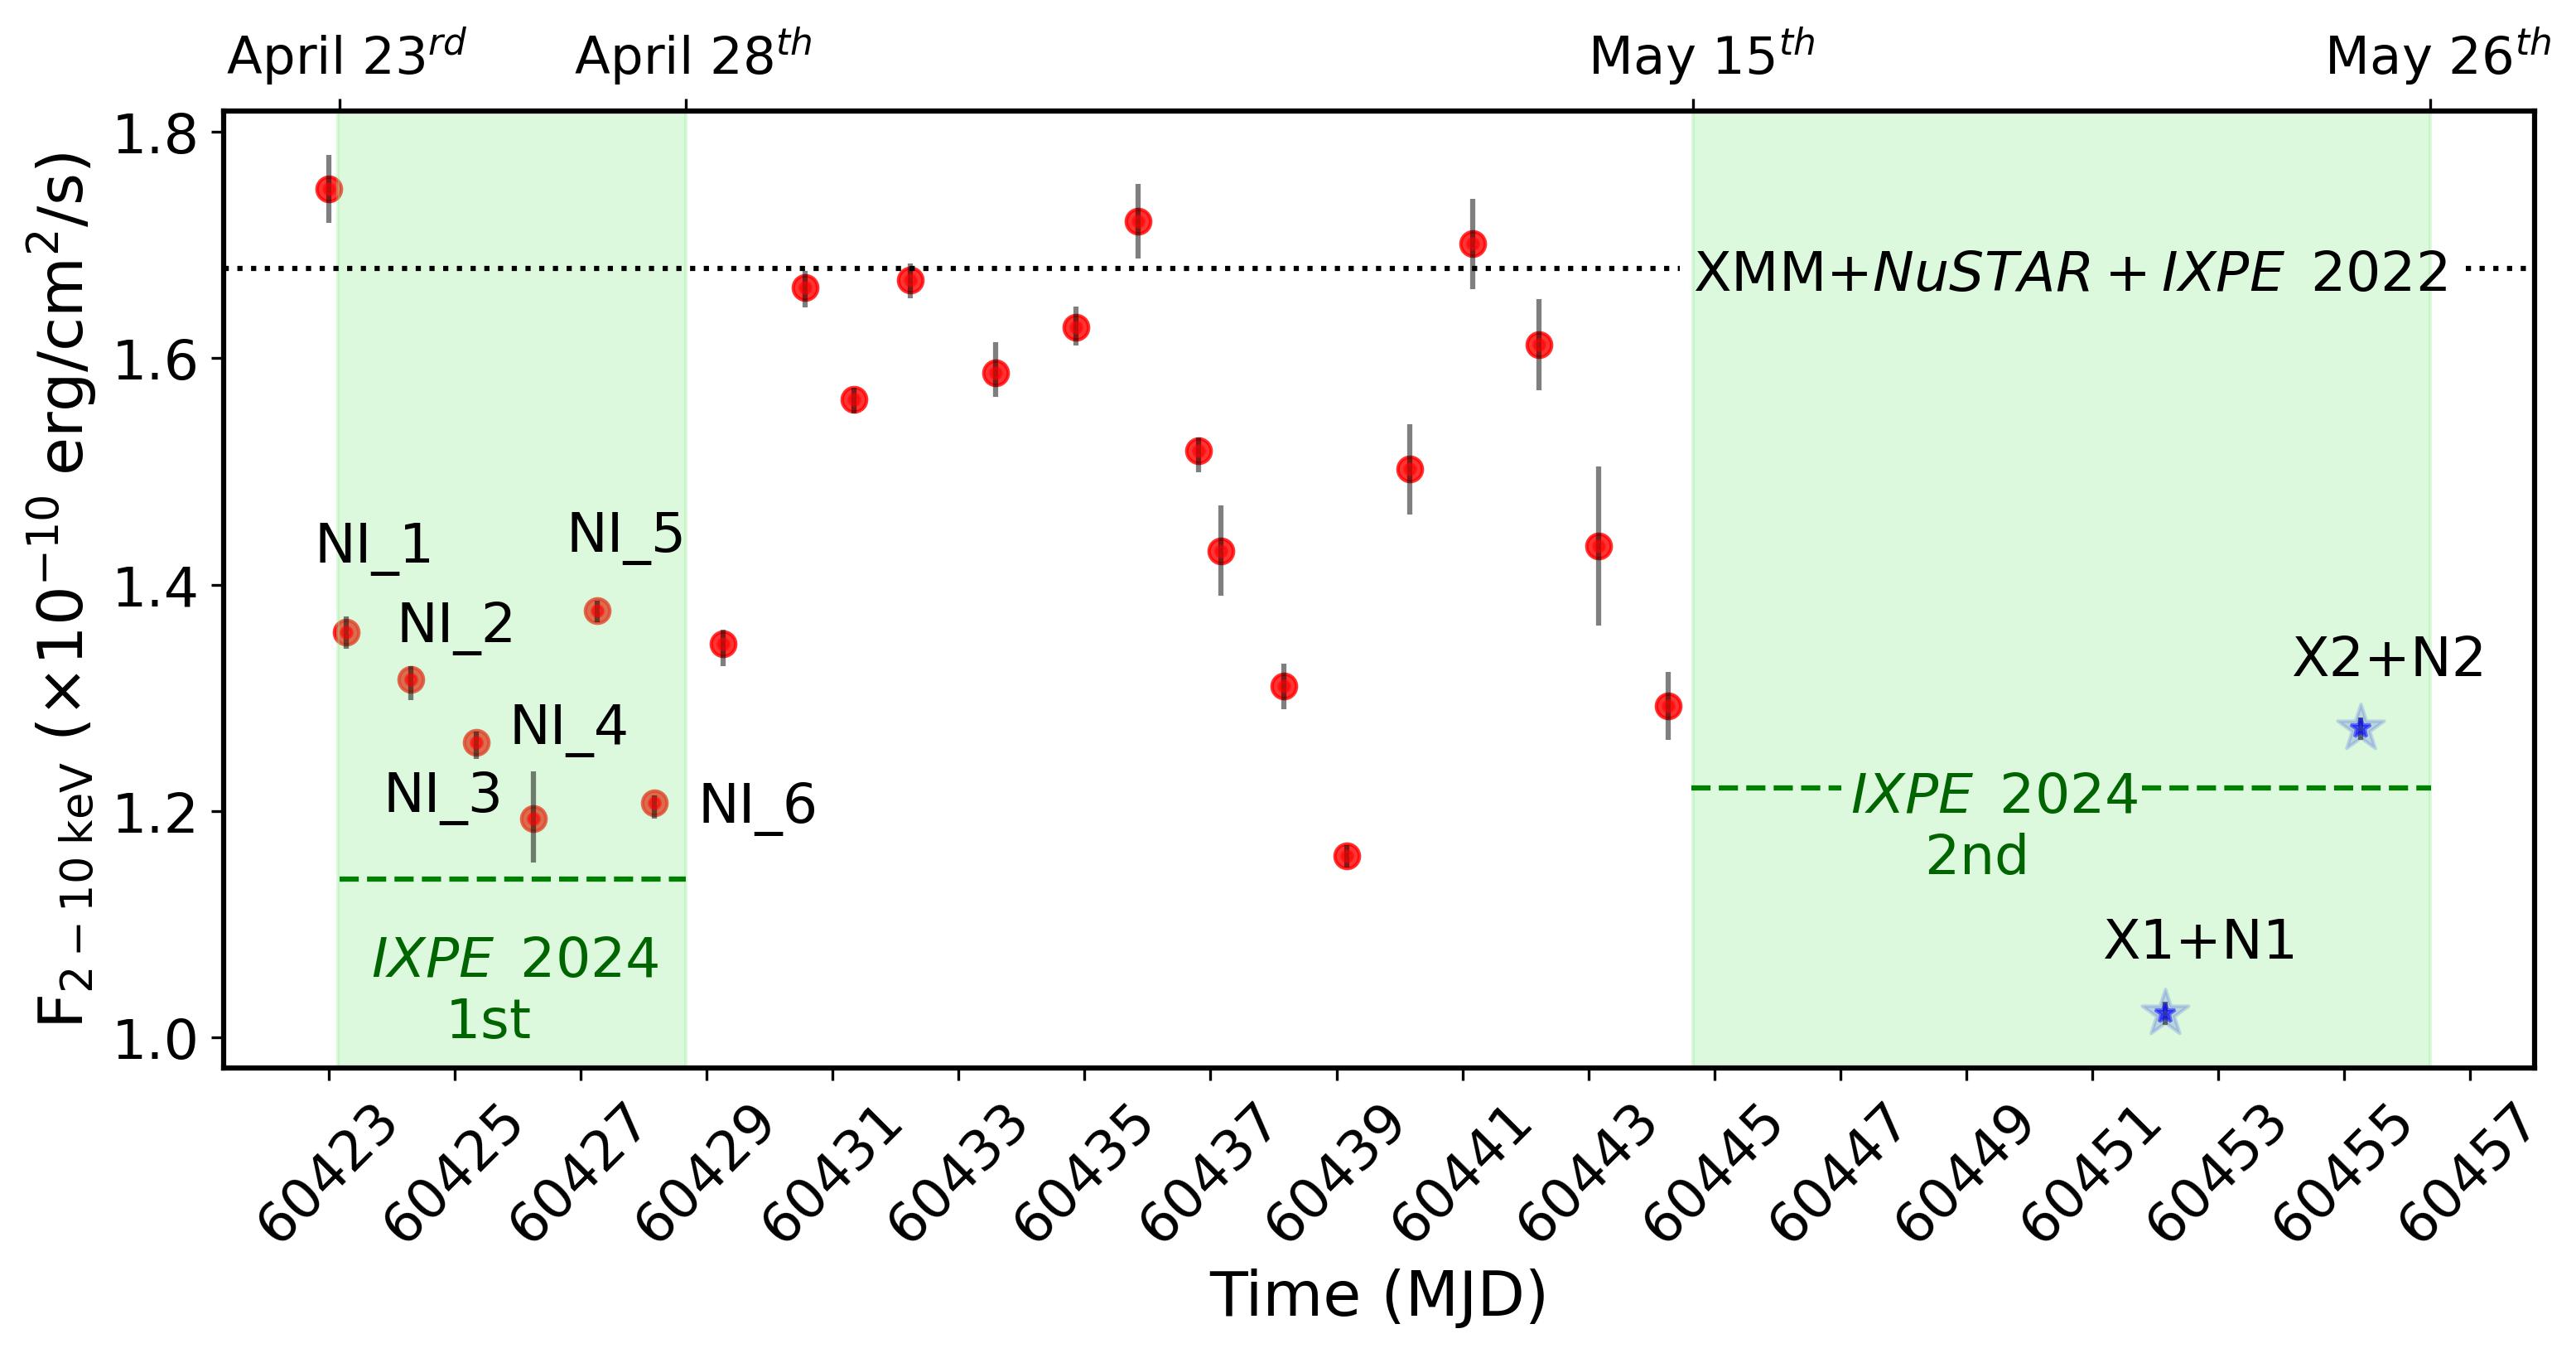
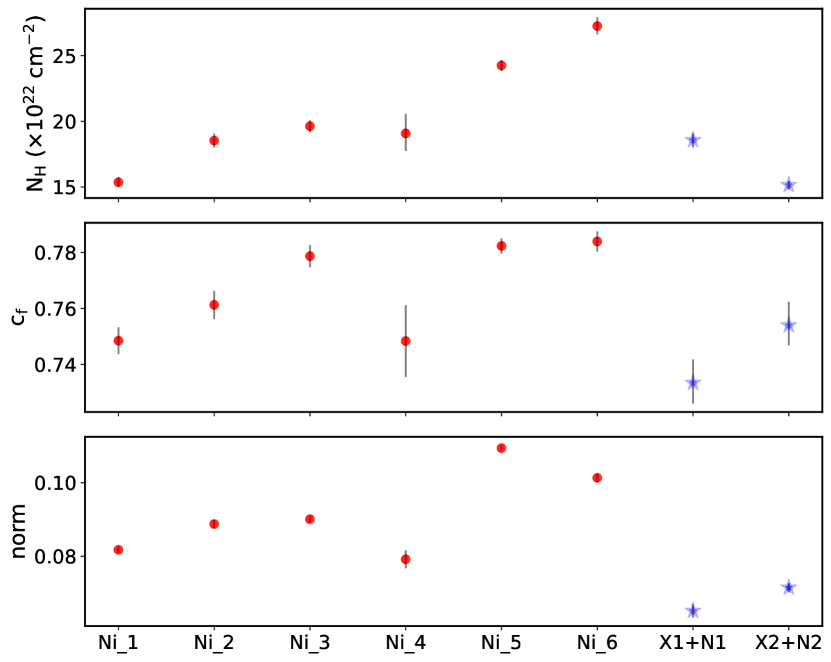
A total of 23 NICER observations were also performed continuously from the beginning of the first segment of IXPE until the beginning of the second. In Fig. 5, we report the variation of the 2.0 – 10.0 keV flux compared to the values observed during the past and new XMM+NuSTAR+IXPE campaigns. We note that the 6 observations strictly simultaneous to the first segment of the new IXPE observation (see light green band on the left of Fig. 5), display a flux similar to that measured during X2+N2. We thus fit the 6 simultaneous pointings to monitor possible changes in the absorbers and continuum. We note that, due to discrepancies between the NICER and XMM spectra below 1 keV, and because this energy band is not crucial for our purposes, we only consider data above this energy. A good fit (/d.o.f = 718/612) is obtained allowing the normalization of the primary emission and the first neutral PC (column density and covering factor) to vary for the different spectra. In Fig. 6, we report the variation observed for the three free parameters.
In conclusion, from the NICER analysis, we confirm the presence of neutral variable absorption along the line-of-sight on short ( 1day) timescales during the first and between each segment of the IXPE observation. The same variability, along with that of the X-ray photon index, is also evident when fitting XMM and NuSTAR data. This variability extends over long timescales. Indeed, the parameters of the continuum and absorbers show variation when compared to the data taken in 2022 (see Table 2). However, the overall adopted model appears to remain valid. Therefore, in the spectro-polarimetric analysis discussed in the next section, we will use this model for the two IXPE campaigns, allowing these parameters to vary.
3.3 Spectro-polarimetric analysis: XMM-Newton, NuSTAR and IXPE
The spectro-polarimetric analysis has been conducted following the methodology presented in G23: i) we fit the IXPE data (, and spectra of the three detectors, for both observations, see Fig. 7) by applying the XMM-Newton+NuSTAR best-fit (see Sec. 3.2). We include inter-calibration constant (which are free to vary and of the order of ) between each detector. Given the variability reported in Sect. 3.2, we leave to vary the primary continuum normalization and the parameters of the first neutral partial covering for the second observation (in comparison to those of the first observation that are set to the best-fit values derived in G23, ). Sect. 3.1. ii) polconst multiplicative models are added to derive the polarization of each individual component. PD and PA are set to 0 for the BORUS and CLOUDY component (see G23, ). We note that G23 spectro-polarimetric model considers a further spectral component with assigned polconst: the primary continuum leaking through the absorbers. By adopting the same configuration reported in the first paper (i.e., with the primary continuum and the reflection PAs forced to differ by 90°and PDs free to vary, while the PD and PA of the leaking emission are set to 0), we obtain a good fit (/ d.o.f = 1298/1222 for the 18 IXPE spectra) in which the polarization is attributed to the primary continuum, with per cent and . Only an upper limit is derived for the reflection component per cent (Model 1 in Table 3). As in G23, if the continuum and reflection PAs are set to be parallel (i.e., given a slab coronal geometry, the reflection is from the disk), the reflection component PD is unconstrained.

Despite the goodness of the above fit, an excess below 4 keV in the Q and U spectra is clearly visible (see Fig. 7, right panel). This excess drives the change in polarization angle in the 2 – 3.5 keV energy bin (see Sect. 3.1). Given the higher statistic from considering both observations, we attempt to simultaneously constrain the polarization properties of the leaking emission, along with those of the X-ray continuum and of the reflection. Starting from the above spectro-polarimetric fit, we now allow PA and PD of the leakage to vary. Since we are unable to constrain also the polarimetric properties of the reflection component, we assume it is either unpolarized or has PD = 20%, with a PA parallel or perpendicular to that of the primary continuum (see Table 3, Model 2 and Model 3). The statistical quality of the fit improves (down to / d.o.f = 1272/1221), with PD in the range for both the primary continuum and the soft component in all cases, and polarization angles of and , respectively.
| Component | PD | PA | /d.o.f |
| [%] | [] | ||
| Model 1 | |||
| Primary continuum | 7.1 1.2 | 84 5 | |
| Soft emission | 0 fix | – | 1298/1222 |
| Neutral reflection | 17 | PA | |
| Model 2 | |||
| Primary continuum | 15.6 2.3 | 99 4 | |
| Soft emission | 13.1 2.5 | 20 6 | 1272/1221 |
| Neutral reflection | 0 fix | – | |
| Model 3A | |||
| Primary continuum | 19.4 2.3 | 100 4 | |
| Soft emission | 14.4 2.5 | 20 5 | 1276/1221 |
| Neutral reflection | 20 fix | PA | |
| \cdashline1-4[2pt/5pt] | Model 3B | ||
| Primary continuum | 11.8 2.5 | 98 4 | |
| Soft emission | 11.8 2.5 | 20 6 | 1274/1221 |
| Neutral reflection | 20 fix | PAp | |
| Model 4 | |||
| Primary continuum | 7.0 0.9 | 93 4 | |
| Soft emission | 8.2 2.2 | 22 6 | 1287/1224 |
| Neutral reflection | 0 fix | – | |
Notes. PAp is the polarization angle of the primary continuum.
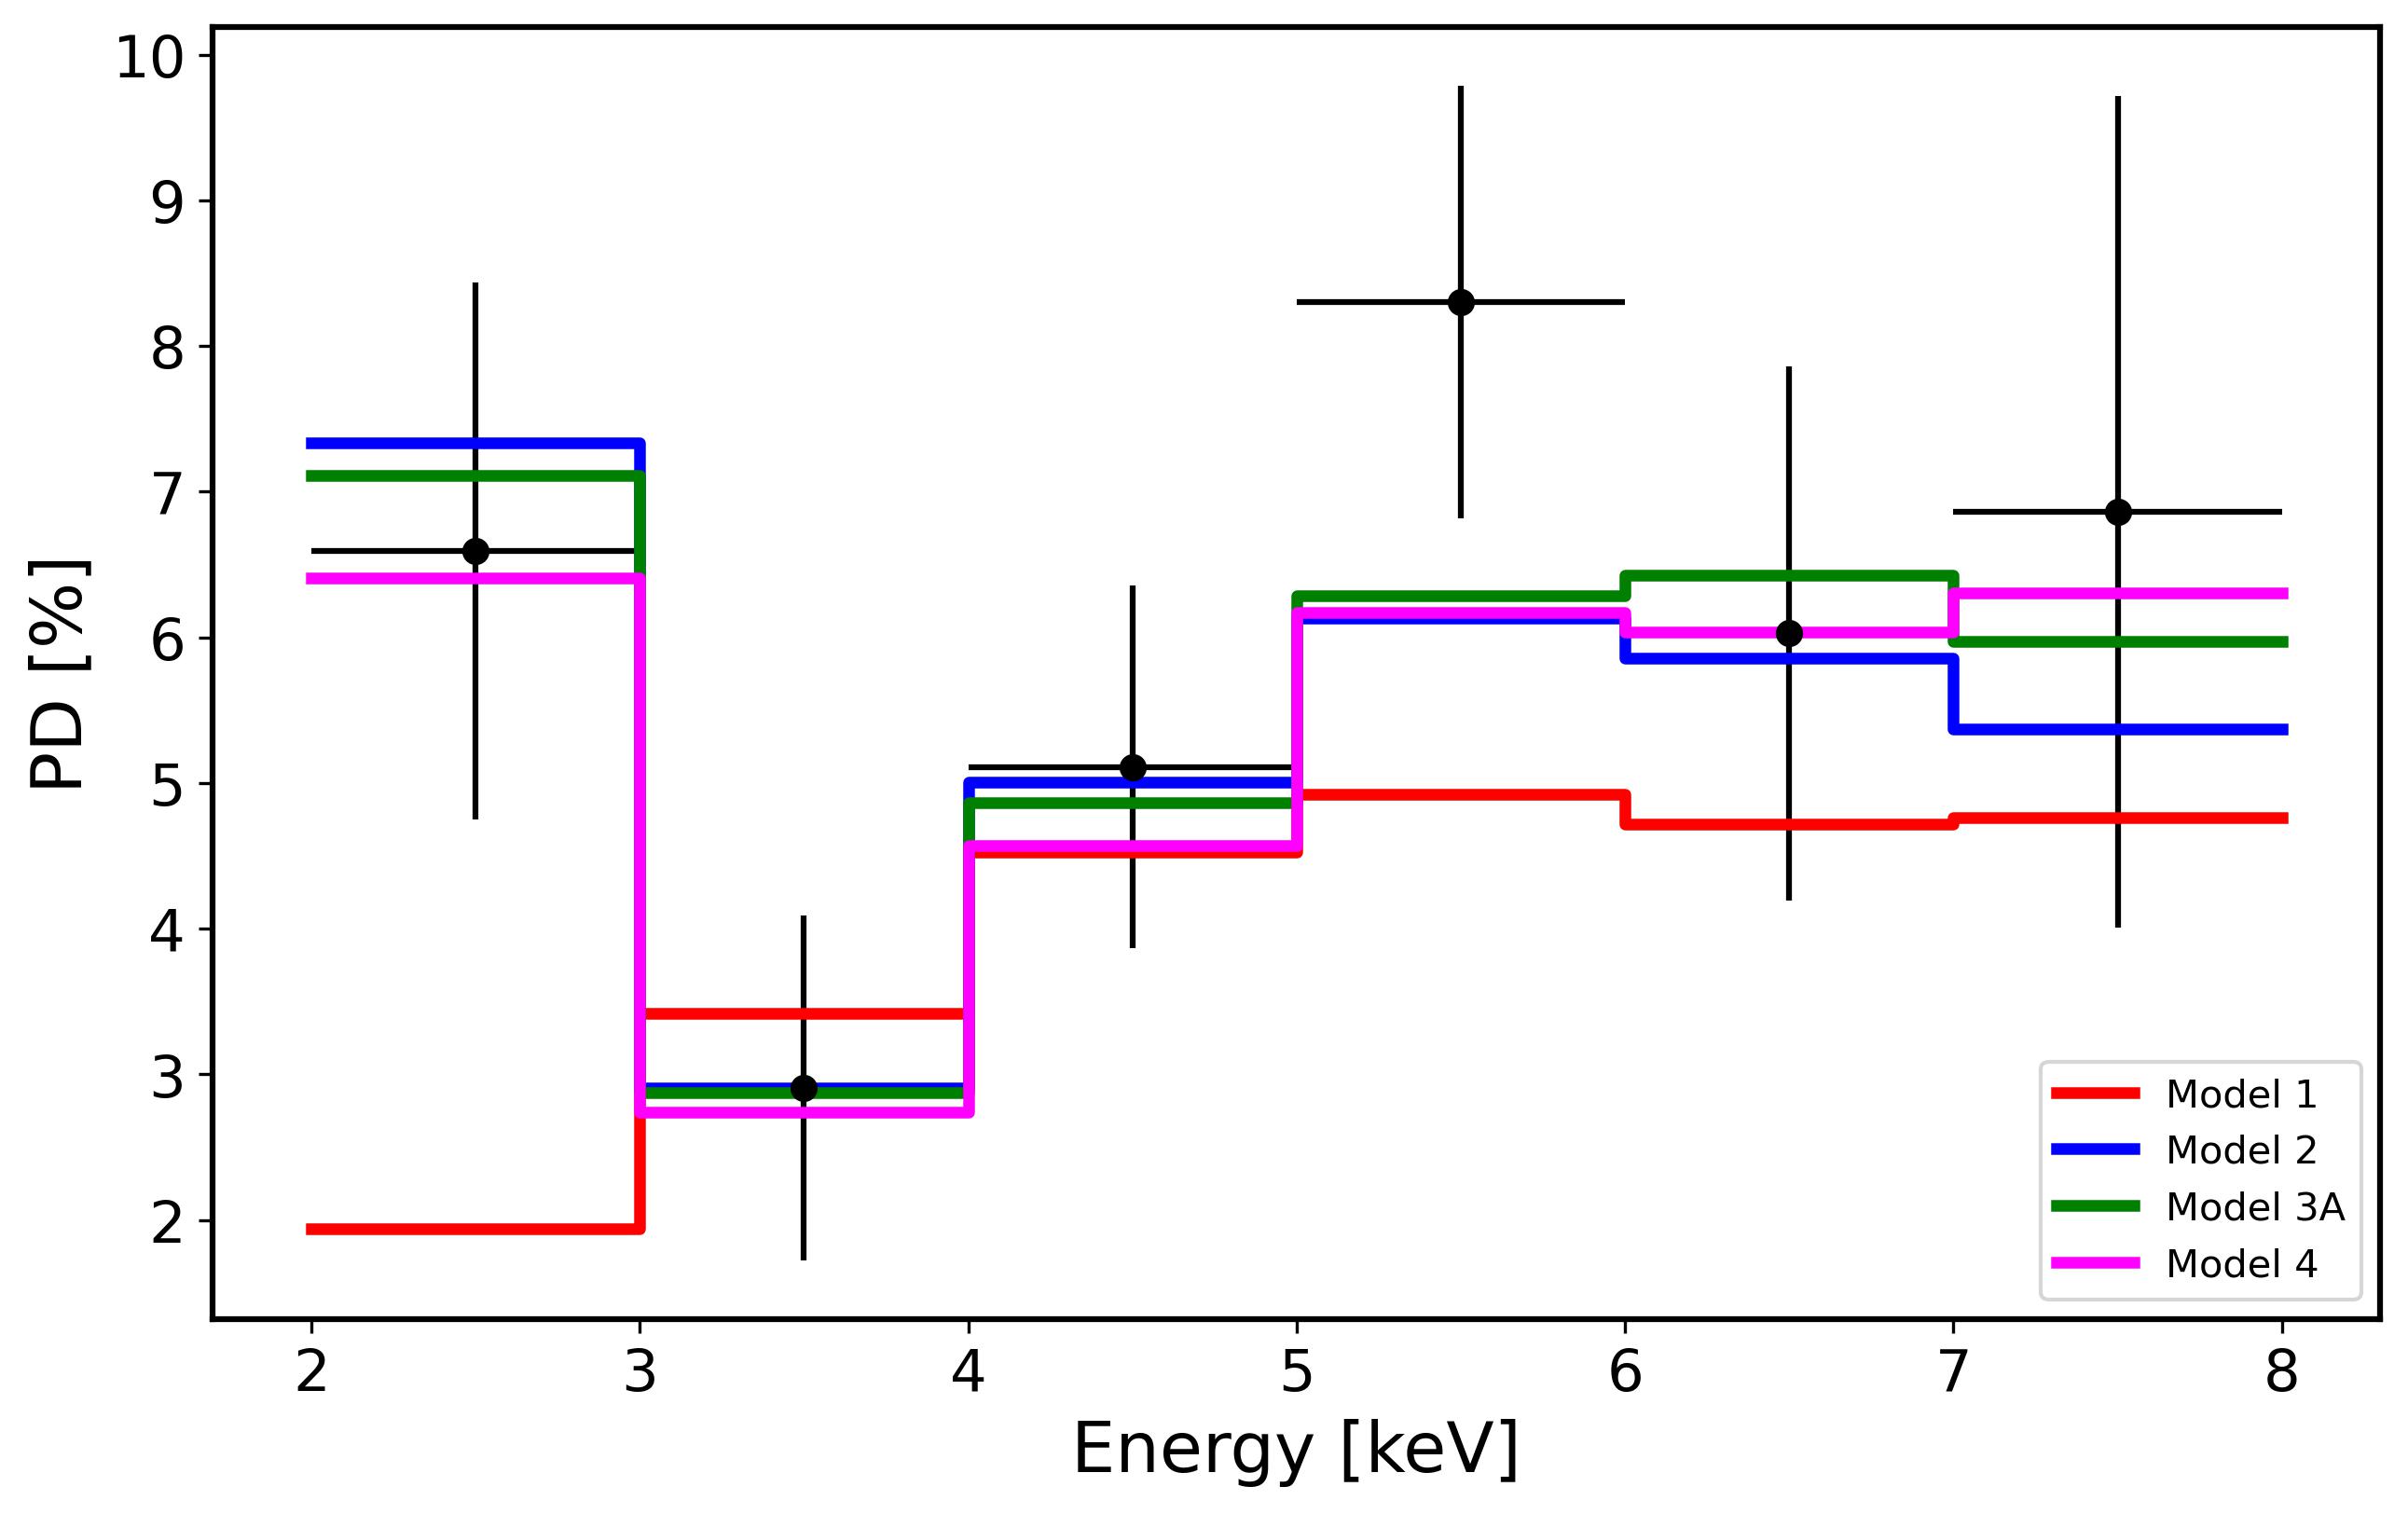
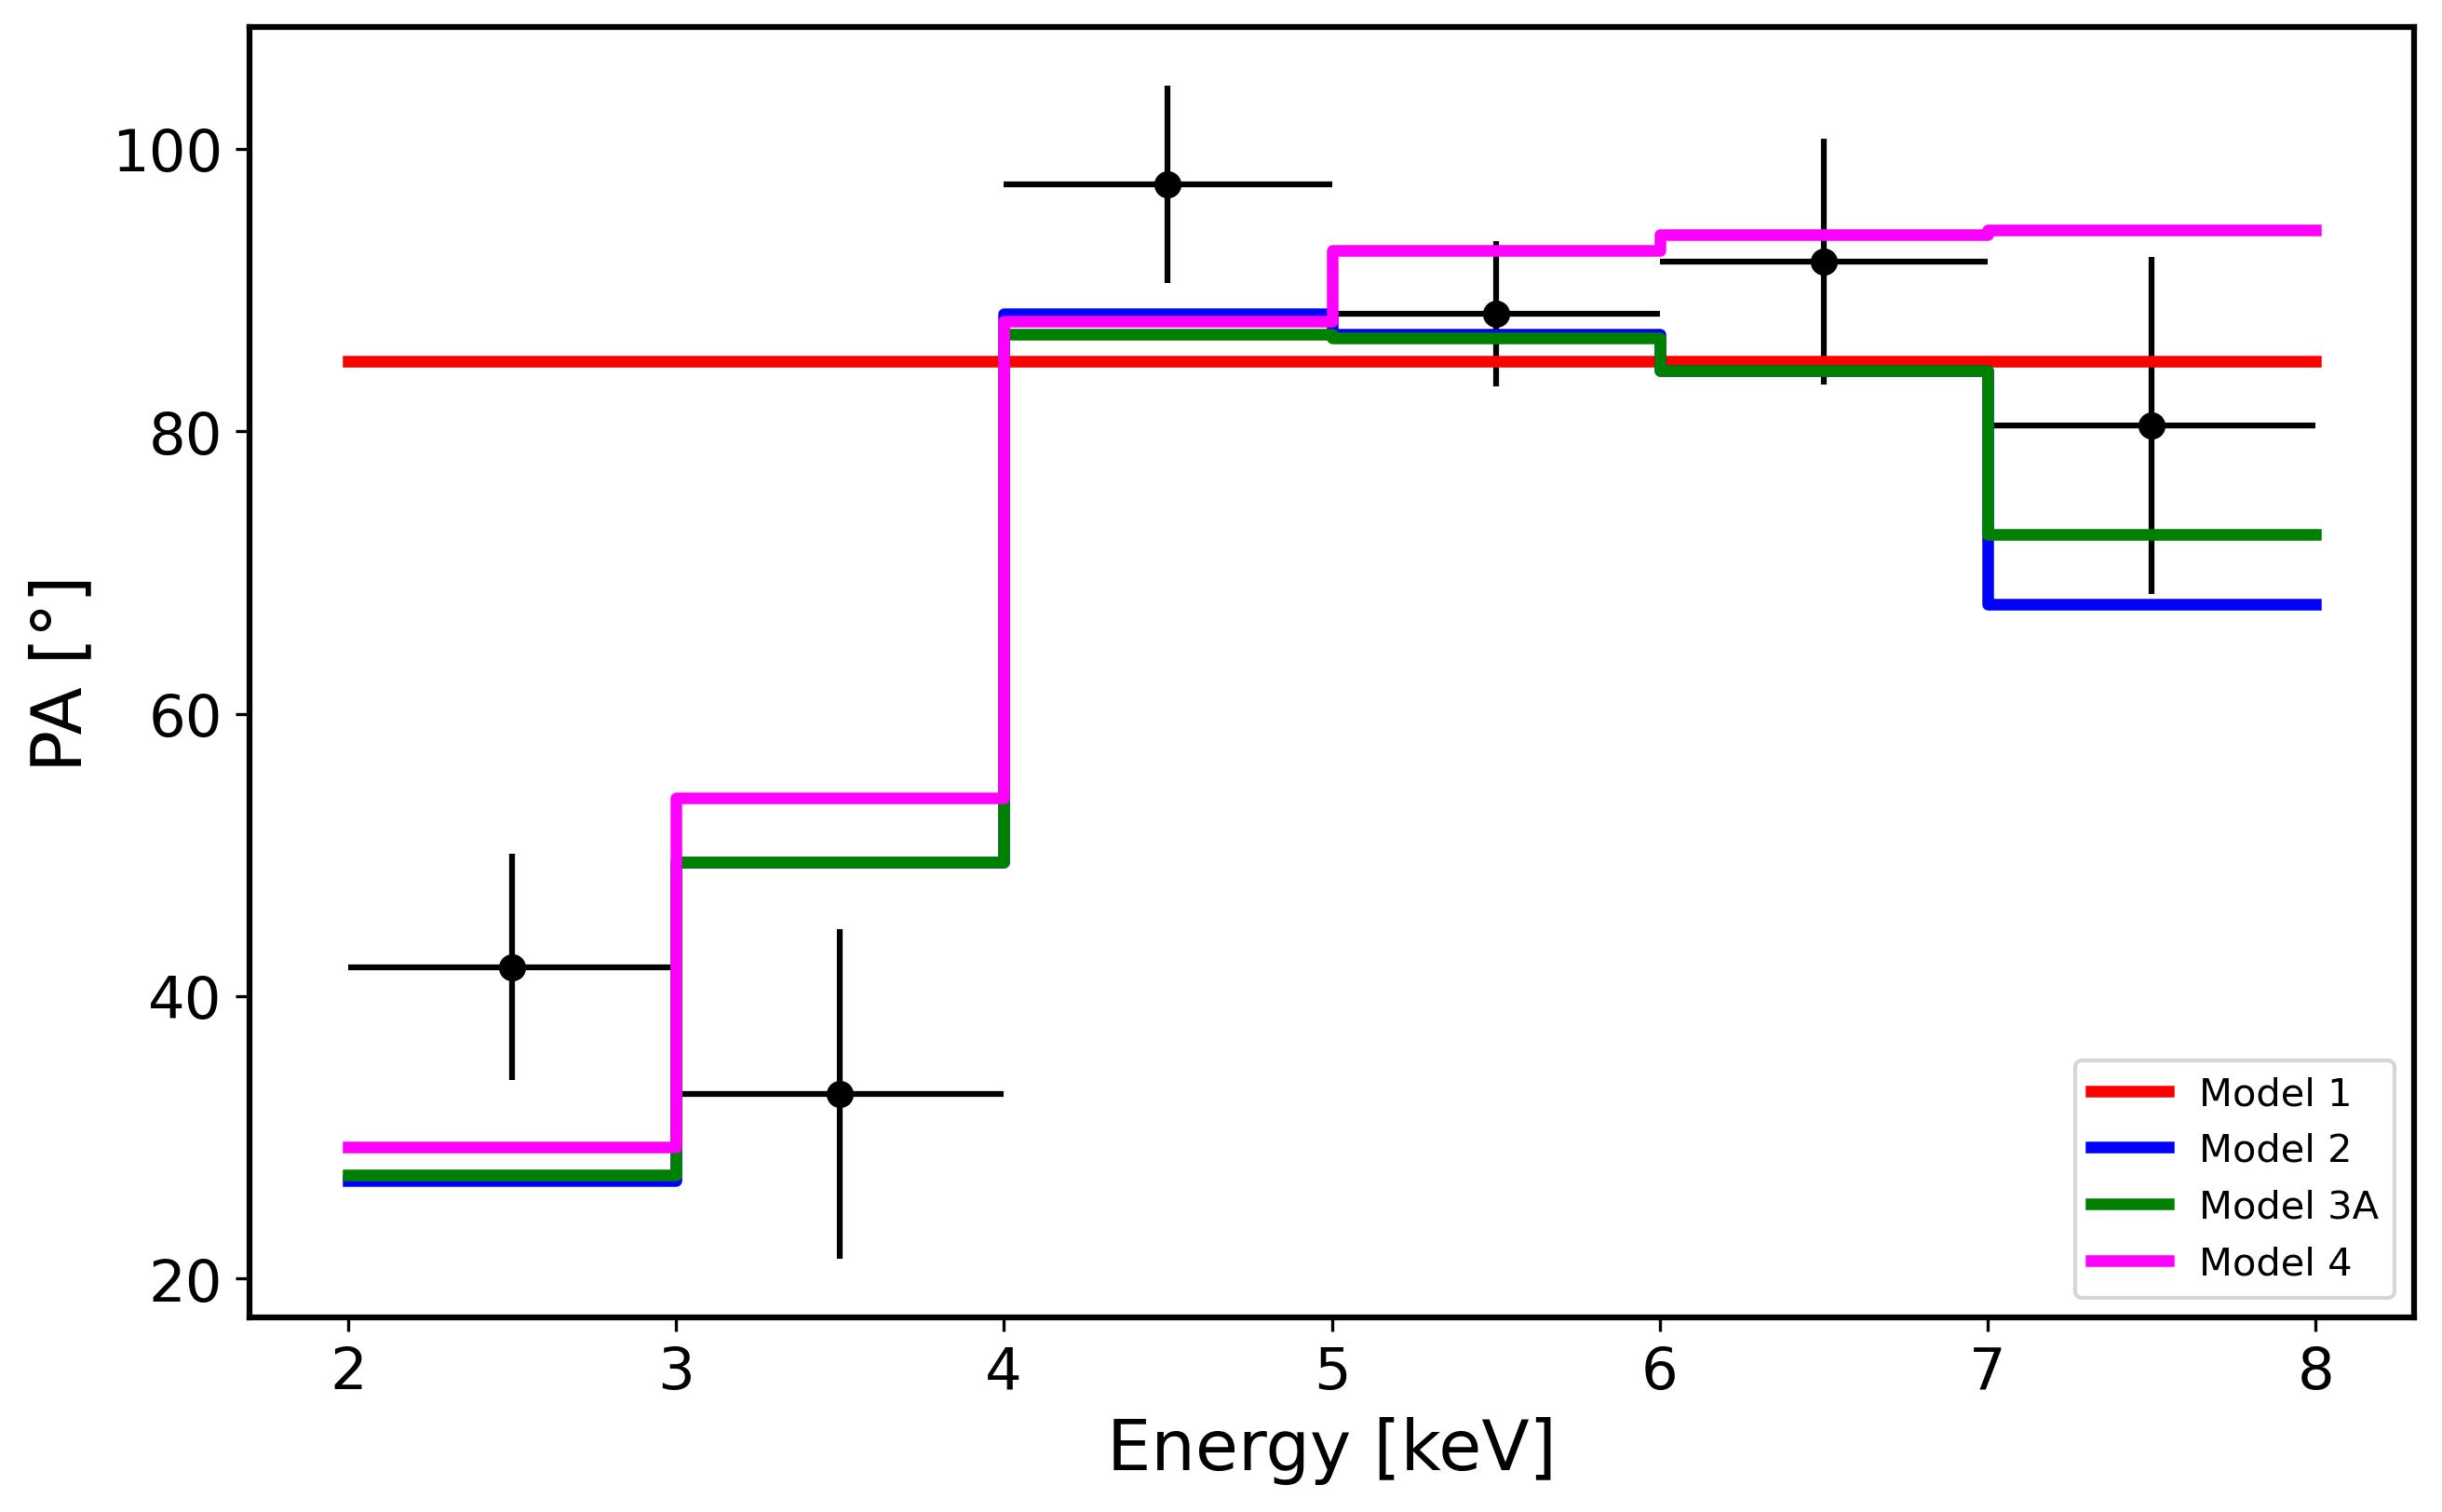
We show in Fig. 8 the PD and PA as a function of energy, as predicted by the models described above and compared to the observed values, re-binned at 1 keV and grouped (all detectors for both observations) for a better visualization. Although these fits account for the switch of PA in the soft X-rays, their physical interpretation is problematic. A PD of around 14 per cent for the soft component may suggest that what we observe is not a leakage through the absorbing layers, but rather the reflection of the primary emission on the inner accretion flow or on a mirror close to the disk. However, a Comptonizing X-ray corona cannot produce a PD in the 16-20 per cent range. For instance, a slab corona, which produces the highest polarization degrees, can reach up to PD 12 per cent, depending on the inclination (see Ursini et al., 2022).
In order to disentangle the coronal emission from the soft component, we test a simplified phenomenological model, composed only by a power-law and a black-body (with temperature 0.5 keV), each obscured by a different layer of neutral matter (of the order of 1023 and 1022 cm-2, respectively). The two components have separate polarization properties, while the Fe K line is considered as unpolarized. From a statistical point of view, the fit is similar to the previous ones (/d.o.f = 1287/1224). While still reproducing the angle switch at low energies, this model recovers a PD for the primary emission, with a similar PD () for the soft component (Table 3, Model 4, and Fig. 8).
4 Discussion and conclusions
The spectral analysis of the available XMM-Newton, NuSTAR, and NICER data of NGC 4151 (see Sect. 3.2) reveals variations in the absorbers and in the primary continuum compared to the 2022 data and between the two new sets of observations. Specifically, we observe variability in the X-ray photon index, continuum normalization, and both neutral and ionized absorbers along the line-of-sight on short ( 1day) and long ( 1.5year) timescales, suggesting ongoing dynamic processes in the source environment (see Fig. 5 and 6, and Table 2). Meanwhile, all the physical parameters of the reflection component are compatible with being constant with respect to the past data (see Table 2 and Fig. 4), so its contribution to the IXPE energy band is higher in the new observations (see Table 2).
Despite the lower flux state of NGC 4151 and the higher contribution of the reflection component, we find no evidence for variations in the observed polarization properties, with polarization degree (PD) and polarization angle (PA) being in good agreement between the first and second observations in all considered energy ranges (see polarimetric analysis in Sect. 3.1). This allows for an analysis of the combined observations, which yields better constraints for PD and PA. In particular, in the full IXPE energy band (i.e., 2.0 – 8.0 keV), we obtain per cent and . The latter aligns very well with the radio emission (see Fig. 2), which shows an average position angle of (e.g., Harrison et al., 1986; Ulvestad et al., 1998; Mundell et al., 2003; Williams et al., 2017, see Fig. 2). Furthermore, we confirm with a higher confidence (detected at 3.5 in the combined data versus 2.2 in the individual observations) the change in polarization angle between the low energy bin (2 – 3.5 keV) and the higher bins (i.e., 3.5 – 5 keV and 5 – 8 keV) or the full band, already observed in G23 (see Table 1 and Fig. 1 and 2). Interestingly, the PA in this soft X-ray bin (i.e., ) appears to align with an unclassified feature identified by Draper et al. (1992) which presents an enhanced extra-nuclear polarization in -band, located at from the center at position angles of and (see Fig. 2).
A spectro-polarimetric fit on both IXPE observations give results in full agreement with what presented in G23, with more constrained PD and PA values (i.e., per cent and ) for the X-ray corona emission. As detailed in G23, these polarization properties are consistent with a slab or wedge geometry for the X-ray corona, as strongly reinforced by the alignment with the double-sided radio jet mentioned above.
However, in this spectro-polarimetric fit, an excess of the Q and U data with respect to the model is apparent below 4 keV (see Fig.7), driving the clear change of PA at lower energies (see Fig. 2 and 8). This observational evidence suggests the presence of an additional soft X-ray component, which could be dominated by the leakage of the primary emission through the absorbers, as modeled in our spectroscopic best-fit. We then allow the PA and PD of the leakage to vary, assuming that the reflection component is either unpolarized or has a PD of 20% with a PA parallel or perpendicular to the primary continuum (see Sect. 3.3). This improves the statistical quality of the spectro-polarimetric fit, notably modeling the PA switch at low energies (Table 3 and Fig. 8). The PD found for the soft component is fairly high (in the range 12-14 per cent), disfavoring the leakage hypothesis, rather suggesting scattering of the primary emission off the inner accretion flow or another mirror. In the latter case, this may suggest that the contribution of the NLR emission to the IXPE energy band is much larger than what predicted by our best-fit model, as a result of an over-simplification of the very complex spectrum of NGC 4151 around 2 keV. However, the PA attributed to this component in these spectro-polarimetric fits is around , very distinct to the observed position angle of of the extended, biconical, NLR observed in near-IR, [O III] and X-rays (see e.g., Draper et al., 1992; Wang et al., 2011; Marin et al., 2020, and references therein).
These fits yield a higher PA for the primary continuum, around , which somewhat departs from the position angle of the radio emission, although sub-arcsecond resolution observations have shown that the inner few pc of the radio jet is aligned with a position angle of (Mundell et al., 2003). Moreover, as for the soft X-ray component, the derived PD for the primary continuum is very high (10-20%), challenging the interpretation of this component as the intrinsic coronal emission. Both issues are solved by completely disentangling the primary continuum from the soft component thanks to a simplified phenomenological model, composed only by a power-law and a black-body. This suggests again that a significant part of the spectral complexity around 2-3 keV is not due to leakage of the primary continuum, bur rather to an independent component.
We do not detect clear evidence of reflection off the accretion disk in the current data (see Sect. 3.2), nor in the 2022 spectra (see G23). However, we cannot rule out the possibility that a significant part of the X-ray polarization above is produced by disk reflection (see e.g., Podgorný et al., 2022, 2023), without clear spectroscopic signatures. This scenario will be explored with a self-consistent spectro-polarimetric analysis in a forthcoming publication (Dovčiak et al., in preparation). We note here that observing NGC 4151 with IXPE in a much lower flux state, could break this degeneracy and provide a more comprehensive understanding of the polarimetric properties of the AGN.
Acknowledgements.
The Imaging X-ray Polarimetry Explorer (IXPE) is a joint US and Italian mission. The US contribution is supported by the National Aeronautics and Space Administration (NASA) and led and managed by its Marshall Space Flight Center (MSFC), with industry partner Ball Aerospace (contract NNM15AA18C). The Italian contribution is supported by the Italian Space Agency (Agenzia Spaziale Italiana, ASI) through contract ASI-OHBI-2017-12-I.0, agreements ASI-INAF-2017-12-H0 and ASI-INFN-2017.13-H0, and its Space Science Data Center (SSDC) with agreements ASI- INAF-2022-14-HH.0 and ASI-INFN 2021-43-HH.0, and by the Istituto Nazionale di Astrofisica (INAF) and the Istituto Nazionale di Fisica Nucleare (INFN) in Italy. This research used data products provided by the IXPE Team (MSFC, SSDC, INAF, and INFN) and distributed with additional software tools by the High-Energy Astrophysics Science Archive Research Center (HEASARC), at NASA Goddard Space Flight Center (GSFC). AT acknowledges financial support from the Bando Ricerca Fondamentale INAF 2022 Large Grant ‘Toward an holistic view of the Titans: multi-band observations of z¿6 QSOs powered by greedy supermassive black holes’. RS acknowledges funding from the INAF-PRIN grant ”A Systematic Study of the largest reservoir of baryons and metals in the Universe: the circumgalactic medium of galaxies” (No. 1.05.01.85.10). We thank the IXPE, NuSTAR, XMM-Newton, and NICER SOCs for granting and performing the respective observations of the source.Data Availability
The IXPE data used in this paper are publicly available in the HEASARC database (https://heasarc.gsfc.nasa.gov/docs/ixpe/archive/). The XMM-Newton and NuSTAR data underlying this article are subject to an embargo of 12 months from the date of the observations. Once the embargo expires (May 31, 2025) the data will be publicly available from the XMM-Newton science archive (http://nxsa.esac.esa.int/) and the NuSTAR archive (https://heasarc.gsfc.nasa.gov/docs/nustar/nustar_archive.html). The NICER data are publicly available in the HEASARC database (https://heasarc.gsfc.nasa.gov/docs/nicer/nicer_archive.html).
References
- Antonucci & Cohen (1983) Antonucci, R. R. J. & Cohen, R. D. 1983, ApJ, 271, 564
- Arnaud (1996) Arnaud, K. A. 1996, in ASP Conf. Ser., Vol. 101, Astronomical Data Analysis Software and Systems V, ed. G. H. Jacoby & J. Barnes (San Francisco: Astron. Soc. Pac.), 17–20
- Arzoumanian et al. (2014) Arzoumanian, Z., Gendreau, K. C., Baker, C. L., et al. 2014, in Society of Photo-Optical Instrumentation Engineers (SPIE) Conference Series, Vol. 9144, Space Telescopes and Instrumentation 2014: Ultraviolet to Gamma Ray, ed. T. Takahashi, J.-W. A. den Herder, & M. Bautz, 914420
- Baldini et al. (2022) Baldini, L., Bucciantini, N., Lalla, N. D., et al. 2022, SoftwareX, 19, 101194
- Baloković et al. (2018) Baloković, M., Brightman, M., Harrison, F. A., et al. 2018, ApJ, 854, 42
- Baloković et al. (2019) Baloković, M., García, J. A., & Cabral, S. E. 2019, Research Notes of the American Astronomical Society, 3, 173
- Bentz et al. (2022) Bentz, M. C., Williams, P. R., & Treu, T. 2022, ApJ, 934, 168
- Beuchert et al. (2017) Beuchert, T., Markowitz, A. G., Dauser, T., et al. 2017, A&A, 603, A50
- Bianchi et al. (2010) Bianchi, S., Chiaberge, M., Evans, D. A., et al. 2010, MNRAS, 405, 553
- De Rosa et al. (2007) De Rosa, A., Piro, L., Perola, G. C., et al. 2007, A&A, 463, 903
- Di Marco et al. (2022) Di Marco, A., Costa, E., Muleri, F., et al. 2022, AJ, 163, 170
- Di Marco et al. (2023) Di Marco, A., Soffitta, P., Costa, E., et al. 2023, AJ, 165, 143
- Draper et al. (1992) Draper, P. W., Gledhill, T. M., Scarrott, S. M., & Tadhunter, C. N. 1992, MNRAS, 257, 309
- Fabian et al. (2017) Fabian, A. C., Lohfink, A., Belmont, R., Malzac, J., & Coppi, P. 2017, MNRAS, 467, 2566
- Fabian et al. (2015) Fabian, A. C., Lohfink, A., Kara, E., et al. 2015, MNRAS, 451, 4375
- Ferland et al. (1998) Ferland, G. J., Korista, K. T., Verner, D. A., et al. 1998, PASP, 110, 761
- Gendreau et al. (2016) Gendreau, K. C., Arzoumanian, Z., Adkins, P. W., et al. 2016, in Society of Photo-Optical Instrumentation Engineers (SPIE) Conference Series, Vol. 9905, Space Telescopes and Instrumentation 2016: Ultraviolet to Gamma Ray, ed. J.-W. A. den Herder, T. Takahashi, & M. Bautz, 99051H
- Gendreau et al. (2012) Gendreau, K. C., Arzoumanian, Z., & Okajima, T. 2012, in Society of Photo-Optical Instrumentation Engineers (SPIE) Conference Series, Vol. 8443, Space Telescopes and Instrumentation 2012: Ultraviolet to Gamma Ray, ed. T. Takahashi, S. S. Murray, & J.-W. A. den Herder, 844313
- Gianolli et al. (2024) Gianolli, V. E., Bianchi, S., Petrucci, P.-O., et al. 2024, in Memorie della Societa Astronomica Italiana, Vol. 95, 27–31
- Gianolli et al. (2023) Gianolli, V. E., Kim, D. E., Bianchi, S., et al. 2023, MNRAS, 523, 4468
- Harrison et al. (1986) Harrison, B., Pedlar, A., Unger, S. W., et al. 1986, MNRAS, 218, 775
- Harrison et al. (2013) Harrison, F. A., Craig, W. W., Christensen, F. E., et al. 2013, ApJ, 770, 103
- Ingram et al. (2023) Ingram, A., Ewing, M., Marinucci, A., et al. 2023, MNRAS, 525, 5437
- Kaastra & Bleeker (2016) Kaastra, J. S. & Bleeker, J. A. M. 2016, A&A, 587, A151
- Kamraj et al. (2022) Kamraj, N., Brightman, M., Harrison, F. A., et al. 2022, ApJ, 927, 42
- Kang & Wang (2022) Kang, J.-L. & Wang, J.-X. 2022, ApJ, 929, 141
- Keck et al. (2015) Keck, M. L., Brenneman, L. W., Ballantyne, D. R., et al. 2015, ApJ, 806, 149
- Kraemer et al. (2008) Kraemer, S. B., Schmitt, H. R., & Crenshaw, D. M. 2008, ApJ, 679, 1128
- Lubiński et al. (2010) Lubiński, P., Zdziarski, A. A., Walter, R., et al. 2010, MNRAS, 408, 1851
- Marin et al. (2024) Marin, F., Gianolli, V. E., Ingram, A., et al. 2024, Galaxies, 12
- Marin et al. (2020) Marin, F., Le Cam, J., Lopez-Rodriguez, E., et al. 2020, MNRAS, 496, 215
- Marinucci et al. (2022) Marinucci, A., Muleri, F., Dovciak, M., et al. 2022, MNRAS, 516, 5907
- Matt et al. (2015) Matt, G., Baloković, M., Marinucci, A., et al. 2015, MNRAS, 447, 3029
- May et al. (2020) May, D., Steiner, J. E., Menezes, R. B., Williams, D. R. A., & Wang, J. 2020, MNRAS, 496, 1488
- Muleri (2022) Muleri, F. 2022, Analysis of the Data from Photoelectric Gas Polarimeters, ed. C. Bambi & A. Santangelo (Singapore: Springer Nature Singapore), 1–23
- Mundell et al. (2003) Mundell, C. G., Wrobel, J. M., Pedlar, A., & Gallimore, J. F. 2003, ApJ, 583, 192
- NASA Heasarc (2014) NASA Heasarc. 2014, HEAsoft: Unified Release of FTOOLS and XANADU, Astrophysics Source Code Library, record ascl:1408.004
- Petrucci et al. (2001) Petrucci, P. O., Haardt, F., Maraschi, L., et al. 2001, ApJ, 556, 716
- Piconcelli et al. (2004) Piconcelli, E., Jimenez-Bailón, E., Guainazzi, M., et al. 2004, MNRAS, 351, 161
- Podgorný et al. (2023) Podgorný, J., Dovčiak, M., Goosmann, R., et al. 2023, MNRAS, 524, 3853
- Podgorný et al. (2022) Podgorný, J., Dovčiak, M., Marin, F., Goosmann, R., & Różańska, A. 2022, MNRAS, 510, 4723
- Ricci et al. (2018) Ricci, C., Ho, L. C., Fabian, A. C., et al. 2018, MNRAS, 480, 1819
- Schnittman & Krolik (2010) Schnittman, J. D. & Krolik, J. H. 2010, ApJ, 712, 908
- Serafinelli et al. (2024) Serafinelli, R., De Rosa, A., Tortosa, A., et al. 2024, arXiv e-prints, arXiv:2407.06769
- Serafinelli et al. (2023) Serafinelli, R., Marinucci, A., De Rosa, A., et al. 2023, MNRAS, 526, 3540
- Shapiro et al. (1976) Shapiro, S. L., Lightman, A. P., & Eardley, D. M. 1976, ApJ, 204, 187
- Shapovalova et al. (2012) Shapovalova, A. I., Popovic, L. C., Collin, S., et al. 2012, Astron. Astrophys. Trans., 27, 429
- Storchi-Bergmann et al. (2009) Storchi-Bergmann, T., McGregor, P. J., Riffel, R. A., et al. 2009, MNRAS, 394, 1148
- Strüder et al. (2001) Strüder, L., Briel, U., Dennerl, K., et al. 2001, A&A, 365, L18
- Sunyaev & Titarchuk (1980) Sunyaev, R. A. & Titarchuk, L. G. 1980, A&A, 86, 121
- Tagliacozzo et al. (2023) Tagliacozzo, D., Marinucci, A., Ursini, F., et al. 2023, MNRAS, 525, 4735
- Tamborra et al. (2018) Tamborra, F., Matt, G., Bianchi, S., & Dovčiak, M. 2018, A&A, 619, A105
- Tortosa et al. (2018) Tortosa, A., Bianchi, S., Marinucci, A., Matt, G., & Petrucci, P. O. 2018, A&A, 614, A37
- Ulvestad et al. (1998) Ulvestad, J. S., Roy, A. L., Colbert, E. J. M., & Wilson, A. S. 1998, ApJ, 496, 196
- Ursini et al. (2022) Ursini, F., Matt, G., Bianchi, S., et al. 2022, MNRAS, 510, 3674
- Wang et al. (2011) Wang, J., Fabbiano, G., Risaliti, G., et al. 2011, ApJ, 729, 75
- Weaver et al. (1994) Weaver, K. A., Mushotzky, R. F., Arnaud, K. A., et al. 1994, ApJ, 423, 621
- Weisskopf et al. (2022) Weisskopf, M. C., Soffitta, P., Baldini, L., et al. 2022, J. Astron. Telesc. Instrum. Syst., 8, 026002
- Williams et al. (2017) Williams, D. R. A., McHardy, I. M., Baldi, R. D., et al. 2017, MNRAS, 472, 3842
- Wolfinger et al. (2013) Wolfinger, K., Kilborn, V. A., Koribalski, B. S., et al. 2013, MNRAS, 428, 1790
- Yang et al. (2001) Yang, Y., Wilson, A. S., & Ferruit, P. 2001, ApJ, 563, 124
- Yaqoob et al. (1995) Yaqoob, T., Edelson, R., Weaver, K. A., et al. 1995, ApJ, 453, L81
- Zdziarski et al. (1996) Zdziarski, A. A., Johnson, W. N., & Magdziarz, P. 1996, MNRAS, 283, 193
- Zdziarski et al. (2000) Zdziarski, A. A., Poutanen, J., & Johnson, W. N. 2000, ApJ, 542, 703
- Zhang et al. (2019) Zhang, W., Dovčiak, M., & Bursa, M. 2019, ApJ, 875, 148
- Zoghbi et al. (2019) Zoghbi, A., Miller, J. M., & Cackett, E. 2019, ApJ, 884, 26
- Życki et al. (1999) Życki, P. T., Done, C., & Smith, D. A. 1999, MNRAS, 309, 561
Affiliations:
1Université Grenoble Alpes, CNRS, IPAG, 38000 Grenoble, France
2Dipartimento di Matematica e Fisica, Università degli Studi Roma Tre, Via della Vasca Navale 84, 00146 Roma, Italy
3ASI - Agenzia Spaziale Italiana, Via del Politecnico snc, 00133 Roma, Italy
4INAF – Astronomical Observatory of Rome, Via Frascati 33, 00040 Monte Porzio Catone, Italy
5INAF Istituto di Astrofisica e Planetologia Spaziali, Via del Fosso del Cavaliere 100, I-00133 Roma, Italy
6Dipartimento di Fisica, Università degli Studi di Roma “La Sapienza”, Piazzale Aldo Moro 5, I-00185 Roma, Italy
7Dipartimento di Fisica, Università degli Studi di Roma “Tor Vergata”, Via della Ricerca Scientifica 1, I-00133 Roma, Italy
8Université de Strasbourg, CNRS, Observatoire Astronomique de Strasbourg, UMR 7550, 67000 Strasbourg, France
9Centre for Extragalactic Astronomy, Department of Physics, University of Durham, South Road, Durham DH1 3LE, UK
10Institute of Space and Astronautical Science (ISAS), Japan Aerospace Exploration Agency (JAXA), Kanagawa 252-5210, Japan
11MIT Kavli Institute for Astrophysics and Space Research, Massachusetts Institute of Technology, 77 Massachusetts Avenue, Cambridge, MA 02139, USA
12Space Science Data Center, Agenzia Spaziale Italiana, Via del Politecnico snc, 00133 Roma, Italy
13Astronomical Institute of the Czech Academy of Sciences, Bocˇní II 1401/1, 14100 Praha 4, Czech Republic
14Istituto Nazionale di Fisica Nucleare, Sezione di Roma ”Tor Vergata”, Via della Ricerca Scientifica 1, 00133 Roma, Italy
15Department of Astronomy, University of Maryland, College Park, Maryland 20742, USA