Massive Quiescent Disk Galaxies at in CANDELS : Color Gradients and Likely Origin
Abstract
A rare population of massive disk-dominated quiescent galaxies has recently drawn much attention, which intrudes the red sequence population without destroying the underlying stellar disks. In this study, we have carefully identified 48 red sequence (RS), disk-dominated galaxies with between redshift 0.5 and 1.0 in all five CANDELS fields. These galaxies are well fitted by a two-component bulge plus disk model, and have the bulge-to-total ratio in the both F814W and F160W bands. The fitting results indicate that these galaxies generally have extended stellar disks ( on average) and tiny bulge components ( on average). To understand their possible origins, we have also selected two control samples of 156 green valley (GV) and 309 blue cloud (BC) disk-dominated galaxies according to the same selection criteria. We study the ( versus ) color gradients of these galaxies to infer their specific star formation rate (sSFR) gradients out to the maximum acceptable radii. We show that on average the disks in disk-dominated RS galaxies are fully quenched at all radii, whereas both the BC and GV disks are not fully quenched at any radii. We find that all the BC, GV and RS disk galaxies generally have nearly flat sSFR profiles. We propose a potential formation mechanism, acknowledging that various other mechanisms (e.g., central compaction and AGN feedback) might contribute, where massive quiescent disk-dominated galaxies are predominantly formed via a process of secular disk fading.
1 Introduction
It has been known that galaxies display bimodality in both optical color and morphology in the color-magnitude (stellar mass) and morphology-stellar mass diagrams both locally and at high redshifts (e.g., Kauffmann et al., 2003; Blanton et al., 2003; Baldry et al., 2004; Bell et al., 2004; Faber et al., 2007; Brammer et al., 2009; Ilbert et al., 2010). Galaxies are broadly divided into two classes: (1) star-forming systems with prominent disks often exhibiting blue color and spiral structure. (2) quiescent systems dominated by a spheroidal morphology-the most extreme being ellipticals-usually having very little ongoing star formation and red color. Understanding the processes by which galaxies transform from the “blue cloud” of star-forming to the ”red sequence” of quiescent systems has been a key topic in both observational and theoretical studies of galaxy evolution over the past several decades. The common scenario is that galaxy quenching processes are accompanied with a structural transition from star-forming disks to quenched spheroids. However, in addition to the dominated population of spheroidal galaxies at the massive end () of the red sequence, a rare population of red disk galaxies also intrude the red sequence. The existence of such massive red (quiescent) disk galaxies challenges the current standard paradigm of galaxy formation (Xu et al., 2021).
Red disk galaxies have actually been known for several decades (e.g., van den Bergh, 1976; Dressler et al., 1999; Poggianti et al., 1999). Red optical color may result from attenuation due to dust (Valentijn, 1990; Driver et al., 2007; Masters et al., 2010a), high metallicity (Mahajan & Raychaudhury, 2009), low star formation rate (Moran et al., 2006; Masters et al., 2010b; Cortese, 2012; Tojeiro et al., 2013), or no detectable star formation (Fraser-McKelvie et al., 2016). It has been shown that inclined star-forming disk galaxies may appear red due to dust reddening (e.g., Masters et al., 2010a). However, some researches suggest that numerous red disk galaxies are really quiescent and have very little ongoing star formation (e.g., Masters et al., 2010b). It has raised great concern about how quiescent disk galaxies formed and were quenched.
In the local universe, various properties of quenched massive disk (spiral) galaxies have been revealed, and many efforts have recently been invested in understanding of their possible origins. For instance, based on the Galaxy Zoo project, Masters et al. (2010b) found that at high stellar masses (), a significant fraction of spirals are truly quiescent disks and the environment effect is not sufficient to quench these massive disks. In consideration of the old stellar populations hosted by red spirals and the intact disk morphology, they proposed that red spirals might be old spirals that have exhausted all of their gas. Guo et al. (2020) performed a statistical analysis of the spectroscopic and structural properties of local red spiral galaxies with in SDSS DR7, and compared them with ellipticals and blue spiral galaxies of similar mass. They showed that massive red spiral galaxies have compact cores, large Dn(4000) values, high [Mg/Fe] values, and dark matter halo masses similar to elliptical galaxies, which suggest that the bulges of red spirals formed within a short timescale before redshift and were quenched via a fast mode. They also found that about 70% of the red spiral galaxies show strong bar, ring/shell structures and even merger features, based on the optical morphology. Hao et al. (2019) carried out a two-dimensional spectroscopic analysis of a subsample of Guo et al. (2020) out to 1.5 times effective radii based on the SDSS DR15 for the MaNGA survey. They found that the stellar population properties of their red spirals are more similar to those of red elliptical galaxies than to blue spiral galaxies, and explanation of this is that red spirals form as remnants of gas-rich major mergers occurring above . Zhang et al. (2019) found that nearly all massive quiescent disk galaxies still retain cold atomic hydrogen gas similar to star-forming galaxies, but have significantly reduced molecular gas and dust content and lower star formation efficiency. Mahajan et al. (2020) showed that the optical colors of red spiral galaxies at in GAMA are a direct consequence of some environment-related mechanism(s) that has removed dust and gas, leading to a lower star formation rate. Zhou et al. (2021) investigated the star formation histories of red spiral galaxies with , and make comparisons with blue spirals and red ellipticals of similar masses, using MaNGA spectra. They suggested that massive red spirals are likely to share some common processes of formation with massive red ellipticals in the sense that both types were formed at through a fast formation process. Shimakawa et al. (2022) showed the proportion of passive spiral galaxies is at by deep imaging data taken from the HSC-SSP PDR3 over 1072 . They also found that the characteristics of stellar populations in passive spirals were similar to those of typical quiescent galaxies.
At moderate and high redshifts, Bundy et al. (2010) examined the evolution of passive spirals since based on the COSMOS survey and discussed extensively the possible origins of red disk galaxies. They showed that passive disk galaxies are a significant component of red sequence galaxies, with about 60% of galaxies transitioning onto the red sequence experiencing a passive disk phase. There is also evidence for massive galaxies with low bulge-fractions and already ancient stellar populations at (e.g., McGrath et al., 2008; Stockton et al., 2008; van der Wel et al., 2011; Bruce et al., 2014; Kesseli et al., 2014). More recently, Fudamoto et al. (2022) detected two extremely red spiral galaxies likely in the cosmic noon () as well, from the JWST ERO image data release of SMACS 0723, one of which is more likely to be a passive galaxy having moderate dust reddening. The presence of massive disks of old stars at high redshifts means that at least some quiescent disk galaxies have formed directly through highly dissipative events with significant angular momentum in the early universe.
It is still unclear how massive quiescent disk galaxies formed, and how the star formation was quenched without destroying the underlying stellar disks. Different selection criteria have resulted in mutually exclusive samples of optically red disk galaxies with distinguishable properties. For instance, Masters et al. (2010b) selected disk-dominated spirals, rejecting bulge-dominated disk galaxies, whereas most of red spiral galaxies in Guo et al. (2020) have the bulge-to-total ratio , harboring a prominent bulge. On the other hand, massive quiescent disks are likely a collection of several individual populations that are a product of different quenching mechanisms or effects (Mahajan et al., 2020). There are various physical processes responsible for cessation of star formation in galaxies, such as central compaction (Fang et al., 2013; Dekel & Burkert, 2014; Zolotov et al., 2015; Tacchella et al., 2016; Liu et al., 2016, 2018; Barro et al., 2017; Whitaker et al., 2017), AGN feedback (Croton et al., 2006; Fabian, 2012; Harrison, 2017), supernova feedback (Geach et al., 2014), major merger (Mihos & Hernquist, 1996; Hopkins et al., 2008), environmental effects (Kauffmann et al., 2004; Baldry et al., 2006; Peng et al., 2012; Geha et al., 2012; Guo et al., 2017; Papovich et al., 2018), halo quenching (Dekel & Birnboim, 2006), morphological quenching (Martig et al., 2009), gravitational quenching (Genzel et al., 2014), and strangulation (Larson et al., 1980; Peng et al., 2015). Different mechanisms are expected to change the radial sSFR profile of a galaxy in a different way during its quenching process. For example, the processes of central compaction and AGN feedback first deplete the gas in the centers of galaxies or blow it out of the centers, causing “the inside-out” quenching. The environmental effects usually strip the gas content of galaxies first from their outskirts, causing “the outside-in” quenching. In the case of quenching by “strangulation”, star formation can continue with the gas available in the galaxy until it is completely used up, which may cause a uniform decline of the radial sSFR profile from the center to the outskirts.
In this work, we focus exclusively on quiescent disk-dominated galaxies with low bulge-to-total ratios at moderate redshifts. To investigate their possible origins, we have carefully identified 48 red sequence (RS), 156 green valley (GV) and 309 blue cloud (BC) disk-dominated galaxies with between redshift 0.5 and 1.0 in all five CANDELS fields. we exploit deep high-resolution HST/WFC3 and Advanced Camera for Surveys (ACS) multi-band imaging data to measure their rest-frame color profiles to infer their sSFR profiles. We show that on average the RS disks are fully quenched at all radii, whereas both the BC and GV disks are not fully quenched at any radii. We find that all the BC, GV and RS disks generally have nearly flat sSFR profiles, and that the GV disks have more similar structural properties to the RS disks than to the BC disks. We discuss possible meachanism(s) for the formation of massive quiescent disks.
The outline of this paper is as follows. In Section 2, we describe the data and sample selection. In Section 3, we describe the identification of disk-dominated galaxies based on the bulge/disk decomposition with GALFIT. In Section 4, we describe the classification for the RS, GV and BC disk galaxies. In Section 5, we describe the measurement of color profiles. We present our main results in Section 6 and finish with a discussion and summary in Section 7. Throughout the paper, we adopt a cosmology with =0.3, =0.7 and =70-1 Mpc-1. All magnitudes are in the AB system.
2 Data and Sample
The data and sample selection procedure used in this work are roughly the same as those of Liu et al. (2018). We here present a brief description and refer readers to Liu et al. (2018) for details. In order to maximize the sample size, we select massive galaxies from all five CANDELS fields (Grogin et al., 2011; Koekemoer et al., 2011; Faber, 2011). Multi-band photometry catalogs were built by Nayyeri et al. (2017, for COSMOS), Stefanon et al. (2017, for EGS), Barro et al. (2019, for GOODS-N), Guo et al. (2013, for GOODS-S) and Galametz et al. (2013, UDS), respectively. Redshifts used in this work are the best redshifts, which are in the order of priority of secure spectroscopic, good grism, and photometric redshifts if available. Spectroscopic redshifts were recently recompiled by N. P. Hathi (2018, private communication) for all five CANDELS fields, which include publicly available (e.g. Santini et al., 2015, and reference therein) and unpublic (e.g., UCR DEIMOS Survey) redshifts. Grism redshifts came from the 3D-HST/CANDELS Survey (Morris et al., 2015; Momcheva et al., 2016). Photometric redshifts were estimated using the multiwavelength photometry catalogs and adopting a hierarchical Bayesian approach (Dahlen et al., 2013). Rest-frame integrated magnitudes from FUV to K were computed using EAZY (Brammer et al., 2008), which fits a set of galaxy SED templates to the multi-wavelength photometry, with the redshifts as inputs. Stellar masses were computed using FAST (Kriek et al., 2009) and based on a grid of Bruzual & Charlot (2003) models that assume a Chabrier (2003) initial mass function (IMF), exponentially declining -models, solar metallicity, and a Calzetti et al. (2000) dust law. SFRs were computed from rest-frame UV luminosities at 2800 Å that are corrected for extinction by applying a foreground-screen Calzetti reddening law (Calzetti et al., 2000; Kennicutt & Evans, 2012). We adopted the median that was calculated median by combining results from four methods (see labeled 2a, 12a, 13a, and 14a in Santini et al., 2015) if available. Effective radius () along the semi-major axis (), minor-to-major axis ratio () and position angle () were measured from the F160W images using GALFIT (van der Wel et al., 2012).
| COSMOS | EGS | GOODSN | GOODSS | UDS | TOTAL | |
| Full Catalog | 38671 | 41457 | 35445 | 34930 | 35932 | 186435 |
| 11811 | 11292 | 9522 | 8352 | 9758 | 50735 | |
| 9110 | 9031 | 7770 | 6698 | 8090 | 40699 | |
| 8861 | 8817 | 7660 | 6577 | 7960 | 39875 | |
| 3119 | 2485 | 2544 | 2147 | 2404 | 12699 | |
| 669 | 415 | 469 | 353 | 325 | 2231 | |
| 602 | 383 | 420 | 335 | 294 | 2034 | |
| 318 | 198 | 403 | 330 | 288 | 1537 | |
| Good multi-band data | 224 | 189 | 324 | 250 | 206 | 1193 |
| Disk-dominated galaxies | 104 | 91 | 132 | 97 | 89 | 513 |
| RS disk galaxies | 6 | 6 | 16 | 11 | 9 | 48 |
| GV disk galaxies | 33 | 28 | 34 | 36 | 25 | 156 |
| BC disk galaxies | 65 | 57 | 82 | 50 | 55 | 309 |
The parent sample used in this work is constructed by applying the following cuts to the above data:
-
1.
Observed F160W() magnitude brighter than 24.5 to ensure high signal-to-noise ratios (S/Ns).
-
2.
GALFIT quality (good fit) in F160W (van der Wel et al., 2012) to ensure well-constrained measurements of structural parameters.
-
3.
SExtractor to exclude stars.
-
4.
Redshifts within and stellar masses .
-
5.
to minimize the point spread function (PSF) effects on color gradient measurement.
-
6.
No contamination from blending (PhotFlag=0 and visual inspection), the borders of the mosaic, or bad pixels to interfere with the fitting. Available simultaneous measurements of the surface brightness profiles (SBPs) in , , and .
Table 1 details our selection criteria and the resulting sample sizes after each cut for each field. After the above cuts, we obtain 1193 massive galaxies in total from all five CANDELS fields.
3 Identification of Disk Galaxies
Galaxy morphology measurements were obtained using GALFIT (Peng et al., 2002). We first generated the multi-band thumbnail images from the original CANDELS mosaics for individual targets. The thumbnails have a size of 401 401 pixels. A careful sky background subtraction was then applied to each thumbnail. For this purpose, we made segmentation maps with GNUASTRO (Akhlaghi & Ichikawa, 2015) and developed a pixel-by-pixel background estimation code in Python. We produced the noise maps by adding the Poisson noise of individual galaxies to the root mean square (rms) maps, which include the detector and background noises. We provided a PSF to GALFIT that was constructed by stacking the unsaturated stars with high carefully-selected in individal field. To mask bad pixels and exclude interference from neighbouring sources, we first ran SExtractor dual model to generate segmentation maps of each thumbnail. The mask maps were then generated by setting the region of target galaxy to be zero. A 2.5 times Kron radius measured by SExtractor in F160W was used to constrain the size of GALFIT fitted region. The initial structural parameters prior to GALFIT were determined with SExtractor.
We fit two models for both the F160W and F814W band thumbnail images of each selected galaxy: the two-component model of a Sérsic bulge with a variable plus an exponential disk (SerExp), and the single-component Sérsic model with a variable index (). For the two-component SerExp model, we set the following constraints: the disk is fixed at 1.0, the bulge ranges from 0.5 to 8.0, and the ranges from 0.5 to 50 pixels. In addition, we restrict (disk)/ (bulge)1, which indicates that the identified disk component is the outer disk. For the single-component Sérsic model, we use the same constraints as for the bulge of the two-component SerExp model.
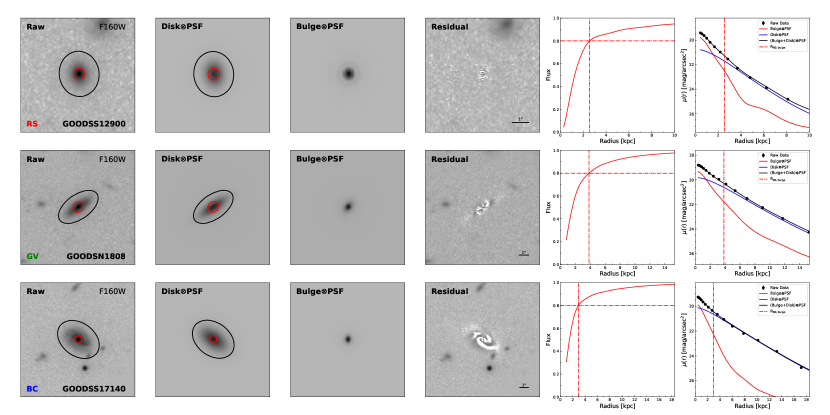
After obtaining the best-fitting results with both the two-component SerExp model and the single-component Sérsic model, we selected galaxies with the bulge-to-total ratios by the two-component SerExp model in both the F160W and F814W bands as our disk-dominated galaxies. Specially, for the galaxies with in either of these two bands, we instead used the fitting results by the single-component exponential disk model (Sérsic ) in the following analysis. Finally, we identify a total of 513 massive disk-dominated galaxies in all five CANDELS fields. Figure 1 presents the best fitting of GALFIT for three typical examples of RS, GV and BC galaxies (see Section 4 for classification), respectively. From left to right, panels in the first column show the raw images in F160W. Panels in the second and third columns show the disk and bulge components of two-component SerExp model, respectively. The black circles show the Kron apertures measured by SExtractor, and the red circles indicate the 80%-light radius of the bulge components (), accounting for 80% of the total bulge luminosities. Panels in the fouth column show the residual images after subtracting the two-component SerExp model from raw images. Panels in the last two columns show the growth curves of the bulge components and the comparisions between the observed and the best fitted radial profiles (PSF-convolved), respectively.
4 Classification of Disk Galaxies
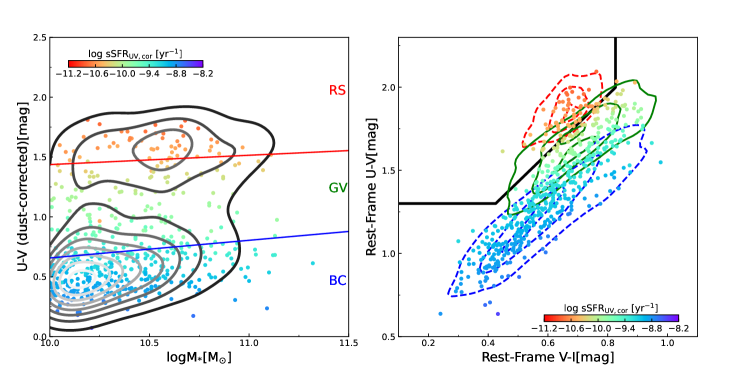
Green valley galaxies represent an important population that is likely to transition from the blue cloud to the red sequence phases. It has been known that two-color diagrams (e.g., or ) are not an effective tool to distinguish the GV from the RS and BC. In this work, we adopt the dust-corrected rest-frame color versus stellar mass diagram to divide our disk galaxies into RS, GV and BC sub-groups (Bell et al., 2004). Due to the different slopes of the color-stellar mass relations for RS and BC, we independently fit the best relations for RS and BC, and define GV galaxies as those that lie outside the 2-sigma distribution range of both populations. To determine the best-fit RS, we first fit the relation for all -selected, massive quiescent galaxies, and then exclude objects that are more than 2 away from the fit and repeat the fitting process until no new objects are excluded. For the BC, we opt to fit the relation for galaxies with , which are situated in close proximity to the star formation main sequence. The derived best-fit RS is as follow,
, and the best-fit BC is as follow,
where is equal to . The factor 0.49 is computed for the Calzetti et al. (2000) extinction law and the rest-frame Bessel filters. The best-fit RS and BC has a dispersion of 0.1013 and 0.1060 dex respectively.
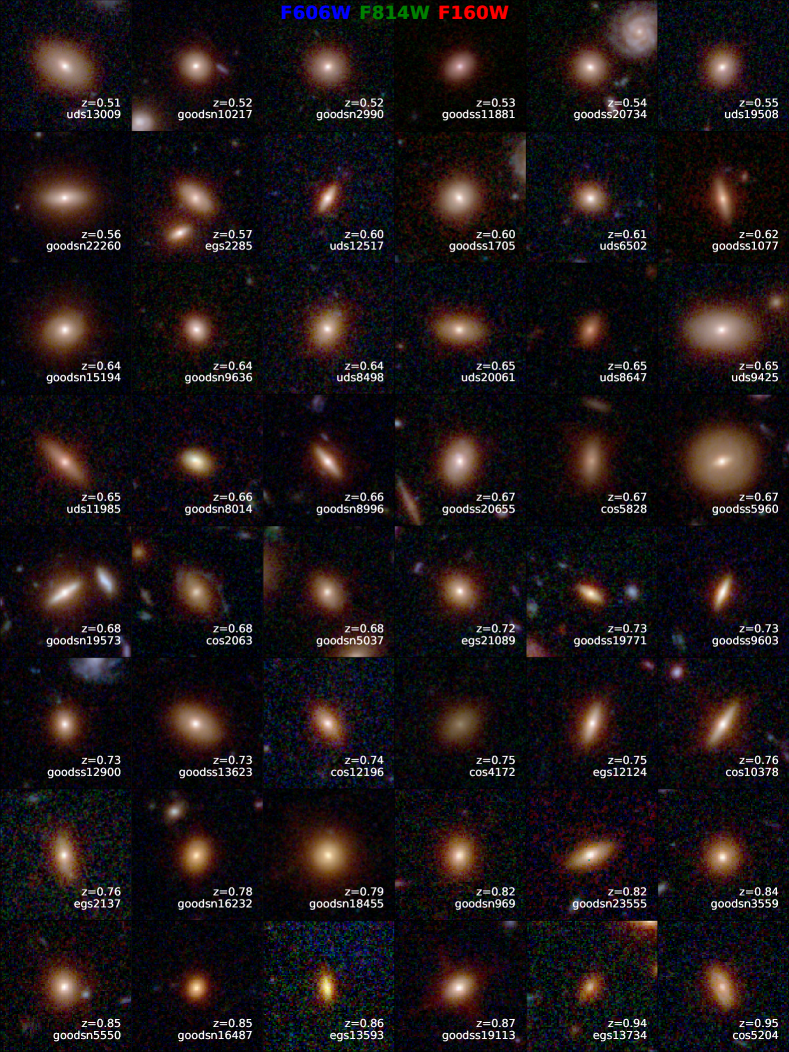
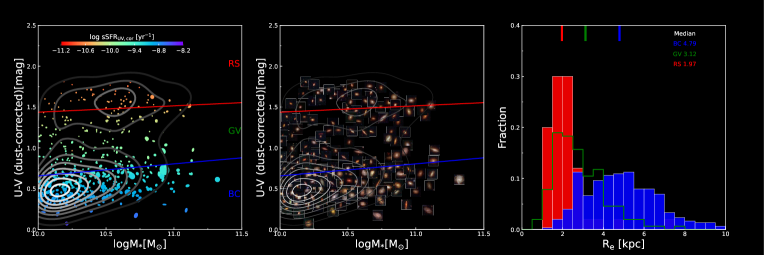
To quantify the relative star formation activity in galaxies, we offset 2 below the best-fit RS and 2 above the best-fit BC, as shown by red and blue solid lines in the left panel of Figure 2, respectively. Objects above the red line are classified as the RS, and those below the blue line are classified as the BC. Objects located in the region between the red and blue lines are defined as the GV. In the right panel of Figure 2, we also show the distributions of RS, GV and BC galaxies in the diagram as a contrast. It can be seen that the RS, GV and BC galaxies are mixed partly in the two-color space. The figure illustrates that the dust-corrected color versus stellar mass diagram is indeed a more effective tool to identify the transition population, compared to the two-color diagram. Finally, we obtain 48 RS, 156 GV and 309 BC disk galaxies, respectively. The color thumbnail images of 48 disk-dominated RS galaxies are displayed in Figure 3. The basic parameters of these 48 RS disk galaxies can be found in Table 2.
5 Measurement of UVI Color Profiles
We have measured the observed surface brightness profiles of sample galaxies in all WFC3/UVIS (F275W), ACS (F435W, F606W, F775W, F814W and F850LP) and WFC3/IR (F105W, F125W, F140W and F160W) bands, if available. The photometry was done by using the IRAF routine ellipse within STSDAS, which is based on a technique described by Jedrzejewski (1987). For the preliminary imaging reduction prior to multi-aperture photometry, we applied the same background-subtraction and noise-producing methods as described in Section 3 to reduce all band images of individual galaxies. We then performed PSF-matching for the individual images of each band (except the F160W) to the F160W using the PSF matching kernels generated by photutils. We fixed the galaxy geometric centers, ellipticities and position angles obtained from the GALFIT single-component Sérsic fitting on F160W band imaging for all available bands.
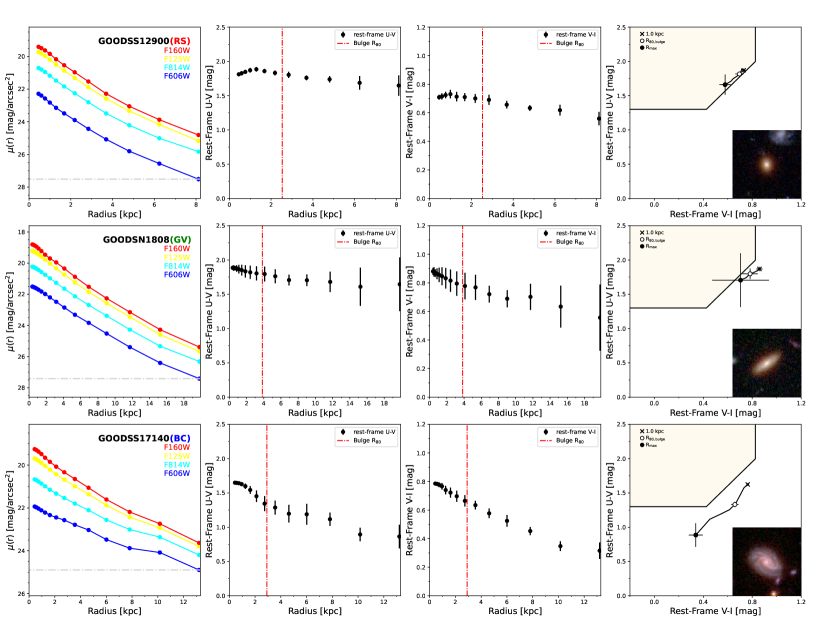
It is noted that the two GOODS fields (GOODS-N and GOODS-S) have more HST high-resolution imaging data than other three fields (COSMOS, EGS and UDS). The images only in F606W, F814W, F125W and F160W are available simultaneously for all five CANDELS fields. In order to obtain consistent rest-frame UVI colors in different CANDELS fields, we determine the empirical relations between the observed colors combined among these four HST bands and rest-frame UVI colors for our galaxies. The empirical relations were constructed by fiting rich data in the GOODS-N and GOODS-S fields, which enables more accurate measurement of rest-frame colors based on the modeling of the spectral energy distributions (SEDs) of galaxies (see AppendixB for details). In this analysis, we apply a uniform empirical relations for all galaxies within each narrow redshift bin. We convert the observed profiles in F606W, F814W, F125W and F160W to the rest-frame and color profiles for the sample galaxies in all five CANDELS fields. We have verified that our principal results remain unchanged when distinct empirical relations are applied to galaxies with low- and high-sSFR, respectively. Among four observed bands, the F606W band has the lowest in the outskirts. We thus restrict the maximum acceptable radii () for the profiles, where the surface brightness is equal to of the local sky background level in F606W. The mean values are 3.92, 3.48 and 2.85 for the RS, GV and BC, respectively. Figure 4 illustrates our measurement procedure for three typical examples of RS, GV and BC disk galaxies, respectively. Panels in the left column show the surface brightness profiles in four observed bands (F606W, F814W, F125W and F160W). Panels in the middle two column show the rest-frame and profiles determined using the empirical relations in AppendixB. Panels in the right column show the color profiles in the space, respectively.
6 Results and Analysis
6.1 Color gradients in RS disk galaxies
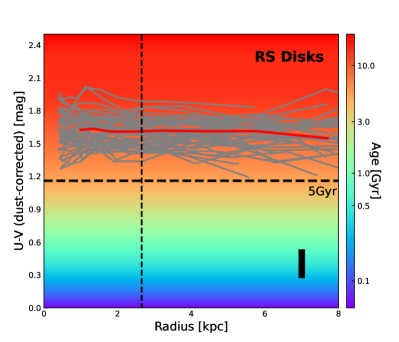
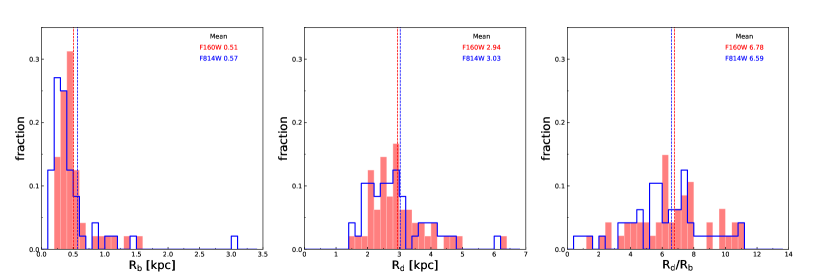
We have identified a sample of 48 massive disk-dominated RS galaxies at in CANDELS. In Figure 5, we show the distributions of bulge effective radii, disk effective radii and their ratios in the F814W and F160W bands for these galaxies, respectively. It can be seen that these RS disk galaxies generally have extended stellar disks ( on average) and tiny bulge components ( on average). To quantify the intrinsic color gradients, we infer both the sSFR and profiles to disentangle their effects on the raw dust-reddened color gradients of individual galaxies, applying the calibrations in AppendixA to our spatially resolved data. In Figure 6, we show the derived profiles of dust-corrected of individual RS disk galaxies. The median profile is presented in the red solid curve. In addition, we overplot the age track for a dust-free, , solar-metallicity stellar population model from Bruzual & Charlot (2003). It can be seen that these RS disk galaxies generally have intrinsically red colors and nearly flat color gradients. Both disk and bulge components have an old age. The findings indicate that disk-donimated RS galaxies generally consist of uniformly red and old stellar populations in both the disk and bulge components, and the disks have generally been completely quenched.
6.2 Comparisons with the GV and BC counterparts
We have confirmed that on average the disk components in disk-dominated RS galaxies are truely quiescent and have nearly flat color gradients. In consideration of their old stellar population and the intact disk morphology, it suggests that the star-forming progenitors of these galaxies probably consist of an extended disk and a small bulge (or nearly pure disk) as well, and the bulge growth should be negligible as they evolve. Otherwise, the buildup of larger, old bulges in the centers is likely to result in a structural transition from star-forming disks to quenched spheroids and/or larger color gradients. With the aim to understand this star formation quenching process, we make comparisions in the UVI color gradients and inferred sSFR gradients in different populations of disk-dominated galaxies (from the BC through the GV to the RS).
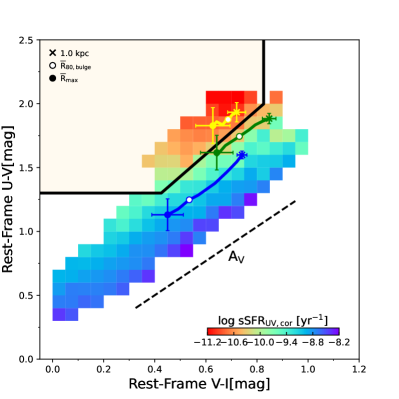
In Figure 7, we show raw stacked color trajectories in -space for the RS, GV and BC disk galaxies, respectively. The stacked color profiles are computed by taking the median colors after applying the 3-clipping at different physical radii. Three radial locations of 1 kpc, the average of the bulge components () and the average () are marked for each sub-group, respectively. As seen from the figure, the median colors of RS disk galaxies at all radii lie well within the quiescent region, whereas the median colors of BC disk galaxies at all radii lie well within the star-forming region. The median colors of GV disk galaxies at all radii lie close to the boundary that separates quiescent and star-forming galaxies.
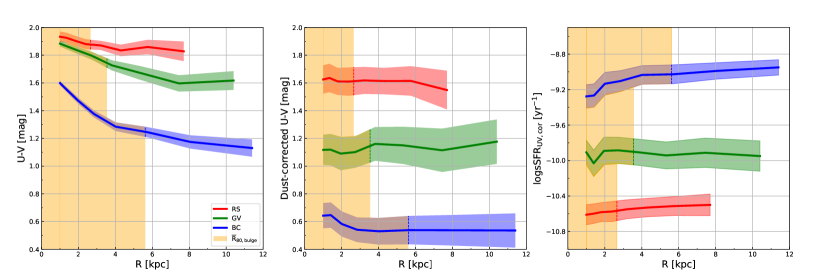
Adopting the calibrations in AppendixA, we convert olor trajectories to the stacked sSFR and profiles. In Figure 8, we show the raw dust-reddened profiles, the dust-corrected profiles and the sSFR profiles for the RS, GV and BC disk galaxies, respectively. It can be seen that the BC disk galaxies exhibit larger, negative color gradients than both the GV and RS disk galaxies in the dust-reddened profiles, due to significant amounts of dust reddening. After correcting for dust reddening, we find that all the disk-dominated BC, GV and RS galaxies generally have nearly flat or weak gradients in both the dust-corrected profiles and the sSFR profiles.
7 Discussion and Summary
A rare population of massive disk-dominated quiescent galaxies has recently drawn much attention, which intrudes the RS without destroying the underlying stellar disks. In this work, we have carefully identified a sample of 48 disk-dominated RS galaxies with between redshift 0.5 and 1.0 in all five CANDELS fields. These galaxies are well fitted by a two-component bulge plus disk model, and have the bulge-to-total ratio in the both F814W and F160W bands. We show that these disk-dominated RS galaxies generally consist of uniformly red and old stellar populations in both the disk and bulge components, and the disks have generally been completely quenched. To understand their possible origins, we have also identifed the control samples of 124 GV and 309 BC disk-dominated galaxies with the same selection criteria. We investigate the potential evolution of the stacked UVI color gradients and inferred sSFR gradients from the BC through the GV to the RS, out to the maximum acceptable radii (), where the surface brightness is equal to of the local sky background level in F606W (the average values, , are kpc, kpc and 11.4 kpc for the RS, GV and BC disks, respectively). After correcting for dust reddening, we find that all disk-dominated RS, GV and BC galaxies generally have nearly flat color profiles and sSFR profiles. We propose a potential formation mechanism that massive quiescent disk-dominated galaxies at moderate redshifts are predominantly formed via a process of secular disk fading.
Regarding the PSF-smearing effect, uncertainty of PSF matching, and error estimate in the measurement of color gradients, these have all been discussed in Liu et al. (2018) and Wang et al. (2017). We do not duplicate the descriptions here, and refer readers to these two papers for details. We have checked that our main results remain unchanged under the stacking by scaled radius (i.e., normalized by effective radius) rather than physical radius. The aim of displaying profiles in physical radius is to highlight a phenomenon that quenching is associated with a shrinkage in optical size, which is in agreement with previous studies (Pandya et al., 2017; Fang et al., 2018). The overall nearly flat sSFR profiles in the disk-dominated BC, GV and RS galaxies appear to be in tension with the shinkage in size. One potential explanation for this discrepancy is that the half-mass radii of star-forming galaxies are generally much smaller than their half-light radii, which has been confirmed in several studies (e.g., Szomoru et al., 2013; Suess et al., 2019; Miller et al., 2023). As previously noted, the average ratios of for our BC, GV, and RS disk galaxies are 2.85, 3.48, and 3.92, respectively. We exercise caution in acknowledging that we may be probing distinct regions within the three subcategories of galaxies. This could be another interpretation for the observed discrepancy. Future deeper observational images will aid in ascertaining whether these galaxies exhibit significant color gradients at larger radii.
GV galaxies are thought to be in the transition phase of galaxy evolution. In order to further understand this phase, we also investigate the similarites in structure between the disk-donimated GV and RS galaxies. In the left panel and middle panel of Figure 9, we again show the distributions of identified disk-dominated galaxies in the space of dust-corrected color versus stellar mass, but this time galaxies are coded by their structural parameters (i.e., effective radii, axis ratios and postion angles), and are shown with their color thumbnail images, respectively. We specially show the distributions of their effective radii in the right panel of Figure 9. As seen from these plots, the disk-dominated GV galaxies appear to have more similar structures to the RS than to the BC. This again supports that they are likely to be transitioning to form disk-dominated RS galaxies. This work is focus on the epoch of , which coresponds to an age interval of . At this epoch, quenching is expected to be a slow process, related with gas consumption in the star-forming disks (Fang et al., 2013; Barro et al., 2017). However, we still caution that some disk-dominated RS galaxies may form directly through highly dissipative events with significant angular monmentum at higher redshifts (McGrath et al., 2008; Fudamoto et al., 2022) , although quenching at higher redshifts is usually triggered by a compaction event that builds up a compact core (Barro et al., 2014, 2017).
It is noted that quiescent disks are likely a collection of several individual populations that are a product of different quenching mechanisms and effects. It is still far from well understood how massive quiescent disks formed, and how the star formaiton was quenched with intact disk morphology. This study is focused on the properties of disk-dominated RS galaxies and the probable origins of quiescent disks within them, excluding those RS disk galaxies dominated by bulges. We propose the possibility that the quenched disks in these galaxies could form through a process of secular disk fading. It has been observed that bulge-dominated RS disk galaxies are most likely to possess the substructures of strong bars and spirals (e.g., Guo et al., 2020; Bundy et al., 2010). Consequently, the cessation of star formation in bulge-dominated disk galaxies is likely to be strongly correlated with the bar instability and/or the development of large bulges. In contrast, it can be seen in Figure 3 that the disk-dominated RS galaxies generally exhibit relatively smooth morphology, lacking the features of distinct bars and spirals. Additionally, it is still observable in the middle panel of Figure 8 that there appears to be a negative color gradient as one transitions from the bulge to the disk in RS disk galaxies, with BC galaxies also exhibiting a slight gradient. This may suggest that the cessation of star formation in disk-dominated galaxies could also be marginally correlated with the growth of the bulge. Therefore, our current results only support the idea of strangulation or starvation, acknowledging that other mechanisms (e.g., central compaction and AGN feedback) might contribute, as an important part of the mechanisms that creates quiescent disks. In a subsequent work, we will investigate the properties of quiescent disks in bulge-dominated RS galaxies, and discuss various possible formation mechanisms with a spectroscopic sample including the JWST+HST multi-band imaging observations.
We thank anonymous referee for the insightful suggestions, which significantly helped us improve this paper. We thank Drs. Jian Ren, Man I. Lam, Jiao Li, Xin Zhang, Xianmin Meng and Juanjuan Ren for useful suggestions and discussions. This project is supported by the National Natural Science Foundation of China (NSFC grants Nos. 12273052, 11733006, 12090040, 12090041 and 12073051) and the science research grants from the China Manned Space Project (No. CMS-CSST-2021-A04).
Appendix A Recalibrations of Dust Extinction and specific Star Formation Rates
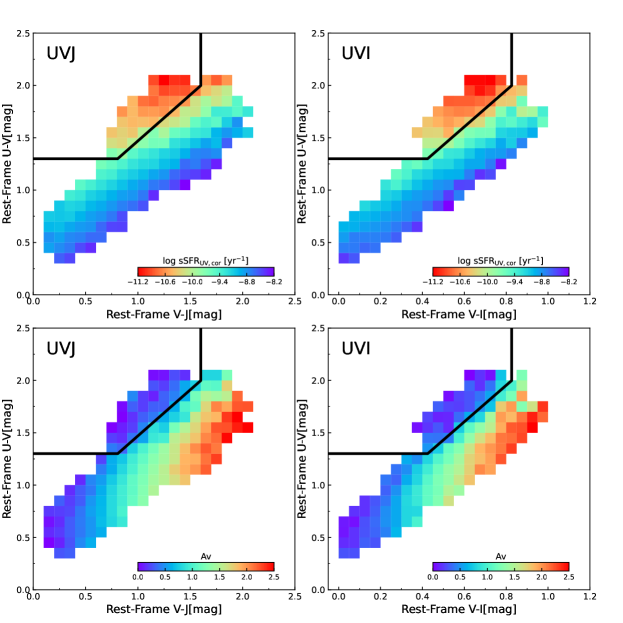
Rest-frame diagram has been widely used to separate quiescent from dusty/star-forming galaxies (e.g. Williams et al., 2009; Fang et al., 2018). It has also been successfully utilized to determine and sSFR values, which are broadly consistent with the values derived from fitting reddened stellar population models to broadband SEDs of galaxies covering UV to Infrared (Fang et al., 2018). Based on the data in two of the five CANDELS fields (GOODS-S and UDS), Wang et al. (2017) demonstrated that the rest-frame diagram is as useful as the diagram for distinguishing from sSFR, by replacing with a slightly bluer band. Wang et al. (2017) showed that sSFR and can be constrained using with an accuracy of 0.15 dex and 0.18 mag, respectively.
In this work, we revisit the calibrations of and sSFR using with enlarged sample of galaxies in CANDELS. In Figure 10, we show the distribution of a carefully-selected subsample of galaxies on the plane, as well as on for a comparison. Galaxies are selected after applying the cuts 1-3 with at in four of the five CANDELS fields (EGS, GOODS-N, GOODS-S and UDS). We find that the quality of CANDELS/COSMOS official photometry catalog is not as high as those of other four fields, and including it would not improve the accuracy of calibrations. We thus excluded the COSMOS data for the calibrations. As seen from the figure, the reproduces all the main features of , including the quiescent region and the distinctive stripe patterns of sSFR and , which is in agreement with the results initially presented by Wang et al. (2017). We divide each plane into 25 25 rectangular boxes and compute the median values of and sSFR in each box, assigning them to the box center. We then interpolate linearly among the nearest box centers to determine the corresponding and sSFR for any given location on the plane. As a result, this method enables us to estimate sSFR and using with an rms accuracy of dex and mag, which is slightly higher than that of Wang et al. (2017).
Appendix B Inprovements on Empirical Rest-frame UVI Colors
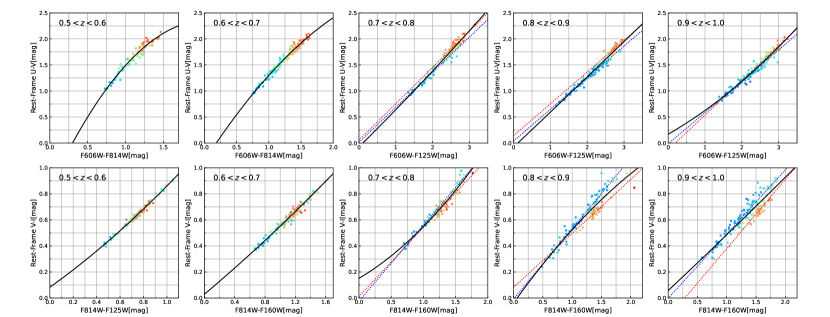
It should be noted that the two GOODS fields (GOODS-N and GOODS-S) have more HST high-resolution imaging data than other three fields (COSMOS, EGS and UDS), in which only , , and photometry is available. In order to derive rest-frame color profiles using multi-band aperture photometry and obtain consistent results for all five CANDELS fields, it is necessary to determine the empirical relations between rest-frame colors and observer-frame colors from the integrated photometry. Wang et al. (2017) have shown the robustness of rest-frame colors derived from , and that there are no systematic difference between the rest-frame colors derived from bands and those derived from the seven bands. However, the empirical relations derived by Wang et al. (2017) have relatively large scatters (see their Figure A1 and A2), partly due to the use of a bit broad redshift bins and all the five fields. In order to improve these empirical relations, we only exploit the GOODS-N and GOODS-S fields, which are more data-rich and enable more accurate measurement of rest-frame colors based on the modelingof the SEDs of galaxies. We measured fluxes in 10 bands (F275W, F435W, F606W, F775W, F814W, F850LP, F105W, F125W, F140W and F160W) for all galaxies obtained through cuts 1-9. Subsequently, we fit their SEDs with a fixed redshift to derive the rest-frame colors. We first perform a uniform fit for all galaxies within each narrow redshift bin. The fitting results are presented with solid lines in Figure 11. The typical scatter of our fittings is mag for rest-frame and mag for rest-frame , respectively. The fitting equations for each narrow redshift bin are given as follows:
For :
For :
For :
For :
For :
Although our fitted relations exhibit less scatter than those of Wang et al. (2017), it is still observed that certain features persist in the high redshift bins (z=0.7-1). Galaxies with low sSFR appear to follow slightly different relations compared to those with high sSFR. To estimate the potential impact of this difference, we additionally calculate the median of galaxies at to divide the sample galaxies into low-sSFR and high-sSFR subgroups. We present the best fits for the low-sSFR and high-sSFR galaxies separately, as indicated by the dotted lines in Figure 11. The fitting equations for low-sSFR and high-sSFR galaxies in the three high-redshift bins are as follows:
For :
low-sSFR:
high-sSFR:
For :
low-sSFR:
high-sSFR:
For :
low-sSFR:
high-sSFR:
References
- Akhlaghi & Ichikawa (2015) Akhlaghi, M., & Ichikawa, T. 2015, ApJS, 220, 1, doi: 10.1088/0067-0049/220/1/1
- Baldry et al. (2006) Baldry, I. K., Balogh, M. L., Bower, R. G., et al. 2006, MNRAS, 373, 469, doi: 10.1111/j.1365-2966.2006.11081.x
- Baldry et al. (2004) Baldry, I. K., Glazebrook, K., Brinkmann, J., et al. 2004, ApJ, 600, 681, doi: 10.1086/380092
- Barro et al. (2014) Barro, G., Faber, S. M., Pérez-González, P. G., et al. 2014, ApJ, 791, 52, doi: 10.1088/0004-637X/791/1/52
- Barro et al. (2017) Barro, G., Faber, S. M., Koo, D. C., et al. 2017, ApJ, 840, 47, doi: 10.3847/1538-4357/aa6b05
- Barro et al. (2019) Barro, G., Pérez-González, P. G., Cava, A., et al. 2019, ApJS, 243, 22, doi: 10.3847/1538-4365/ab23f2
- Bell et al. (2004) Bell, E. F., Wolf, C., Meisenheimer, K., et al. 2004, ApJ, 608, 752, doi: 10.1086/420778
- Blanton et al. (2003) Blanton, M. R., Hogg, D. W., Bahcall, N. A., et al. 2003, ApJ, 594, 186, doi: 10.1086/375528
- Brammer et al. (2008) Brammer, G. B., van Dokkum, P. G., & Coppi, P. 2008, ApJ, 686, 1503, doi: 10.1086/591786
- Brammer et al. (2009) Brammer, G. B., Whitaker, K. E., van Dokkum, P. G., et al. 2009, ApJ, 706, L173, doi: 10.1088/0004-637X/706/1/L173
- Bruce et al. (2014) Bruce, V. A., Dunlop, J. S., McLure, R. J., et al. 2014, MNRAS, 444, 1001, doi: 10.1093/mnras/stu1478
- Bruzual & Charlot (2003) Bruzual, G., & Charlot, S. 2003, MNRAS, 344, 1000, doi: 10.1046/j.1365-8711.2003.06897.x
- Bundy et al. (2010) Bundy, K., Scarlata, C., Carollo, C. M., et al. 2010, ApJ, 719, 1969, doi: 10.1088/0004-637X/719/2/1969
- Calzetti et al. (2000) Calzetti, D., Armus, L., Bohlin, R. C., et al. 2000, ApJ, 533, 682, doi: 10.1086/308692
- Chabrier (2003) Chabrier, G. 2003, PASP, 115, 763, doi: 10.1086/376392
- Cortese (2012) Cortese, L. 2012, A&A, 543, A132, doi: 10.1051/0004-6361/201219443
- Croton et al. (2006) Croton, D. J., Springel, V., White, S. D. M., et al. 2006, MNRAS, 365, 11, doi: 10.1111/j.1365-2966.2005.09675.x
- Dahlen et al. (2013) Dahlen, T., Mobasher, B., Faber, S. M., et al. 2013, ApJ, 775, 93, doi: 10.1088/0004-637X/775/2/93
- Dekel & Birnboim (2006) Dekel, A., & Birnboim, Y. 2006, MNRAS, 368, 2, doi: 10.1111/j.1365-2966.2006.10145.x
- Dekel & Burkert (2014) Dekel, A., & Burkert, A. 2014, MNRAS, 438, 1870, doi: 10.1093/mnras/stt2331
- Dressler et al. (1999) Dressler, A., Smail, I., Poggianti, B. M., et al. 1999, ApJS, 122, 51, doi: 10.1086/313213
- Driver et al. (2007) Driver, S. P., Popescu, C. C., Tuffs, R. J., et al. 2007, MNRAS, 379, 1022, doi: 10.1111/j.1365-2966.2007.11862.x
- Faber (2011) Faber, S. 2011, The Cosmic Assembly Near-IR Deep Extragalactic Legacy Survey (”CANDELS”), STScI/MAST, doi: 10.17909/T94S3X
- Faber et al. (2007) Faber, S. M., Willmer, C. N. A., Wolf, C., et al. 2007, ApJ, 665, 265, doi: 10.1086/519294
- Fabian (2012) Fabian, A. C. 2012, ARA&A, 50, 455, doi: 10.1146/annurev-astro-081811-125521
- Fang et al. (2013) Fang, J. J., Faber, S. M., Koo, D. C., & Dekel, A. 2013, ApJ, 776, 63, doi: 10.1088/0004-637X/776/1/63
- Fang et al. (2018) Fang, J. J., Faber, S. M., Koo, D. C., et al. 2018, ApJ, 858, 100, doi: 10.3847/1538-4357/aabcba
- Fraser-McKelvie et al. (2016) Fraser-McKelvie, A., Brown, M. J. I., Pimbblet, K. A., et al. 2016, MNRAS, 462, L11, doi: 10.1093/mnrasl/slw117
- Fudamoto et al. (2022) Fudamoto, Y., Inoue, A. K., & Sugahara, Y. 2022, The Astrophysical Journal Letters, 938, L24, doi: 10.3847/2041-8213/ac982b
- Galametz et al. (2013) Galametz, A., Grazian, A., Fontana, A., et al. 2013, ApJS, 206, 10, doi: 10.1088/0067-0049/206/2/10
- Geach et al. (2014) Geach, J. E., Hickox, R. C., Diamond-Stanic, A. M., et al. 2014, Nature, 516, 68, doi: 10.1038/nature14012
- Geha et al. (2012) Geha, M., Blanton, M. R., Yan, R., & Tinker, J. L. 2012, ApJ, 757, 85, doi: 10.1088/0004-637X/757/1/85
- Genzel et al. (2014) Genzel, R., Förster Schreiber, N. M., Lang, P., et al. 2014, ApJ, 785, 75, doi: 10.1088/0004-637X/785/1/75
- Grogin et al. (2011) Grogin, N. A., Kocevski, D. D., Faber, S. M., et al. 2011, ApJS, 197, 35, doi: 10.1088/0067-0049/197/2/35
- Guo et al. (2020) Guo, R., Hao, C.-N., Xia, X., et al. 2020, ApJ, 897, 162, doi: 10.3847/1538-4357/ab9b75
- Guo et al. (2013) Guo, Y., Ferguson, H. C., Giavalisco, M., et al. 2013, ApJS, 207, 24, doi: 10.1088/0067-0049/207/2/24
- Guo et al. (2017) Guo, Y., Bell, E. F., Lu, Y., et al. 2017, ApJ, 841, L22, doi: 10.3847/2041-8213/aa70e9
- Hao et al. (2019) Hao, C.-N., Shi, Y., Chen, Y., et al. 2019, ApJ, 883, L36, doi: 10.3847/2041-8213/ab42e5
- Harrison (2017) Harrison, C. M. 2017, Nature Astronomy, 1, 0165, doi: 10.1038/s41550-017-0165
- Hopkins et al. (2008) Hopkins, P. F., Hernquist, L., Cox, T. J., & Kereš, D. 2008, ApJS, 175, 356, doi: 10.1086/524362
- Ilbert et al. (2010) Ilbert, O., Salvato, M., Le Floc’h, E., et al. 2010, in SF2A-2010: Proceedings of the Annual meeting of the French Society of Astronomy and Astrophysics, ed. S. Boissier, M. Heydari-Malayeri, R. Samadi, & D. Valls-Gabaud, 355
- Jedrzejewski (1987) Jedrzejewski, R. I. 1987, MNRAS, 226, 747, doi: 10.1093/mnras/226.4.747
- Kauffmann et al. (2004) Kauffmann, G., White, S. D. M., Heckman, T. M., et al. 2004, MNRAS, 353, 713, doi: 10.1111/j.1365-2966.2004.08117.x
- Kauffmann et al. (2003) Kauffmann, G., Heckman, T. M., White, S. D. M., et al. 2003, MNRAS, 341, 54, doi: 10.1046/j.1365-8711.2003.06292.x
- Kennicutt & Evans (2012) Kennicutt, R. C., & Evans, N. J. 2012, ARA&A, 50, 531, doi: 10.1146/annurev-astro-081811-125610
- Kesseli et al. (2014) Kesseli, A., McGrath, E. J., & CANDELS Collaboration. 2014, in American Astronomical Society Meeting Abstracts, Vol. 223, American Astronomical Society Meeting Abstracts #223, 145.15
- Koekemoer et al. (2011) Koekemoer, A. M., Faber, S. M., Ferguson, H. C., et al. 2011, ApJS, 197, 36, doi: 10.1088/0067-0049/197/2/36
- Kriek et al. (2009) Kriek, M., van Dokkum, P. G., Labbé, I., et al. 2009, ApJ, 700, 221, doi: 10.1088/0004-637X/700/1/221
- Larson et al. (1980) Larson, R. B., Tinsley, B. M., & Caldwell, C. N. 1980, ApJ, 237, 692, doi: 10.1086/157917
- Liu et al. (2016) Liu, F. S., Jiang, D., Guo, Y., et al. 2016, ApJ, 822, L25, doi: 10.3847/2041-8205/822/2/L25
- Liu et al. (2018) Liu, F. S., Jia, M., Yesuf, H. M., et al. 2018, ApJ, 860, 60, doi: 10.3847/1538-4357/aac20d
- Mahajan & Raychaudhury (2009) Mahajan, S., & Raychaudhury, S. 2009, MNRAS, 400, 687, doi: 10.1111/j.1365-2966.2009.15512.x
- Mahajan et al. (2020) Mahajan, S., Gupta, K. K., Rana, R., et al. 2020, MNRAS, 491, 398, doi: 10.1093/mnras/stz2993
- Martig et al. (2009) Martig, M., Bournaud, F., Teyssier, R., & Dekel, A. 2009, ApJ, 707, 250, doi: 10.1088/0004-637X/707/1/250
- Masters et al. (2010a) Masters, K. L., Nichol, R., Bamford, S., et al. 2010a, MNRAS, 404, 792, doi: 10.1111/j.1365-2966.2010.16335.x
- Masters et al. (2010b) Masters, K. L., Mosleh, M., Romer, A. K., et al. 2010b, MNRAS, 405, 783, doi: 10.1111/j.1365-2966.2010.16503.x
- McGrath et al. (2008) McGrath, E. J., Stockton, A., Canalizo, G., Iye, M., & Maihara, T. 2008, ApJ, 682, 303, doi: 10.1086/589631
- Mihos & Hernquist (1996) Mihos, J. C., & Hernquist, L. 1996, ApJ, 464, 641, doi: 10.1086/177353
- Miller et al. (2023) Miller, T. B., van Dokkum, P., & Mowla, L. 2023, ApJ, 945, 155, doi: 10.3847/1538-4357/acbc74
- Momcheva et al. (2016) Momcheva, I. G., Brammer, G. B., van Dokkum, P. G., et al. 2016, ApJS, 225, 27, doi: 10.3847/0067-0049/225/2/27
- Moran et al. (2006) Moran, S. M., Ellis, R. S., Treu, T., et al. 2006, ApJ, 641, L97, doi: 10.1086/504078
- Morris et al. (2015) Morris, A. M., Kocevski, D. D., Trump, J. R., et al. 2015, AJ, 149, 178, doi: 10.1088/0004-6256/149/6/178
- Nayyeri et al. (2017) Nayyeri, H., Hemmati, S., Mobasher, B., et al. 2017, ApJS, 228, 7, doi: 10.3847/1538-4365/228/1/7
- Pandya et al. (2017) Pandya, V., Brennan, R., Somerville, R. S., et al. 2017, MNRAS, 472, 2054, doi: 10.1093/mnras/stx2027
- Papovich et al. (2018) Papovich, C., Kawinwanichakij, L., Quadri, R. F., et al. 2018, ApJ, 854, 30, doi: 10.3847/1538-4357/aaa766
- Peng et al. (2002) Peng, C. Y., Ho, L. C., Impey, C. D., & Rix, H.-W. 2002, AJ, 124, 266, doi: 10.1086/340952
- Peng et al. (2015) Peng, Y., Maiolino, R., & Cochrane, R. 2015, Nature, 521, 192, doi: 10.1038/nature14439
- Peng et al. (2012) Peng, Y.-j., Lilly, S. J., Renzini, A., & Carollo, M. 2012, ApJ, 757, 4, doi: 10.1088/0004-637X/757/1/4
- Poggianti et al. (1999) Poggianti, B. M., Smail, I., Dressler, A., et al. 1999, ApJ, 518, 576, doi: 10.1086/307322
- Santini et al. (2015) Santini, P., Ferguson, H. C., Fontana, A., et al. 2015, ApJ, 801, 97, doi: 10.1088/0004-637X/801/2/97
- Shimakawa et al. (2022) Shimakawa, R., Tanaka, M., Bottrell, C., et al. 2022, PASJ, 74, 612, doi: 10.1093/pasj/psac023
- Stefanon et al. (2017) Stefanon, M., Yan, H., Mobasher, B., et al. 2017, ApJS, 229, 32, doi: 10.3847/1538-4365/aa66cb
- Stockton et al. (2008) Stockton, A., McGrath, E., Canalizo, G., Iye, M., & Maihara, T. 2008, ApJ, 672, 146, doi: 10.1086/523789
- Suess et al. (2019) Suess, K. A., Kriek, M., Price, S. H., & Barro, G. 2019, ApJ, 885, L22, doi: 10.3847/2041-8213/ab4db3
- Szomoru et al. (2013) Szomoru, D., Franx, M., van Dokkum, P. G., et al. 2013, ApJ, 763, 73, doi: 10.1088/0004-637X/763/2/73
- Tacchella et al. (2016) Tacchella, S., Dekel, A., Carollo, C. M., et al. 2016, MNRAS, 458, 242, doi: 10.1093/mnras/stw303
- Tojeiro et al. (2013) Tojeiro, R., Masters, K. L., Richards, J., et al. 2013, MNRAS, 432, 359, doi: 10.1093/mnras/stt484
- Valentijn (1990) Valentijn, E. A. 1990, Nature, 346, 153, doi: 10.1038/346153a0
- van den Bergh (1976) van den Bergh, S. 1976, ApJ, 206, 883, doi: 10.1086/154452
- van der Wel et al. (2011) van der Wel, A., Rix, H.-W., Wuyts, S., et al. 2011, ApJ, 730, 38, doi: 10.1088/0004-637X/730/1/38
- van der Wel et al. (2012) van der Wel, A., Bell, E. F., Häussler, B., et al. 2012, ApJS, 203, 24, doi: 10.1088/0067-0049/203/2/24
- Wang et al. (2017) Wang, W., Faber, S. M., Liu, F. S., et al. 2017, MNRAS, 469, 4063, doi: 10.1093/mnras/stx1148
- Whitaker et al. (2017) Whitaker, K. E., Bezanson, R., van Dokkum, P. G., et al. 2017, ApJ, 838, 19, doi: 10.3847/1538-4357/aa6258
- Williams et al. (2009) Williams, R. J., Quadri, R. F., Franx, M., van Dokkum, P., & Labbé, I. 2009, ApJ, 691, 1879, doi: 10.1088/0004-637X/691/2/1879
- Xu et al. (2021) Xu, K., Liu, C., Jing, Y., Sawicki, M., & Gwyn, S. 2021, Science China Physics, Mechanics, and Astronomy, 64, 279811, doi: 10.1007/s11433-020-1667-0
- Zhang et al. (2019) Zhang, C., Peng, Y., Ho, L. C., et al. 2019, ApJ, 884, L52, doi: 10.3847/2041-8213/ab4ae4
- Zhou et al. (2021) Zhou, S., Li, C., Hao, C.-N., et al. 2021, ApJ, 916, 38, doi: 10.3847/1538-4357/ac06cc
- Zolotov et al. (2015) Zolotov, A., Dekel, A., Mandelker, N., et al. 2015, MNRAS, 450, 2327, doi: 10.1093/mnras/stv740
| Field | ID | RA | DEC | zbest | |||||||||||||||||||
|---|---|---|---|---|---|---|---|---|---|---|---|---|---|---|---|---|---|---|---|---|---|---|---|
| (degree) | (degree) | () | (mag) | (arcsec) | (degree) | (mag) | (arcsec) | (degree) | (mag) | (arcsec) | (degree) | (mag) | (arcsec) | (degree) | |||||||||
| COSMOS | 2063 | 150.092551 | 2.203012 | 0.68 | 10.64 | 21.99 | 0.58 | 0.55 | 30.35 | 22.67 | 0.09 | 0.66 | -50.92 | 1.21 | 20.79 | 0.50 | 0.57 | 31.39 | 21.27 | 0.08 | 0.67 | -56.08 | 1.11 |
| COSMOS | 4172 | 150.060340 | 2.225983 | 0.75 | 10.74 | 21.58 | 0.43 | 0.73 | -50.24 | 23.82 | 0.05 | 0.58 | 70.20 | 1.80 | 20.36 | 0.42 | 0.72 | -48.96 | 22.47 | 0.04 | 0.50 | 64.30 | 2.81 |
| COSMOS | 5204 | 150.145050 | 2.239186 | 0.95 | 10.64 | 22.45 | 0.53 | 0.47 | 19.51 | 23.98 | 0.14 | 0.59 | 15.72 | 8.00 | 20.92 | 0.43 | 0.47 | 21.28 | 23.09 | 0.03 | 0.12 | 26.09 | 4.47 |
| COSMOS | 5828 | 150.195351 | 2.246359 | 0.67 | 10.81 | 21.14 | 0.42 | 0.40 | -4.41 | 22.75 | 0.09 | 0.68 | -75.40 | 8.00 | 19.91 | 0.37 | 0.45 | -4.98 | 21.71 | 0.05 | 0.58 | -84.28 | 0.50 |
| COSMOS | 10378 | 150.118156 | 2.302016 | 0.76 | 10.81 | 21.59 | 0.45 | 0.21 | -32.35 | 22.42 | 0.07 | 0.62 | -27.94 | 0.85 | 20.41 | 0.44 | 0.22 | -33.21 | 21.30 | 0.06 | 0.87 | -46.79 | 0.50 |
| COSMOS | 12196 | 150.062499 | 2.323891 | 0.74 | 10.54 | 22.43 | 0.43 | 0.54 | 37.19 | 23.11 | 0.05 | 0.52 | 47.61 | 2.36 | 21.08 | 0.40 | 0.54 | 36.82 | 21.84 | 0.06 | 0.53 | 58.68 | 1.33 |
| EGS | 2137 | 214.824035 | 52.734187 | 0.76 | 10.65 | 22.24 | 0.58 | 0.41 | 9.33 | 23.00 | 0.05 | 0.71 | -19.81 | 1.13 | 20.98 | 0.54 | 0.40 | 11.07 | 21.46 | 0.05 | 0.60 | -30.41 | 2.58 |
| EGS | 2285 | 215.055783 | 52.898627 | 0.57 | 10.50 | 21.48 | 0.45 | 0.58 | 49.75 | 23.56 | 0.08 | 0.55 | -14.03 | 0.55 | 20.68 | 0.42 | 0.54 | 48.72 | 21.21 | 0.18 | 0.61 | 43.81 | 1.68 |
| EGS | 12124 | 215.143248 | 53.015315 | 0.75 | 10.67 | 22.08 | 0.43 | 0.28 | -17.35 | 22.85 | 0.06 | 0.64 | -32.25 | 6.13 | 20.71 | 0.39 | 0.30 | -17.81 | 21.57 | 0.04 | 0.60 | -14.59 | 8.00 |
| EGS | 13593 | 214.772904 | 52.762324 | 0.86 | 10.10 | 23.82 | 0.33 | 0.37 | 6.90 | 25.98 | 0.12 | 0.24 | -0.55 | 0.50 | 22.55 | 0.37 | 0.42 | 5.35 | 23.16 | 0.18 | 0.21 | 8.90 | 0.77 |
| EGS | 13734 | 214.677786 | 52.695180 | 0.94 | 10.40 | 23.97 | 0.39 | 0.47 | -34.04 | 25.25 | 0.06 | 0.08 | -28.26 | 0.92 | 22.19 | 0.31 | 0.51 | -35.05 | 23.59 | 0.09 | 0.18 | -14.74 | 0.50 |
| EGS | 21089 | 215.153549 | 53.069605 | 0.72 | 10.43 | 22.21 | 0.36 | 42.88 | 0.79 | 23.03 | 0.05 | 0.67 | 24.79 | 0.50 | 21.00 | 0.36 | 0.80 | 38.44 | 21.64 | 0.05 | 0.75 | 52.44 | 0.50 |
| GOODSN | 969 | 189.203040 | 62.128785 | 0.82 | 10.74 | 22.32 | 0.36 | 0.74 | -4.76 | 23.33 | 0.09 | 0.62 | -41.85 | 0.95 | 20.90 | 0.37 | 0.71 | -6.02 | 21.61 | 0.08 | 0.69 | -57.03 | 0.77 |
| GOODSN | 2990 | 189.120080 | 62.156421 | 0.52 | 10.39 | 21.57 | 0.45 | 0.87 | 69.09 | 22.22 | 0.06 | 0.57 | -44.77 | 1.22 | 20.59 | 0.46 | 0.91 | 68.66 | 21.04 | 0.05 | 0.61 | -71.28 | 2.38 |
| GOODSN | 3559 | 189.073042 | 62.162753 | 0.84 | 10.61 | 22.61 | 0.40 | 0.94 | -44.50 | 23.19 | 0.05 | 0.74 | 0.67 | 0.86 | 21.24 | 0.41 | 0.89 | -51.43 | 21.81 | 0.05 | 0.80 | 47.25 | 0.50 |
| GOODSN | 5037 | 189.031491 | 62.176330 | 0.68 | 10.51 | 22.12 | 0.41 | 0.69 | 23.69 | 22.69 | 0.05 | 0.58 | -24.51 | 0.97 | 21.02 | 0.40 | 0.69 | 26.84 | 21.48 | 0.06 | 0.65 | -24.12 | 0.52 |
| GOODSN | 5550 | 189.017861 | 62.180545 | 0.85 | 10.61 | 21.96 | 0.30 | 0.85 | 15.74 | 22.82 | 0.05 | 0.30 | -38.67 | 0.50 | 20.88 | 0.33 | 0.82 | 13.21 | 21.58 | 0.06 | 0.45 | -49.95 | 0.50 |
| GOODSN | 8014 | 189.380631 | 62.197958 | 0.66 | 10.05 | 22.57 | 0.33 | 0.69 | 56.81 | 23.95 | 0.18 | 0.23 | 78.63 | 1.43 | 21.39 | 0.30 | 0.64 | 66.05 | 22.78 | 0.08 | 0.42 | 60.88 | 1.15 |
| GOODSN | 8996 | 189.280274 | 62.203887 | 0.66 | 10.41 | 22.20 | 0.37 | 0.22 | 40.65 | 22.95 | 0.04 | 0.76 | 48.04 | 1.87 | 21.07 | 0.35 | 0.23 | 40.14 | 21.85 | 0.05 | 0.81 | 68.14 | 0.50 |
| GOODSN | 9636 | 188.984243 | 62.208232 | 0.64 | 10.19 | 21.68 | 0.25 | 0.75 | 31.45 | 22.43 | 0.03 | 0.34 | 62.37 | 1.55 | 20.79 | 0.25 | 0.75 | 24.63 | 21.75 | 0.05 | 0.06 | 66.52 | 1.59 |
| GOODSN | 10217 | 189.115841 | 62.211309 | 0.52 | 10.40 | 21.60 | 0.39 | 0.93 | 49.71 | 22.33 | 0.05 | 0.63 | -56.95 | 0.60 | 20.53 | 0.37 | 0.92 | 38.92 | 21.20 | 0.06 | 0.52 | -62.34 | 0.50 |
| GOODSN | 15194 | 189.103741 | 62.244090 | 0.64 | 10.68 | 21.64 | 0.47 | 0.81 | -82.56 | 22.38 | 0.07 | 0.79 | -13.89 | 1.18 | 20.45 | 0.46 | 0.82 | -80.92 | 21.07 | 0.07 | 0.88 | -12.97 | 0.91 |
| GOODSN | 16232 | 189.081045 | 62.251542 | 0.78 | 10.48 | 22.49 | 0.36 | 0.77 | -16.65 | 24.06 | 0.05 | 0.37 | -34.87 | 0.56 | 21.20 | 0.33 | 0.76 | -14.01 | 22.50 | 0.05 | 0.13 | -33.09 | 0.50 |
| GOODSN | 16487 | 189.149117 | 62.253903 | 0.85 | 10.12 | 23.36 | 0.22 | 0.78 | -11.52 | 24.78 | 0.05 | 0.38 | -43.26 | 0.50 | 22.08 | 0.21 | 0.79 | -10.23 | 23.18 | 0.03 | 0.06 | -40.31 | 5.39 |
| GOODSN | 18455 | 189.202558 | 62.264619 | 0.79 | 10.80 | 21.60 | 0.36 | 0.95 | -15.99 | 23.38 | 0.06 | 0.62 | 40.39 | 0.71 | 20.44 | 0.35 | 0.96 | -23.97 | 22.19 | 0.06 | 0.72 | 35.45 | 0.50 |
| GOODSN | 19573 | 189.088501 | 62.271780 | 0.68 | 10.61 | 21.45 | 0.45 | 0.18 | -56.08 | 22.46 | 0.45 | 0.43 | 28.55 | 8.00 | 20.33 | 0.38 | 0.19 | -56.31 | 21.32 | 0.15 | 0.70 | 31.16 | 8.00 |
| GOODSN | 22260 | 189.158314 | 62.291434 | 0.56 | 10.66 | 21.05 | 0.51 | 0.42 | -84.96 | 22.41 | 0.04 | 0.65 | -72.78 | 0.84 | 19.92 | 0.50 | 0.42 | -85.24 | 21.18 | 0.04 | 0.72 | -66.79 | 0.94 |
| GOODSN | 23555 | 189.093608 | 62.307940 | 0.82 | 10.46 | 22.40 | 0.50 | 0.39 | -65.99 | 23.17 | 0.10 | 0.46 | -64.04 | 1.32 | 21.03 | 0.48 | 0.39 | -67.14 | 21.79 | 0.11 | 0.11 | -53.28 | 0.80 |
| GOODSS | 1077 | 53.177959 | -27.917692 | 0.62 | 10.53 | 21.62 | 0.36 | 0.24 | 14.04 | 22.32 | 0.04 | 0.64 | 15.88 | 0.50 | 20.45 | 0.34 | 0.23 | 13.73 | 21.16 | 0.04 | 0.17 | 47.25 | 0.50 |
| GOODSS | 1705 | 53.203255 | -27.904933 | 0.60 | 10.57 | 21.35 | 0.41 | 0.89 | -44.71 | 22.32 | 0.10 | 0.44 | 35.96 | 2.85 | 20.14 | 0.43 | 0.89 | -46.97 | 20.91 | 0.09 | 0.44 | 31.56 | 1.94 |
| GOODSS | 5960 | 53.062416 | -27.857515 | 0.67 | 10.84 | 21.10 | 0.94 | 0.92 | -76.15 | 21.98 | 0.15 | 0.43 | -69.68 | 2.22 | 19.86 | 0.90 | 0.91 | -70.95 | 20.69 | 0.14 | 0.44 | -72.97 | 1.57 |
| GOODSS | 9603 | 53.120834 | -27.823062 | 0.73 | 10.24 | 22.98 | 0.30 | 0.12 | -23.68 | 23.92 | 0.30 | 0.50 | -21.77 | 1.06 | 21.80 | 0.29 | 0.11 | -23.16 | 22.27 | 0.21 | 0.45 | -23.67 | 1.43 |
| GOODSS | 11881 | 53.190754 | -27.803579 | 0.53 | 10.15 | 21.94 | 0.37 | 0.73 | -53.51 | 22.82 | 0.04 | 0.58 | -43.62 | 0.50 | 20.88 | 0.35 | 0.72 | -52.65 | 21.74 | 0.03 | 0.82 | -75.40 | 2.73 |
| GOODSS | 12900 | 53.078293 | -27.795719 | 0.73 | 10.32 | 22.78 | 0.30 | 0.71 | 7.76 | 23.68 | 0.03 | 0.89 | 22.92 | 0.61 | 21.58 | 0.33 | 0.71 | 6.11 | 22.15 | 0.06 | 0.64 | 17.12 | 0.50 |
| GOODSS | 13623 | 53.068878 | -27.790901 | 0.73 | 10.63 | 21.90 | 0.58 | 0.62 | 59.41 | 22.46 | 0.07 | 0.79 | 79.41 | 1.34 | 20.72 | 0.56 | 0.62 | 59.89 | 21.27 | 0.06 | 0.95 | 80.86 | 0.81 |
| GOODSS | 19113 | 53.036057 | -27.750505 | 0.87 | 10.85 | 21.67 | 0.26 | 0.70 | -55.59 | 22.59 | 0.05 | 0.29 | -61.86 | 0.57 | 20.55 | 0.26 | 0.69 | -56.08 | 21.35 | 0.07 | 0.27 | 83.01 | 0.50 |
| GOODSS | 19771 | 53.172154 | -27.743362 | 0.73 | 10.19 | 23.22 | 0.30 | 0.35 | 58.90 | 24.83 | 0.03 | 0.47 | -66.86 | 8.00 | 21.95 | 0.27 | 0.32 | 59.33 | 22.79 | 0.04 | 0.75 | 13.95 | 7.87 |
| GOODSS | 20655 | 53.140907 | -27.736114 | 0.67 | 10.52 | 21.63 | 0.53 | 0.67 | -19.69 | 22.88 | 0.07 | 0.56 | 11.66 | 2.14 | 20.45 | 0.51 | 0.69 | -19.60 | 21.61 | 0.08 | 0.66 | 18.32 | 0.60 |
| GOODSS | 20734 | 53.190987 | -27.735471 | 0.54 | 10.28 | 21.79 | 0.41 | 0.94 | 67.03 | 22.52 | 0.06 | 0.61 | 67.08 | 1.79 | 20.76 | 0.39 | 0.97 | 45.78 | 21.50 | 0.06 | 0.56 | 64.77 | 1.37 |
| UDS | 6502 | 34.424271 | -5.240068 | 0.61 | 10.30 | 22.34 | 0.34 | 0.86 | 74.80 | 23.09 | 0.06 | 0.89 | 65.65 | 1.25 | 21.13 | 0.30 | 0.88 | 68.72 | 22.05 | 0.05 | 0.89 | -81.33 | 0.88 |
| UDS | 8498 | 34.432415 | -5.230028 | 0.64 | 10.60 | 21.84 | 0.52 | 0.71 | -23.55 | 22.98 | 0.07 | 0.66 | 53.18 | 1.20 | 20.74 | 0.49 | 0.66 | -26.96 | 21.45 | 0.06 | 0.53 | 46.44 | 3.82 |
| UDS | 8647 | 34.402882 | -5.228114 | 0.65 | 10.17 | 22.58 | 0.33 | 0.58 | -23.87 | 23.41 | 0.06 | 0.42 | -27.54 | 0.81 | 21.51 | 0.31 | 0.55 | -24.76 | 22.32 | 0.06 | 0.41 | -24.63 | 0.50 |
| UDS | 9425 | 34.397026 | -5.225145 | 0.65 | 10.97 | 20.36 | 0.72 | 0.64 | -89.50 | 21.19 | 0.09 | 0.61 | -69.23 | 3.36 | 19.24 | 0.69 | 0.64 | -88.26 | 20.23 | 0.07 | 0.75 | -60.75 | 1.49 |
| UDS | 11985 | 34.379379 | -5.210411 | 0.65 | 10.53 | 21.91 | 0.64 | 0.31 | 46.14 | 22.45 | 0.06 | 0.88 | 63.52 | 1.18 | 20.72 | 0.64 | 0.30 | 45.54 | 21.16 | 0.06 | 0.90 | 78.02 | 1.10 |
| UDS | 12517 | 34.372631 | -5.207050 | 0.60 | 10.25 | 22.48 | 0.34 | 0.27 | -29.69 | 23.42 | 0.05 | 0.78 | -42.03 | 2.36 | 21.29 | 0.31 | 0.22 | -30.78 | 21.98 | 0.07 | 0.78 | 17.87 | 5.89 |
| UDS | 13009 | 34.235287 | -5.205592 | 0.51 | 10.68 | 20.87 | 0.83 | 0.66 | 57.92 | 21.42 | 0.12 | 0.56 | 46.77 | 2.49 | 19.70 | 0.78 | 0.66 | 57.75 | 20.37 | 0.11 | 0.54 | 40.27 | 1.89 |
| UDS | 19508 | 34.376335 | -5.169682 | 0.55 | 10.36 | 21.81 | 0.46 | 0.83 | -11.04 | 22.31 | 0.07 | 0.48 | -57.72 | 1.94 | 20.72 | 0.45 | 0.82 | -6.53 | 21.24 | 0.06 | 0.29 | -52.64 | 3.03 |
| UDS | 20061 | 34.343971 | -5.166534 | 0.65 | 10.57 | 21.80 | 0.60 | 0.51 | 84.59 | 22.37 | 0.06 | 0.74 | 86.84 | 1.63 | 20.60 | 0.56 | 0.54 | 84.13 | 21.17 | 0.06 | 0.84 | -79.41 | 1.28 |