Velocity fluctuations for bubbly flows at small Re
Abstract
We experimentally investigate the effect of Reynolds number (Re) on the turbulence induced by the motion of bubbles in a quiescent Newtonian fluid at small Re. The energy spectra, , is determined from the decaying turbulence behind the bubble swarm obtained using particle image velocimetry (PIV). As the bubble Reynolds number decreases, the signature of the energy spectra for the bubble induced turbulence is replaced by a scaling similar to the classical Kolmogorov’s scaling, where is the wavenumber. We find that for Re (100) the slope of the normalized energy spectra is no longer independent on the gas volume fraction. This is further corroborated using spatial correlation of the velocity vector behind the bubble swarm. Thus, we provide experimental evidence to the claim by Mazzitelli et al. (2003) that at low Reynolds numbers the normalized energy spectra of the bubble induced turbulence will no longer show the scaling because of the absence of bubble wake and that the energy spectra will depend on the number of bubbles, thus non-universal.
keywords:
Viscous bubbly flows; pseudoturbulence;1 Introduction
When a swarm of bubbles rises in an otherwise stagnant fluid due to the motion of bubbles disturbances are created in the surrounding fluid giving rise to velocity fluctuations. At a moderate to high Reynolds number, Re, these velocity fluctuations in the wake behind the bubbles interacts with one another giving rise to the emergence of scaling of the energy spectra, , of velocity fluctuations. This signature scaling of the energy spectra instead of the classical Kolmogorov’s scaling is regarded as the bubble induced turbulence, also referred to as pseudoturbulence (Risso, 2018).
Lance & Bataille (1991) were the first to observe the emergence of scaling of energy spectra, , with respect to the wavenumber, for the bubble induced turbulence in Newtonian fluids. They provided an argument that in a spectral space, the balance between the energy produced by the motion of bubbles and the viscous dissipation in a statistically steady state gives rise to the emergence of scaling. Following this pioneering work, a number of numerical (Esmaeeli & Tryggvason, 1996; Bunner & Tryggvason, 2002b; Balachandar & Eaton, 2010) and experimental (Zenit et al., 2001; Martínez-Mercado et al., 2007; Riboux et al., 2013; Prakash et al., 2016; Alméras et al., 2017) works supported the emergence of scaling for both the spatial and temporal velocity fluctuations generated by the bubble motion (Risso, 2018). Amoura et al. (2017) showed experimentally that irrespective of the dispersed phase, be it bubbles or random fixed solid spheres, the velocity fluctuations generated in the continuous phase gives rise to the scaling. Recently, Pandey et al. (2023) identified the coexistence of Kolmogorov’s turbulence with the bubble induced turbulence for a wide range of Reynolds number and Galilei number (ratio of buoyancy to viscous forces).
Determining the liquid velocity fluctuations in two-phase gas-liquid flows is challenging. Due to the dispersed nature of the bubbly flow, laser-based techniques within the bubble swarm can only be used for very dilute flows. On the other hand, the hot-wire-based techniques (Martínez-Mercado et al., 2007; Mendez-Diaz et al., 2013; Alméras et al., 2017), are far from perfect as their use implies elaborate signal processing. To overcome these difficulties, Riboux et al. (2010) measured the liquid velocity fluctuations by abruptly stopping the bubble formation using a solenoid valve thus leaving the wake behind the bubble swarm free of bubbles to be analyzed using particle image velocimetry (PIV). They showed that the scaling , independent of the gas volume fraction and bubble diameter, is observed between the Eulerian length scale () and the bubble diameter (), where is the drag coefficient of a single rising bubble. Later Risso (2018) modified the Eulerian length scale, to include the Reynolds number.
An intriguing question is to explore what happens to the energy spectra of the bubbly flows at low Reynolds number (Bunner & Tryggvason, 2002a, b). When Re 20, the bubbles will not have a significant wakes behind them (Blanco & Magnaudet, 1995; Mougin & Magnaudet, 2001). A clue on what to expect for smaller Reynolds numbers was summarized by Mazzitelli et al. (2003), who conducted numerical simulations for bubbly Newtonian fluids considering bubbles as point particles. Specifically, they did not observe the scaling. Thus concluding the essentiality of the wakes. They further argued that the energy spectrum slope for bubbly flows with little to no wakes behind them will depend on the number of bubbles and will therefore be non-universal (Mazzitelli et al., 2003; Mazzitelli & Lohse, 2009). Most surprisingly, to our knowledge, there are only a few experimental studies in this regime (Cartellier & Rivière, 2001; Martínez-Mercado et al., 2007; Mendez-Diaz et al., 2013). Cartellier & Rivière (2001) studied bubble induced agitations at Re (1), however to delay the onset of large scale instabilities (transition into heterogeneous bubbly regime) an inner tube within the bubble column was used to create the liquid flow rate due to the gas lift. Further, they did not address the nature of energy spectra of liquid velocity fluctuations.
In the present study we will focus only on the homogeneous bubbly regime to address the effect of Reynolds number on the bubble induced turbulence. Using the particle image velocimetry technique proposed by Riboux et al. (2010), the liquid velocity fluctuations are determined to calculate the energy spectra. We find that as the Reynolds number decreases the slope of the energy spectra emerges as instead of the scaling observed for the bubble induced turbulence. Further, we show that this slope of the energy spectra depends on the number of bubbles in the column. Understanding the spectral structure fluid velocity fluctuations in two-phase flows at low Re could be justified by their relevance in modern applications such as microfluidics (Anna, 2016) and hydrogen production (Avci & Toklu, 2022).
2 Experimental setup and methods
2.1 Experimental setup
Figure 1(a) shows the schematic of the experimental setup used in the present study. It consists of a transparent acrylic tank of height 1000 mm with a cross-section of 100 mm 50 mm. Monodispersed air bubbles are injected at the bottom of the tank through a removable capillary bank. The capillary bank is custom made with identical capillaries of inner diameter 0.6 mm in tandem with a secondary capillary of inner diameter 0.25 mm, arranged in a hexagonal array to increase the number of identical capillaries per unit area (Martínez-Mercado et al., 2007). The tandem arrangement provides the sufficient hydraulic resistance through the capillaries such that individual bubbles are formed in a quasi-steady manner, thereby avoiding the generation of gas jets (Oguz & Prosperetti, 1993). By adjusting the gas flow rate using a needle valve, the mean gas volume fraction is measured from the increase in the liquid level after the injection of bubbles, , where is the initial liquid level and is the liquid level increase.
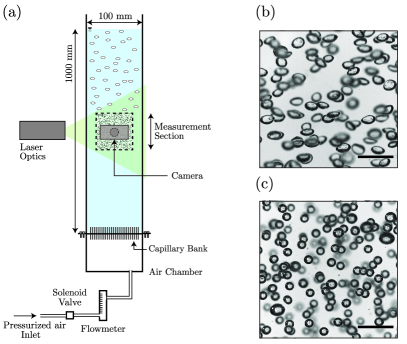
The velocity fluctuations in the liquid phase is measured from the wake behind the bubble swarm using particle image velocimetry (PIV), following the work by Riboux et al. (2010). The airflow is abruptly stopped by using a rapid solenoid valve. Then, the region behind the bubble swarm is studied using high-speed particle image velocimetry (Photron FASTCAM SA5). The recorded images were then analyzed using PIVLab in MATLAB. From the PIV data, the liquid velocity fluctuations in the bubble swarm wake are obtained as follows . Here represent the average in space. The energy spectra, , of the velocity fluctuations are determined from the decaying turbulence behind the bubble swarm using particle image velocimetry following Riboux et al. (2010). The energy spectra of horizontal and vertical velocity fluctuations are then obtained using Welch method by averaging the energy spectra of each rows and columns, respectively.
2.2 Test fluids
To prepare viscous Newtonian fluids, mixture of glycerin water solutions were used. The properties of the fluids used in the study, shear viscosity, density and surface tension were measured using ARES-G2 Rheometer (TA Instruments), Density meter (Anton Paar) and Bubble pressure tensiometer (KRUSS Scientific Instruments), are listed in Table 1. To reduce bubble coalescence, a small amount of magnesium sulfate salt (0.05 mol/l) was added to all the fluids used in the study, following (Lessard & Zieminski, 1971). The relevant dimensionless numbers used in the current study are (i) Reynolds number, Re = , where is the average bubble velocity, is the average bubble diameter, is the fluid density, and is the fluid viscosity, and (ii) Weber number, We = , where is the surface tension. The average bubble diameter and velocity were obtained from the probability distribution obtained from the image processing. The Kolmogorov’s length scale, , where is the kinematic viscosity and is the dissipation rate. The Eulerian length scale, , where is the drag coefficient.
| Fluids | Re | We | |||||||
| (in water) | (kg/m3) | (mN/m) | (Pa.s) | (mm) | (mm/s) | (mm) | (mm) | ||
| 10% Glycerin | 1003.0 | 73.23 | 0.001 | 2.8 0.2 | 290 | 0.169 | 0.022 | 626 | 3.2 |
| 50% Glycerin | 1140.6 | 72.38 | 0.005 | 2.6 0.1 | 243 | 0.285 | 0.062 | 144 | 2.1 |
| 60% Glycerin | 1142.1 | 71.97 | 0.007 | 2.6 0.1 | 206 | 0.311 | 0.090 | 87 | 1.8 |
| 75% Glycerin | 1195.3 | 70.07 | 0.029 | 2.5 0.2 | 114 | 0.475 | 0.394 | 11 | 0.6 |
| 85% Glycerin | 1224.0 | 70.04 | 0.048 | 2.3 0.1 | 109 | 0.590 | 0.572 | 6 | 0.5 |
- average bubble diameter; - average bubble velocity; - Eulerian length scale;
- Kolmogorov’s length scale; Re - Reynolds number; We - Weber number.
3 Results and Discussions
3.1 Energy spectra of the velocity fluctuations
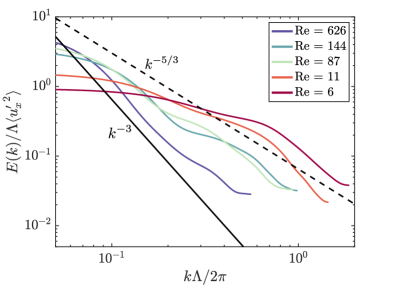
We first investigate the energy spectra of velocity fluctuations for different bubble Reynolds number at a fixed gas volume fraction. Figure 2 shows the horizontal and vertical energy spectra of velocity fluctuations normalized by the corresponding variance for a family of bubble Reynolds number at a constant gas volume fraction of . Here, to be able to compare different Reynolds numbers, the abscissa and the ordinate are normalized with the modified Eulerian length scale () proposed by Risso (2018). As seen in the Fig. 2, for Reynolds numbers, Re (10), the signature scaling of the energy spectra is obtained similar to (Martínez-Mercado et al., 2007; Riboux et al., 2010), which also serves as a validation of our experimental method. On further decreasing the Reynolds number, for Re = 11 and 6, the signature scaling for the pseudoturbulence does not emerge. The numerical results obtained for the bubble induced turbulence by Bunner & Tryggvason (2002b) for Re between 12 and 30 found energy spectra decays with a scaling, which agrees with the present findings. To our knowledge no other data for Re (10) exists.
It has been argued that the observed scaling is the result of the contribution from the bubble wakes (Risso, 2018). In the current study, however, for Re (1-10), no significant wake behind the bubbles are expected to appear (Blanco & Magnaudet, 1995). Thus, instead of the signature scaling for the pseudoturbulence, a scaling similar to the classical Kolmogorov’s scaling is observed for the energy spectra of velocity fluctuations induced by the bubbles in our experiments. It is surprising, however, to find such scaling, typically found in turbulent flows, for such a low Reynolds number flow. We argue that scaling emerges from the small scale disturbances generated by the bubble motion, which are strong enough to generate a large scale flow with the same characteristics as the Kolmogorov’s turbulence (Mazzitelli & Lohse, 2009). Thus, we provide the first experimental evidence to the claim by Mazzitelli & Lohse (2009), that the scaling is the signature of the bubble wake interactions and at very low Reynolds numbers the classical scaling is recovered. Further, we note that the steeper drop in the energy spectra beyond the normalized wavenumber of 0.5 may be due to the dominance of viscosity beyond the Kolmogorov’s microscale, , as listed in the Table 1. In other words, the length scale at which the energy is being injected into the system is close to the length scale at which the energy is dissipated by the viscosity. This confirms that the turbulence induced due to the bubble motion is instantaneously diffused by viscosity.
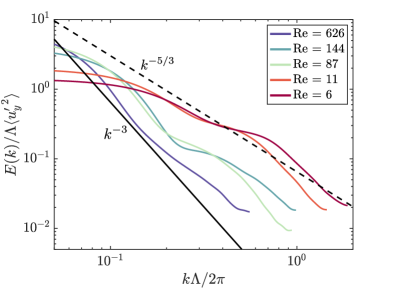
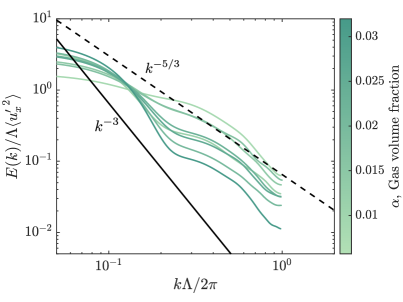
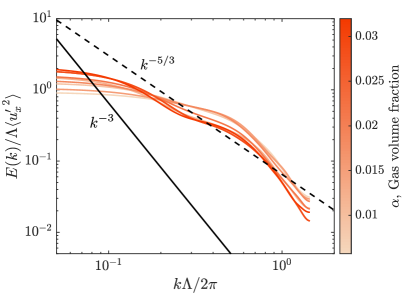
Further, Riboux et al. (2010) suggested that the scaling observed in the pseudoturbulence does not depend on the bubble diameter and gas volume fraction for a wide range of Reynolds numbers. We show that this is not the case at low Reynolds number. Figure 3(a) shows the horizontal spectra of liquid velocity fluctuations normalized by the Eulerian length scale and the variance for a family of gas volume fraction at Re = 114. It is to be noted that at very low gas volume fractions, though the bubbles have significant wake, the energy spectra does not show the scaling. However, as the gas volume fraction increases, the scaling emerges. This is because as the number of bubbles (i.e the gas volume fraction) increases the average inter distance between the bubbles decreases, thus leading to wake interactions. This is further corroborated using spatial correlation in the next section. Whereas, for Re = 11 as seen in the Fig. 3(b), the scaling is not observed, instead the classical Kolmogorov’s scaling is obtained. This is in agreement with the results from Mazzitelli et al. (2003) that the slope of the energy spectra no longer show the signature scaling for the pseudoturbulence and that the slope of the energy spectra depend on the number of bubbles and therefore is non-universal.
3.2 Spatial correlation
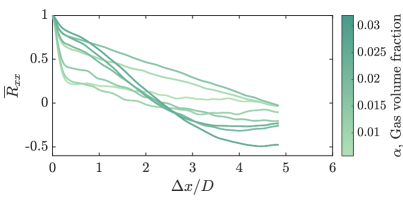
To further investigate why the slope of the energy spectra depends on the gas volume fraction for low to moderate Reynolds number, the spatial correlation of the horizontal velocity fields are considered. Here, the horizontal velocity field is preferred over the vertical velocity field because the probability density functions (PDFs) of the horizontal velocity component is symmetric, whereas the vertical velocity component is positively skewed because of the rising bubbles (Risso, 2018).
The spatial correlation of the horizontal velocity, defined as,
| (1) |
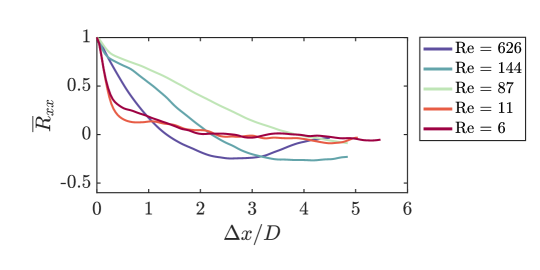
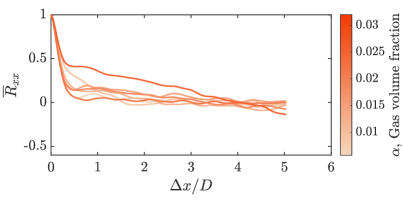
Here represent the average in space. Figure 4(a) shows the spatial correlation of the horizontal velocity behind the bubble swarm at a constant gas volume fraction of . It is evident that as the Re decreases from 626 to 144 to 87, we observe a higher correlation over longer distances. This is because as we increase the viscosity of the fluid to decrease the Reynolds number, the size of the bubble decreases as listed in the Table 1. Therefore, more number of bubbles are required to achieve a fixed gas volume fraction (say ). This is in agreement with the numerical results from Esmaeeli & Tryggvason (1996), who showed that there is an emergence of flow structures many times larger than the bubble size, which is also observed in particle suspensions at finite Reynolds numbers (Climent & Maxey, 2003). However, on further decreasing the Reynolds number (Re = 11 and 6), the velocity is decorrleated quickly as seen in the Fig. 4(a). This indicates that the presence of wake is essential for the signature scaling to emerge as seen in the Fig. 2. Figure 4(b) shows the spatial correlation of the horizontal velocity observed behind the bubble swarm for a family of gas volume fractions at Re = 114. It is immediately evident that as the gas volume fraction increases, the horizontal velocity is correlated over a longer distance. Thus, agreeing with our results for the energy spectra, as seen in Fig. 3(a), dependence on the number of bubbles. However, as seen in the Fig. 4(c) when the Re = 11, even with higher gas volume fraction, the horizontal velocity is quickly decorrelated beyond one bubble radius.
4 Conclusions
The bubbly flow properties in viscous Newtonian fluids have been studied experimentally by varying the concentration of glycerin in water mixture. Particle image velocimetry (PIV) technique is used to visualize the wake behind the bubble swarm to determine the velocity fluctuations in the decaying agitations. We demonstrated experimentally that the signature scaling of the pseudoturbulence is replaced by the scaling for the energy spectra of velocity fluctuations induced by low Reynolds number bubbles. To compare a range of Reynolds numbers bubbly flows, the energy spectra and the wavenumbers are normalized with the modified Eulerian length scale, proposed by Risso (2018).
Further, we showed that as the Reynolds number decreases, the slope of the energy spectra depends on the number of bubbles in the flow. These experimental results coincides with the numerical results by Mazzitelli et al. (2003) that the energy spectra is non-universal for bubbles with Re (1-10). To understand why the slope of the energy spectra depends on the gas volume fraction, the spatial correlation of the velocity field was considered. For a constant gas volume fraction, as the Re (10-100), a higher correlation over longer distances was observed in agreement with the results from Esmaeeli & Tryggvason (1996). As the bubble size decreases with Reynolds number, more bubbles (i.e. higher gas volume fraction) are required to maintain the same gas volume fraction. Thus, as the inter-bubble distance among bubbles decreases the wake interactions are more pronounced. Whereas for Re (1-10) the velocity is quickly decorrelated beyond the bubble radius, thus the signature scaling for the bubble induced turbulence does not emerge.
References
- Alméras et al. (2017) Alméras, E., Mathai, V., Lohse, D. & Sun, C. 2017 Experimental investigation of the turbulence induced by a bubble swarm rising within incident turbulence. Journal of Fluid Mechanics 825, 1091–1112.
- Amoura et al. (2017) Amoura, Z., Besnaci, C., Risso, F. & Roig, V. 2017 Velocity fluctuations generated by the flow through a random array of spheres: a model of bubble-induced agitation. Journal of Fluid Mechanics 823, 592–616.
- Anna (2016) Anna, S. L. 2016 Droplets and bubbles in microfluidic devices. Annual Review of Fluid Mechanics 48, 285–309.
- Avci & Toklu (2022) Avci, A. C. & Toklu, E. 2022 A new analysis of two phase flow on hydrogen production from water electrolysis. International Journal of Hydrogen Energy 47 (11), 6986–6995.
- Balachandar & Eaton (2010) Balachandar, S. & Eaton, J.K. 2010 Turbulent dispersed multiphase flow. Annual Review of Fluid Mechanics 42, 111–133.
- Blanco & Magnaudet (1995) Blanco, A. & Magnaudet, J. 1995 The structure of the axisymmetric high-reynolds number flow around an ellipsoidal bubble of fixed shape. Physics of Fluids 7 (6), 1265–1274.
- Bunner & Tryggvason (2002a) Bunner, B. & Tryggvason, G. 2002a Dynamics of homogeneous bubbly flows part 1. rise velocity and microstructure of the bubbles. Journal of Fluid Mechanics 466, 17–52.
- Bunner & Tryggvason (2002b) Bunner, B. & Tryggvason, G. 2002b Dynamics of homogeneous bubbly flows part 2. velocity fluctuations. Journal of Fluid Mechanics 466, 53–84.
- Cartellier & Rivière (2001) Cartellier, A. & Rivière, N. 2001 Bubble-induced agitation and microstructure in uniform bubbly flows at small to moderate particle reynolds numbers. Physics of Fluids 13 (8), 2165–2181.
- Climent & Maxey (2003) Climent, E. & Maxey, M.R. 2003 Numerical simulations of random suspensions at finite reynolds numbers. International Journal of Multiphase Flow 29 (4), 579–601.
- Esmaeeli & Tryggvason (1996) Esmaeeli, A. & Tryggvason, G. 1996 An inverse energy cascade in two-dimensional low reynolds number bubbly flows. Journal of Fluid Mechanics 314, 315–330.
- Lance & Bataille (1991) Lance, M. & Bataille, J. 1991 Turbulence in the liquid phase of a uniform bubbly air–water flow. Journal of Fluid Mechanics 222, 95–118.
- Lessard & Zieminski (1971) Lessard, R.R. & Zieminski, S.A. 1971 Bubble coalescence and gas transfer in aqueous electrolytic solutions. Industrial & Engineering Chemistry Fundamentals 10 (2), 260–269.
- Martínez-Mercado et al. (2007) Martínez-Mercado, J., Palacios-Morales, C.A. & Zenit, R. 2007 Measurement of pseudoturbulence intensity in monodispersed bubbly liquids for 10 Re 500. Physics of Fluids 19 (10), 103302.
- Mazzitelli & Lohse (2009) Mazzitelli, I.M. & Lohse, D. 2009 Evolution of energy in flow driven by rising bubbles. Physical Review E 79 (6), 066317.
- Mazzitelli et al. (2003) Mazzitelli, I.M., Lohse, D. & Toschi, F. 2003 The effect of microbubbles on developed turbulence. Physics of Fluids 15 (1), L5–L8.
- Mendez-Diaz et al. (2013) Mendez-Diaz, S., Serrano-Garcia, J.C., Zenit, R. & Hernandez-Cordero, J.A. 2013 Power spectral distributions of pseudo-turbulent bubbly flows. Physics of Fluids 25 (4).
- Mougin & Magnaudet (2001) Mougin, G. & Magnaudet, J. 2001 Path instability of a rising bubble. Physical Review Letters 88 (1), 014502.
- Oguz & Prosperetti (1993) Oguz, H.N. & Prosperetti, A. 1993 Dynamics of bubble growth and detachment from a needle. Journal of Fluid Mechanics 257, 111–145.
- Pandey et al. (2023) Pandey, V., Mitra, D. & Perlekar, P. 2023 Kolmogorov turbulence coexists with pseudo-turbulence in buoyancy-driven bubbly flows. Physical Review Letters 131 (11), 114002.
- Prakash et al. (2016) Prakash, V.N., Mercado, J.M., Van Wijngaarden, L., Mancilla, E., Tagawa, Y., Lohse, D. & Sun, C. 2016 Energy spectra in turbulent bubbly flows. Journal of Fluid Mechanics 791, 174–190.
- Riboux et al. (2013) Riboux, G., Legendre, D. & Risso, F. 2013 A model of bubble-induced turbulence based on large-scale wake interactions. Journal of Fluid Mechanics 719, 362–387.
- Riboux et al. (2010) Riboux, G., Risso, F. & Legendre, D. 2010 Experimental characterization of the agitation generated by bubbles rising at high reynolds number. Journal of Fluid Mechanics 643, 509–539.
- Risso (2018) Risso, F. 2018 Agitation, mixing, and transfers induced by bubbles. Annual Review of Fluid Mechanics 50, 25–48.
- Zenit et al. (2001) Zenit, R., Koch, D.L. & Sangani, A.S. 2001 Measurements of the average properties of a suspension of bubbles rising in a vertical channel. Journal of Fluid Mechanics 429, 307–342.