A Sub-solar Fe/O, 7.5 Gas Component Permeating the Milky Way’s CGM
Abstract
Our study focuses on characterizing the highly ionized gas within the Milky Way’s (MW) Circumgalactic Medium (CGM) that gives rise to ionic transitions in the X-ray band 2 - 25 Å. Utilizing stacked Chandra/ACIS-S MEG and LETG spectra toward QSO sightlines, we employ the self-consistent hybrid ionization code PHASE to model our data. The stacked spectra are optimally described by three distinct gas phase components: a warm ( 5.5), warm-hot ( ), and hot ( 7.5) components. These findings confirm the presence of the hot component in the MW’s CGM indicating its coexistence with a warm and a warm-hot gas phases. We find this hot component to be homogeneous in temperature but inhomogeneous in column density. The gas in the hot component requires over-abundances relative to solar to be consistent with the Dispersion Measure (DM) from the Galactic halo reported in the literature. For the hot phase we estimated a DM = pc cm-3. We conclude that this phase is either enriched in Oxygen, Silicon, and Sulfur, or has metallicity over 6 times solar value, or a combination of both. We do not detect Fe L-shell absorption lines, implying O/Fe 4. The non-solar abundance ratios found in the super-virial gas component in the Galactic halo suggest that this phase arises from Galactic feedback.
keywords:
Galaxy: halo – Galaxy: structure – X-rays: general1 Introduction
The circumgalactic medium (CGM) refers to the gaseous component located beyond the galactic disc and within the galactic virial radius. The CGM is a mixed medium with complex structures like filaments, bubbles, and multiphase regions. It comprises ionized and neutral gas with different temperatures and densities (e.g., Tumlinson et al., 2017; Mathur, 2022).
The CGM is thought to play a crucial role in regulating the exchange of matter and energy between the galactic disc and its environment (e.g., Kereš et al., 2005, Zheng et al., 2015). Numerical simulations have shown that shock-heating processes might have heated and ionized the gas during galaxy formation, preventing it from falling into the galactic disc. On the other hand, feedback processes such as supernovas and galactic winds could have expelled large amounts of material into the CGM (e.g., Stinson et al., 2012). Processes such as the infall of material (commonly pristine gas) from the intergalactic medium towards the galactic disc and the expulsion of metals formed in stars from the disc into the surrounding region make the CGM an important clue to understanding galactic formation and evolution (e.g., Tumlinson et al., 2017; Li et al., 2018). These studies suggest that the CGM is a large reservoir of gas that can fuel future star formation within the galaxy and the place where the missing baryons and metals could reside.
In the local universe, at galactic scales, the number of baryons observed in galaxies with luminosity less or near Schechter L⋆ lies near half under the amount of baryonic mass predicted by the nucleosynthesis in the Big Bang theory and inferred from the density fluctuations of the cosmic microwave background. For galaxies less massive, more mass is missing (e.g., Kirkman et al., 2003 and references therein; Planck Collaboration et al., 2016, McGaugh et al., 2010). Coupled with the Missing Baryon Problem, there is also The Missing Metal Problem at galactic scales. The number of metals expected from the stars observed and the star formation history of galaxies is about two times larger than the number of metals we can observe (Peeples et al., 2014).
Theoretical studies suggest that the missing baryons and missing metals in galaxies might reside in the CGM; however, its diffuse nature makes it difficult to study this material (e.g., Feldmann et al., 2013; Mathur et al., 2021; Mathur et al., 2023).
Because of our unique point of reference, studying the CGM of the Milky Way is much easier than studying it in external galaxies. A common way to detect the CGM of the Milky Way is by studying it in absorption against bright background sources, such as quasars (e.g., Gupta et al., 2012, Mathur, 2022).
The CGM is expected to be close to the galaxy’s virial temperature. For a Milky Way-like galaxy, this temperature is about 6. We will call the gas at this high temperature the warm-hot component. For the Milky Way, this gas phase has been studied in emission and absorption using UV and X-ray spectra (e.g., Wang et al., 2005; Gupta et al., 2012; Das et al., 2019a).
Gupta et al. (2012) detected in absorption towards extragalactic sight lines OVII and OVIII at . Using and combining their results with emission results from Henley et al., 2010, they derive that the warm-hot phase of the Milky Way CGM is a massive component of about (/M⊙) 10, which extends over a vast region around the galactic disc. Their results suggest that it is in this component where the missing baryons and metals could reside.
In recent studies, Das et al. (2019a), Das et al. (2021b), and detected a hotter gas component in the Milky Way CGM for the first time. They found a gas phase with super-virial temperature at . Hereafter, we will refer to this component as hot. Using deep XMM-Newton RGS observations of the blazar 1ES 1553+113, Das et al. (2019a) detected in absorption NeX K associated with this hot component. Later on, in 2021 Das et al. (2021b) also found SiXIV K and NeX K in the line of sight towards the blazar Mkn 421. Their results in these two lines of sight indicate that the CGM is a multiphase system with a warm ( 5.5), warm-hot ( 6), and hot ( 7.5) components.
Focused on these gas components, and using Chandra observations towards 47 different sightlines and the stacking technique, Lara-DI et al. (2023) (hereafter LDI-2023a) were able to detect SiXIV K and for the first time SXVI K at in absorption. Their discovery confirms the presence of a hot component in the Milky Way CGM, suggesting it is a widespread component throughout the entire CGM. The presence of the hot component was also confirmed by McClain et al. (2024) in the sightline toward NGC 3783.
The newly discovered hot component was also detected in emission (e.g., Das et al., 2019b; Bluem et al., 2022; Gupta et al., 2021; Bhattacharyya et al., 2023; Gupta et al., 2023). Bhattacharyya et al. (2023) studied in emission the hot phase of the CGM around the Mkn 421 sightline. Their study complements the work done by Das et al. (2021b) in the line of sight towards Mkn 421, showing that the emitting gas has higher density, possibly coming from regions close to the Galactic disc. On the other hand, the absorption measurements arise from low densities extending to the virial radius. They found a scatter in the temperature in both the warm-hot component and the hot component; this contributes to understanding the CGM as a multiphase system.
Despite these recent efforts, characterizing the CGM remains challenging. Information about its geometry, homogeneity, and how the different gas phases expand through the entire CGM Milky Way remains to be determined. The super-virial hot component is not expected from theoretical studies, and its finding opens new questions crucial to better understanding galactic formation and evolution.
This paper focuses on absorption studies of the Milky Way CGM. We use the LDI-2023a data sample to characterize the CGM by identifying the gas phases from which these and other absorption lines come. LDI-2023a focused on the spectral range 4 - 8 Å; now, we will focus on the study of the spectral range from 2 to 25 Å using a self-consistent ionization model (PHASE, Krongold et al., 2003) to fit the data. We structure our paper as follows. In Section 2, we present the sample selection. In Section 3, we describe the data analysis. In Section 4, we show our results, and in Section 5, we discuss their implications.
2 Data Sample
This paper uses the same data sample and stacked spectra used in LDI-2023a. The data sample consists of 47 different sight lines to QSOs, Seyfert-1, and Blazars from Chandra X-ray Observatory public observations. This sample excludes changing look Active Galactic Nuclei (AGN)111Mkn 590, which sometimes act like a Seyfert-1 and sometimes as Syfert-2 objects. We also exclude long observations with very high S/N2223C 273 and PKS 2155-304 that would dominate the stacked spectra in our analysis, along with ES1553+113 and Mkn 421 sightlines used by Das et al. (2019a) and Das et al. (2021b). Finally, NGC 4051 (), which presents at clear contribution of narrow absorption lines due to its Warm Absorber (WA), was also excluded (e.g., Krongold et al., 2007). In this way, we avoid intrinsic absorption lines of the WA contaminating our analysis. The sightlines chosen have high Galactic latitude, meaning our data has a small cross-section with the Milky Way’s Interstellar Medium (ISM) (see LDI-2023a for more details).
The stacked spectra with MEG observations comprise 46 (10.96 Ms) of the 47 sightlines, while LETG has nine (1.09 Ms). Except for one sightline (TON S 180), all the sightlines covered by LETG are contained within MEG. The contribution of LETG sightlines to the overall exposure time of MEG amounts to about 10. It is important to note that MEG data is dominated by sources with WA, whereas LETG is not.
We study the spectral range 2 - 25 Å, with a signal-to-noise (S/N) ratio of 2181 for MEG and 651 for LETG. In LDI-2023a, the complete list of sightlines, the Aitoff projection of these targets, and the complete table with the list of individual observations are included. See also LDI-2023a for details on how the data was reprocessed and stacked.
3 Analysis
3.1 Fitting the Continuum
To analyze MEG and LETG stacked spectra, we used the spectral fitting software XSPEC (v12.13.0) with statistics. Errors presented in this paper correspond to 1 level.
We first modeled the continuum of each spectrum from 2.0 to 25.0 Å. We used a model comprising a power law (powerlaw), a black body (bbody) component, an ISM absorption component (Tbabs), and as many Gaussian lines (agauss) as required to account for AGN intrinsic absorption or emission features (i.e., lines produced intrinsically in the sources and not arising from the Milky Way’s CGM).
3.2 PHASE
To model the absorption lines on the spectra arising from the gas components at of the Milky’s Way CGM, we used the hybrid (photo + collision) ionization code PHASE (Krongold et al., 2003). This code allows the analysis of X-ray spectra by generating a synthetic spectrum that fits the data and gives the gas phase component that best describes it. PHASE has as free parameters the temperature of the gas (), the hydrogen column density (), the redshift (), the micro-turbulent velocity of the gas (), the ionization parameter (), and the abundances of the elements, which are set to solar by default.
The CGM is expected to have densities for which photoionization from the metagalactic background should be negligible. Therefore, in spectroscopic modeling we fixed the ionization parameter of the gas to low values (). Since our study focuses on the Milky Way’s CGM, we set the redshift . The width of the lines was set to be less than the resolution element of the instrument. Therefore, our model is constrained to fit narrow lines. In particular, .
This way, we added a PHASE component to the continuum model. This first component was set to fit the virial component (warm-hot) by only considering spectral ranges where NeIX and OVII appear and letting fit the model to the best and /cm-2) for this component. Once we had the best temperature for this component, we extended our analysis to cover all spectral ranges and introduced an additional hotter component (hot) with a higher temperature. Finally, we included a warmer (warm) component with a lower temperature and fitted the three components simultaneously. However, it is important to note that our results do not depend on the order in which the PHASE components are added to the continuum.
The final statistic for the model fitting the continuum on MEG was = 6600.48/4599, and = 1606.56/1837 on LETG.
3.2.1 Abundances
In the X-ray band, we do not have a diagnostic for Hydrogen, so we cannot constrain the absolute metallicity of the CGM. However, we can study the relative abundances of different elements. To do this, we allow each element’s abundance to vary independently when necessary.
4 Results
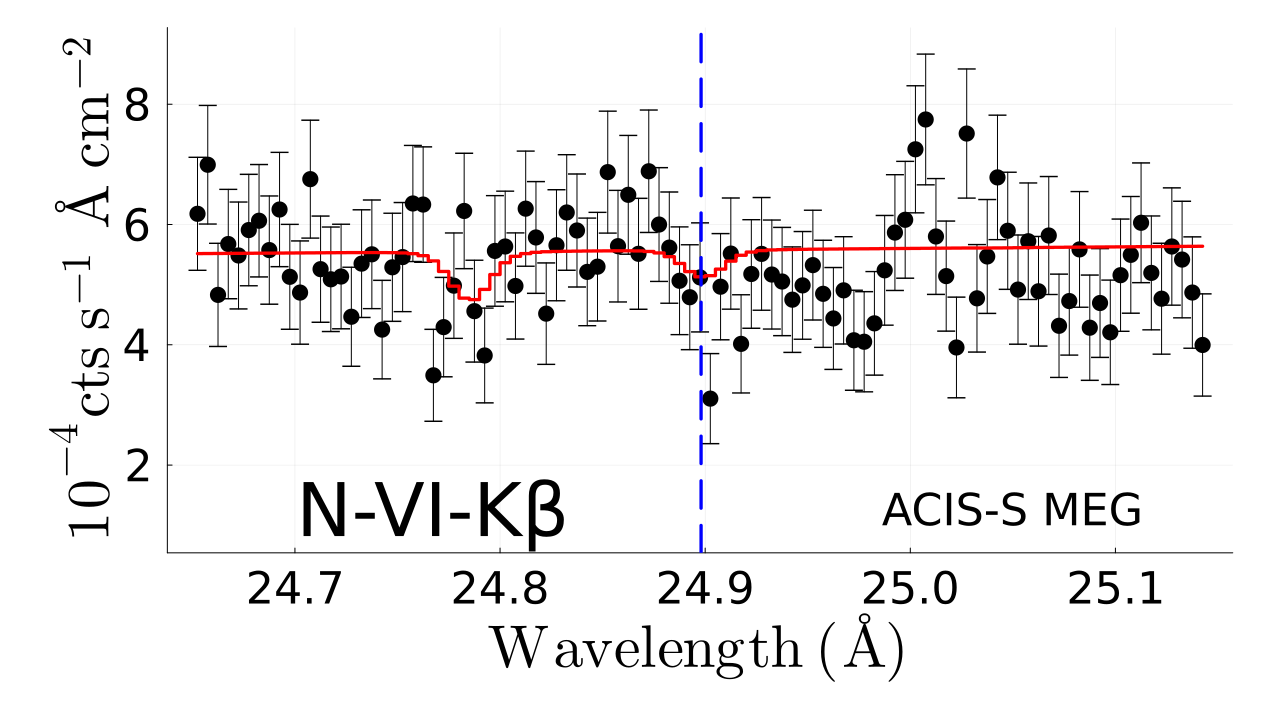
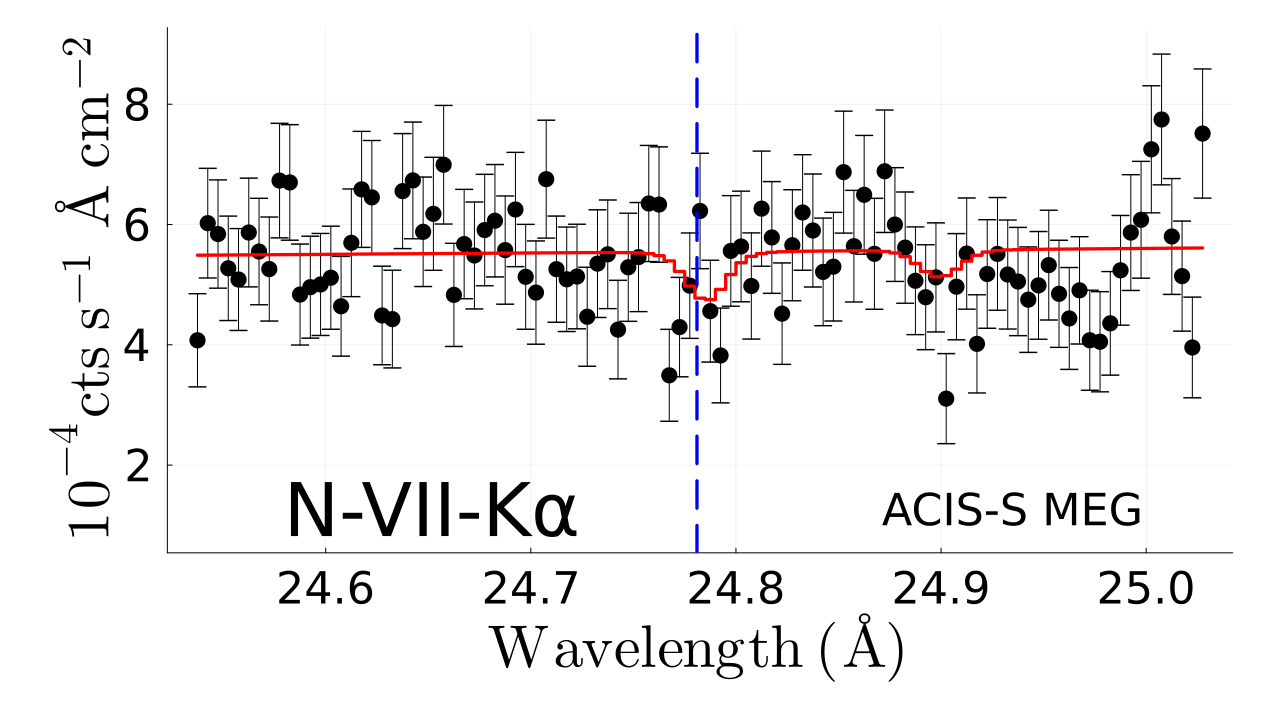
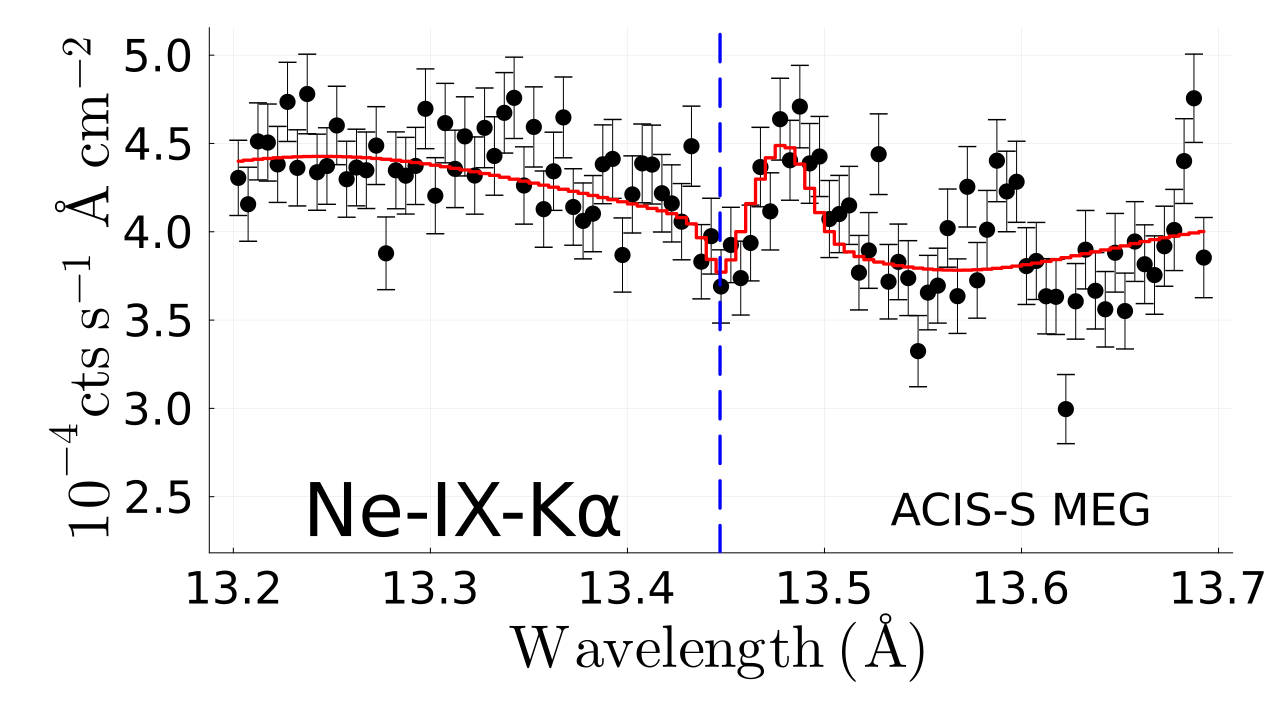
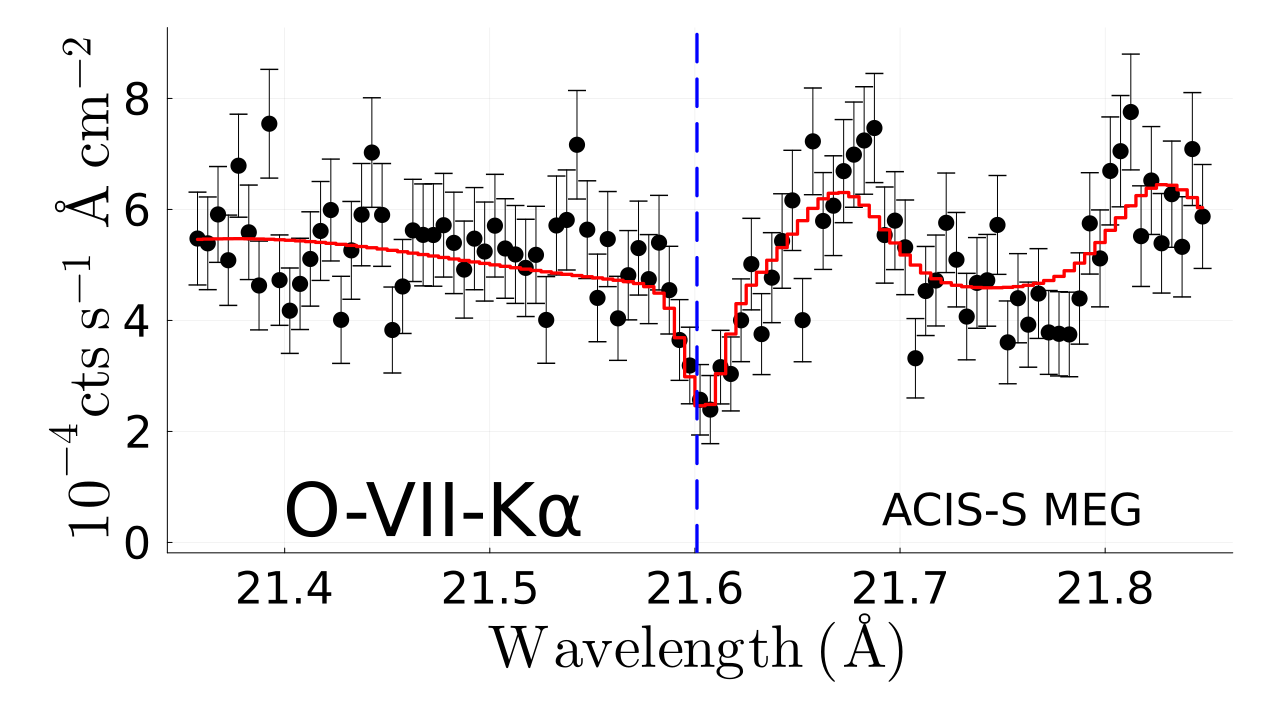
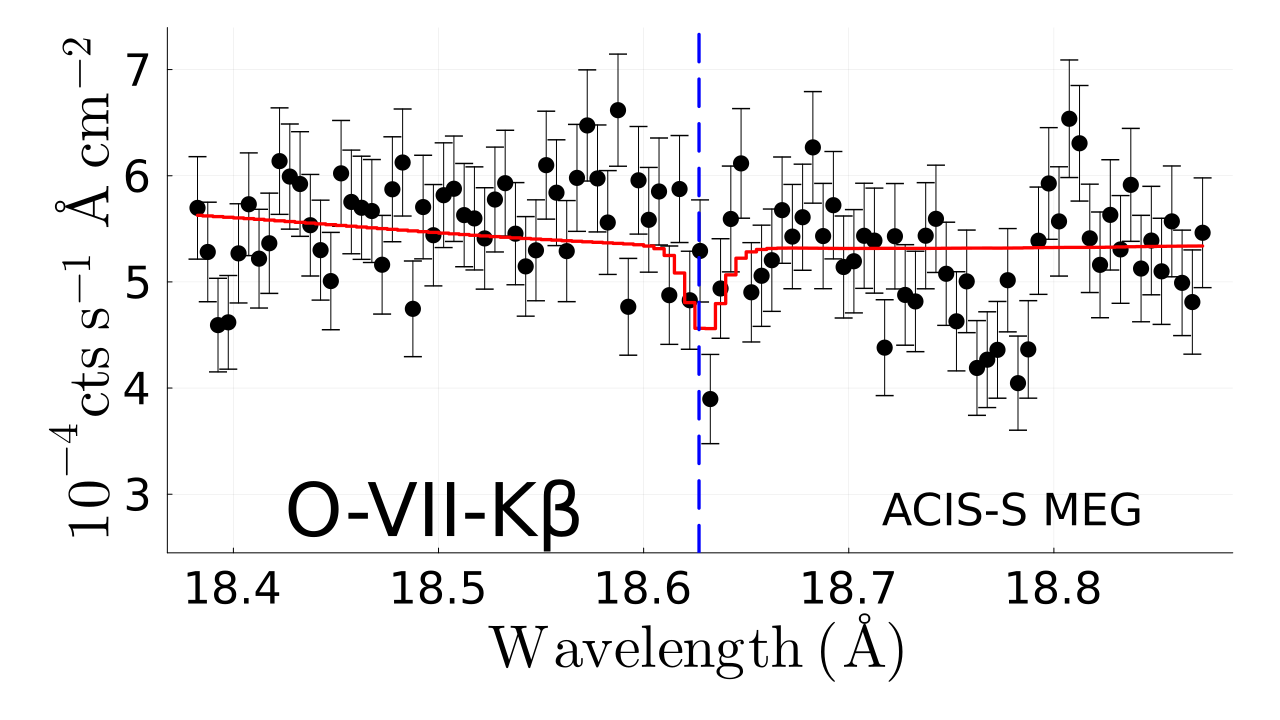
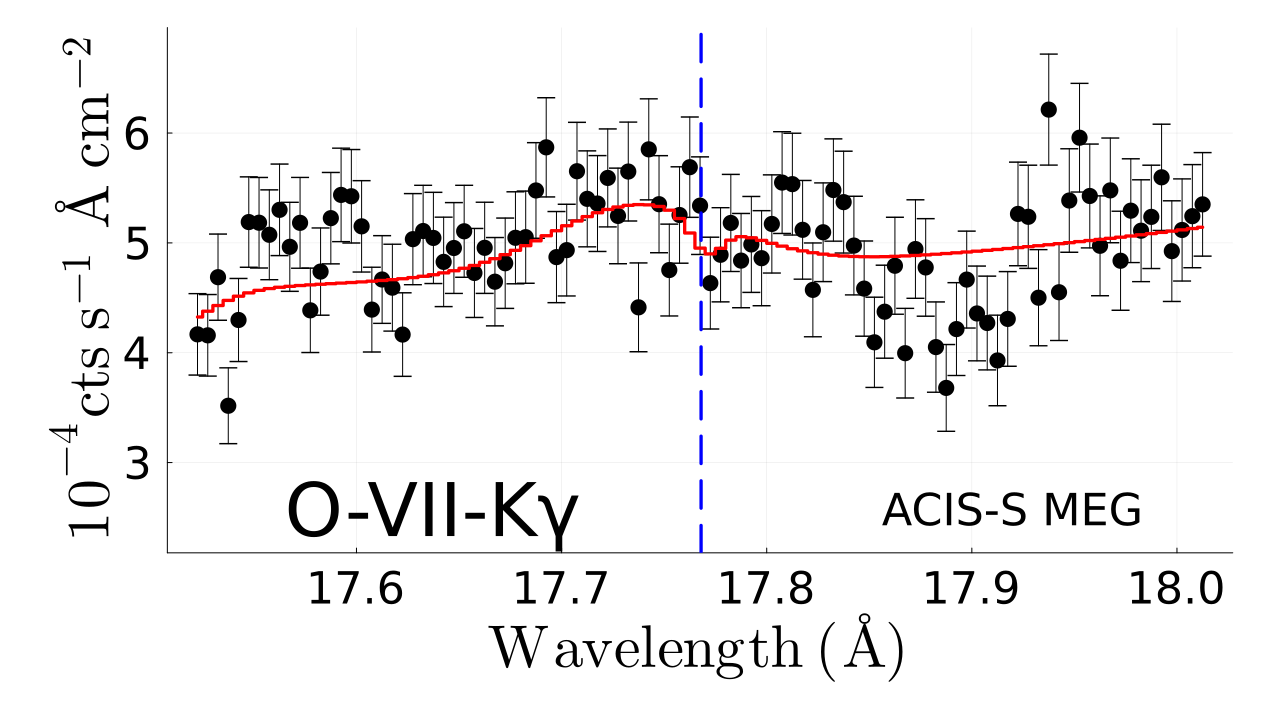
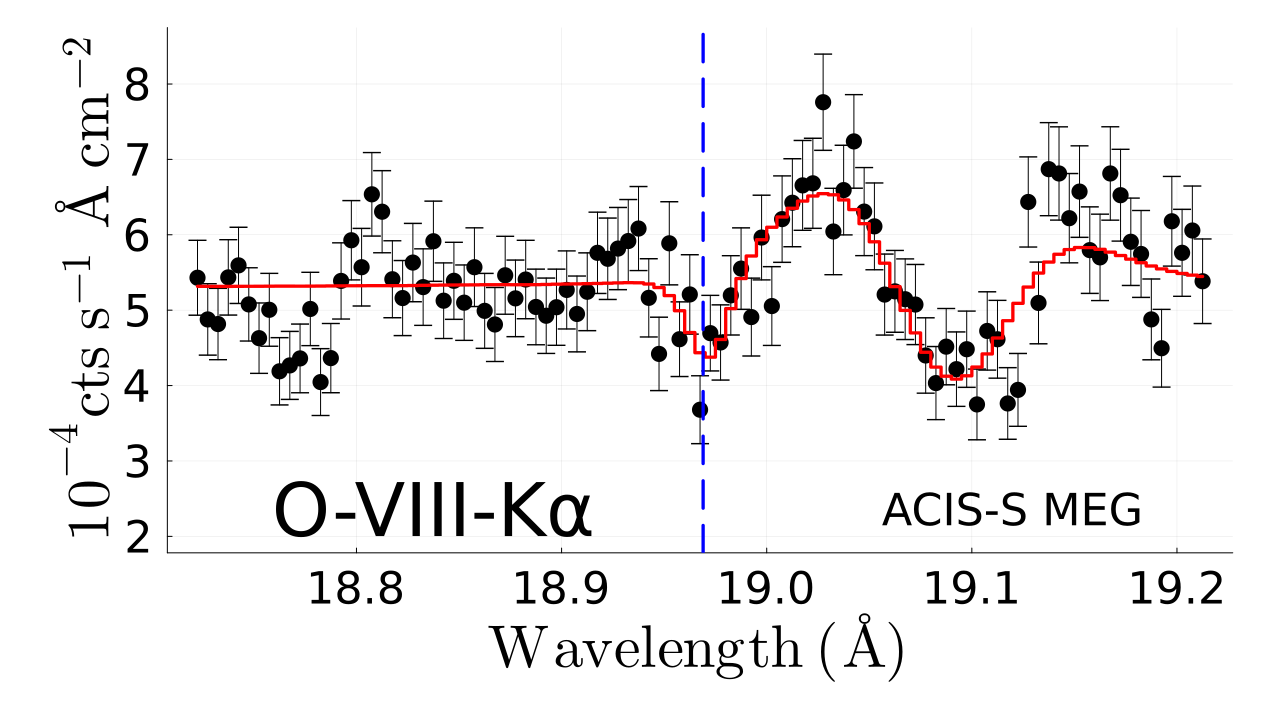
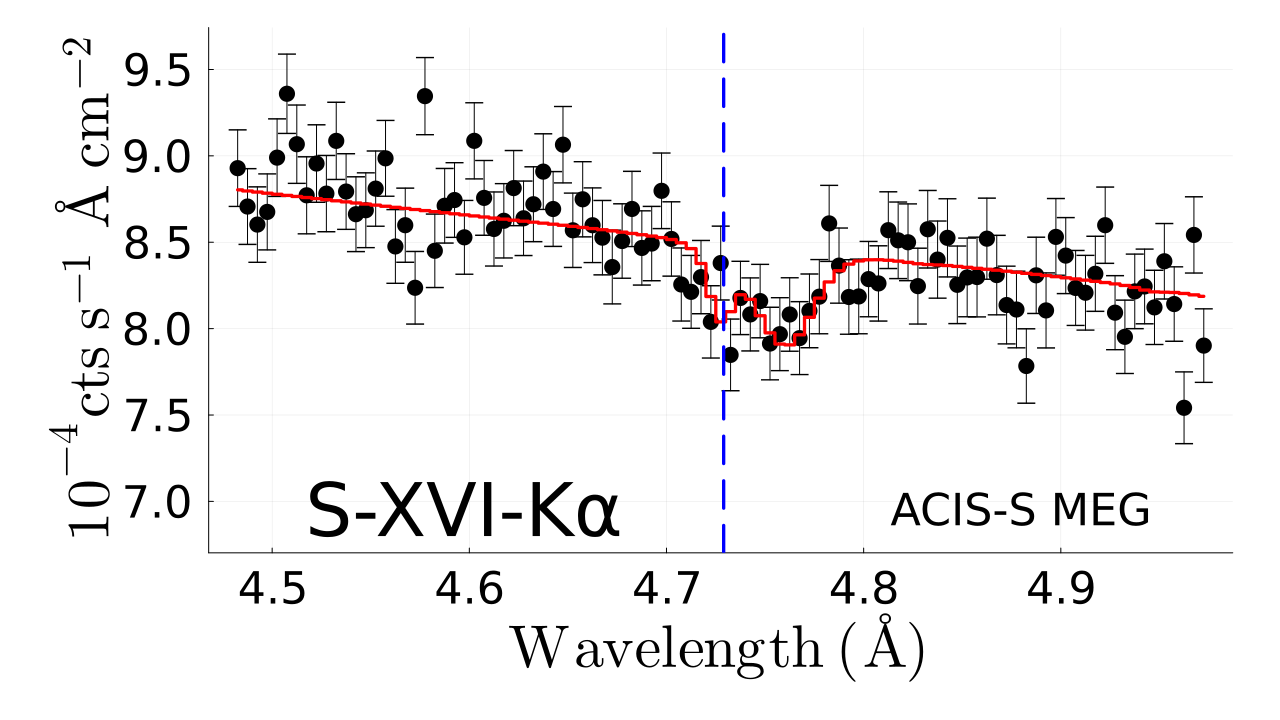
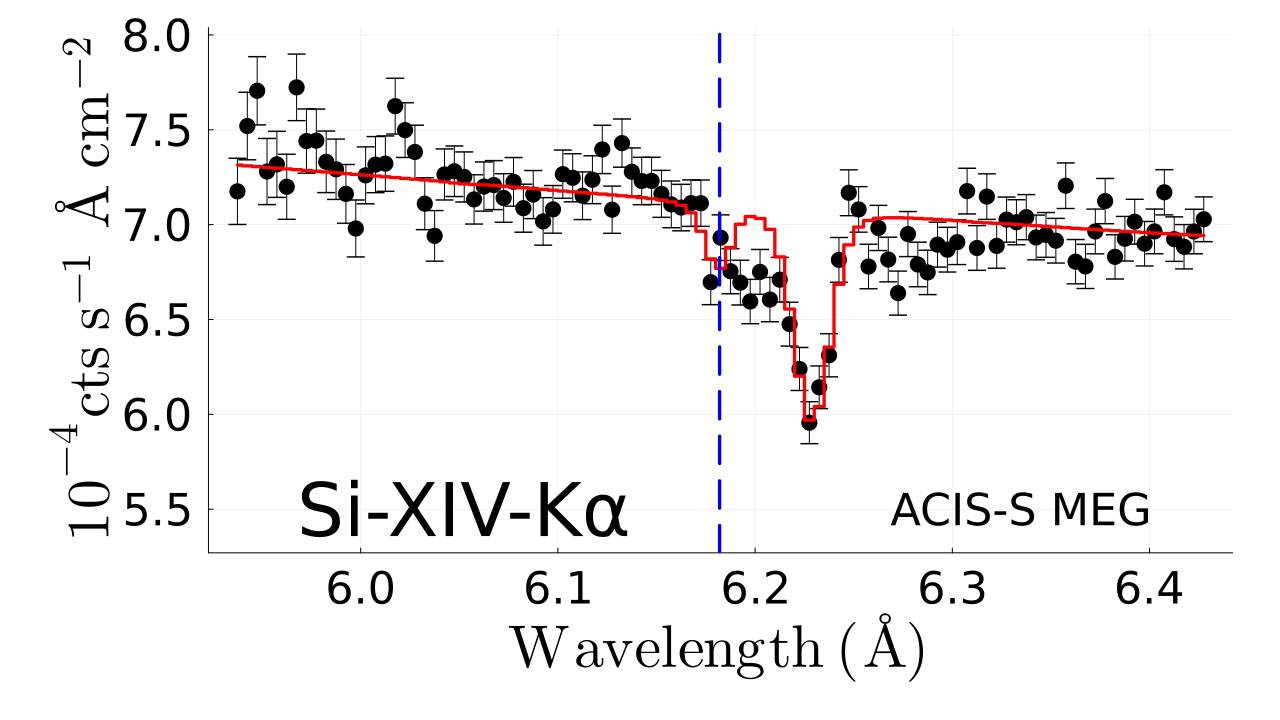
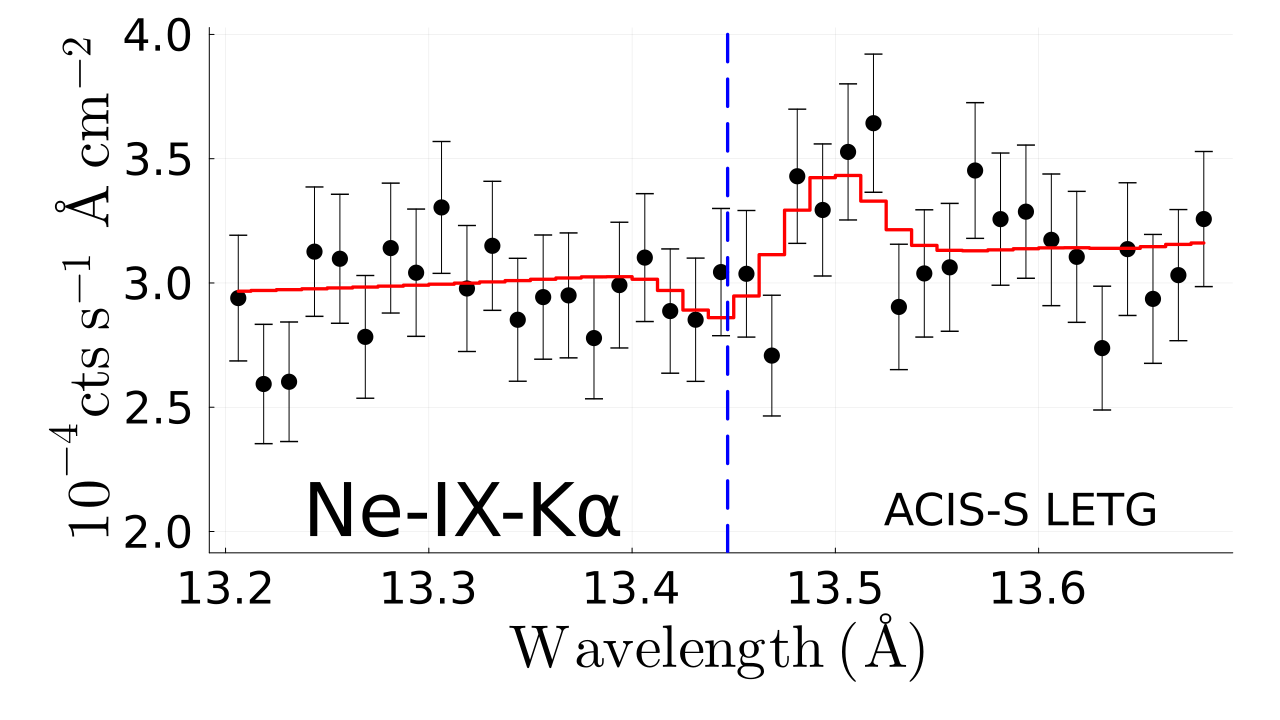
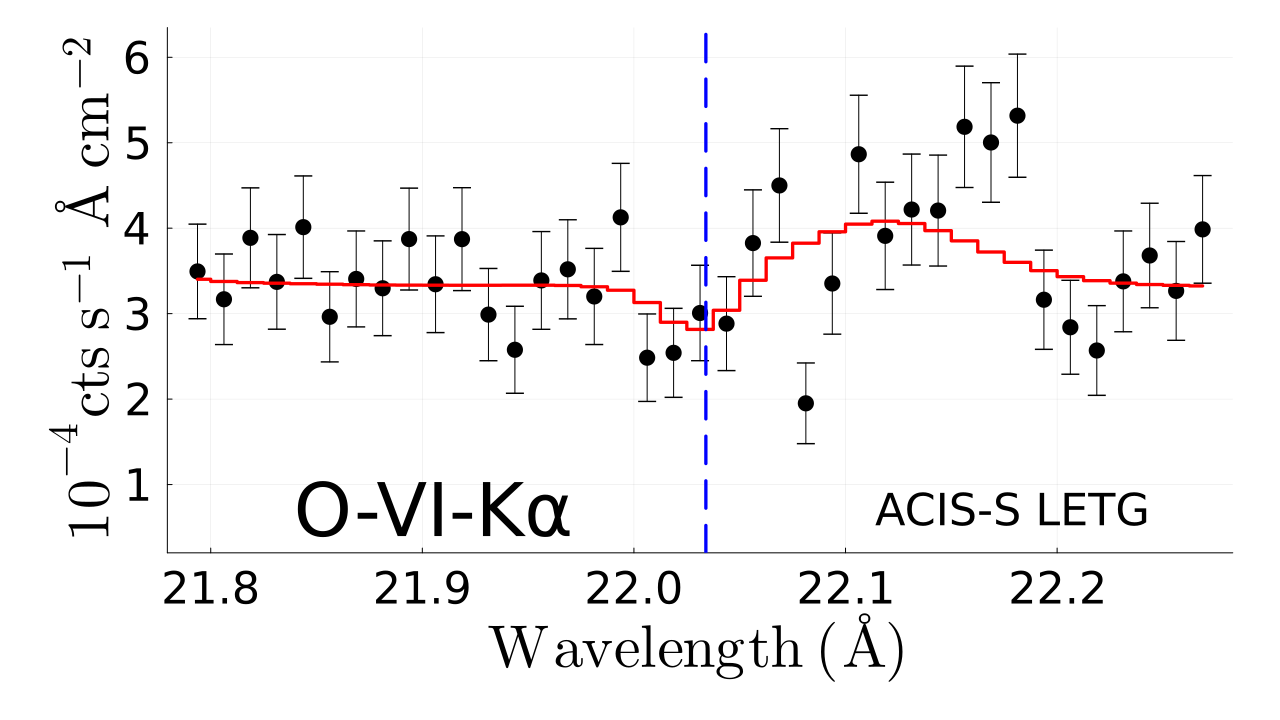
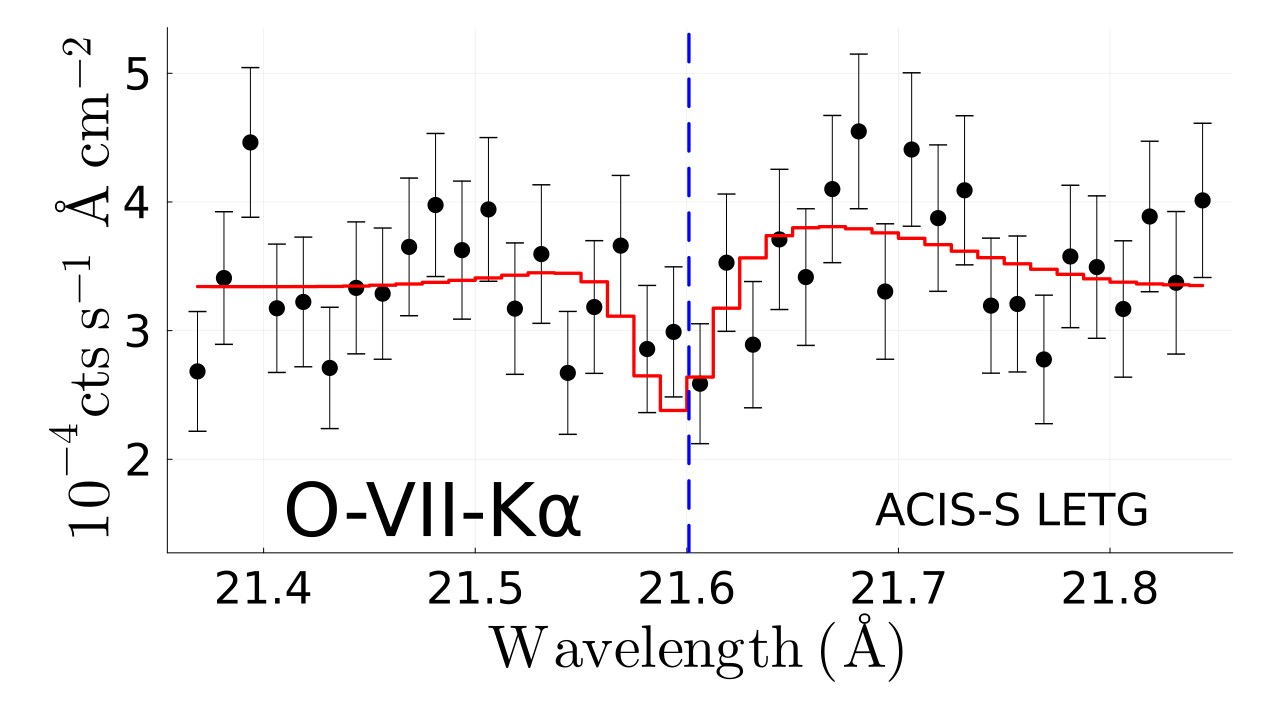
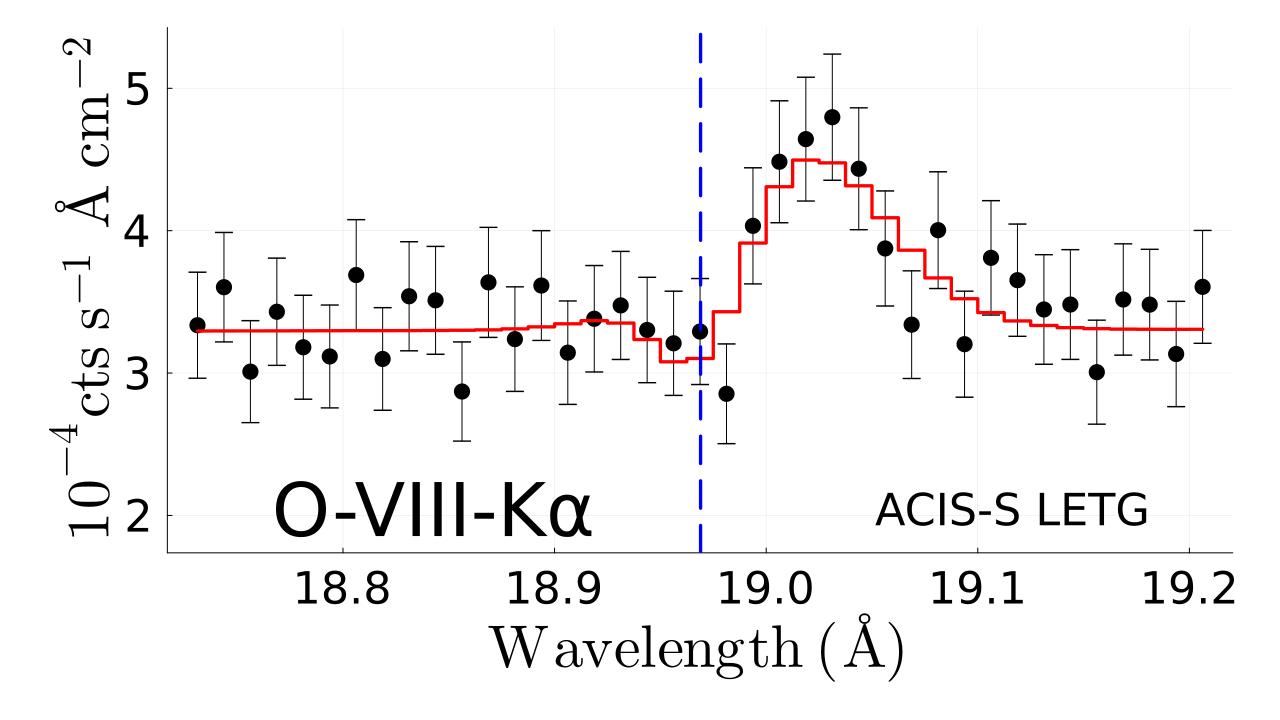
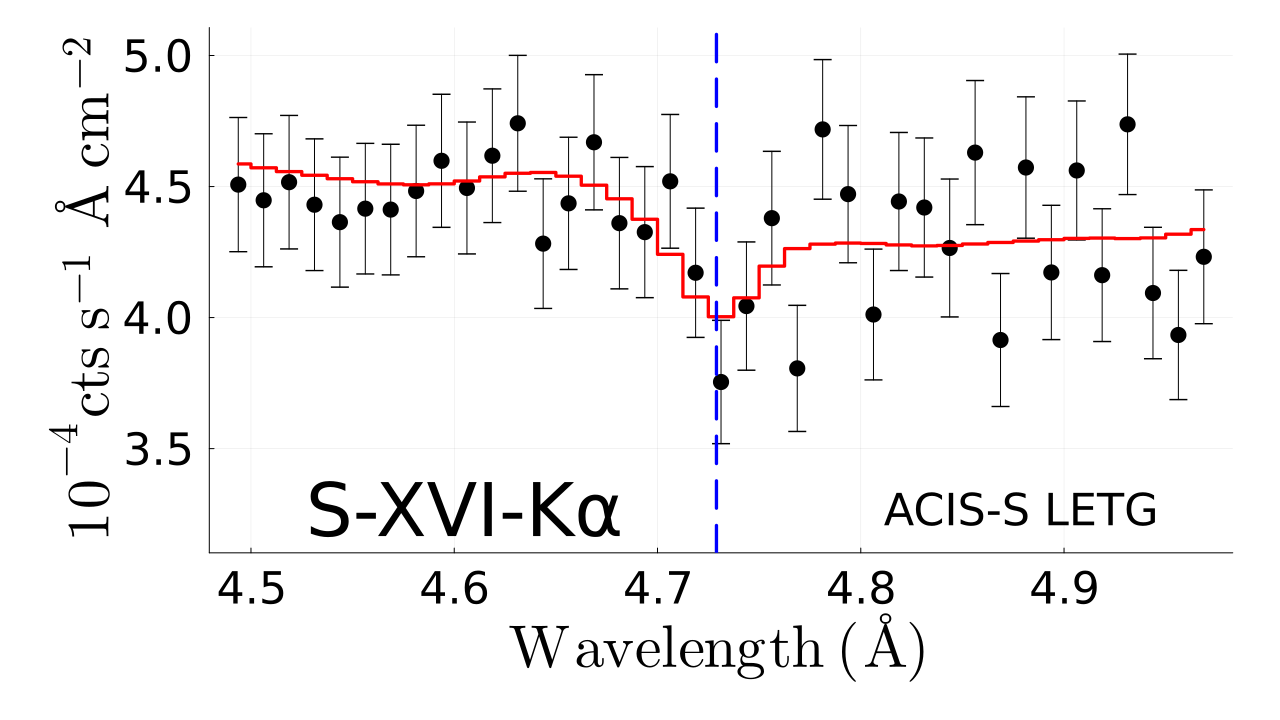
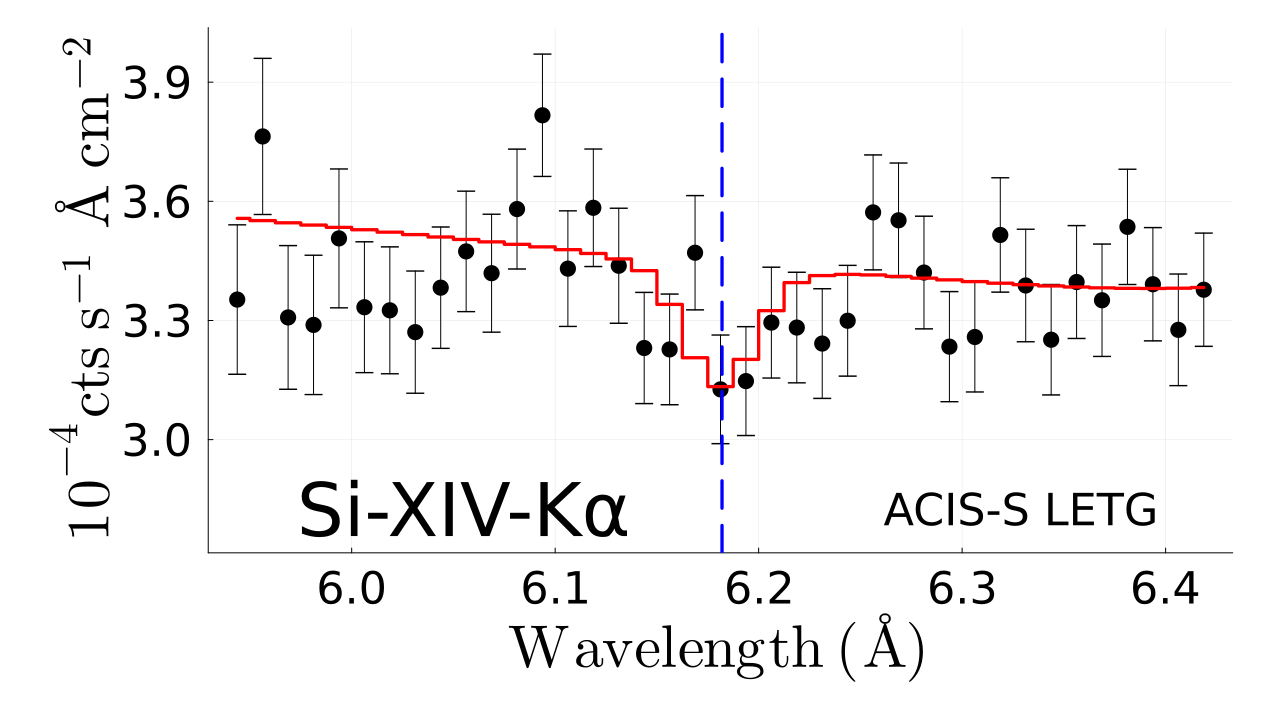
Figures 1 and 2 show the lines fitted with PHASE. The best model fitting MEG and LETG data comprises three different gas components. Each component models different absorption lines in the rest frame of the Milky Way. According to our models, some ionic transitions span through two different temperature components, while others are produced in a single gas phase.
In Table 2, we present the physical parameters of the three components modeled in MEG and LETG datasets. We display the position of the absorption line, its Equivalent Width (EW) and its Ionic Column Density (Nion). Next to SiXIV K and SXVI K parameters in the hot component, we also included in columns (12) and (14) the EW and the ionic column density of the lines as reported in LDI-2023a.
4.1 ACIS-S HETG-MEG
The first component modeling MEG data is a warm-hot component at = 6.19 and column density /cm-2) = 19.12 (hereafter MEG-WARM-HOT). The absorption lines modeled with this component are NVI K, NVII K, NeIX K, OVII K, OVII K, OVII K, and OVIII K. This component improves the fit by a of 61 for two free pareameters.
The second component is a hot component at = 7.50 and column density /cm-2) = 21.30 (hereafter MEG-HOT). The absorption lines modeled with this component are OVIII K, SiXIV K, and SXVI K. This component improves the fit by a of 57 for two additional free parameters
The third component comprising the model fitting MEG data is a warm component at = 5.39 and column density /cm-2) = 18.08 (hereafter MEG-WARM). Only NVI K absorption line is modeled with this component improving the fit marginally by a of 2 for two additional free parameters, see Table 1.
NVI K contributes on the warm and warm-hot component, while OVIII K is contributing in the warm-hot and hot components. On the other hand, NVII K, NeIX K, OVII K, OVII K, OVII K contribute exclusively to the warm-hot component. SiXIV and SXVI contribute exclusively to the hot component.
4.2 ACIS-S LETG
The best model fitting LETG data comprises three distinct gas components. The first component (hereafter LETG-WARM-HOT) represents a warm-hot component with a temperature of = 6.56 and a column density of /cm-2)= 19.56. This component models NeIX K, OVII K, and OVIII K absorption lines. This component improves the fit only by a of 10 for two additional free parameters.
The second and hotter component modeling LETG data is a gas component with a temperature = 7.50 and a column density of /cm-2)= 21.75. This component is referred here as LETG-HOT. The absorption lines modeled with this component are OVIII K, SXVI K, and SiXIV K. This component improves the fit by a of 31 for two additional free parameters.
Finally, the third component fitting this dataset is characterized by a temperature of = 5.64 and a column density of /cm-2)= 19.76, (hereafter LETG-WARM). The absorption lines modeled in this component are OVI K and OVII K. This component improves the fit by a of 36 for two additional free parameters, see Table 1.
In our results for the LETG data, we find OVI K contributing exclusively to LETG-WARM. OVII is present in the LETG-WARM and LETG-WARM-HOT components. NeIX is found exclusively in the LETG-WARM-HOT component. OVIII contributes in both, LETG-WARM-HOT and LETG-HOT, while SiXIV and SXVI are exclusively found in LETG-HOT.
4.3 Metallicity of the CGM
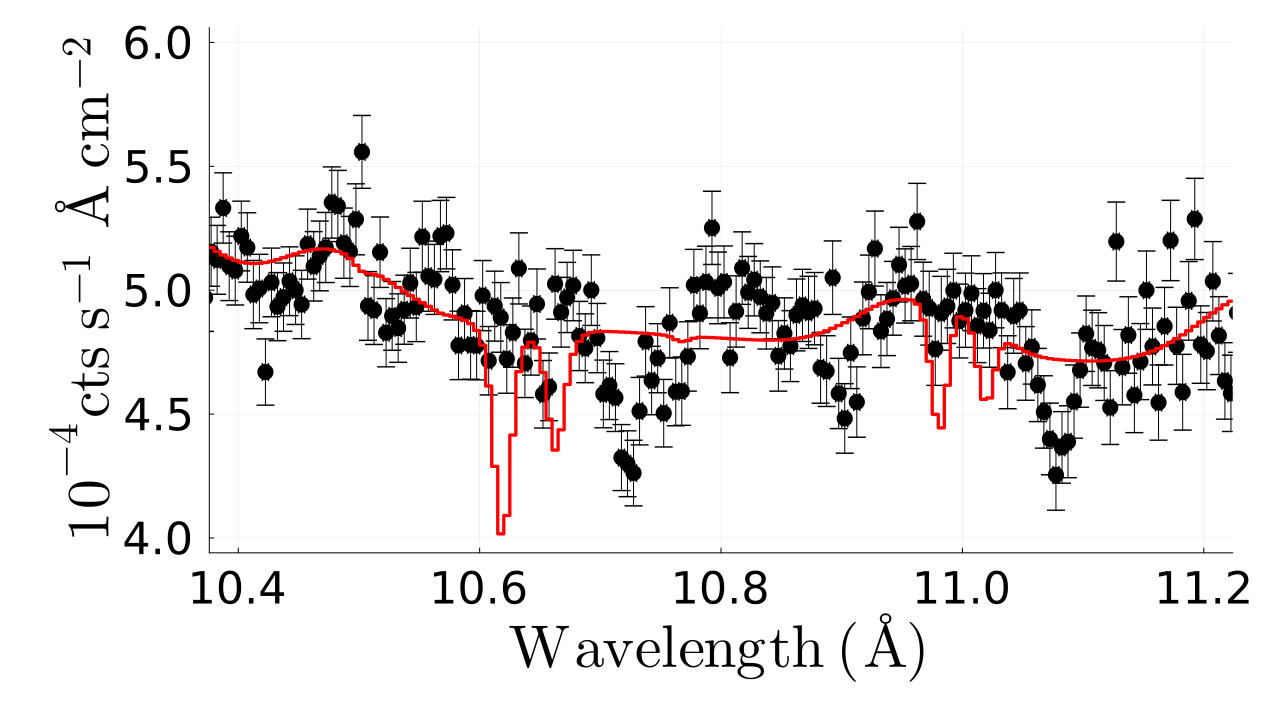
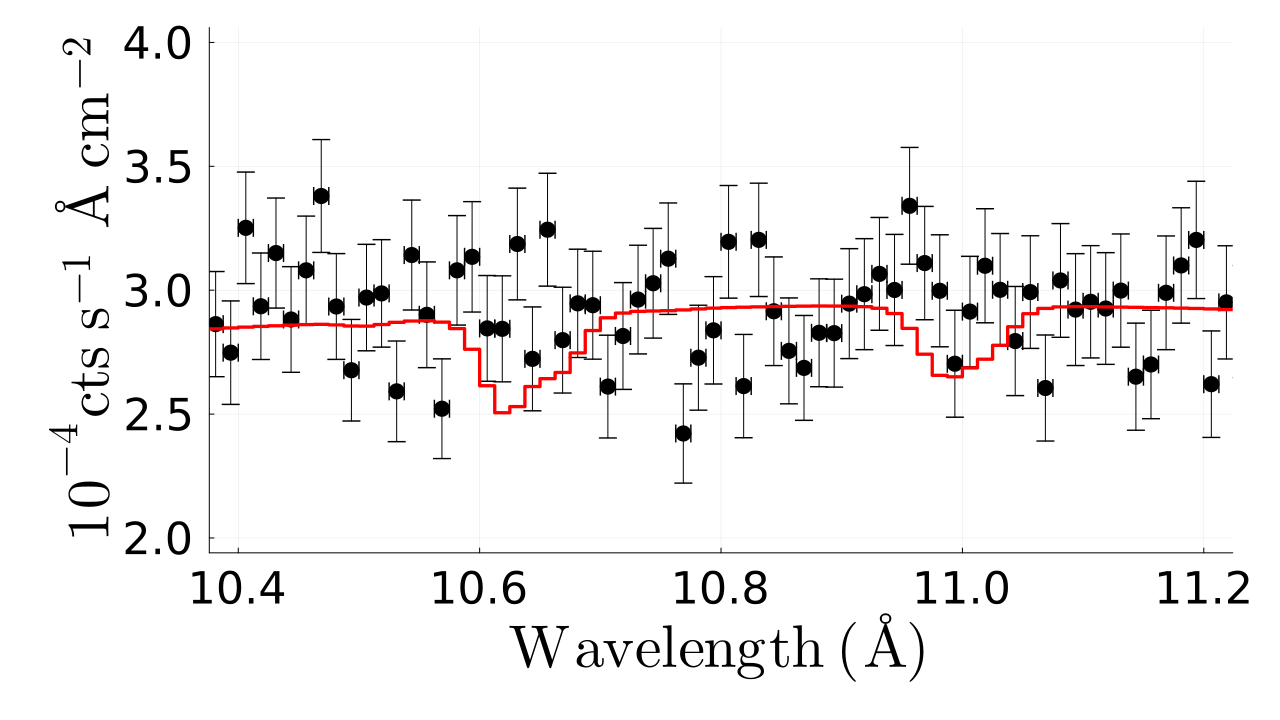
In MEG data, we could not model MEG-HOT with solar Fe abundance since it grossly overpredicts the Fe absorption lines. In Figure 3, we present the spectrum of MEG data in the range 10.4 - 11.2 Å. In this Figure, we show how the model overpredicts the absorption lines of Fe when its abundance is that of Oxygen. To avoid this, the model must consider an abundance of Fe at least four times less than that of Oxygen. We find the abundance of other elements correspond to solar mixture.
In LETG data, the model also overpredicts the Fe L-shell lines in the hot component. Figure 3 shows how the model overpredicts Fe when its abundance is that of Oxygen. In this case, the abundance of Fe in the hot component needs to be at least six times less than that of Oxygen to properly model the data.
We also noticed that for LETG the code prefers 4 times more S/O than the solar value. In this same dataset, the code prefers 1.5 times solar Si/O. Nonetheless, the data is not very sensitive to the abundance of these two elements.
| Component | /cm-2) | ||
| MEG-WARM | 5.39 | 18.08 | 2 |
| MEG-WARM-HOT | 6.19 | 19.12 | 61 |
| MEG-HOT | 7.50 | 21.30 | 57 |
| LETG-WARM | 5.64 | 19.76 | 36 |
| LETG-WARM-HOT | 6.56 | 19.56 | 10 |
| LETG-HOT | 7.50 | 21.75 | 31 |
| Ion | Tran | RestWav (Å) | Wav (Å) | EW (mÅ) | N ion (cm-2) | Wav (Å) | EW (mÅ) | N ion (cm-2) | Wav (Å) | EW (mÅ) | EW (mÅ) | N ion (cm-2) | N ion (cm-2) |
| (1) | (2) | (3) | (4) | (5) | (6) | (7) | (8) | (9) | (10) | (11) | (12) | (13) | (14) |
| MEG-WARM | MEG-WARM-HOT | MEG-HOT | |||||||||||
| = 5.39 | = 6.19 | = 7.50 | |||||||||||
| /cm-2) = 18.08 | /cm-2) = 19.12 | /cm-2) = 21.30 | |||||||||||
| NVI | K | 24.898 | |||||||||||
| NVII | K | 24.781 | |||||||||||
| NeIX | K | 13.447 | |||||||||||
| OVII | K | 21.601 | |||||||||||
| OVII | K | 18.627 | |||||||||||
| OVII | K | 17.768 | |||||||||||
| OVIII | K | 18.969 | |||||||||||
| SXVI | K | 4.729 | () | () | |||||||||
| SiXIV | K | 6.182 | () | () | |||||||||
| LETG-WARM | LETG-WARM-HOT | LETG-HOT | |||||||||||
| = 5.64 | = 6.56 | = 7.50 | |||||||||||
| /cm-2) = 19.76 | /cm-2) = 19.56 | /cm-2) = 21.75 | |||||||||||
| NeIX | K | 13.447 | |||||||||||
| OVI | K | 22.034 | |||||||||||
| OVII | K | 21.601 | |||||||||||
| OVIII | K | 18.969 | |||||||||||
| SXVI | K | 4.729 | () | () | |||||||||
| SiXIV | K | 6.182 | () | () | |||||||||
 |
 |
 |
 |
 |
 |
 |
 |
 |
 |
 |
 |
 |
 |
 |
 |
 |
 |
 |
5 Discussion
We have found that the Milky Way’s CGM comprises at least three phases, a warm ( 5.5), warm-hot ( 6), and hot ( 7.5) component, confirming previous results pointing to the third phase with high temperature (Das et al. 2019 and 2021; LDI-2023a). This hot phase has a column density at least an order of magnitude higher than the warm-hot and warm components. This result is consistent in MEG and LETG data and previous detections of the hot phase (Das et al. 2019 and 2021; LDI-2023a).
5.1 Physical state of the gas in the hot component
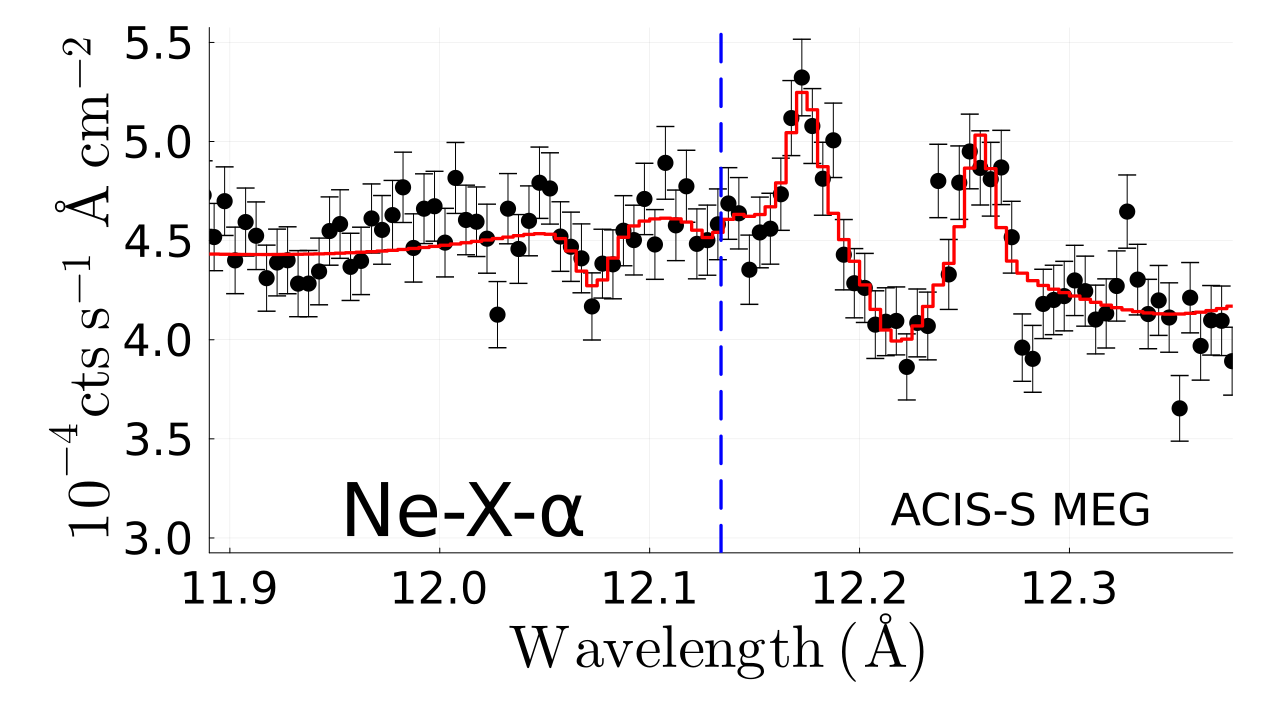
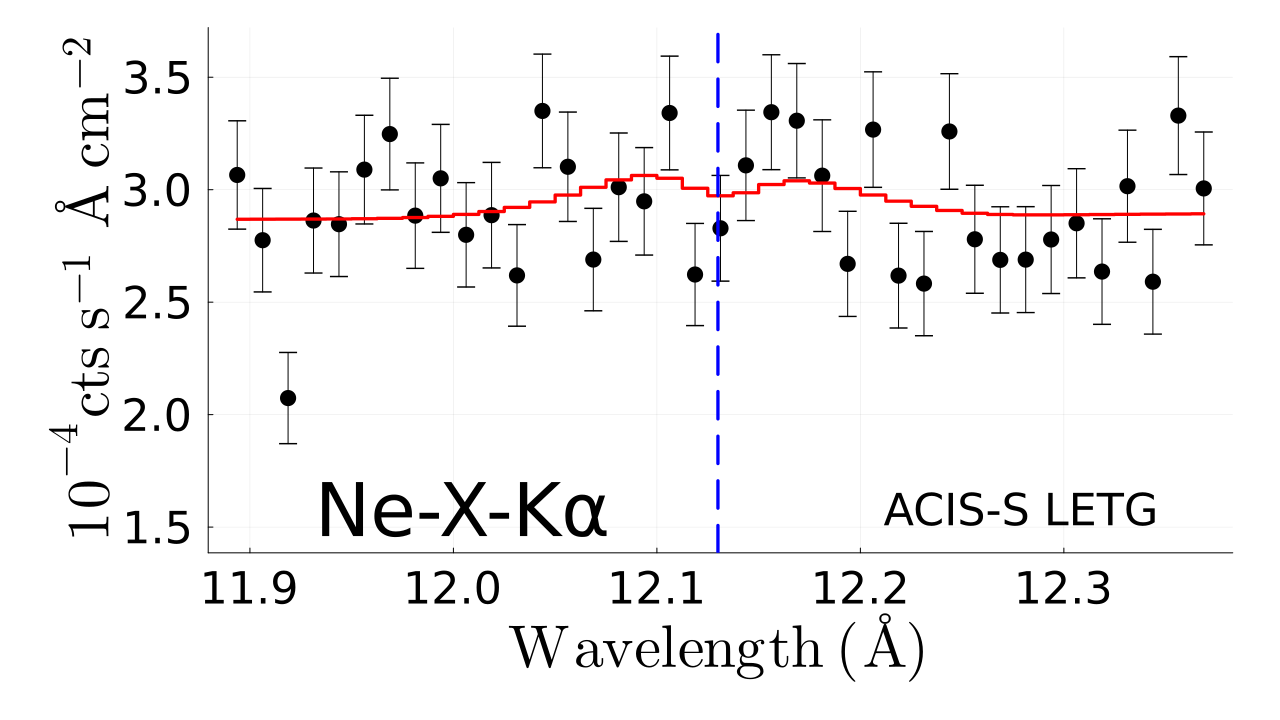
It is interesting to note that we do not see NeX K in MEG or LETG. This is consistent with the high temperature of the hot component. NeX peaks around 6.7, and the fraction of NeX decreases sharlply for higher temperatures. At 7.5, Ne is almost completely ionized. Therefore, our data is consistent with not being able to detect NeX in MEG or LETG, and this is a nice confirmation that the temperature of the gas reaches 7.5. The NeX line should be very weak due to the plasma being very hot. Therefore, it is not detectable with the S/N of our data. In Figure 4 we show our model fitting the data at the position of the rest-wavelength of NeX. We see no prominent absoprtion line of this ion. Das et al. (2019a) and Das et al. (2021b) reported the detection of this line at the same temperature, but their model required super-solar Ne/O abundance. If the plasma had been a factor of two or three lower temperature, say at 7, the NeX line should be very prominent and detectable in our spectra. This result excludes the presence of high quantities of gas in the CGM with temperatures over 6.5 and below 7.5 in the sightlines probed in the stacked spectra.
5.2 Comparison between detections of LDI-2023a and this work
As mentioned in § 1, LDI-2023a clearly detected SiXIV K and SXVI K in the same stacked spectra presented here. In Table 2, we show the EW and Nion predicted by our model with PHASE, contrasted with those measured empirically by LDI-2023a over MEG and LETG with Gaussians. The striking similarity in these values shows that detecting these elements is a robust result in these studies. Therefore, the results presented here fully confirm, with a self-consistent ionization model, the presence of a hot super-virial gas component in the Milky Way’s CGM.
5.3 Statistical significance of each component
In Table 1, we show how much each component changes the statistic for two free parameters (namely, the temperature and the column density of the gas). For MEG data, we find that the gas components weighting more in the statistic are MEG-WARM-HOT with = 61 and MEG-HOT with = 57. The fact that these phases are statistically significant is not a surprise, given the number of absorption lines fit with MEG-WARM-HOT component and given the high column density of MEG-HOT component. On the other hand, the MEG-WARM only changes the statistic by a = 2. We note, however, that there is vast evidence of the presence of this component in UV data (e.g., Tumlinson et al., 2017 and references therein).
In LETG we find that the LETG-WARM and LETG-HOT weight similarly with = 36 and = 31 respectively, making both components statistically significant. On the other hand, LETG-WARM-HOT component only weights = 10 in our model, making it barely significant. This can be attributed to the low S/N ratio of these data, given that the column density of this component found in MEG and LETG are similar. We notice, however, that the OVII K line is clearly detected in the data but with less significance ( 2).
5.4 Comparison between MEG and LETG models
The results from MEG and LETG are consistent. In the warm-hot component, the model over both datasets has similar column densities (within the errors) and temperatures. These parameters are strikingly similar to what has been reported in individual lines of sight (e.g., Gupta et al., 2012). Thus, our results bring more evidence to the homogeneity of this component. This is in contrast to the results found in emission, where a large dispersion up by an order of magnitude has been reported in the temperature (e.g., Henley et al., 2010; Bluem et al., 2022; Gupta et al., 2023 and references therein; Bhattacharyya et al., 2023).
The same happens with the temperature of the hot component, which is consistent within the errors between the two datasets. However, there is a factor of 3 in the column densities between the data of the two instruments. We note that only one source in LETG is not present in MEG stacked spectrum. Nevertheless, there are 38 more sources in MEG than in LETG. Therefore, this result, along with the consistency between our findings and those found in individual lines of sight (Das et al., 2019a, Das et al., 2021b), suggest that this component might also be homogeneous in temperature but with some dispersion in column density.
In the warm component, there are some differences between MEG and LETG. These differences are marginal in temperature but become much larger in terms of column density. We find that this component is only constrained through one or two lines from one or two ions. Given this, and the low S/N ratio in the LETG data, and the low significance of this component in the MEG data, we consider that while we have enough evidence for the presence of this component (e.g., Tumlinson et al., 2017), we cannot constrain robustly its parameters.
5.5 Atomic abundances in the hot component
We find additional evidence of inhomogeneities in the hot component in addition to those in the column density reported above. In particular, the abundance of SXVI is 3.5 times larger in LETG than in MEG. Additionally, we find that Si/O in LETG is 2 times that in MEG. The abundance of Fe is strikingly below what is expected for solar mixture. As observed in Figure 3, this is a strong observational constraint. In LETG we required O/Fe larger than solar by at least a factor of 6, and in MEG by at least a factor of 4. The sub-solar Fe/O was also found by Das et al. (2019a) and Das et al. (2021b). Abundances for other atoms are consistent with solar mixture, but we notice that the sensitivity of both stacked spectra is very limited for many of the absorption transitions.
5.6 Dispersion Measure of the hot phase
In the present work, the column density of the hot phase as measured in MEG data is
| (1) |
where the Oxygen abundance and metallicity in the PHASE models discussed in this paper have been assumed to be solar ( Asplund et al. (2009) and ). The dispersion measure (DM), however, provides a constraint on the combination of these parameters.
The DM of the CGM has been investigated using Fast Radio Bursts (FRBs) and Galactic Pulsars (e.g., Prochaska & Zheng, 2019; Platts et al., 2020; Das et al., 2021a; Cook et al., 2023). Platts et al., 2020 found a DM for the Galactic halo () of
| (2) |
where the errors are .
We calculated the contribution to the DM from the warm-hot component (DMvirial) using equation (5) from Das et al. (2021a). By considering the OVII column density () and its ionic fraction (0.826) on the MEG-WARM-HOT component, we obtained DM We then calculated the DM for the super-virial component using
| (3) |
These results implies that the observed hot gas is either enriched in Oxygen, Silicon and Sulfur (the elements driving the detection of the hot component in this work), or has super-solar metallicity or a combination of both. For the best value of pc cm-3, and assuming solar abundance, the metallicity required would be 9 times solar, or over 6 solar assuming the 1 lower limit. In § 5.5 we already discussed the over solar mixture of these elements. This further suggests that the hot component finds its origin in galactic winds of enriched material.
5.7 Contribution for OII K?
Finally, we note that the rest wavelength of OVI K is 22.034 Å. This wavelength also corresponds to the rest-wavelength of OII K (22.04 Å; Mathur et al., 2017). We are uncertain about the contribution of OII K to the OVI K absorption line. However, this possible contamination by OII does not affect the detection of the warm component since NVI K in MEG (EW = mÅ), arising from this gas, is detected.
6 Conclusion
Our detections confirm the presence of the hot component of the Milky Way’s CGM coexisting with a warm and warm-hot phases. The characteristic high temperature at 7.5 of this component where SiXIV and SXVI are detected is further supported by the non-detection of NeX, since Ne is expected to be almost completley ionized into NeXI at those temperatures, and its abundance is not that high as that for Oxygen. This result also excludes the presence of high quantities of gas in the CGM with temperatures over 6.5 and below 7.5. This hot component is permeating the Milky Way’s CGM, and points to be homogeneous in temperature and inhomogeneous in column density.
In our analysis of Lara-DI et al., 2023, we inspected for each sightline the presence of prominent absorption lines at . None of these individual sightlines present these prominent features. Moreover, we conducted simulations to evaluate whether the observed detections could arise from only a few sightlines. We determined the likelihood of encountering, in an N-sightlines stacked spectrum, individual spectra presenting an absorption line at least N times stronger than that detected in the stacked spectrum. Our analysis indicates that after stacking 40 spectra, this probability diminishes to a negligible value. Therefore, our results point to a hot phase being widespread in the halo - since the final stacked spectra is the result of the contribution from many sightlines.
In order to be consistent with the DM obtained from FRBs in the literature, the hot CGM gas observed in the halo is either enriched in Oxygen, Silicon, and Sulfur, or has metallicity of at least 4.4 times solar value, or a combination of both. This, along with the sub-solar Fe/O found for this component, and that found in the ISM in other works, are key for understanding the heating, cooling and mixing mechanisms within the CGM. In particular, our results provide tantalizing suggestions that the super-virial component of the CGM is the result of feedback from winds arising in the Galaxy.
Acknowledgments
The authors of this work thank the anonymous referee for his/her valuable comments. L.D.I. acknowledges support from CONACYT through the PhD scholarship grant 760672. Y.K. acknowledges support from grant DGAPA PAPIIT 102023. S.M. is grateful for the grant provided by the National Aeronautics and Space Administration through Chandra Award Number AR0-21016X issued by the Chandra X-ray Center, which is operated by the Smithsonian Astrophysical Observatory for and on behalf of the National Aeronautics Space Administration under contract NAS8-03060. S.M. is also grateful for the NASA ADAP grant 80NSSC22K1121. S.D. acknowledges support from the KIPAC Fellowship of Kavli Institute for Particle Astrophysics and Cosmology Stanford University.
Data Availability
All data used in this article are available online via the Chandra Data Archive: https://cda.harvard.edu/chaser/
References
- Asplund et al. (2009) Asplund M., Grevesse N., Sauval A. J., Scott P., 2009, ARA&A, 47, 481
- Bhattacharyya et al. (2023) Bhattacharyya J., Das S., Gupta A., Mathur S., Krongold Y., 2023, ApJ, 952, 41
- Bluem et al. (2022) Bluem J., et al., 2022, ApJ, 936, 72
- Cook et al. (2023) Cook A. M., et al., 2023, The Astrophysical Journal, 946, 58
- Das et al. (2019a) Das S., Mathur S., Nicastro F., Krongold Y., 2019a, ApJ, 882, L23
- Das et al. (2019b) Das S., Mathur S., Gupta A., Nicastro F., Krongold Y., 2019b, The Astrophysical Journal, 887, 257
- Das et al. (2021a) Das S., Mathur S., Gupta A., Nicastro F., Krongold Y., 2021a, MNRAS, 500, 655
- Das et al. (2021b) Das S., Mathur S., Gupta A., Krongold Y., 2021b, ApJ, 918, 83
- Feldmann et al. (2013) Feldmann R., Hooper D., Gnedin N. Y., 2013, ApJ, 763, 21
- Gupta et al. (2012) Gupta A., Mathur S., Krongold Y., Nicastro F., Galeazzi M., 2012, ApJ, 756, L8
- Gupta et al. (2021) Gupta A., Kingsbury J., Mathur S., Das S., Galeazzi M., Krongold Y., Nicastro F., 2021, ApJ, 909, 164
- Gupta et al. (2023) Gupta A., Mathur S., Kingsbury J., Das S., Krongold Y., 2023, in AAS/High Energy Astrophysics Division. p. 102.19
- Henley et al. (2010) Henley D. B., Shelton R. L., Kwak K., Joung M. R., Low M.-M. M., 2010, The Astrophysical Journal, 723, 935
- Kereš et al. (2005) Kereš D., Katz N., Weinberg D. H., Davé R., 2005, Monthly Notices of the Royal Astronomical Society, 363, 2
- Kirkman et al. (2003) Kirkman D., Tytler D., Suzuki N., O’Meara J. M., Lubin D., 2003, ApJS, 149, 1
- Krongold et al. (2003) Krongold Y., Nicastro F., Brickhouse N. S., Elvis M., Liedahl D. A., Mathur S., 2003, ApJ, 597, 832
- Krongold et al. (2007) Krongold Y., Nicastro F., Elvis M., Brickhouse N., Binette L., Mathur S., Jiménez-Bailón E., 2007, ApJ, 659, 1022
- Lara-DI et al. (2023) Lara-DI A., Mathur S., Krongold Y., Das S., Gupta A., 2023, The Astrophysical Journal, 946, 55
- Li et al. (2018) Li J.-T., Bregman J. N., Wang Q. D., Crain R. A., Anderson M. E., 2018, The Astrophysical Journal Letters, 855, L24
- Mathur (2022) Mathur S., 2022, Probing the Circumgalactic Medium with X-Ray Absorption Lines. Springer Nature Singapore, Singapore, pp 1–36, doi:10.1007/978-981-16-4544-0_112-1, https://doi.org/10.1007/978-981-16-4544-0_112-1
- Mathur et al. (2017) Mathur S., Nicastro F., Gupta A., Krongold Y., McLaughlin B. M., Brickhouse N., Pradhan A., 2017, ApJ, 851, L7
- Mathur et al. (2021) Mathur S., Gupta A., Das S., Krongold Y., Nicastro F., 2021, ApJ, 908, 69
- Mathur et al. (2023) Mathur S., Das S., Gupta A., Krongold Y., 2023, Monthly Notices of the Royal Astronomical Society: Letters, 525, L11
- McClain et al. (2024) McClain R. L., Mathur S., Das S., Krongold Y., Gupta A., 2024, MNRAS, 527, 5093
- McGaugh et al. (2010) McGaugh S. S., Schombert J. M., de Blok W. J. G., Zagursky M. J., 2010, ApJ, 708, L14
- Peeples et al. (2014) Peeples M. S., Werk J. K., Tumlinson J., Oppenheimer B. D., Prochaska J. X., Katz N., Weinberg D. H., 2014, ApJ, 786, 54
- Planck Collaboration et al. (2016) Planck Collaboration et al., 2016, A&A, 594, A13
- Platts et al. (2020) Platts E., Prochaska J. X., Law C. J., 2020, ApJ, 895, L49
- Prochaska & Zheng (2019) Prochaska J. X., Zheng Y., 2019, Monthly Notices of the Royal Astronomical Society, 485, 648
- Stinson et al. (2012) Stinson G. S., et al., 2012, MNRAS, 425, 1270
- Tumlinson et al. (2017) Tumlinson J., Peeples M. S., Werk J. K., 2017, ARA&A, 55, 389
- Wang et al. (2005) Wang Q. D., et al., 2005, The Astrophysical Journal, 635, 386
- Zheng et al. (2015) Zheng Y., Putman M. E., Peek J. E. G., Joung M. R., 2015, ApJ, 807, 103