A smooth filament origin for prolate galaxies “going bananas” in deep JWST images.
Abstract
We compare the abundant prolate shaped galaxies reported in deep JWST surveys, with the predicted stellar appearance of young galaxies in detailed hydro-simulations of three main dark matter contenders: Cold (CDM), Wave/Fuzzy (DM) and Warm Dark Matter (WDM). The observed galaxy images closely resemble the elongated stellar appearance of young galaxies predicted by DM and WDM, during the first 500Myr when material steadily accretes along smooth filaments. The dark mater halos of WDM and DM also have pronounced, prolate elongation similar to the stars, indicating a shared, highly triaxial equilibrium. This is unlike CDM where the early stellar morphology is mainly spheroidal, formed from fragmented filaments with frequent merging, resulting in modest triaxiality. Quantitatively, the excess of prolate galaxies observed by JWST matches well WDM and DM for particle masses of 1.4KeV and eV respectively. For CDM, several visible subhalos are typically predicted to orbit within the virial radius of each galaxy, whereas sub-halos are absent for WDM and DM, so early merging is rare. We also find that DM is distinguishable from WDM by the form of the core, which is predicted to be smooth and centered for WDM but is a dense soliton for DM and typically offset from the galaxy center by wave perturbations. We emphasise the long, smooth filaments of DM and WDM may be detectable with JWST, traced by stars and gas with comoving lengths of 150kpc predicted at z10, depending on the DM particle mass.
1 Introduction
The outstanding imaging capability of JWST at wavelengths of several microns allows young galaxies detected at very early times to be compared directly with the optical rest-frame morphologies of nearby galaxies at low redshift. A careful statistical analysis by Pandya et al. (2024) of the JWST/CEERS imaging survey (Finkelstein et al., 2023), appears to establish that prolate shaped galaxies predominate at high redshift. This claim rests on the large excess (“going bananas”) of clearly elongated galaxies at compared to the statistical distribution of projected triaxial ellipsoids spanning the full range of spheroidal, oblate and prolate shapes (Pandya et al., 2024). Early HST imaging had hinted at this possibility with the recognition of unusual “chain” galaxies with aligned HII regions in rest-frame UV images (Cowie et al., 1995), but these were generally regarded as simply edge-on disk galaxies given the geometric bias towards detection of transparent edge-on disks. However, the case for intrinsically elongated high-z galaxies was substantially reinforced in deeper Hubble images of the CANDELS survey and the HDF, where elongated, “tadpole” galaxies were recognised by Straughn et al. (2006) comprising a common prolate class emphasised by van der Wel et al. (2014); Zhang et al. (2019). Further clarification was provided with spectroscopic redshifts in the pioneering survey of Law et al. (2012), covering 1.5z3.6, where HST morphologies clearly preferred prolate triaxiality, with mean axis ratios , , over an oblate disk population (Law et al., 2012).
This developing empirical picture, now substantially reinforced by (Pandya et al., 2024) with steady evolution of the projected ellipticity distribution that extends beyond the level for oblate disks to larger prolate triaxiality for the majority of high redshift galaxies that typically appear highly elongated at z3 Pandya et al. (2024). This evolution is at odds with expectations conditioned by CDM simulations and the long held notion that disks should promptly form when galaxies first collapse. Instead, the majority of distant galaxies at high redshift may be initially prolate, at a level well in excess of the modest triaxiality of standard CDM. Furthermore, disk formation by implication is implied to emerge later, and with evolution that is observed to be modest since z1.5 (Odewahn et al., 1997). Note that despite the approximately prolate shape of a banana, the term “going bananas” is invoked by Pandya et al. (2024) to describe their curved shaped distribution of predicted ellipticities (see Figure 3 here), indeed few faint galaxies are actually banana shaped despite being typically elongated in appearance.
Here we compare detailed high-z simulations for three contending dark matter models in terms of the high resolution 3D stellar distributions predicted by hydrodynamical simulations for CDM, WDM and DM with matching initial conditions, allowing direct comparison of galaxy formation between these three classes of DM, as described fully in Mocz et al. (2017, 2019). The motivation for CDM and WDM is of course long-standing, but diminishing with increasingly stringent laboratory absence of any heavy particle DM contender or direct underground detection (Aprile et al., 2022), including WIMP’s at the TeV range, or new keV mass scale particles needed for WDM. However, WDM remains physically viable in terms of hypothetical right-handed “sterile” neutrinos as these naturally evade Standard Model interactions provided they are light enough that early relativistic free streaming results in sizeable DM cores and significantly suppresses lower mass galaxies.
In addition to these traditional DM classes, we explore “Wave Dark Matter”, DM, which is proving increasingly viable as a non-relativistic dark matter candidate. This is described as a coherent condensate comprised of de Broglie scale waves, including a prominent standing wave ground state, or soliton, near the center of each virialised halo (Schive et al., 2014; Veltmaat et al., 2018, 2020; Mocz et al., 2017; Chan et al., 2022; Pozo et al., 2020). Initially termed “Fuzzy” for quantum uncertainty, it is now clear that “Wave” is a more characteristic description (Schive et al., 2014; Hui, 2021), as revealed by the first simulations where pervasive waves fully modulate the boson density everywhere on the de Broglie scale, ranging from constructive to destructive interference that we term DM. To date a number of relatively small volumes have been simulated for DM and these are limited to high redshift, as unlike N-body based simulations of CDM and WDM, the de Broglie waves of DM must be followed on a 3D grid with sufficient spatial and temporal resolution to accurately predict evolution, becoming more difficult at lower redshift as the box size increases relative to the de Broglie scale that needs to be followed. The details of this wave behaviour is now established in independent simulations utilising different grid based methods (Schive et al., 2014; Mocz et al., 2017; Li et al., 2021). Here we examine the comprehensive hydrodynamical simulations performed by Mocz et al. (2017), which remain unique in following the co-evolution of the DM waves together with gas hydrodynamics and a self-consistent model for star formation along with comparison simulations of CDM and WDM starting from the same initial conditions (Mocz et al., 2017). These detailed simulations have led to new insights including the exciting possibility that star formation occurs along early smooth filaments of WDM and DM (Mocz et al., 2019, 2020), reinforcing the pioneering WDM filament simulation by Gao & Theuns (2007). The core-halo structure of stars formed in these simulations has also revealed that the stellar distribution within the central soliton provides a distinguishing prediction; namely a distinct core as a significant overdensity of stars that is typically offset from the galaxy center, similar to the stellar cores visible in a comprehensive study of local dwarfs, where a marked transition is evident in the stellar profiles between a prominent core and diffuse outer halo (Pozo et al., 2023).
Here we compare the stellar predictions for the three contending DM scenarios with the observational work of Pandya et al. (2024) based on deep JWST images from CEERS (Finkelstein et al., 2023) in several passbands spanning . We determine the 3D shapes of our simulated galaxies in the same way as Pandya et al. (2024) using the 3D and projected stellar morphologies predicted by the simulations. We examine the trend with galaxy age since the time of formation in our simulations and also the shape evolution as a function of stellar mass allowing us to make comparisons of the observational trends reported with all three classes of DM simulations. Finally, we also make predictions for the appearance of filaments at high redshift and internal galaxy gas dynamics that can help further test our conclusions presented here in §3. A full set of simulated galaxies is published in Mocz et al. (2017), and provided in our Appendix for each output time of the simulation, and 3D videos showing the evolution of the three comparison DM model simulations can be obtained by request.
2 Simulation comparison with JWST
In this section, we compare our simulations with the results observed in Pandya et al. (2024) for approximately the same range of redshifts as the observations, . It is important to appreciate that the simulations make predictions for the stellar appearance of galaxies based on the co-evolution of the gas and dark matter in each of the three classes of simulation, and thus allow direct comparisons with the observations. Furthermore, the simulations analysed here were made several years before the advent of JWST and hence represent genuine priors. In this section we will highlight the obvious similarity of the WDM and DM predictions in terms of the formation and the evolution of galaxy morphology and we will draw attention to the unique central soliton as a potential means to separately distinguish between these two classes of dark matter.
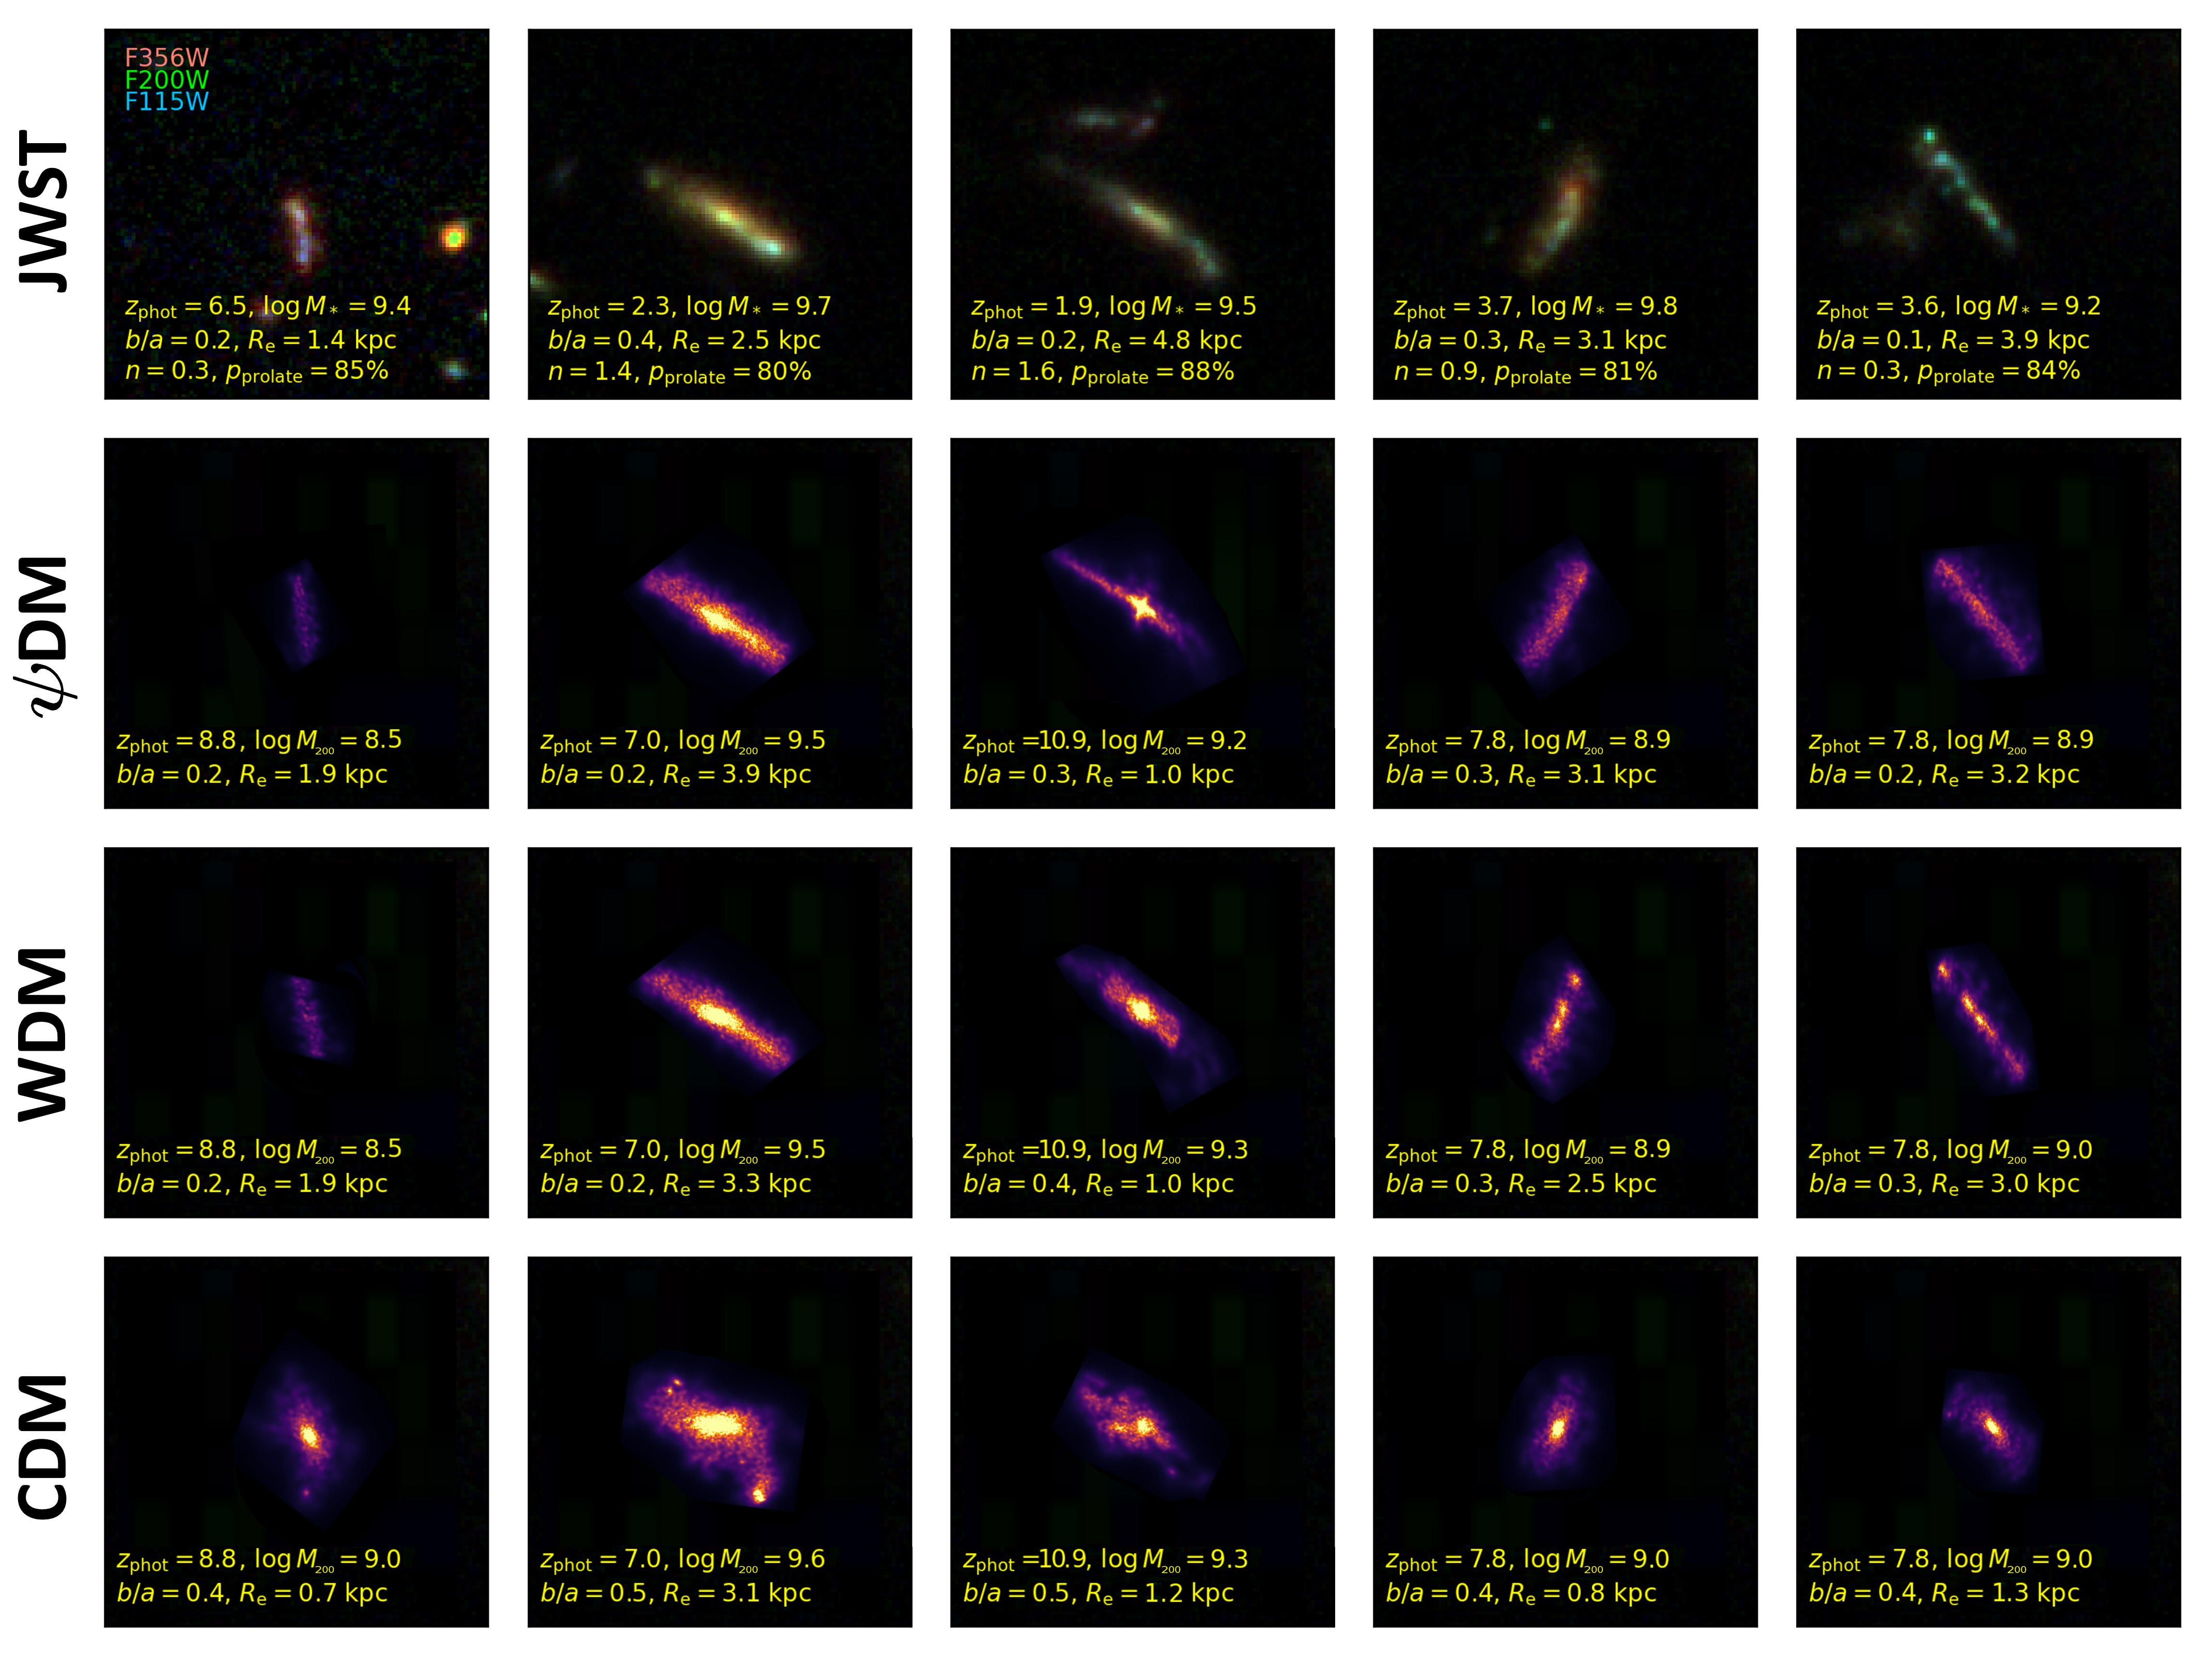
To begin, we first make an illustrative comparison between typical observed galaxies from Pandya et al. (2024) and the visual appearance of our simulated galaxies for the three DM classes subjective level. For each of the the first five representative galaxies highlighted by Pandya et al. (2024), shown in the top row of Figure 1, we have chosen a simulated galaxy that matches best in terms of stellar appearance and in so doing we fix the range of stellar density to be equal for all three simulated DM model galaxies shown in each column of Figure 1. The observed galaxies are typically elongated in appearance (as highlighted by Pandya et al. (2024)) and we readily find similar looking simulated galaxies for DM or WDM, as these are also typically elongated, as can be seen in Figure 1. However, for CDM, the stellar morphologies of the corresponding simulated galaxies are noticeably rounder and show additional local substructure from merging sub-halos that are less like the observed examples of Pandya et al. (2024). In general, smooth and elongated galaxies are not found in the CDM simulations, as quantified below. In this comparison the simulated galaxies extend to higher redshifts than the observations of Pandya et al. (2024), with a correspondingly large evolution in mass that we examine below in relation to the distribution of predicted ellipicities.
The marked difference in predicted stellar morphology that we have highlighted between CDM and the other two DM classes, DM & WDM, is a consequence of the difference in terms of the initial power spectrum and its subsequent evolution. For CDM, the scale-free formation of DM halos extends to arbitrarily lower halo masses, with higher DM concentrations. In contrast, small-scale suppression of the power spectrum is inherent to both DM and WDM. In the case of DM, this limits the minimum scale of structure to below the de Broglie wavelength set by the boson mass. Consequently, DM structures below are suppressed for a boson mass of eV and motivated by the observed kpc scale of dwarf galaxy cores (Chan et al., 2015; Pozo et al., 2024). For WDM it is early relativistic free streaming that smooths the density field on small scales and also means low mass galaxy formation is strongly suppressed but in a physically very different way than DM, which is always non-relativistic unlike WDM and corresponds to a keV scale particle mass to approximately match the kpc cores of dwarf galaxies.
This suppression of small scale structure in both DM and WDM translates into a significant delay in the onset of galaxy formation relative to CDM, which is very evident in the simulations (Mocz et al., 2020). Furthermore, the simulations predict the development of long, smooth filaments forming first in both WDM and DM, ahead of galaxy formation; see figure 3 of Mocz et al. (2020). This contrasts with the fragmented filaments of CDM, where low-mass subhaloes quickly form due to the presence of small scale power. In contrast, for DM & WDM, fragmentation is not seen along the filaments in the simulations, reflecting the small-scale cutoff of the power spectrum so that dark matter is distributed smoothly along these filaments. In addition to the shape difference between the elongated galaxies of DM & WDM and the irregular spheroidal of CDM, we notice that the stellar profiles are more concentrated compared to DM & WDM, for the corresponding galaxies seen in all three simulations, due to the earlier star formation with CDM and the absence of infall from filaments.
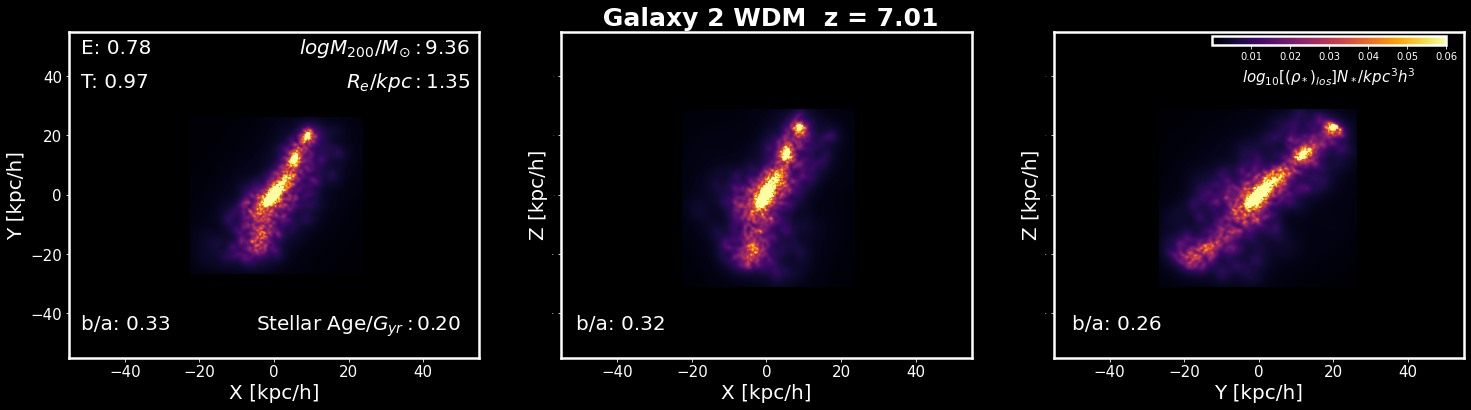
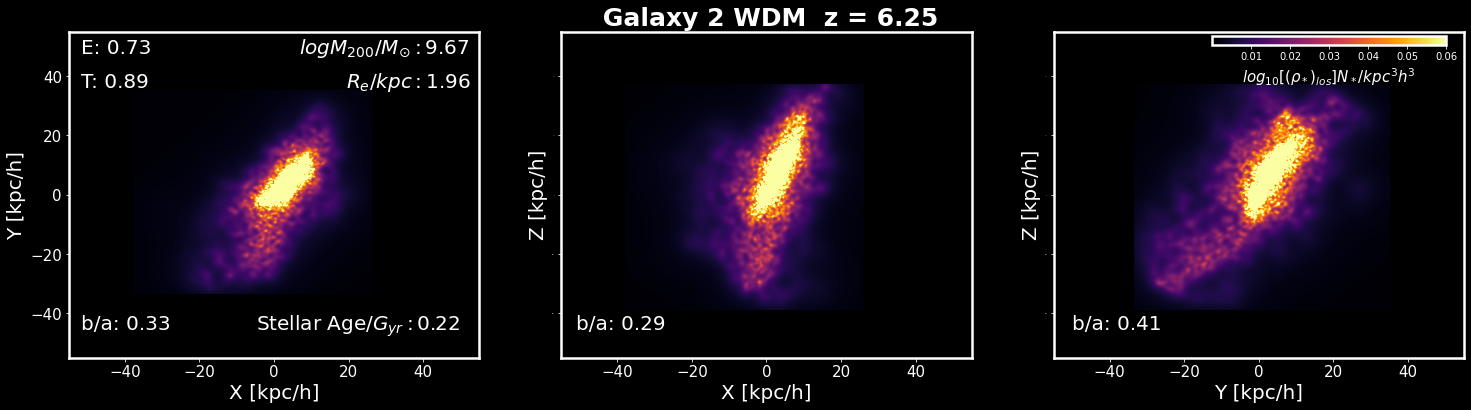
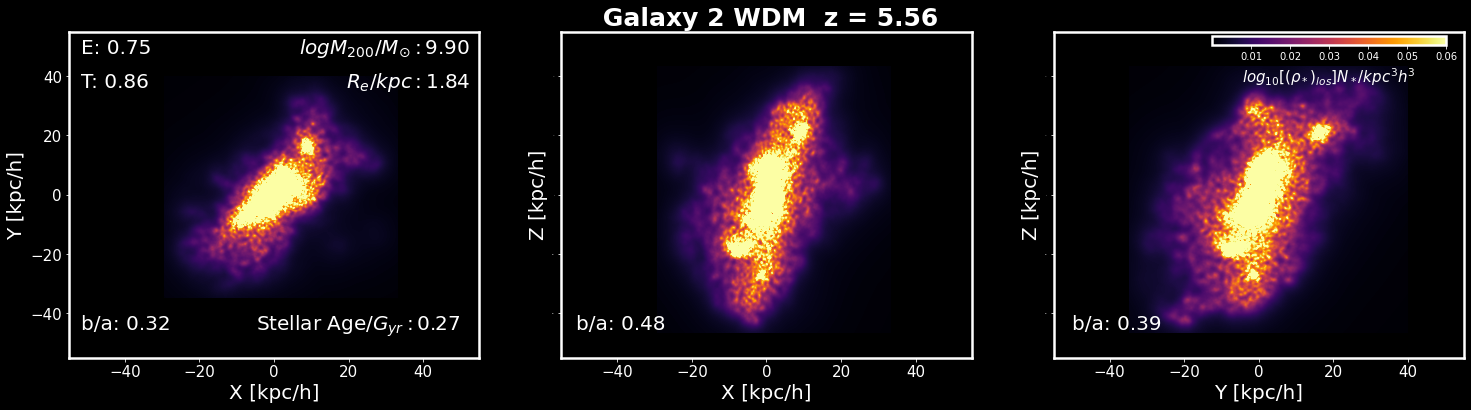
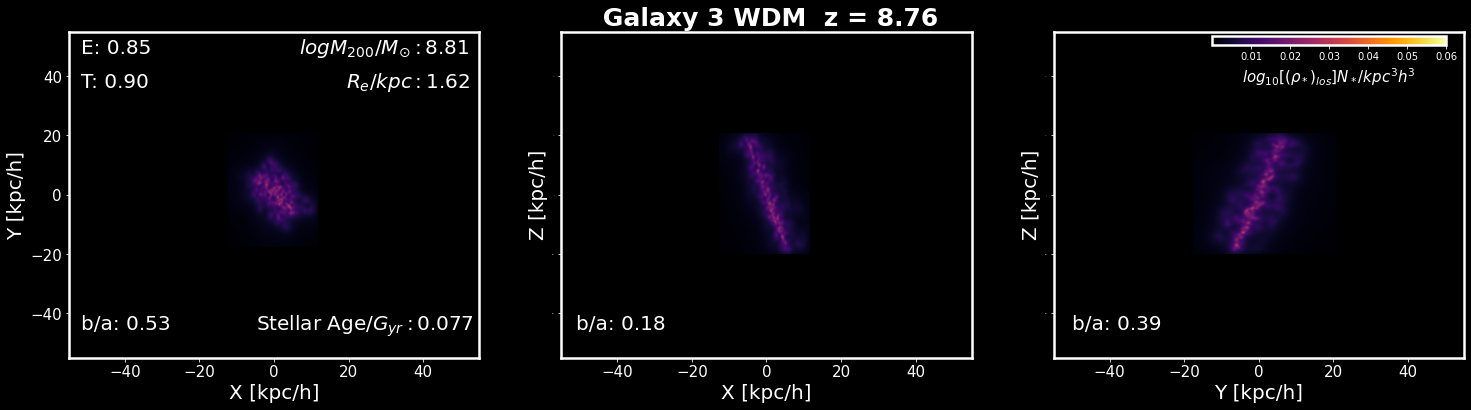
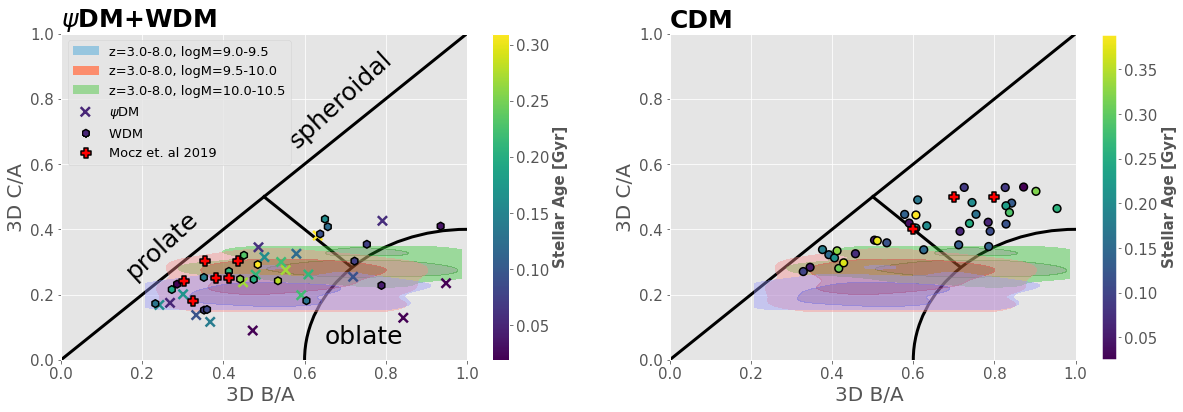
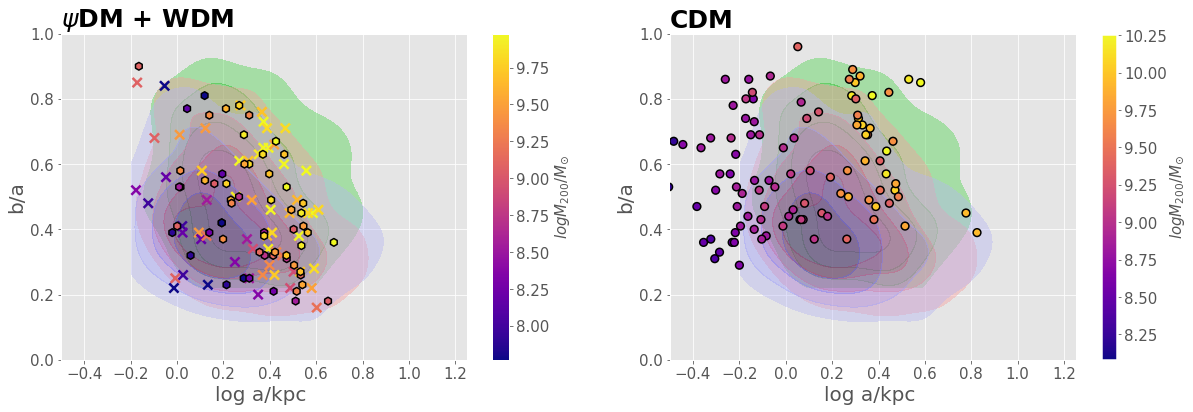
We find that prolate shapes with b/a values between 0.2-0.4 and E and T values close to 1.0 dominate for the low-mass galaxies in our simulations, especially at high redshifts and this prolate tendency remains for up to 0.5 Gyr and beyond in some cases. In contrast, for CDM, the stellar appearance we predict for galaxies is mainly spheroidal at all times, as shown in Figure 1, with subhalos visible in most cases, and in contrast to the equivalent galaxies predicted for both DM and WDM. These differences are highlighted in Figures 2 and 3. The first row of Figure 2 illustrates how the DM & WDM galaxies represent better the observations from Pandya et al. (2024), where observed galaxies of low, medium and high stellar mass are indicated by the three colored areas depicted in bottom row of Figure 2, respectively. The bottom row reinforces this conclusion, showing that DM & WDM galaxies follow well the detected range found by Pandya et al. (2024). We also find in Figure 2 an absence of predicted galaxies with small sizes 1kpc for both for DM & WDM, in agreement with observations, which is a consequence of the suppression of power on small scales inherent to both these forms of DM. However for CDM this low mass region is populated in the simulations with early forming low mass galaxies, in tension with the reported data.
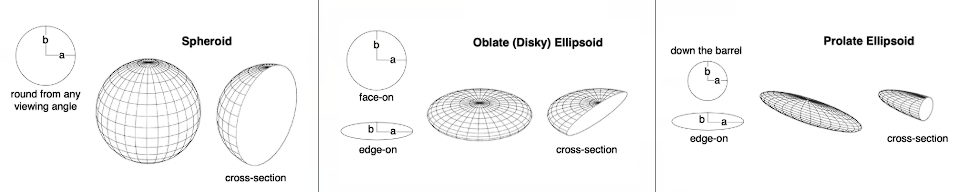
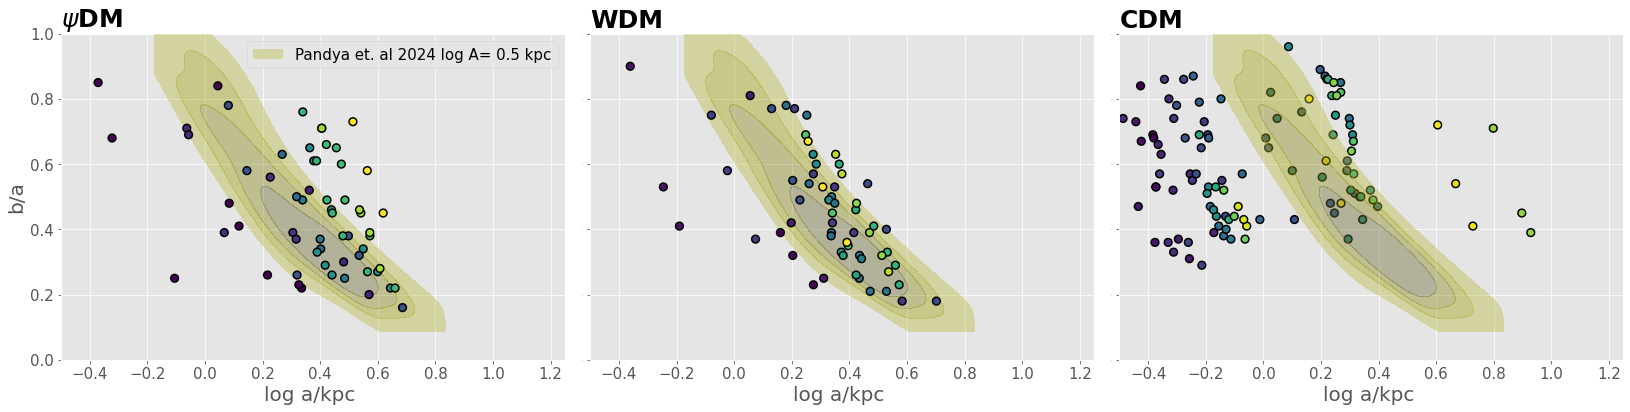
In Figure 3 the projected distribution of semi-axis ratio, b/a, and semi-major axis, a, for the stellar content of galaxies in the simulations reveals that WDM and DM are hard to distinguish from each other but differ markedly from CDM. The distribution of b/a for both WDM & DM can be seen to extend to lower values than for CDM where most galaxies are predicetd to be rounder for CDM in terms of the projected stellar ellipticity. The distribution of JWST measurements by Pandya et al. (2024) are shown for comparison as the shaded area for the highest redshift bin and is clearly well matched by both WDM & DM for galaxies with relatively young ages Gyrs generated in our simulations. This distinction between DM models is more obvious in 3D where the first row of Figure 2 illustrates the distribution of 3D axis ratios of the simulated galaxies (points) and comapred with the observationally inferred distribution (shaded areas) taken from Pandya et al. (2024). The black boundaries classify 3D ellipsoids into prolate, oblate, and spheroidal shapes following van der Wel et al. (2014) and Zhang et al. (2019), as adopted by Pandya et al. (2024). For both DM & WDM our simulated galaxies fall mainly in the prolate class, in agreement with the JWST based measurements of Pandya et al. (2024) at high redshift, . In contrast for CDM the predicted stellar based ellitpicity does not match well the observed behaviour, with most CDM predicted galaxies classified as spheroidal independently of their age or stellar mass.
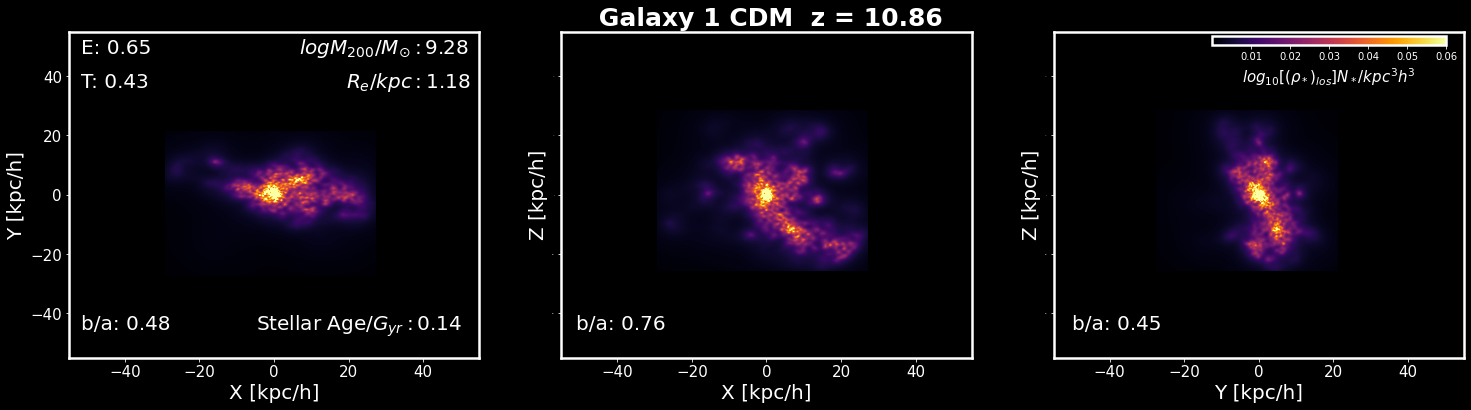
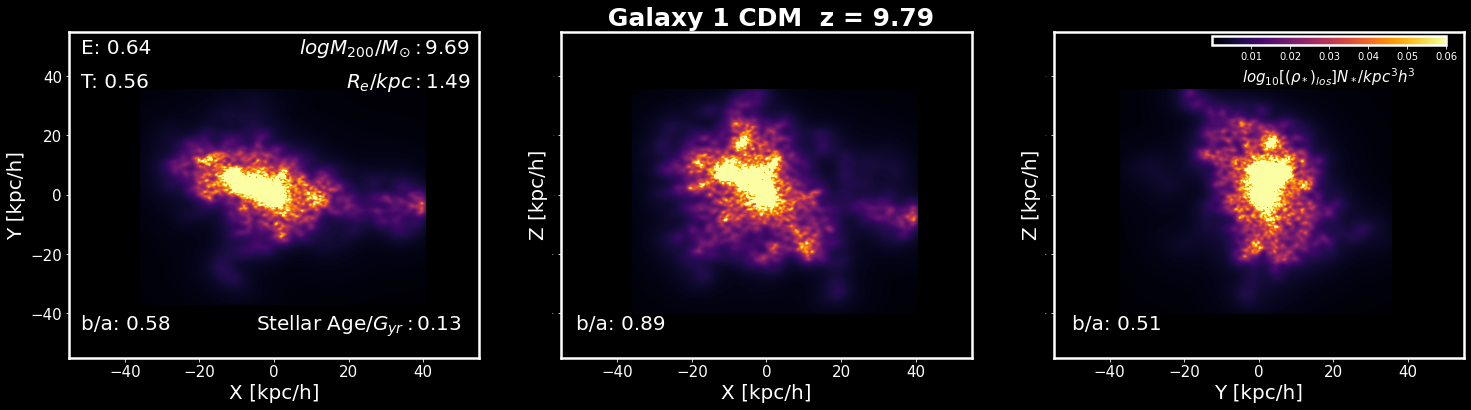
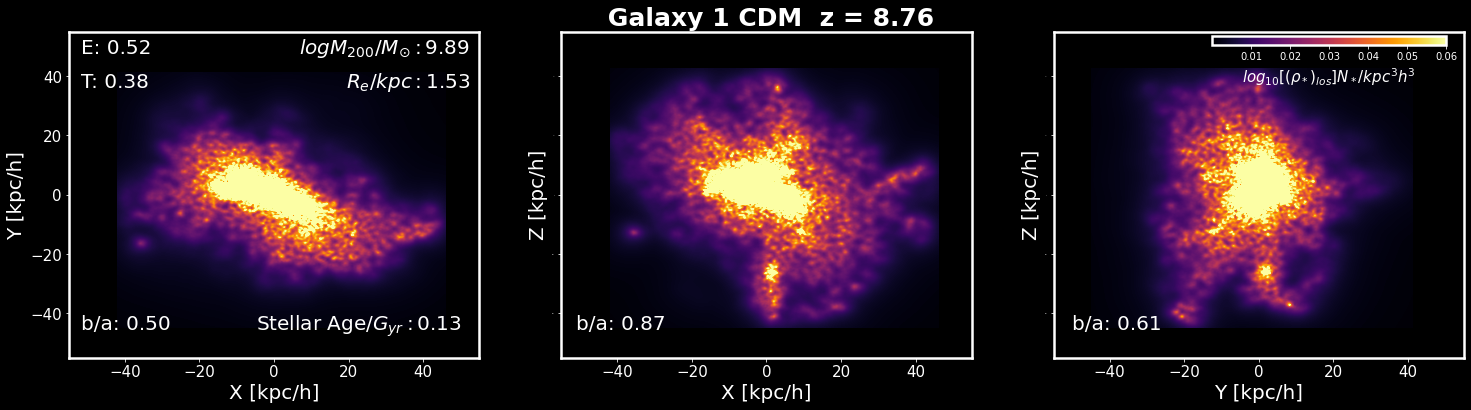
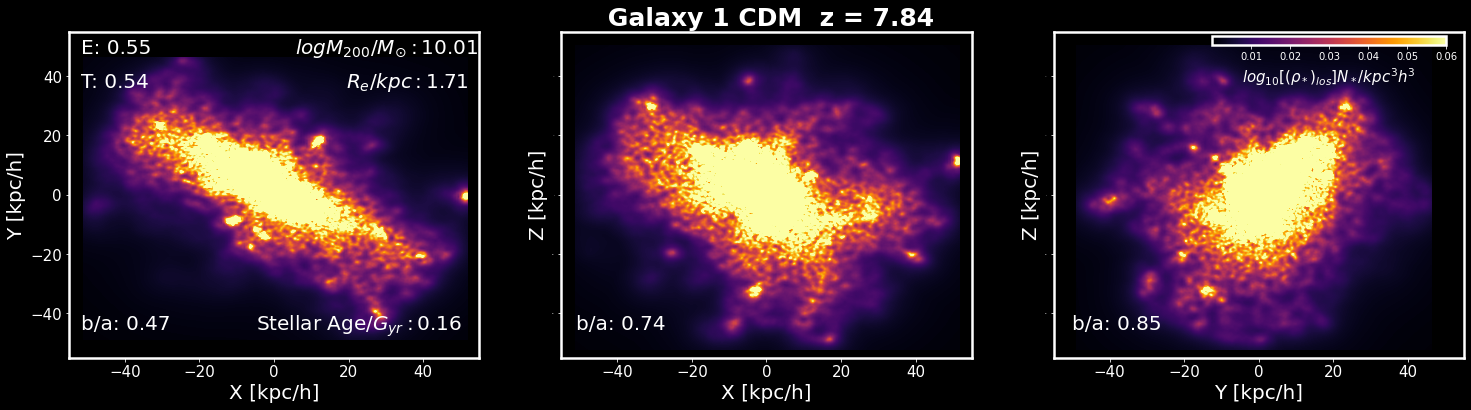
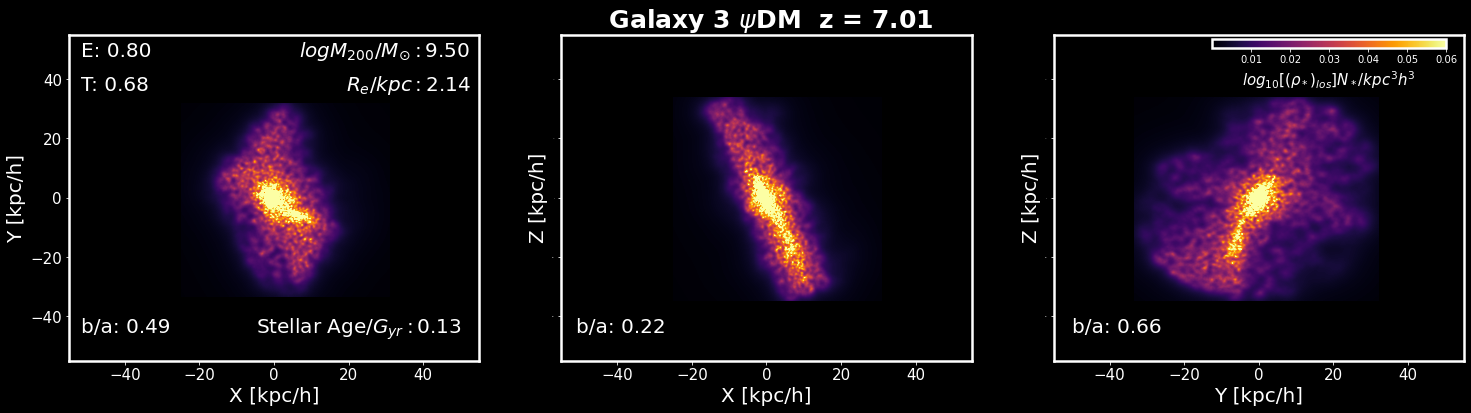
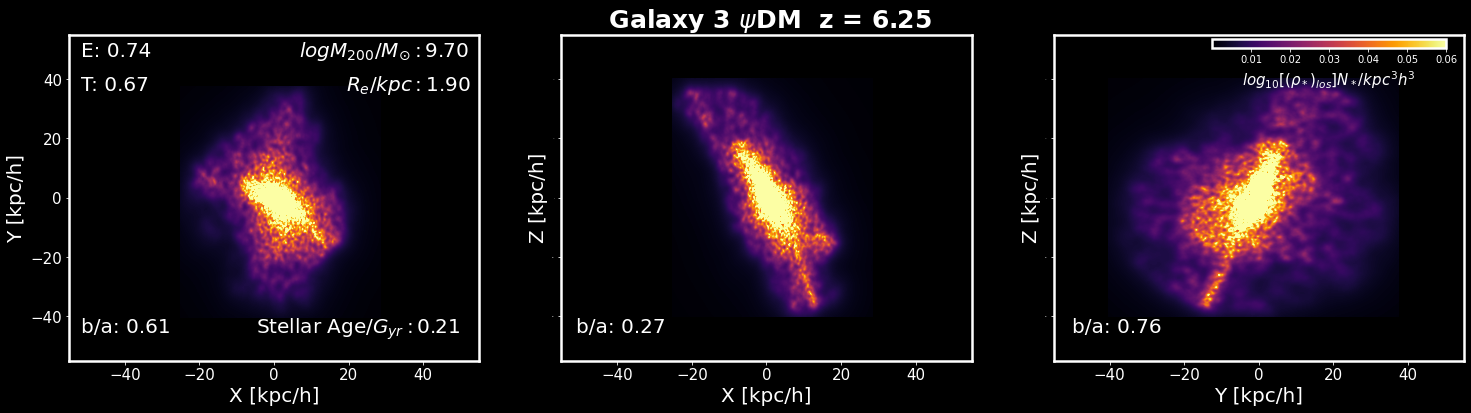
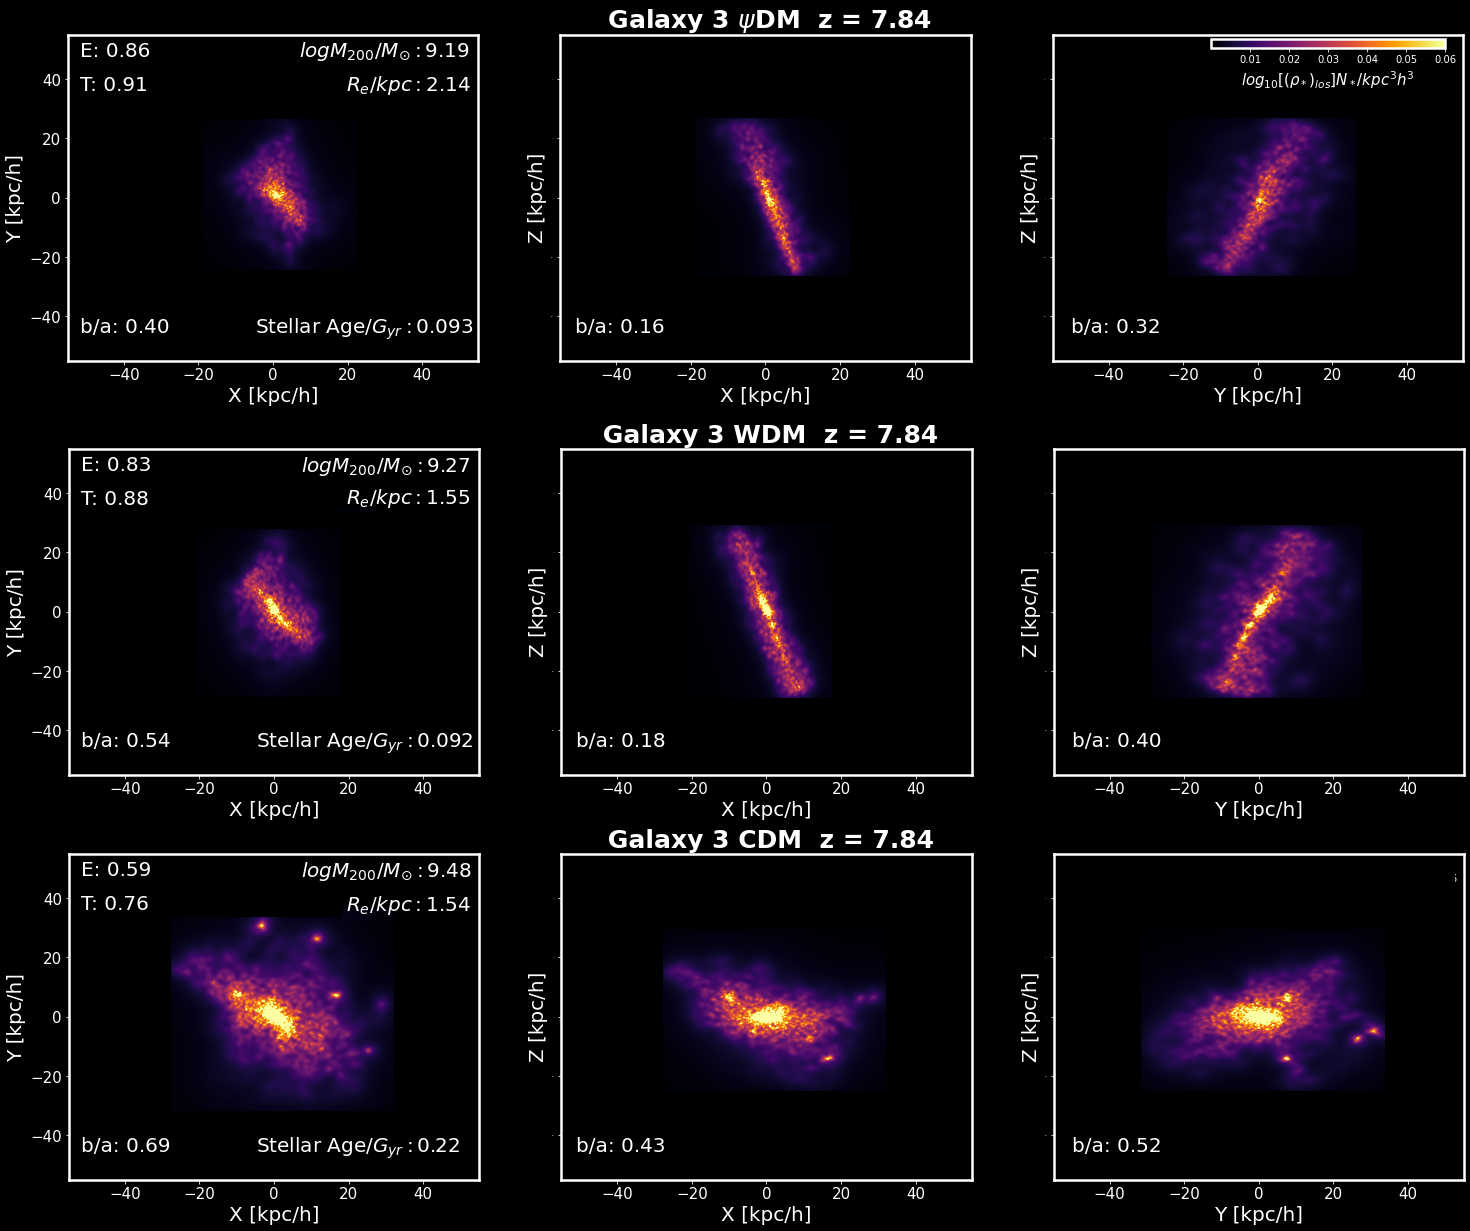
We also present the three projections of a representative simulated galaxy in Figure 4 to illustrate how the 3D appearance readily differentiates between the prolate shape of galaxies formed in DM & WDM from the more spheroidal 3D stellar morphology predicted for the“same” galaxy with CDM (the one identified at the same location in the three DM models simulations). It is also clear that for CDM there are several prominent sub-halos visible in the stellar distribution in this relatively young galaxy. This is a common feature of all the young galaxies Gyr in age seen in the CDM simulation and is an important distinction as these subhalos are not present for WDM & DM because of the suppression of low mass halos in the power spectrum for both these classes of DM. This behaviour may be seen for the full simulations published in Mocz et al. (2017) and 3D videos showing the evolution of the three comparison DM model simulations can be obtained by request.
2.1 Stellar offset asymmetry
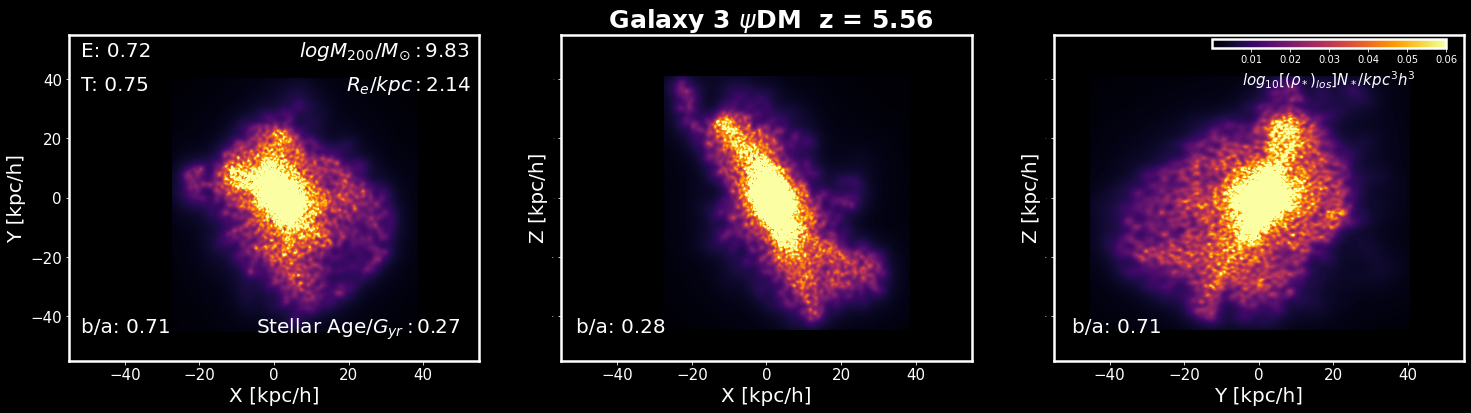
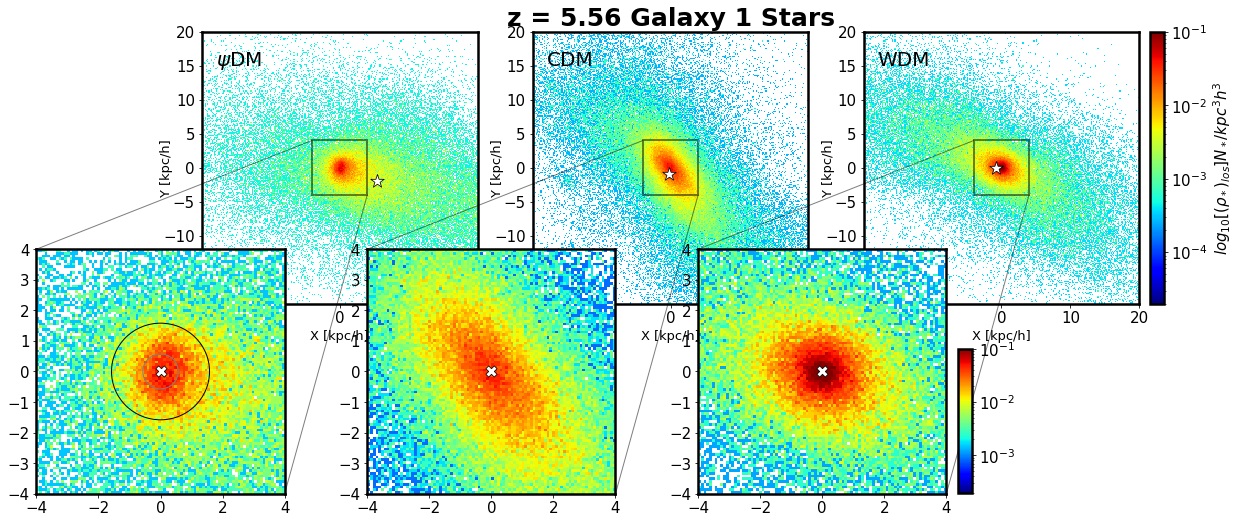
Here we illustrate the differences between the three DM classes in terms of stellar core as this may have the potential to discriminate between DM and WDM observationally, unlike the overall stellar morphology examined above. In Figure 5 we show our earliest forming galaxy where an obvious solitonic core of DM visible in the central stellar distribution becomes increasingly clear over time as the core stellar density increases, allowing better identification, as shown in the last time frame of our DM simulation (corresponding to z=5.56, shown in Figure 5). A discernible difference in the location of the stellar core is visible between the stellar distributions in WDM and DM where a clear offset of the stellar core is present for DM but much smaller for WDM and CDM, evident from the white star marking the centroid of the full 2D light distribution in the top row of Figure 5. Additionally, it is seen that the visible size of the soliton radius of DM apparent from the concentration of stars seen in our simulation is smaller than the core of WDM with a correspondingly smaller proportion of stars in the DM core. A relatively more extended stellar profile around the soliton follows from this and is consistent with recent discoveries of diffuse halos around some well=studied local dwarfs (Chiti et al., 2021; Collins et al., 2021).
The sub-panels in Figure 5 are shown to highlight a related morphological prediction of “cometary” asymmetry that can distinguish DM from both WDM and CDM, evident in our simulations. This arises from the inherent, “constrained random walk” of the soliton caused by locally perturbing waves on the de Broglie scale recognised by Schive et al. (2020). The associated timescale is yrs for a dSph galaxy with 0.3 kpc and 10 km/s, as predicted (Li et al., 2021; Chiang et al., 2021) and visible in our DM simulations (Pozo et al., 2024). Importantly, this timescale is equivalent to the stellar crossing time of the soliton, and hence the stars are able to respond to the movement of the soliton. This motion is evident in an offset and asymmetry seen here in Figure 5 in the distribution of stars, and contrasts with the high degree of symmetry predicted for CDM & WDM. The dynamical relation of the perturbed soliton and the associated tracer stars is explored more fully in Pozo et al. (2023), showing how DM exhibits a more asymmetric structure compared to the much more symmetric shape seen in WDM, and CDM ( see Figure 5), aligning well with theoretical predictions (Gao & Theuns, 2007; Schive et al., 2020).
3 Discussion and Conclusions
We have made a straightforward comparison of the stellar morphology predicted for representative galaxies formed in our high precision hydrodynamical simulations of three contending DM models, DM, CDM & WDM. A clear conclusion is that both DM and WDM are similar in terms of the predicted tendency towards prolate morphology at high redshift during the first Gyrs, whereas for CDM the stellar morphology is expected to be spheroidal or oblate. Hence we conclude that the observed predominance of prolate shaped galaxies recently claimed on the basis of JWST images, for by Pandya et al. (2024) supports equally DM and WDM and is in tension with CDM where the stellar morphology we predict is modestly triaxial, appearing oblate or spheroidal in terms of the stars. The prolate shapes predicted by WDM and DM are the consequence of galaxy formation from long, smooth filaments inherent to both these classes of DM that, unlike CDM, lack small scale and hence there is an absence of substructure along the filaments that are seen to form first in our simulations, ahead of galaxy formation for both DM and WDM. Furthermore, we see that the prolate triaxiality of the stars is correlated with the clear prolate triaxiality of the DM halos for both WDM and DM, as shown in Figure 2, indicating that the elongation of the stellar distribution reflects equilibrium within these early galaxies as DM, gas and stars are co-accreted to form these galaxies. This early period is not interrupted by merging, as for CDM, due to the lack of small scale power for both WDM and DM, and thus we see the early accretion phase and associated prolate morphology is not modified until later, typically when the first galaxy mergers become common, as emphasised by Schive et al. (2016). This difference also shows up in terms of the presence of several stellar subhalos visible orbiting within young galaxies for CDM, as merging proceeds within the first Gyr, and that is not the case for WDM & DM, and may be further examined with a focused JWST comparison and potentially resolvable with new laser based instruments (Windhorst et al., 2021). Note all of these conclusions are based on simulations that preceded the advent of JWST by Mocz et al. (2017) and are thus unconditioned by the reported conclusions of (Pandya et al., 2024).
Our DM model comparisons here we are limited to z5.5 as this represents the latest time that we have been able to follow the evolution of DM given the computational demands of our grid based hydrodynamical calculations, which are much more costly than the conventional N-body/hydro simulations of CDM and WDM. Clearly for a fuller comparison with the detailed JWST observations there is now a need to expand the volume and time duration explored for DM in terms of hydrodynamical modelling of the DM and gas so a detailed comparison can be made at lower redshift with apparently similar prolate examples identified (e.g., del Valle-Espinosa et al. (2023)) and where the emergence of ordered disks and spheroids may be anticipated in the simulations. This remains a challenge for the future for which a factor of a few enhancements can be anticipated. However, the prospects for expanded hydrodynamical simulations with WDM are much better and of course in terms of the observables of interest here this also represents a good proxy for DM. Hence, we may look forward to over two orders of magnitude improvement in this context and also high resolution complementary simulations of early filamentary regions, which may prove of great interest in observational comparisons with deep JWST spectroscopic surveys in particular.
Given the obvious preference found here for the elongated galaxies predicted by DM or WDM we more firmly motivate testing of the consequent prediction of an early era of thin filaments formed prior to galaxy formation and traced by cooling gas and stars formed from cooled gas, for both DM and WDM, as first recognised using these simulations by Mocz et al. (2019). Direct detection of such filaments will be challenging as the levels of star formation are small and the redshifts are high, but perhaps some hints can be seen for example in the recently observed pair of elongated, very young galaxies of approximately 10 Myrs at z8.3, in Fig. 2 of Ma et al. (2024), each elongated by 3.4 kpc and 2.4 kpc respectively along a common axis separating them, suggesting filament formation and validates the filament origin proposal of Pandya et al. (2019) made prior to JWST. Another elongated object of around 20 kpc has also been recently detected in deep JWST/NIRSpec observations at z6.2, illuminated centrally by a young quasar (Loiacono et al., 2024) and motivating more definitive general spectroscopic searches for the presence of faint filaments via emission line spectroscopy with JWST. This prediction was made by Mocz et al. (2019) on the basis of these simulations where star formation was first predicted along filaments for WDM and DM.
We emphasise that the measurement of filament length may also constrain the particle mass, as a key test of the DM class. For the particle masses in the simulation here of eV and 1.4keV for DM and WDM respectively, we see that the early filaments are typically of comoving length 150 kpc at , or about 0.5 arcminutes in scale, well suited to the field of JWST. Such a measurement in the case of DM can complement the core-halo analysis we have reported in the local group based soliton scale, of about 0.5 kpc (Pozo et al., 2020) and also the recent microlensing claim of a thick 4 kpc band of corrugated critical curves in JWST monitoring of the “Dragon Arc”, consistent with a de Broglie scale of pc for the lensing cluster dark matter (Broadhurst et al., 2024). Both of these independent measurements favour a boson mass of eV after allowance for the differing momentum scales between dwarfs and clusters and which is in fact very close to the boson mass of eV chosen for the simulations used here (Mocz et al., 2017).
Finally, in addition to the observational analysis by Pandya et al. (2024) that has principally motivated our analysis here, there is an independent JWST claim of a surprisingly high proportion of elongated galaxies, initially classed as edge-on disks or “peculiar”, that has caused some “panic” (Ferreira et al., 2022), but may be taken as additional support for an enhanced abundance of prolate galaxies at high-z (see Fig. 5 of Ferreira et al. (2022)). Hence, we conclude that galaxy formation originating from smooth filaments provides a natural explanation for the observed predominance of elongated, galaxies when young, with no need to “go bananas” or “panic” too much, but rather embrace the wider physical possibilities for dark matter now proving testable with JWST.
Acknowledgements
AP, GS and TJB are grateful to the DIPC for generous support. AP thanks the Center for Astrophysics — Harvard & Smithsonian for their warm hospitality. RE acknowledges the support from grant numbers 21-atp21-0077, NSF AST-1816420, and HST-GO-16173.001-A as well as the Institute for Theory and Computation at the Center for Astrophysics. We are grateful to the supercomputer facility at Harvard University where most of the simulation work was done. G.S. is grateful to the IAS at HKUST for their generous support. This work has been supported by the Spanish project PID2020-114035GB-100 (MINECO/AEI/FEDER, UE). H.-N. LUU, G. Smoot and T. Broadhurst are supported by the Collaborative Research Fund under Grant No. C6017-20G which is issued by Research Grants Council of Hong Kong S.A.R.
References
- Aprile et al. (2022) Aprile, E., et al. 2022, Phys. Rev. Lett., 129, doi: https://doi.org/10.1103/PhysRevLett.129.161805
- Broadhurst et al. (2024) Broadhurst, T., Li, S. K., Alfred, A., et al. 2024, arXiv e-prints, arXiv:2405.19422, doi: 10.48550/arXiv.2405.19422
- Chan et al. (2022) Chan, H. Y., Ferreira, E. G. M., May, S., Hayashi, K., & Chiba, M. 2022, Mon. Not. R. Astron. Soc., 511, 943, doi: https://doi.org/10.1093/mnras/stac063
- Chan et al. (2015) Chan, T. K., et al. 2015, Mon. Not. R. Astron. Soc., 454, 2981, doi: https://doi.org/10.1093/mnras/stv2165
- Chiang et al. (2021) Chiang, B., Schive, H.-Y., & Chiueh, T. 2021, Phys. Rev. D., 103, doi: https://doi.org/10.1103/PhysRevD.103.103019
- Chiti et al. (2021) Chiti, A., et al. 2021, Nat. Astro., 5, doi: https://doi.org/10.1038/s41550-020-01285-w
- Collins et al. (2021) Collins, M. L., et al. 2021, Mon. Not. R. Astron. Soc., 505, 5686, doi: https://doi.org/10.1093/mnras/stab1624
- Cowie et al. (1995) Cowie, L., Hu, E. M., & Songaila, A. 1995, Astronomical. J., 110, 1576, doi: https://doi.org/10.1086/117631
- del Valle-Espinosa et al. (2023) del Valle-Espinosa, M. G., Sánchez-Janssen, R., Amorín, R., et al. 2023, MNRAS, 522, 2089, doi: 10.1093/mnras/stad1087
- Ferreira et al. (2022) Ferreira, L., et al. 2022, Astrophys. J., 938, 9, doi: https://doi.org/10.1088/0004-637X/756/1/74
- Finkelstein et al. (2023) Finkelstein, S. L., Bagley, M. B., Ferguson, H. C., et al. 2023, ApJ, 946, L13, doi: 10.3847/2041-8213/acade4
- Gao & Theuns (2007) Gao, L., & Theuns, T. 2007, Science, 317, 1527, doi: https://doi.org/10.1126/science.1146676
- Hui (2021) Hui, L. 2021, ARA&A, 59, 247, doi: 10.1146/annurev-astro-120920-010024
- Law et al. (2012) Law, D. R., Steidel, C. C., Shapley, A. E., et al. 2012, ApJ, 745, 85, doi: 10.1088/0004-637X/745/1/85
- Li et al. (2021) Li, X., Hui, L., & Yavetz, T. D. 2021, Phys. Rev. D., 103, doi: https://doi.org/10.1103/PhysRevD.103.023508
- Loiacono et al. (2024) Loiacono, F., et al. 2024, Astron. Astrophys., 685, 13, doi: https://doi.org/10.1051/0004-6361/202348535
- Ma et al. (2024) Ma, Z., Sun, B., Cheng, C., et al. 2024, arXiv e-prints, arXiv:2406.04617, doi: 10.48550/arXiv.2406.04617
- Mocz et al. (2017) Mocz, P., et al. 2017, Mon. Not. R. Astron. Soc., 471, 4559, doi: https://doi.org/10.1093/mnras/stx1887
- Mocz et al. (2019) —. 2019, Phys. Rev. Lett., 123, doi: https://doi.org/10.1103/PhysRevLett.123.141301
- Mocz et al. (2020) —. 2020, Mon. Not. R. Astron. Soc., 494, 2027, doi: https://doi.org/10.1093/mnras/staa738
- Odewahn et al. (1997) Odewahn, S. C., Burstein, D., & Windhorst, R. A. 1997, AJ, 114, 2219, doi: 10.1086/118642
- Pandya et al. (2019) Pandya, V., Primack, J., Behroozi, P., et al. 2019, MNRAS, 488, 5580, doi: 10.1093/mnras/stz2129
- Pandya et al. (2024) Pandya, V., et al. 2024, Astrophys. J., 963, 34, doi: https://doi.org/10.3847/1538-4357/ad1a13
- Pozo et al. (2024) Pozo, A., Broadhurst, T., Smoot, G. F. and.; Chiueh, T., et al. 2024, Phys. Rev. D., 109, doi: https://doi.org/10.1103/PhysRevD.109.083532
- Pozo et al. (2020) Pozo, A., et al. 2020, Arxiv, doi: https://arxiv.org/pdf/2010.10337.pdf
- Pozo et al. (2023) —. 2023, Arxiv, doi: https://arxiv.org/abs/2310.12217
- Schive et al. (2014) Schive, H.-Y., Chiueh, T., & Broadhurst, T. 2014, Nature Phys, 10, 496, doi: https://doi.org/10.1038/nphys2996
- Schive et al. (2020) —. 2020, Phys. Rev. Lett., 124, doi: https://doi.org/10.1103/PhysRevLett.124.201301
- Schive et al. (2016) Schive, H.-Y., Chiueh, T., Broadhurst, T., & Huang, K.-W. 2016, Astrophys. J., 818, 14, doi: https://doi.org/10.3847/0004-637X/818/1/89
- Straughn et al. (2006) Straughn, A. N., Cohen, S. H., Ryan, R. E., et al. 2006, ApJ, 639, 724, doi: 10.1086/499576
- van der Wel et al. (2014) van der Wel, A., Franx, M., van Dokkum, P. G., et al. 2014, ApJ, 788, 28, doi: 10.1088/0004-637X/788/1/28
- van der Wel et al. (2014) van der Wel, A., et al. 2014, Astrophys. J., 792, doi: https://doi.org/10.1088/2041-8205/792/1/L6
- Veltmaat et al. (2018) Veltmaat, J., Niemeyer, J. C., & Schwabe, B. 2018, Phys. Rev. D., 98, doi: https://doi.org/10.1103/PhysRevD.98.043509
- Veltmaat et al. (2020) Veltmaat, J., Schwabe, B., & Niemeyer, J. C. 2020, Phys. Rev. Lett., 101, doi: https://doi.org/10.1103/PhysRevD.101.083518
- Windhorst et al. (2021) Windhorst, R. A., Carleton, T., Cohen, S. H., et al. 2021, arXiv e-prints, arXiv:2106.02664, doi: 10.48550/arXiv.2106.02664
- Zhang et al. (2019) Zhang, H., Primack, J. R., Faber, S. M., et al. 2019, Mon. Not. R. Astron. Soc., 484, 5170, doi: https://doi.org/10.1093/mnras/stz339
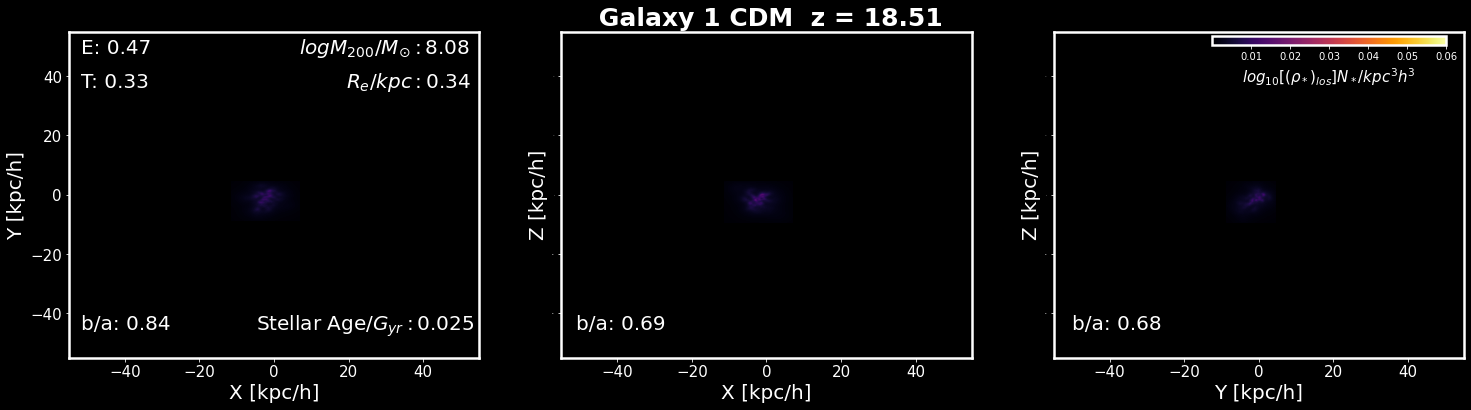
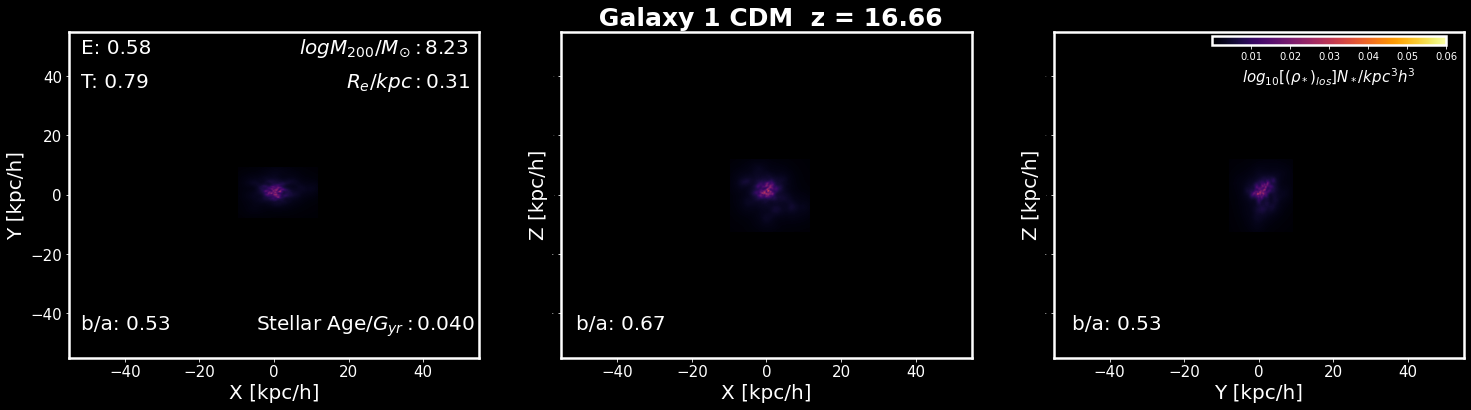
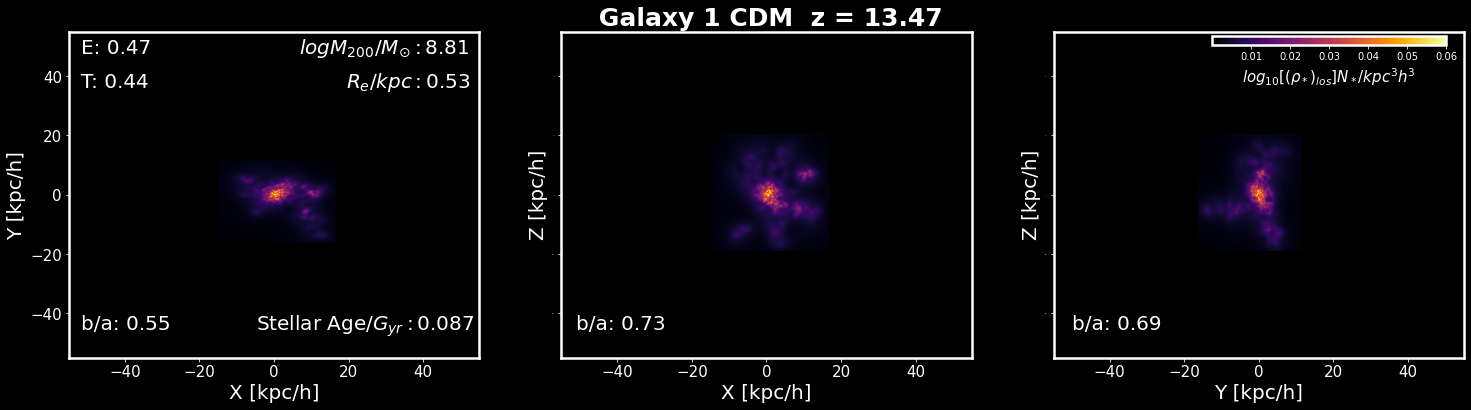
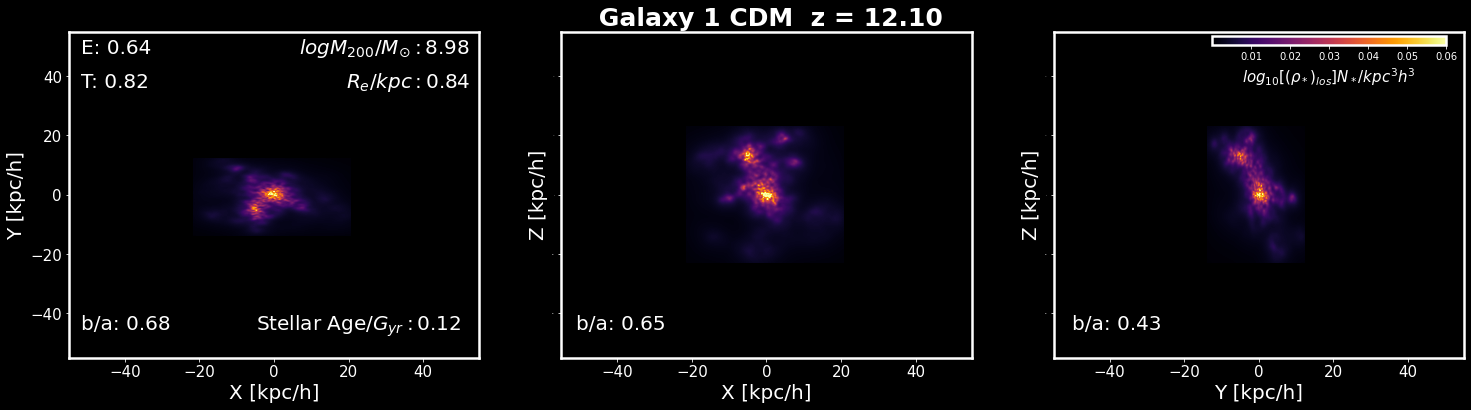
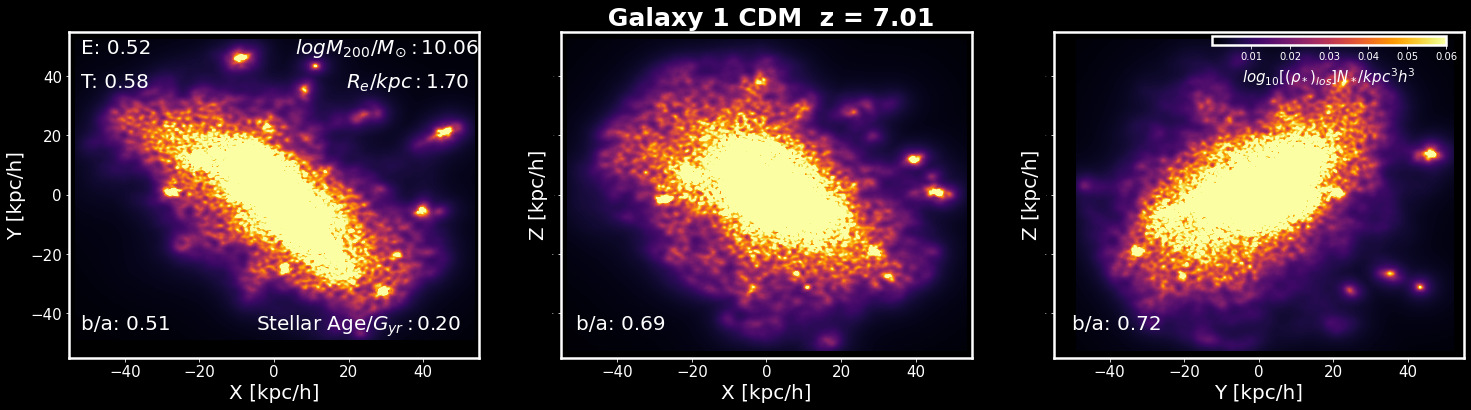
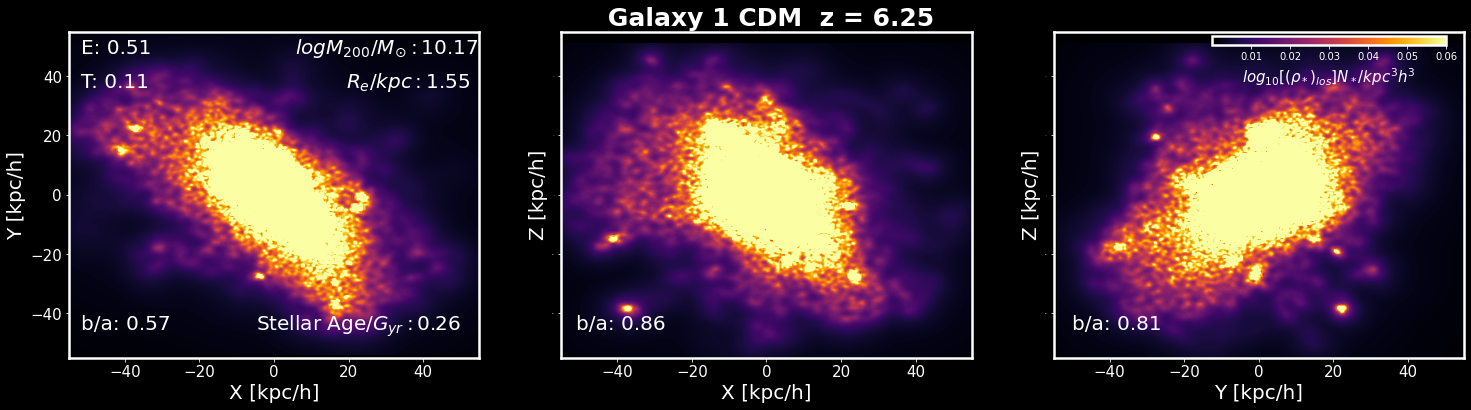
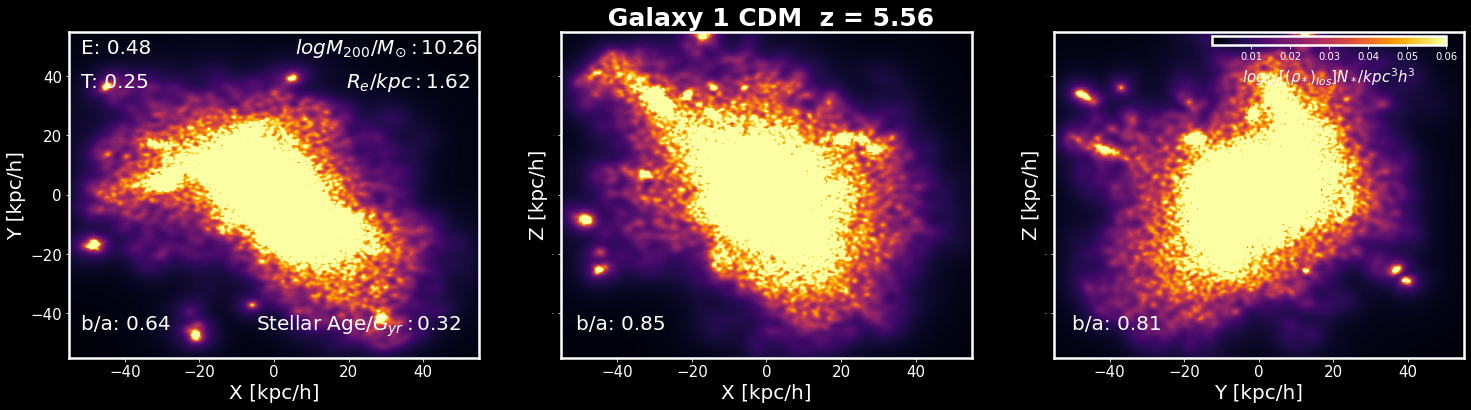
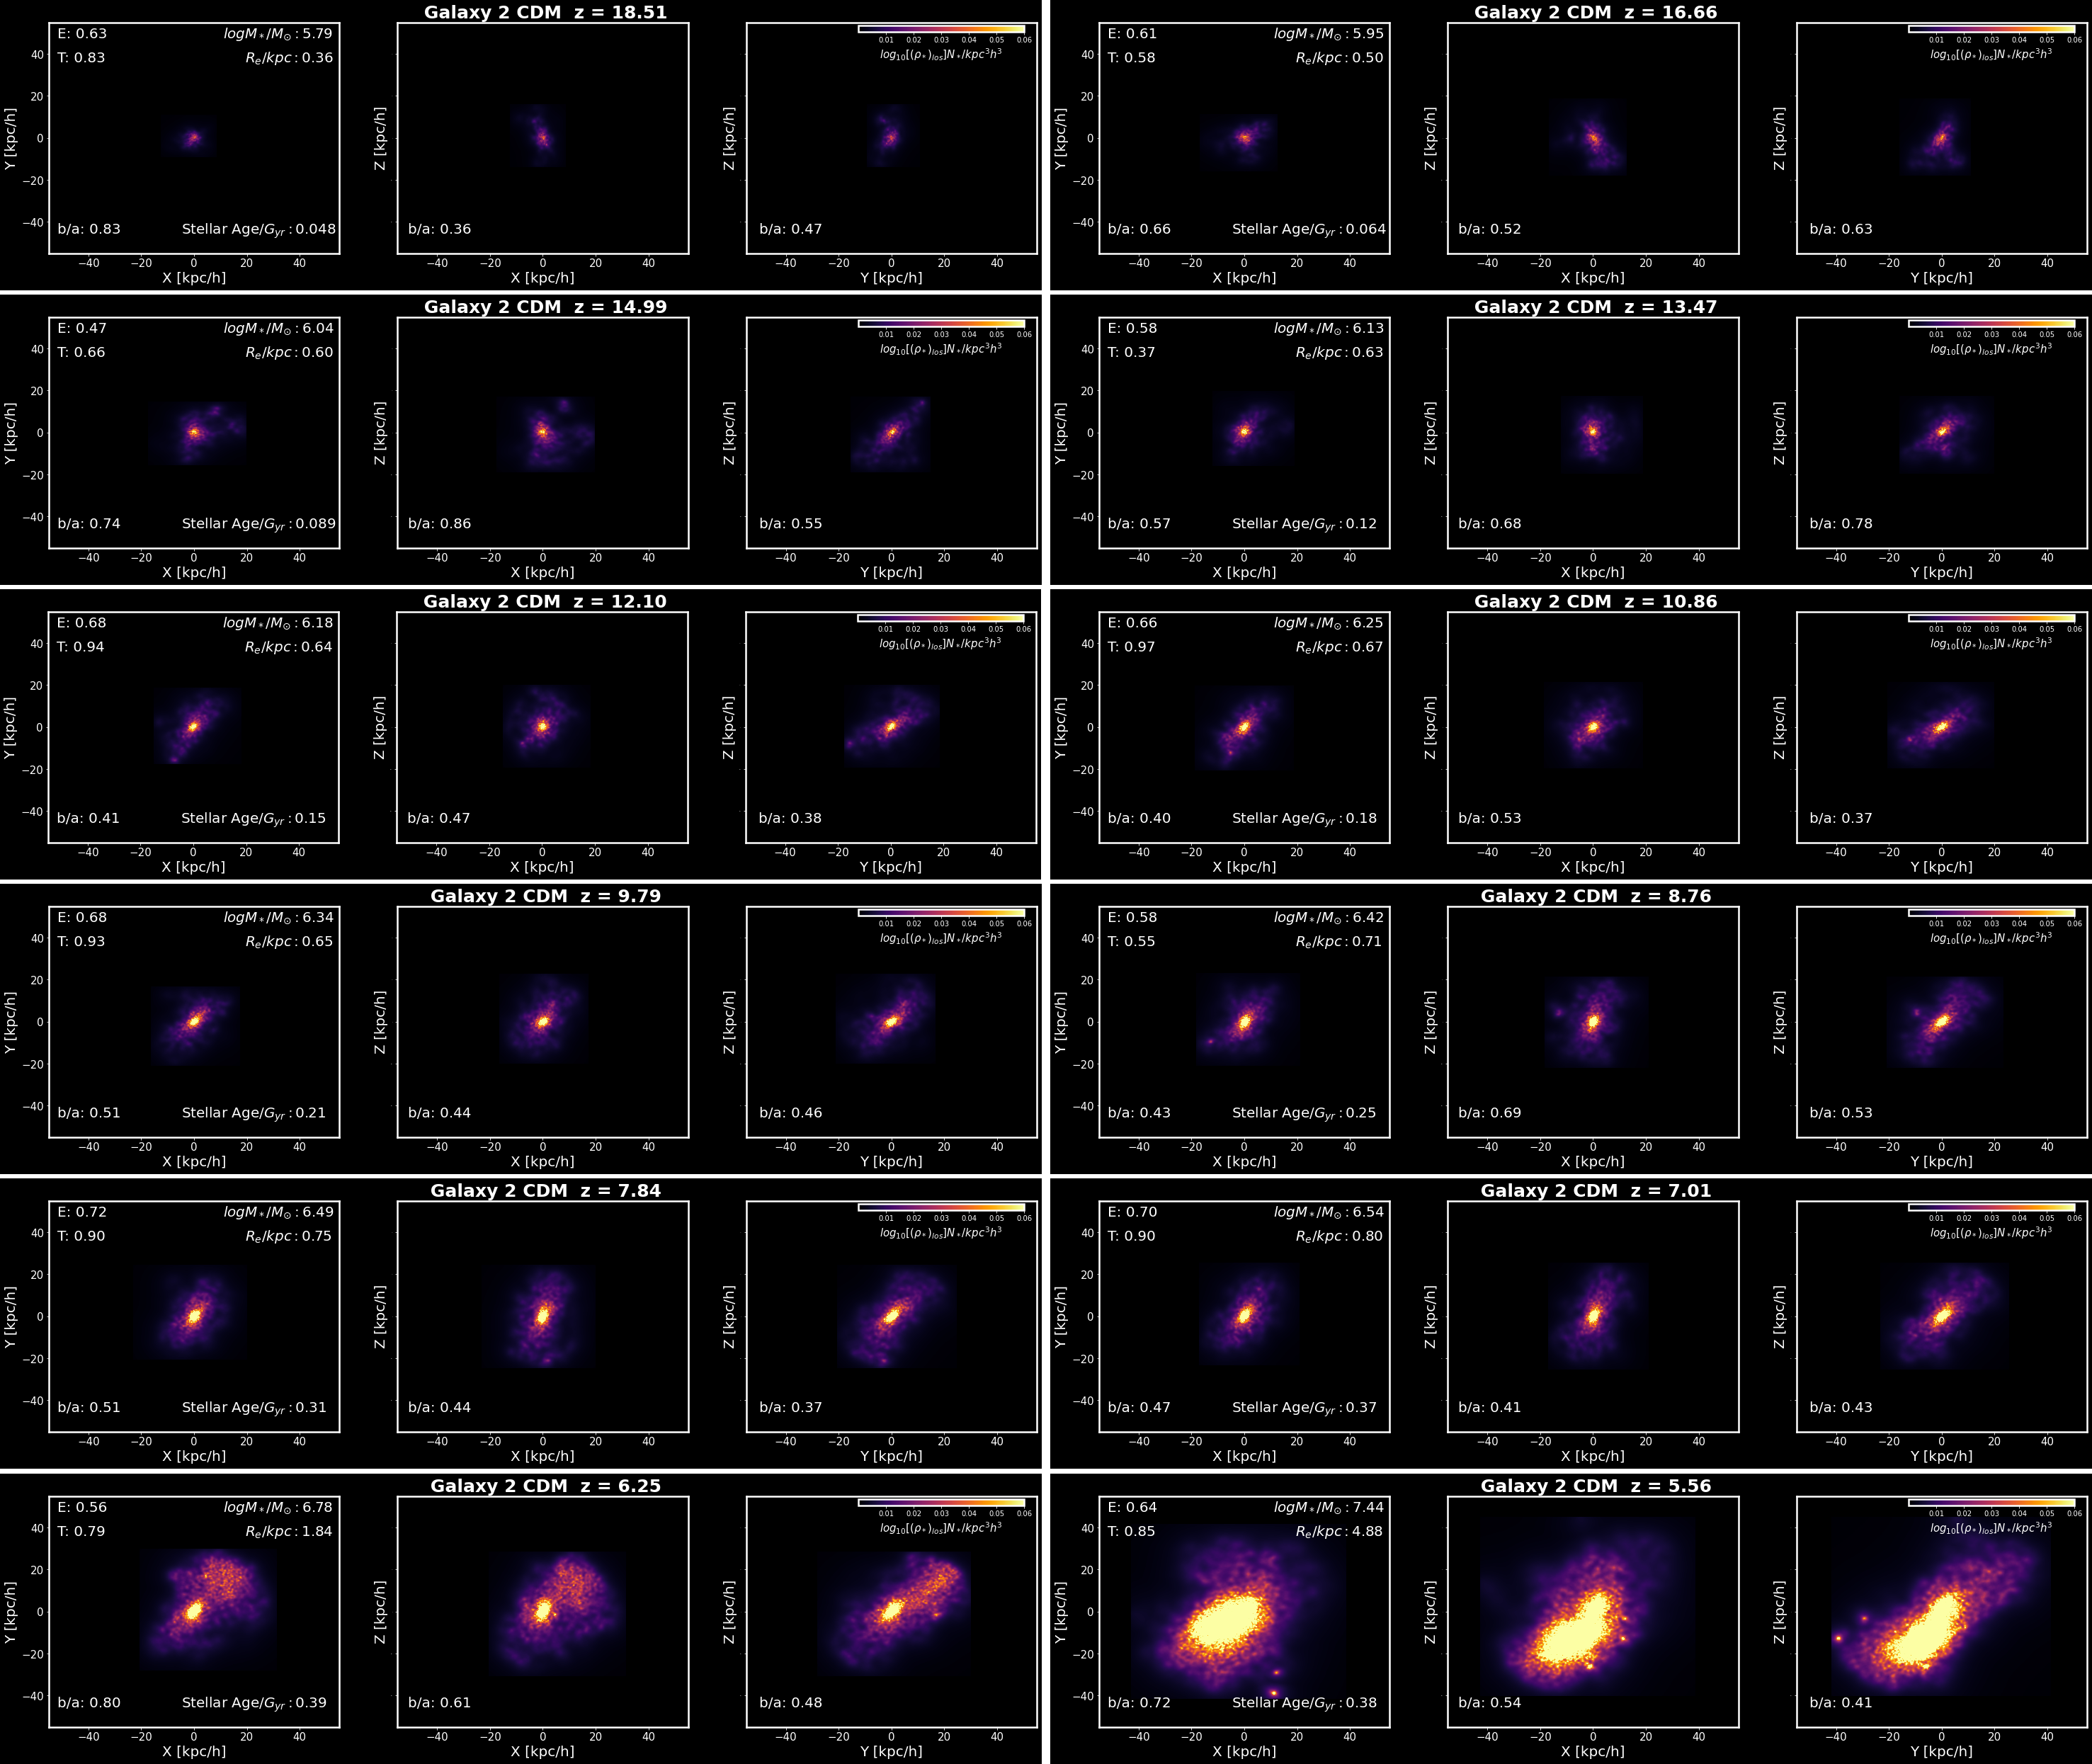
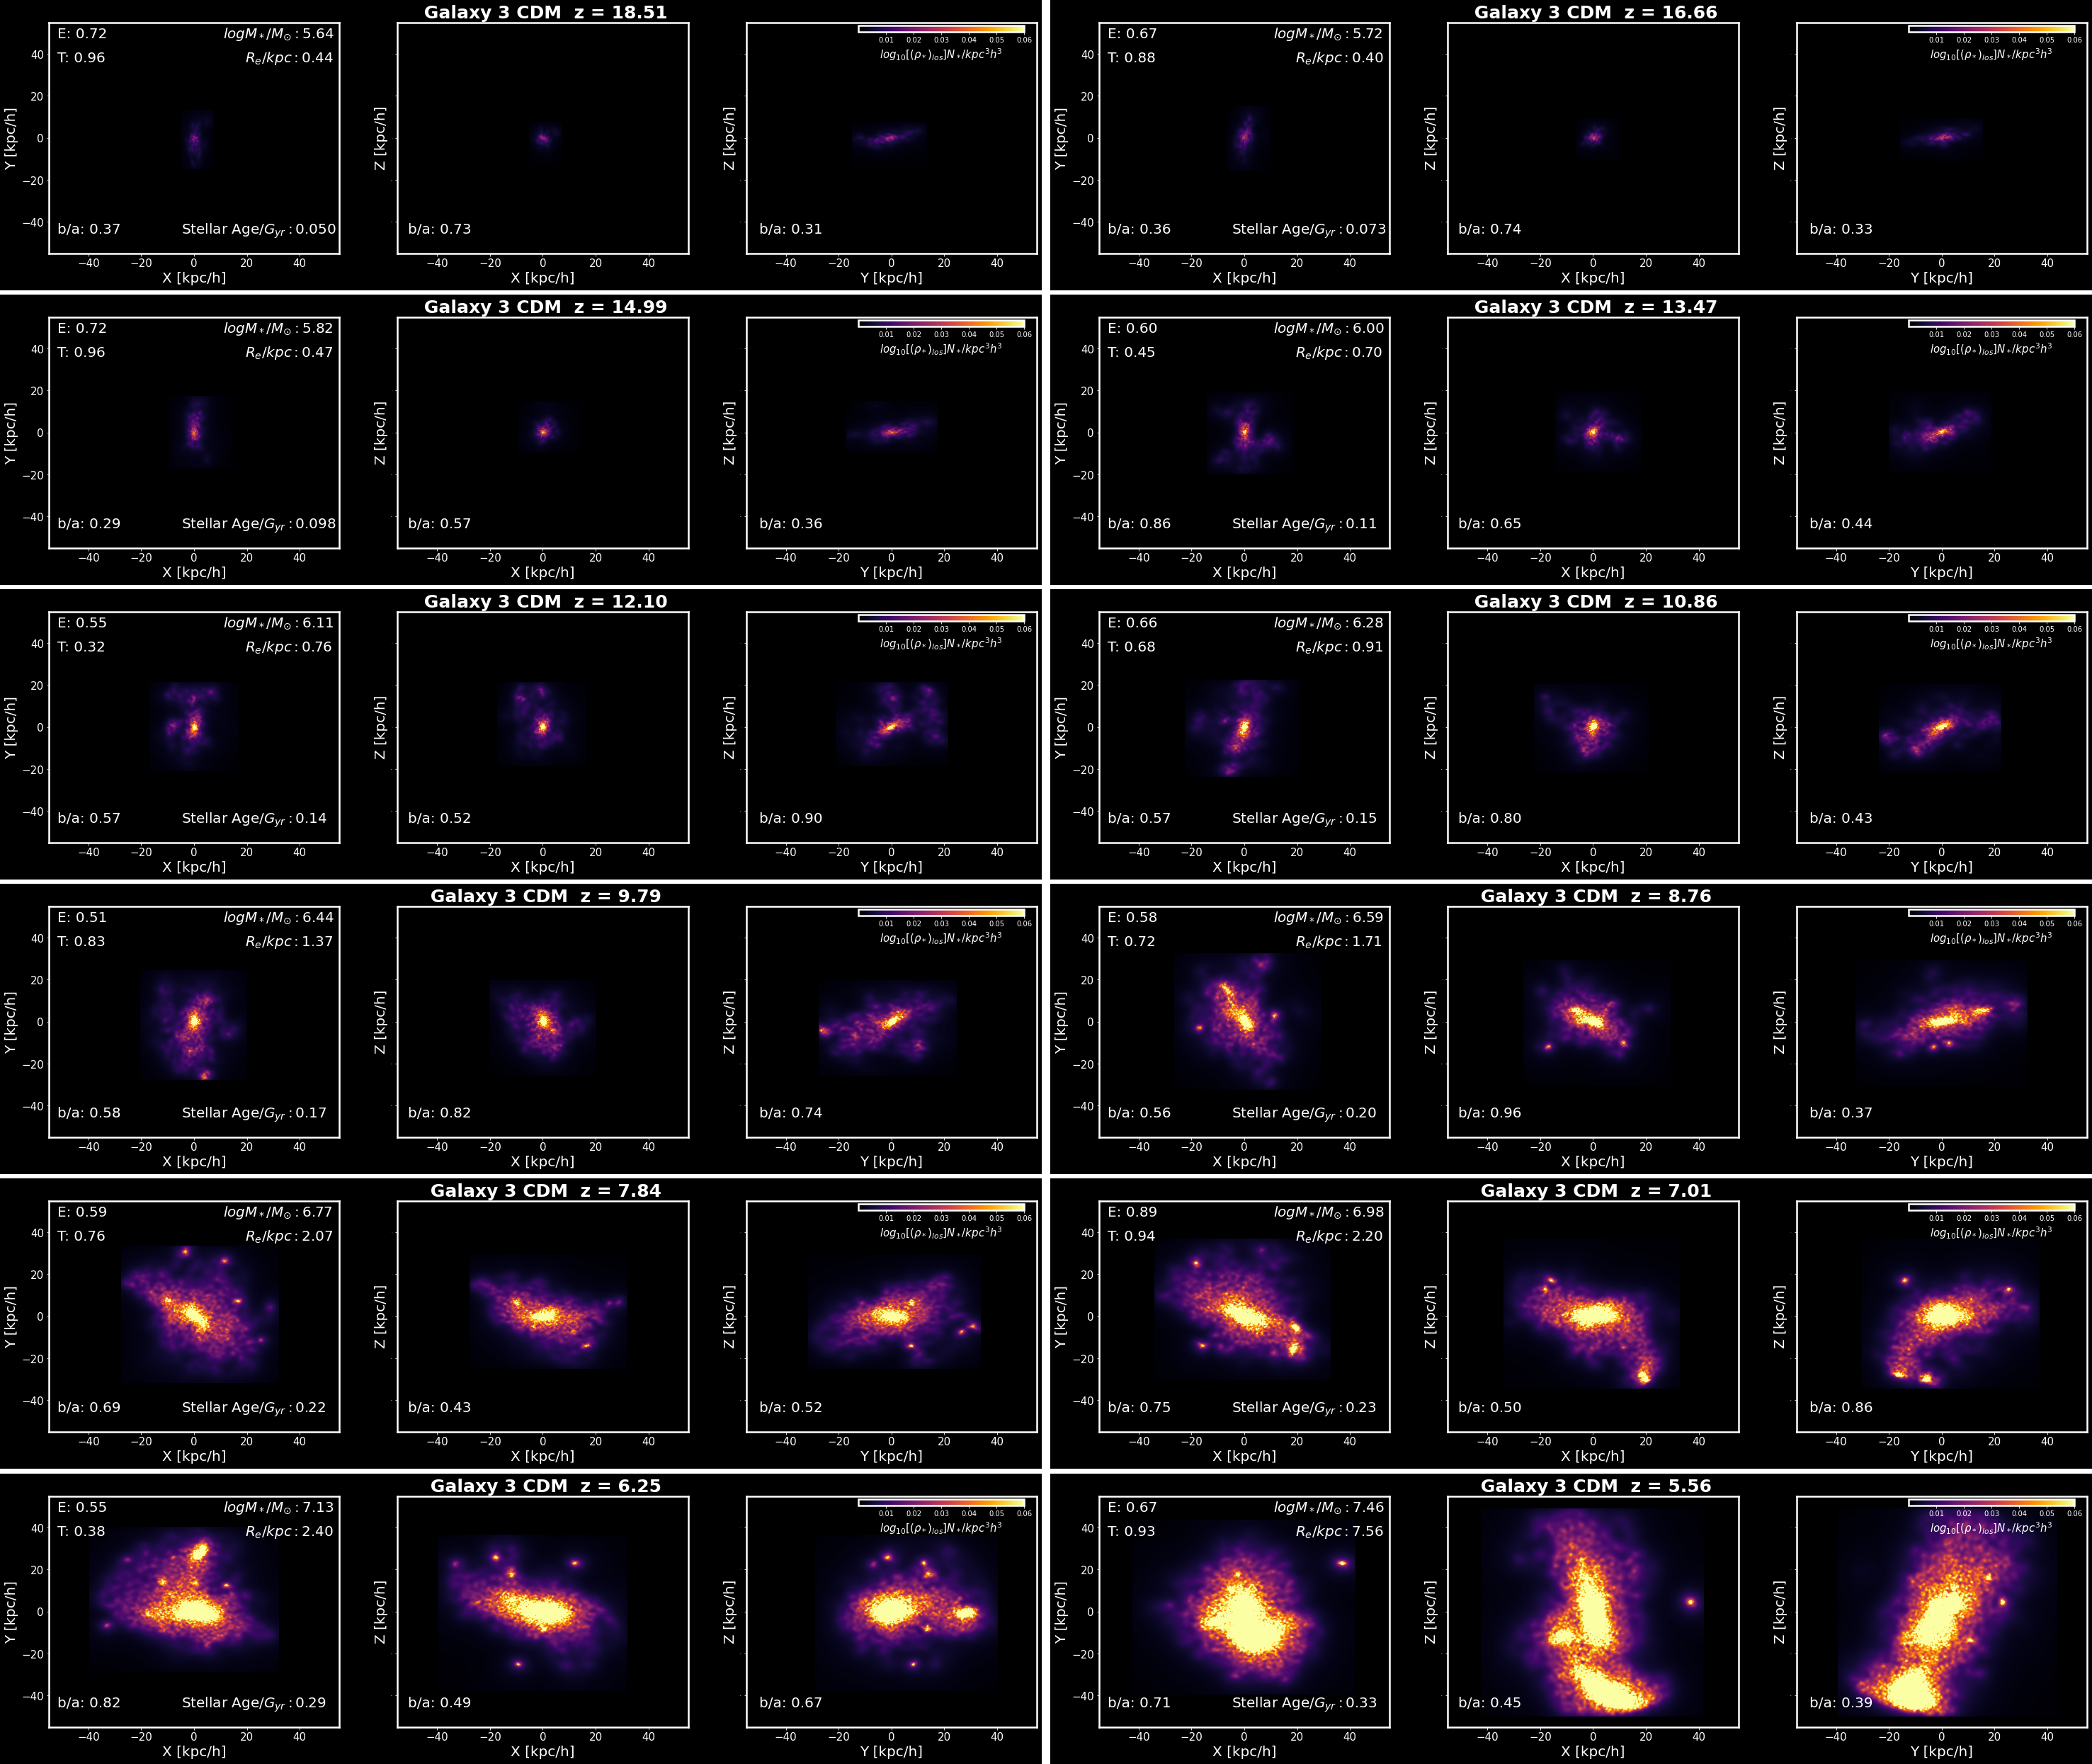
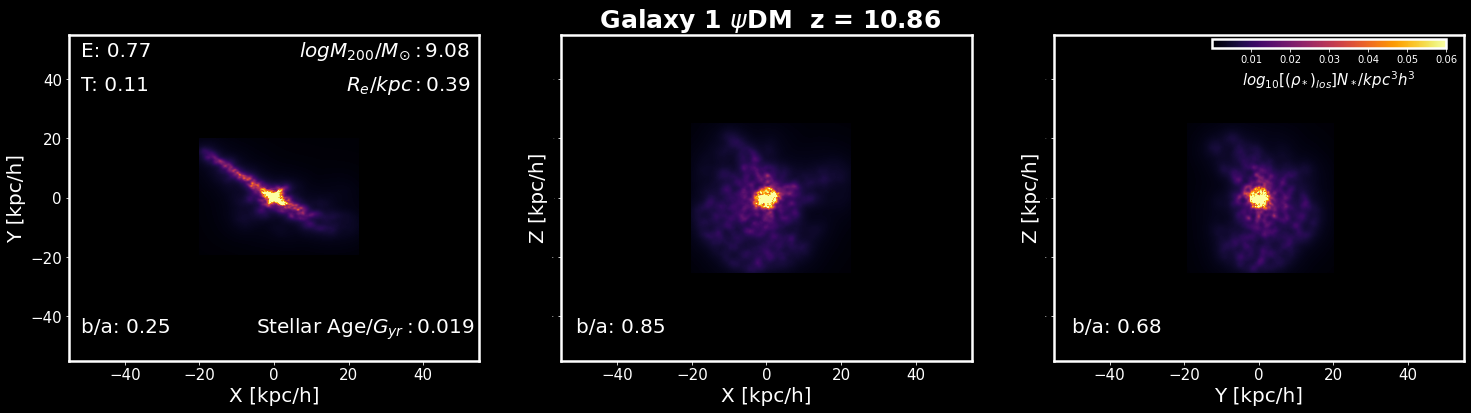
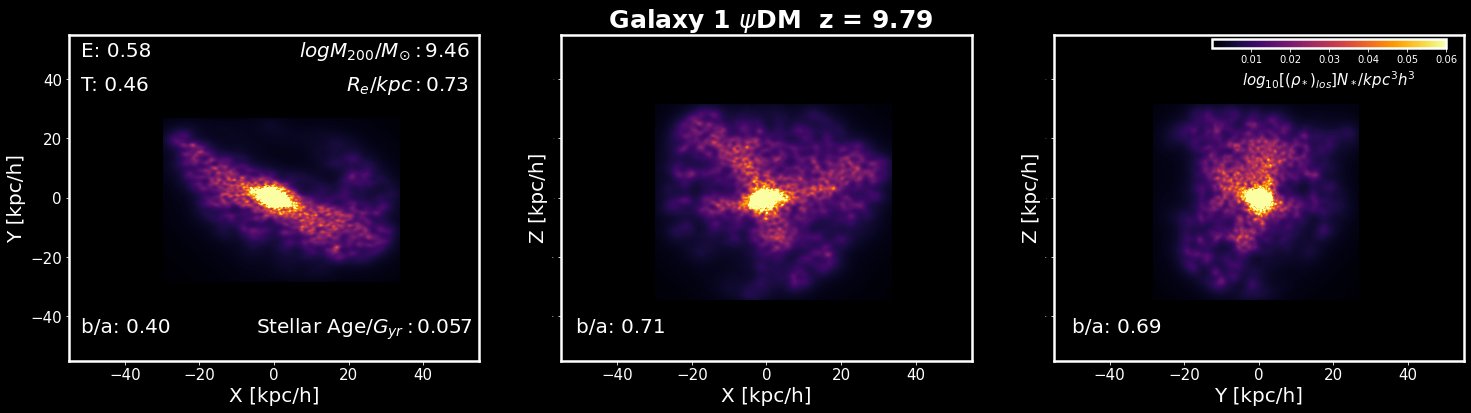
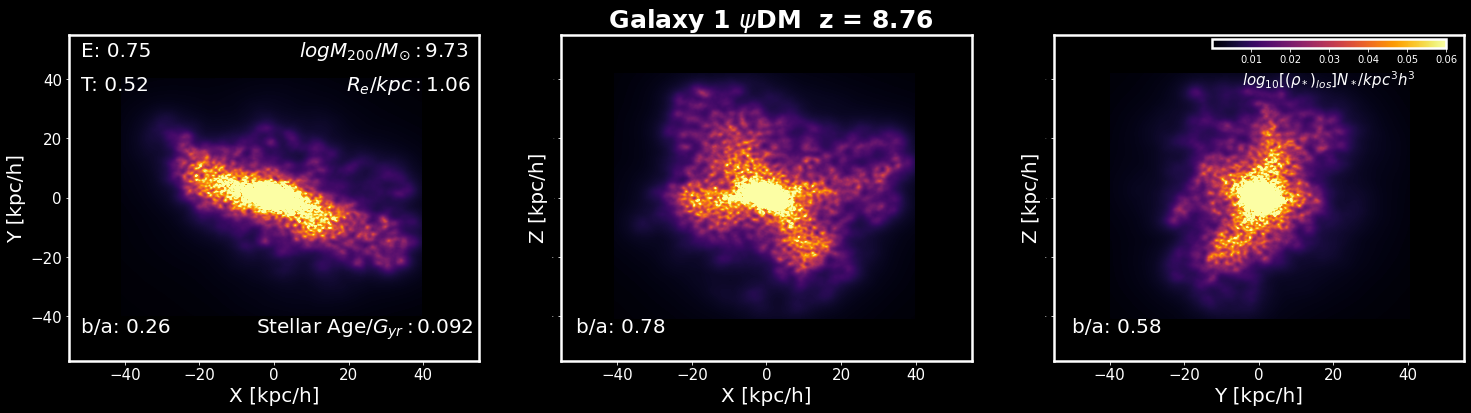
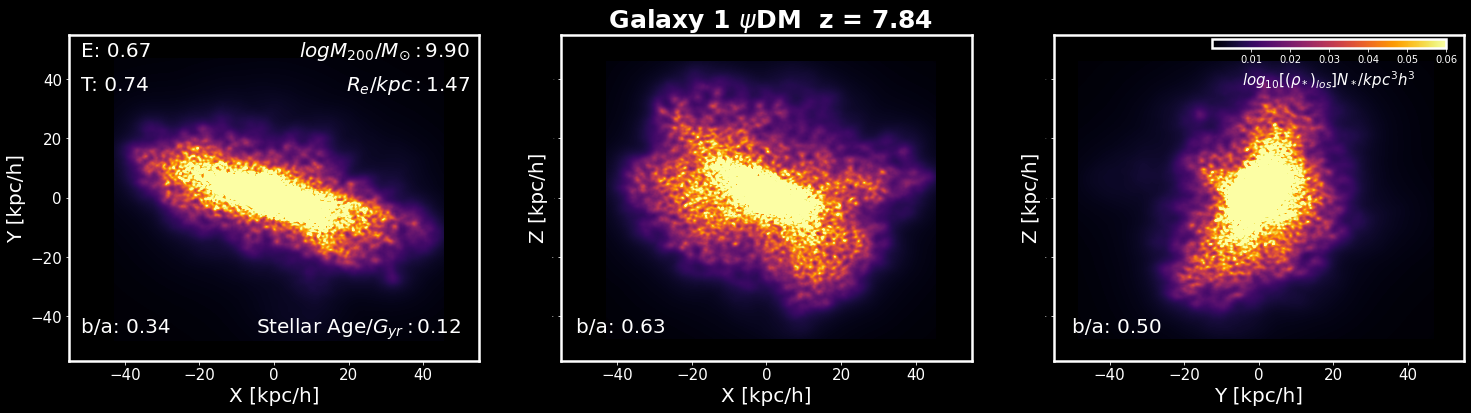
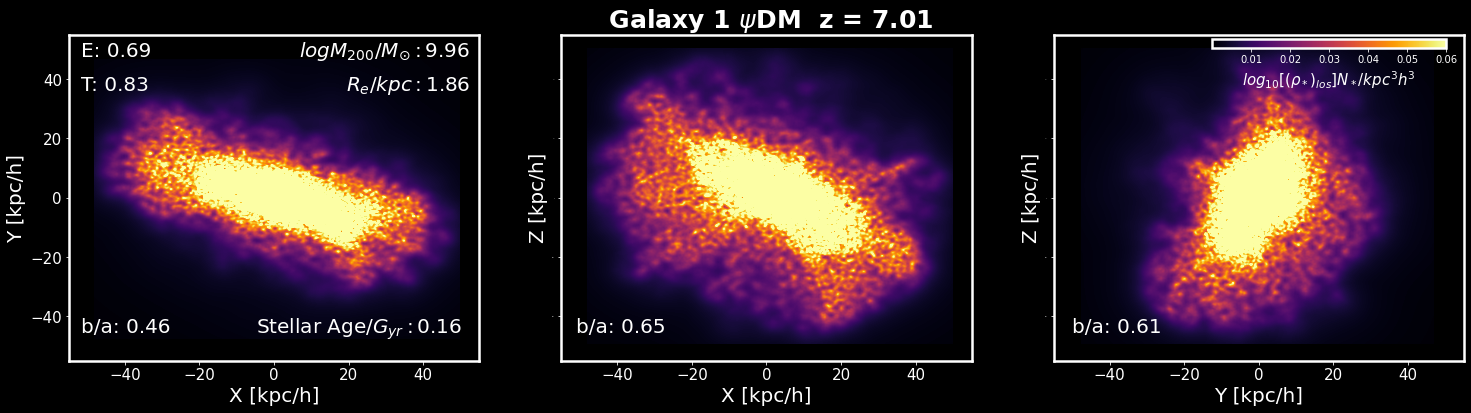
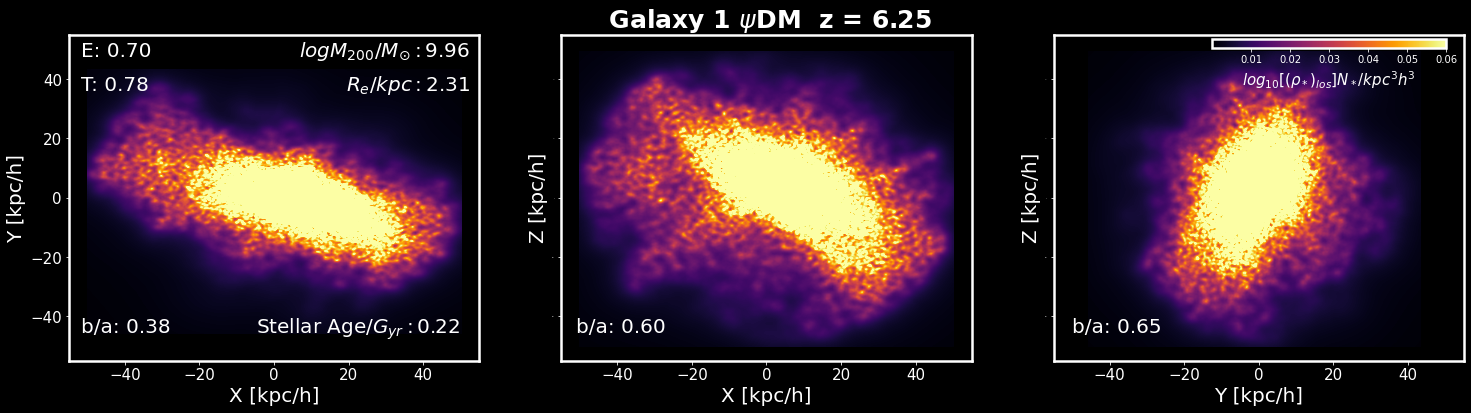
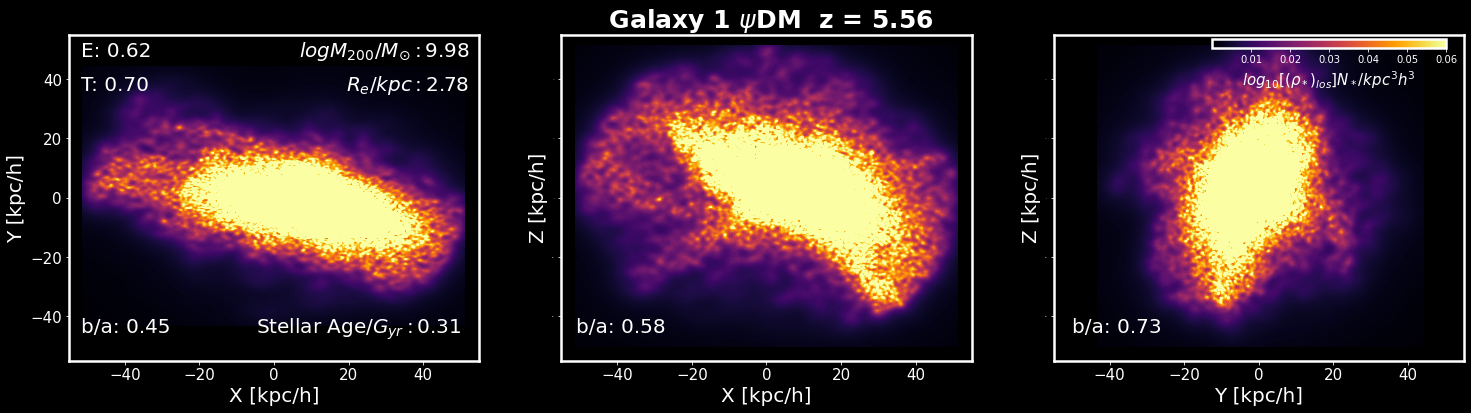
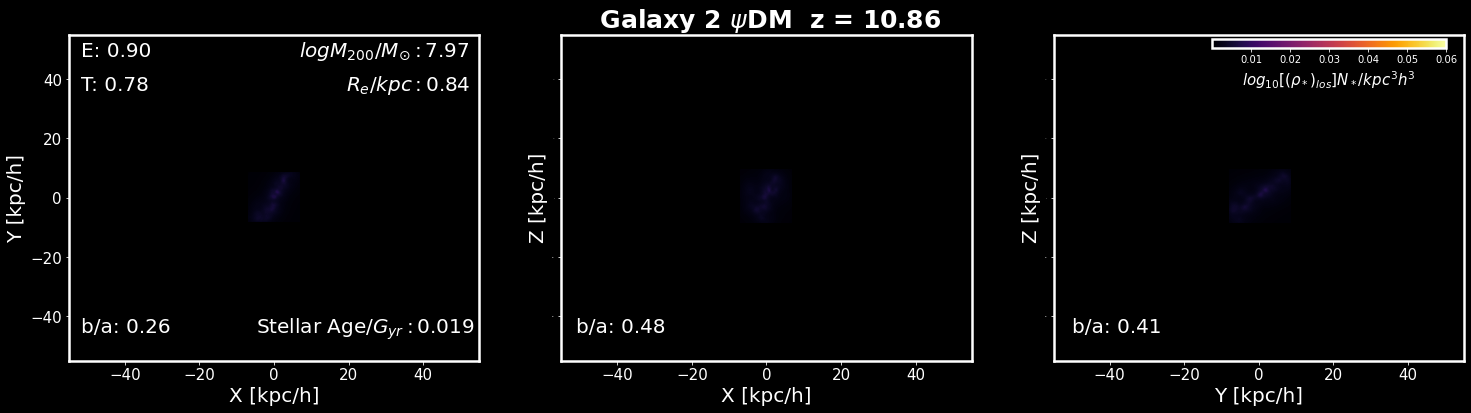
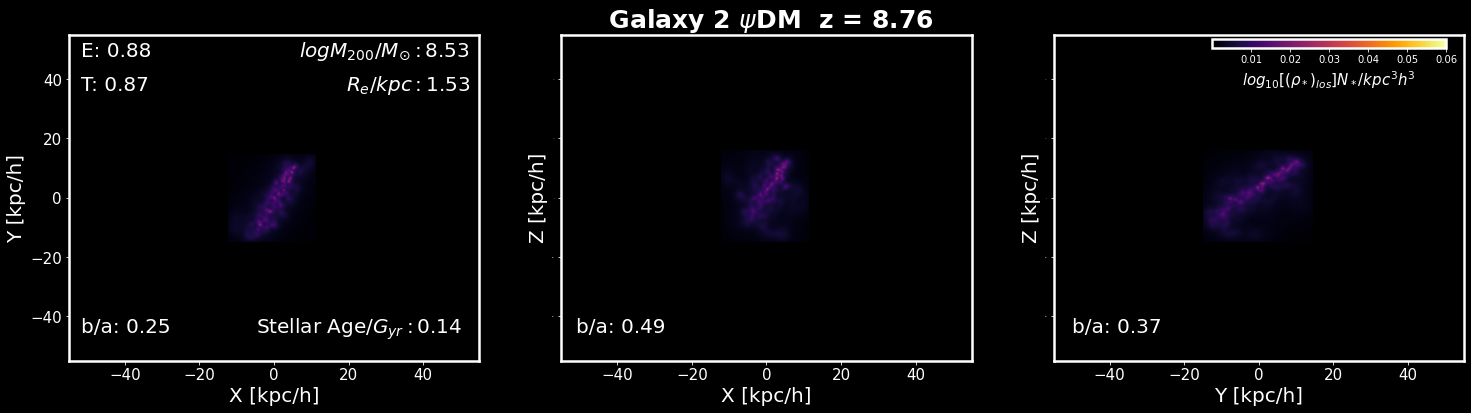
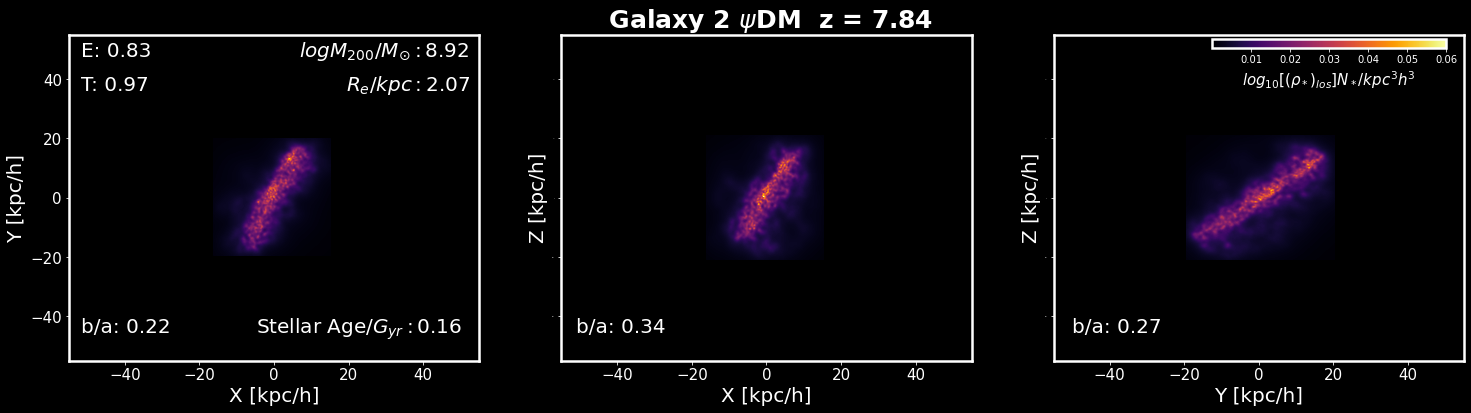
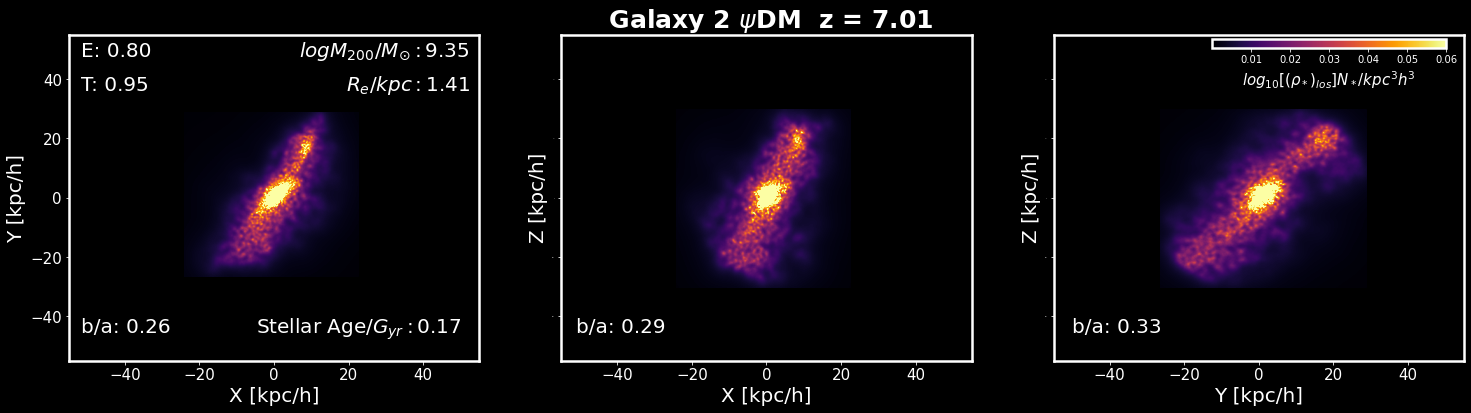
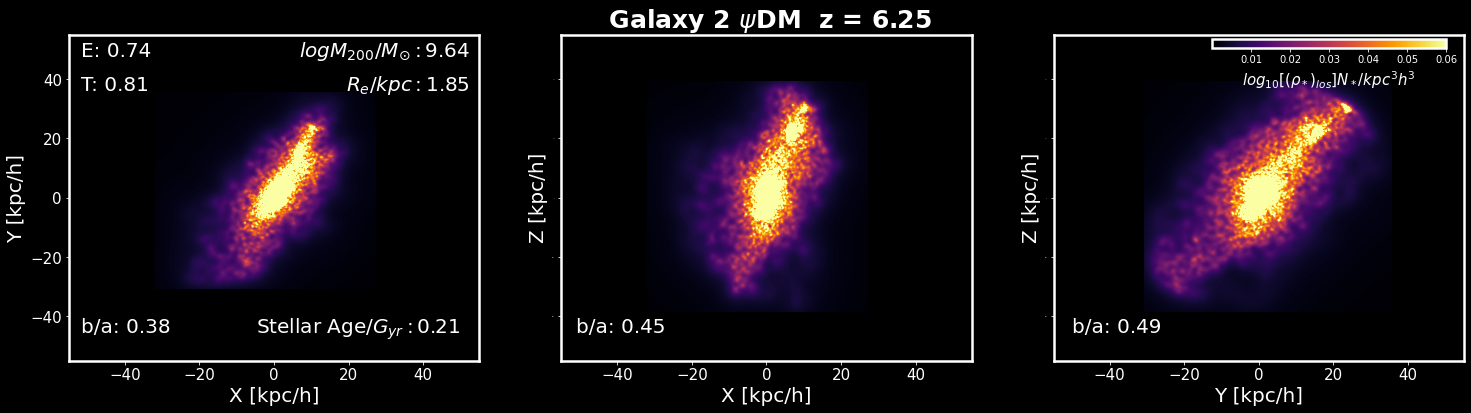
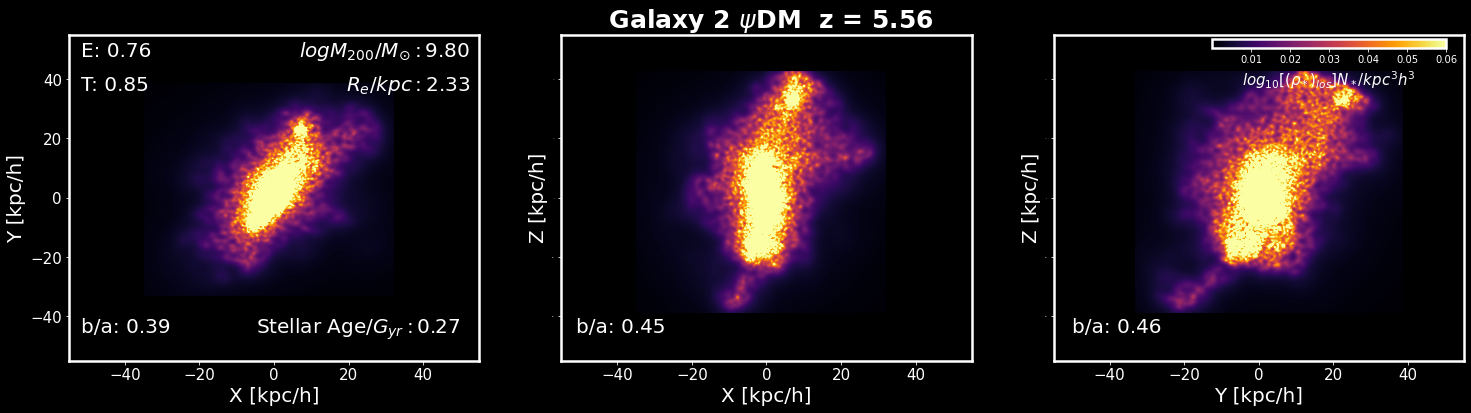
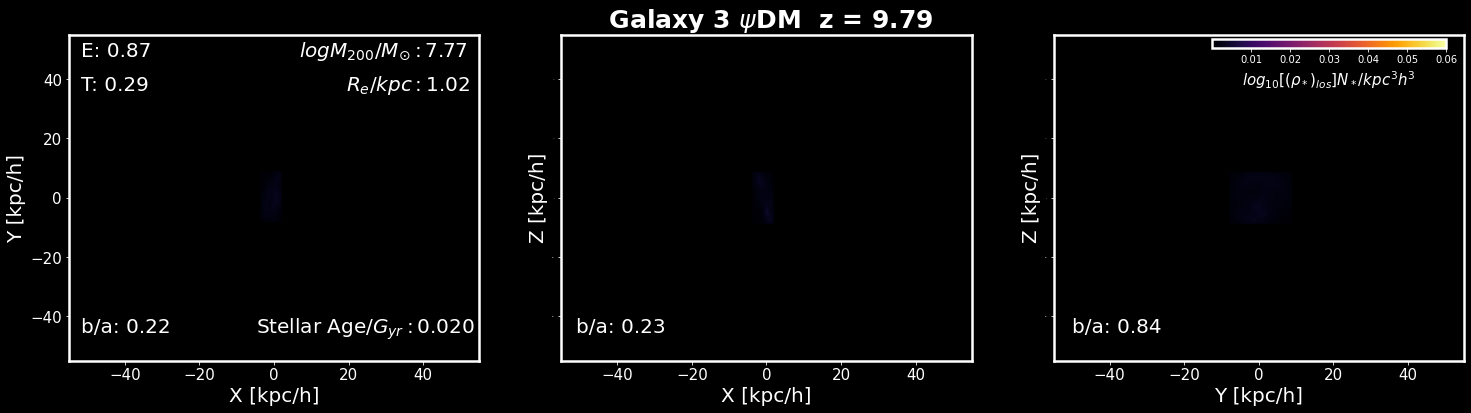
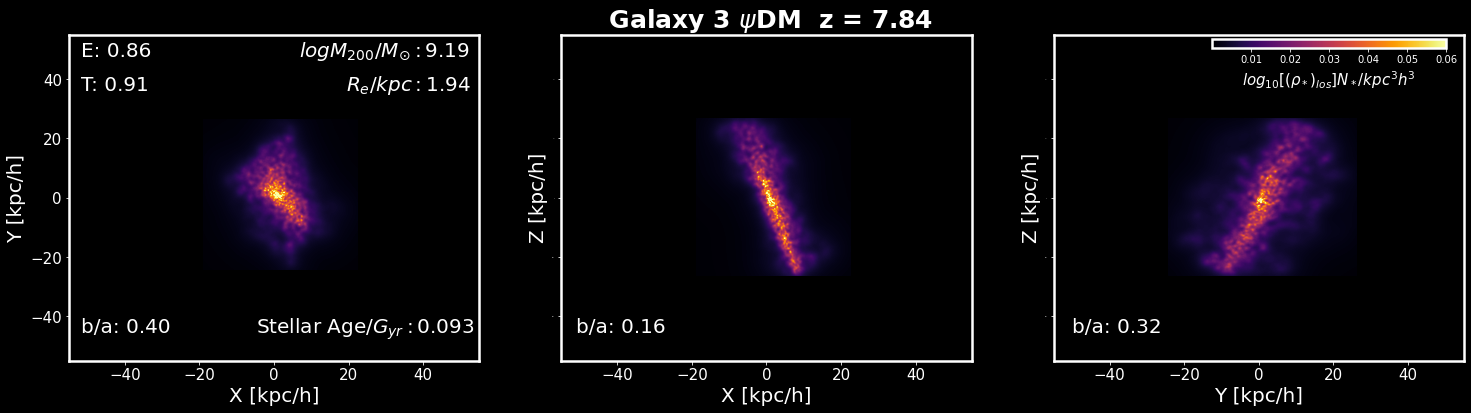
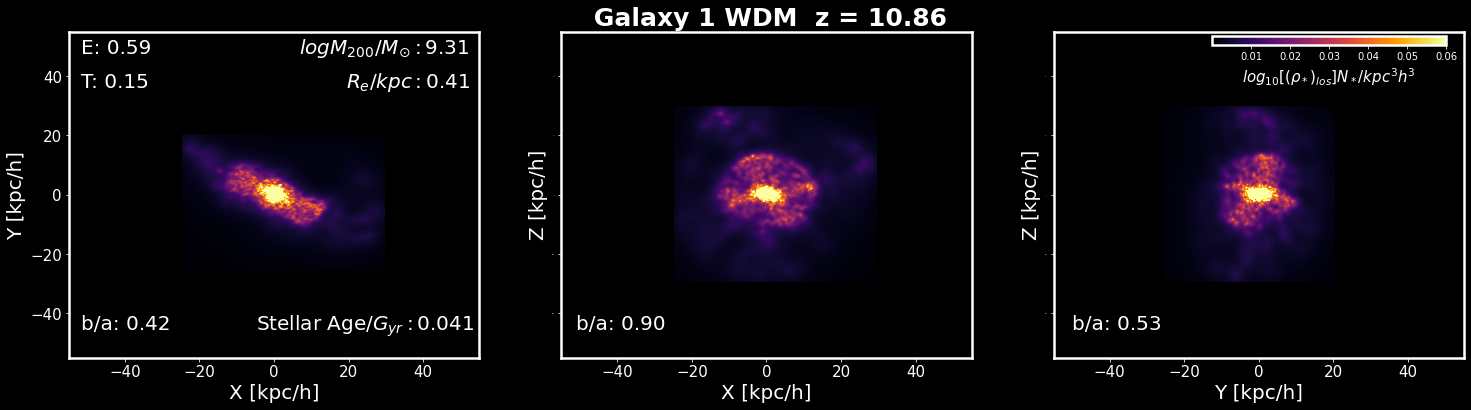
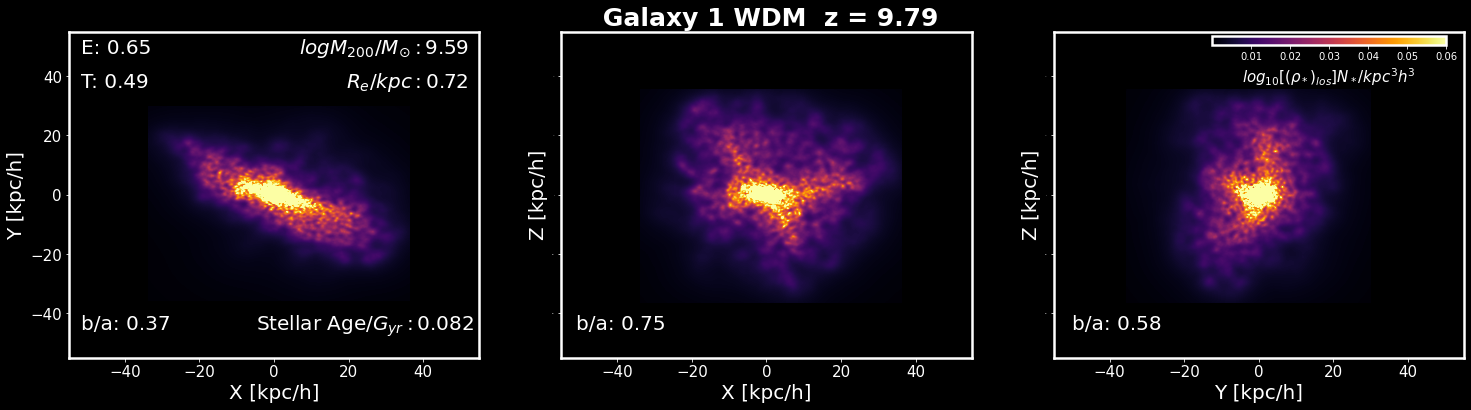
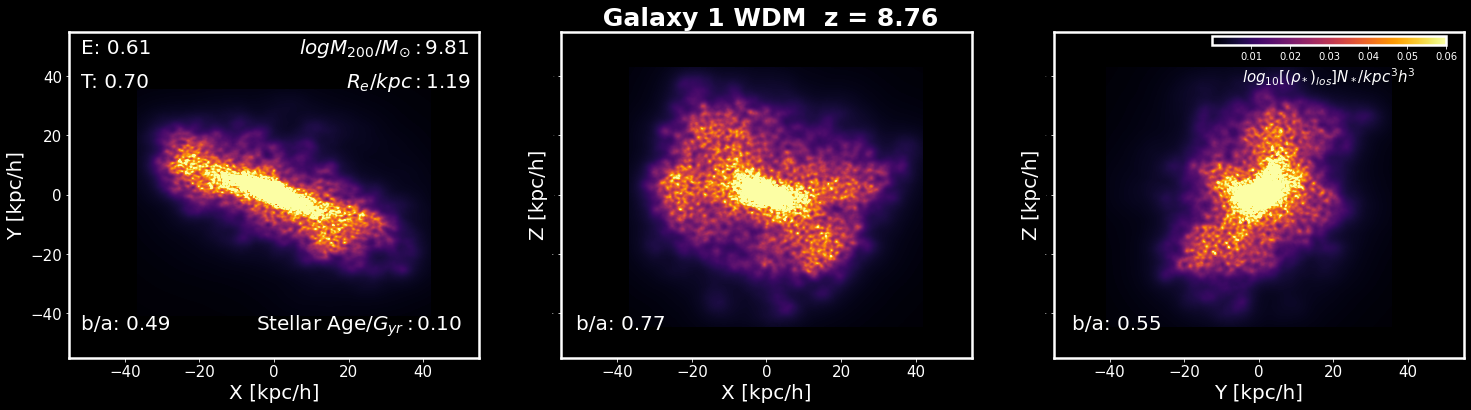
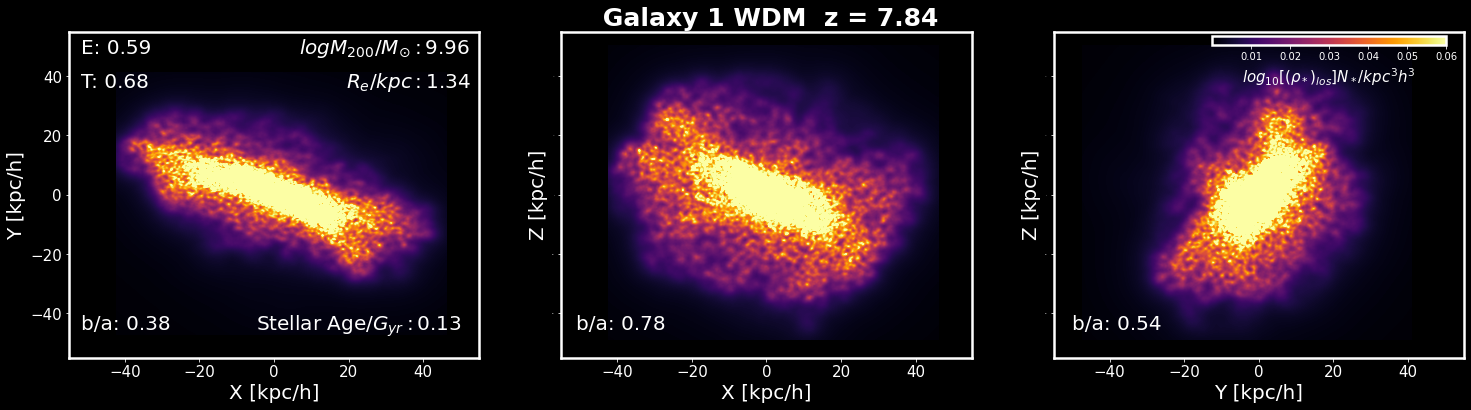
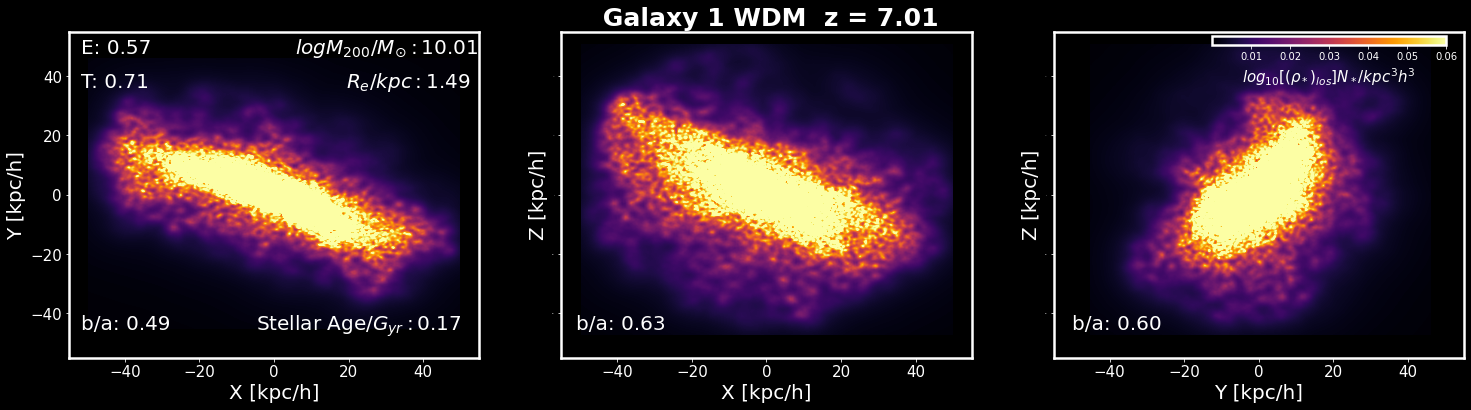
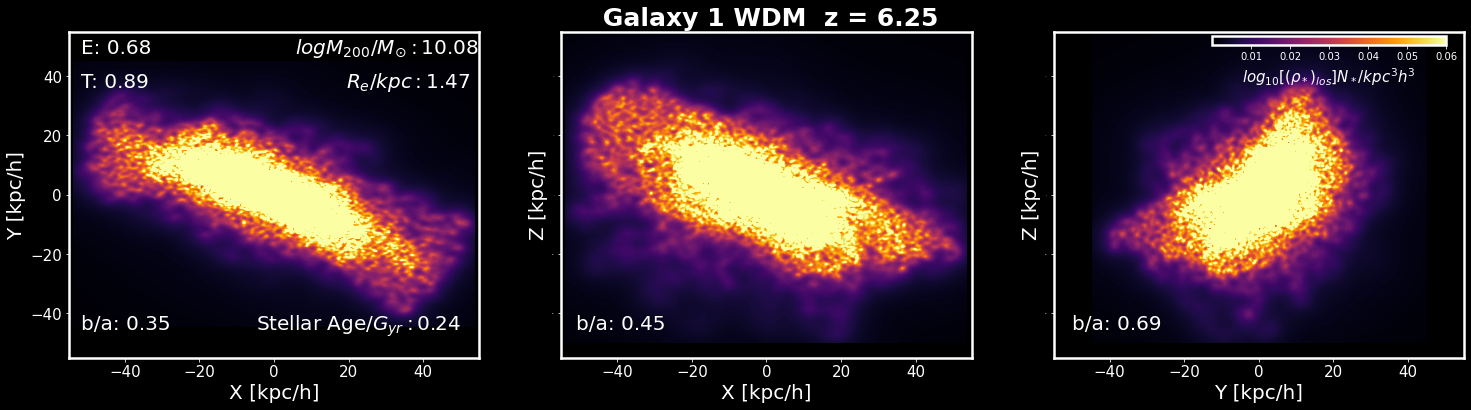
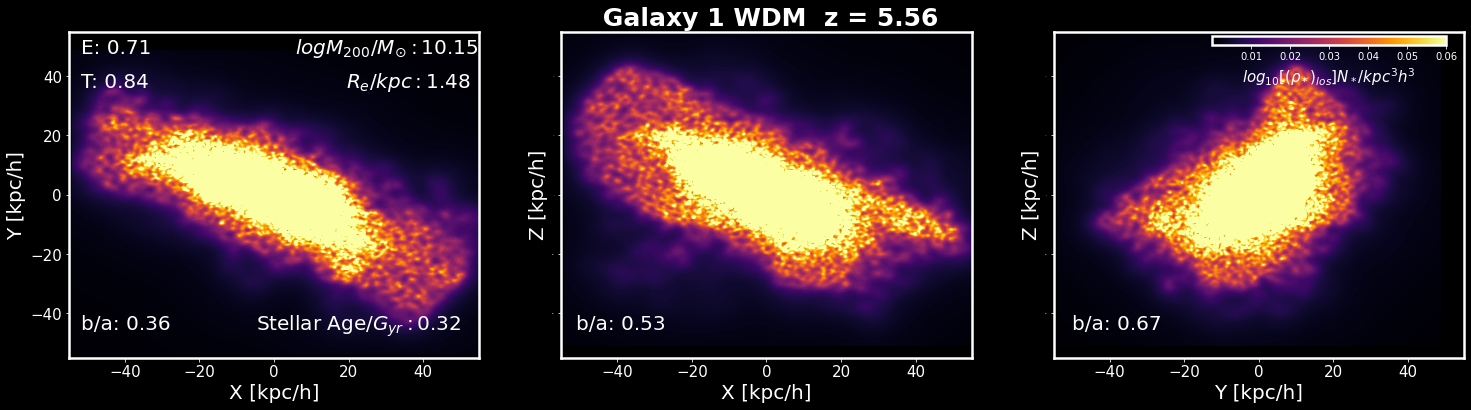
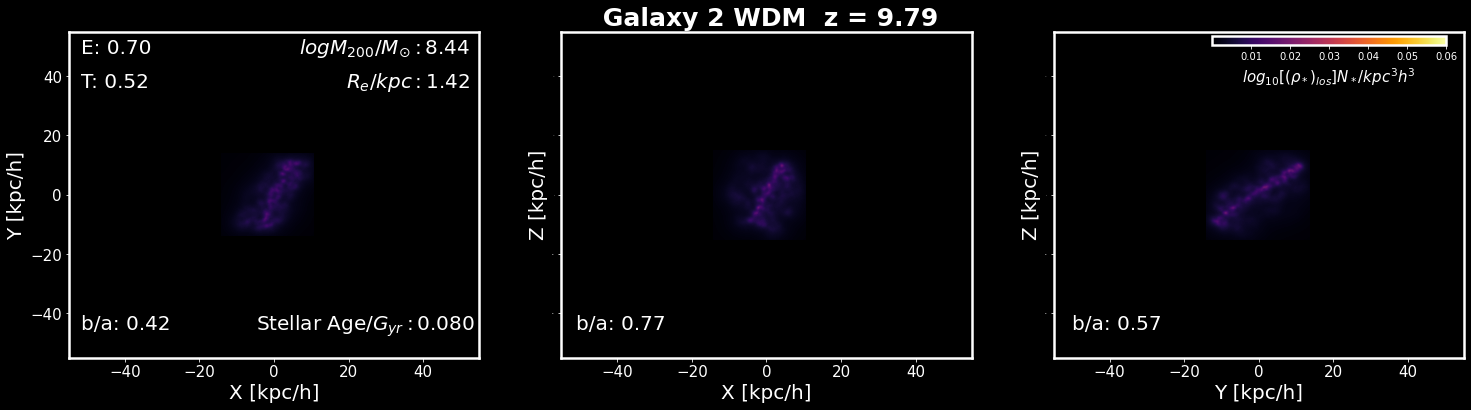
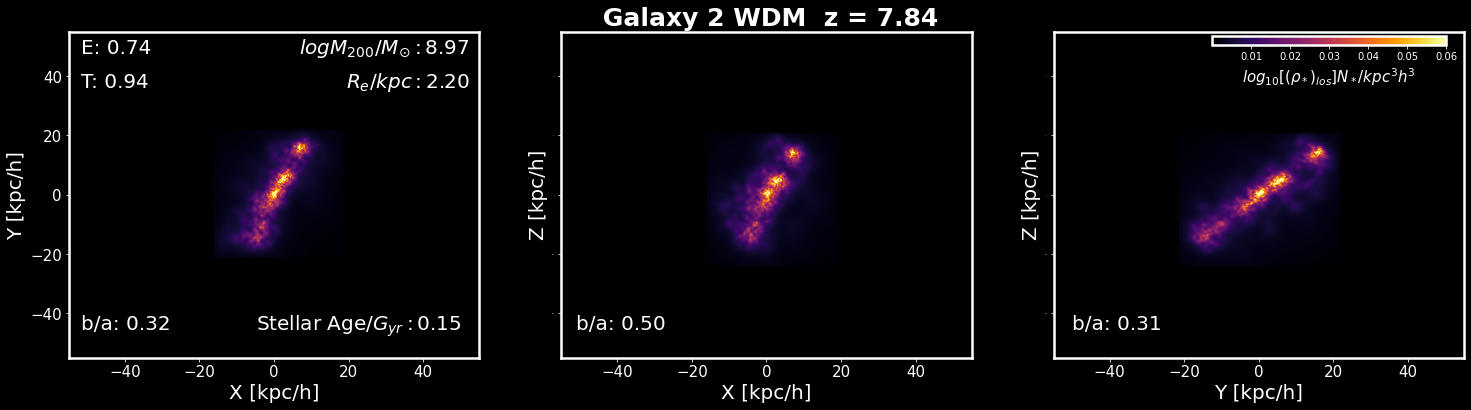
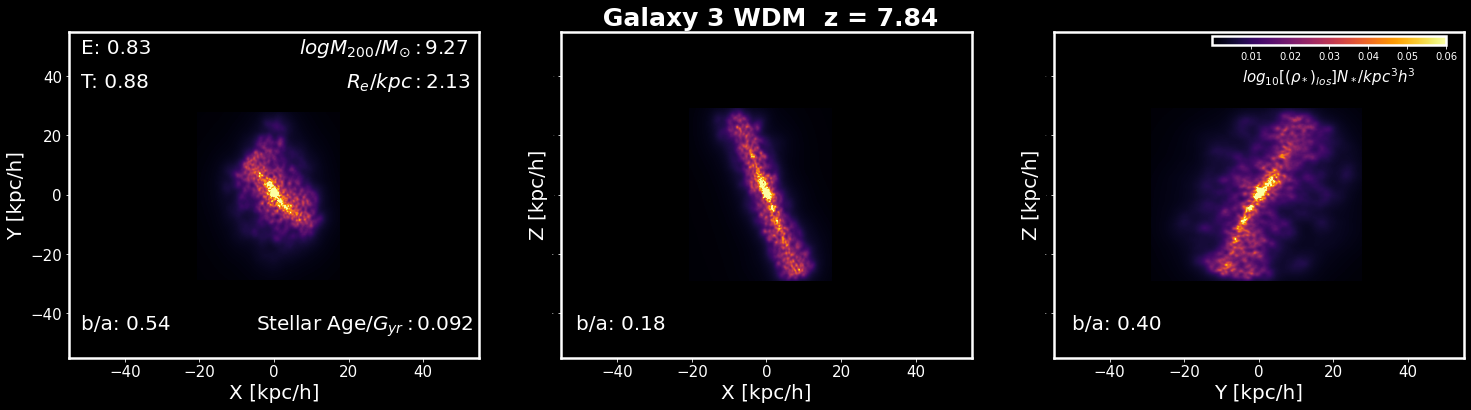
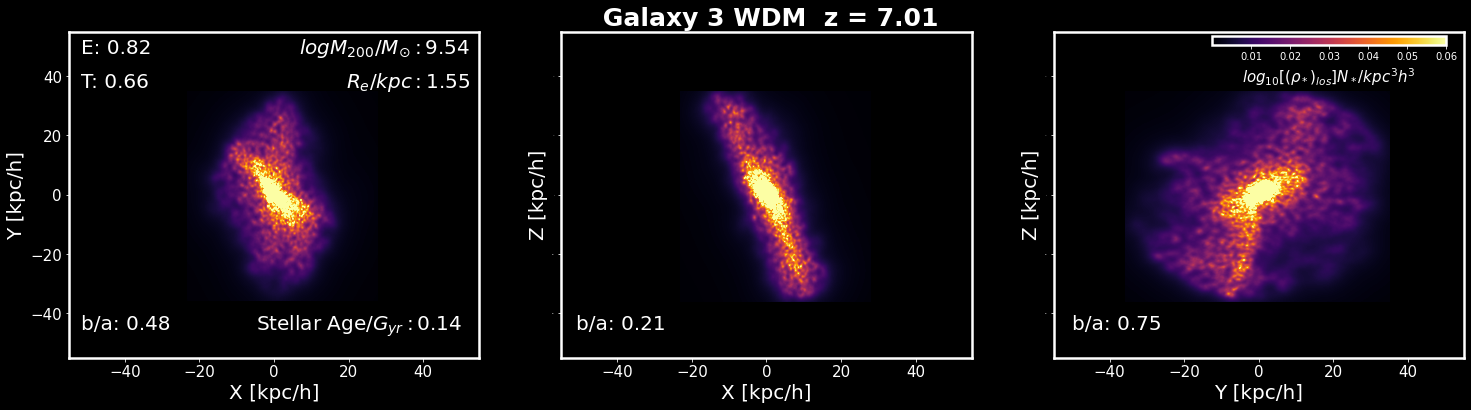
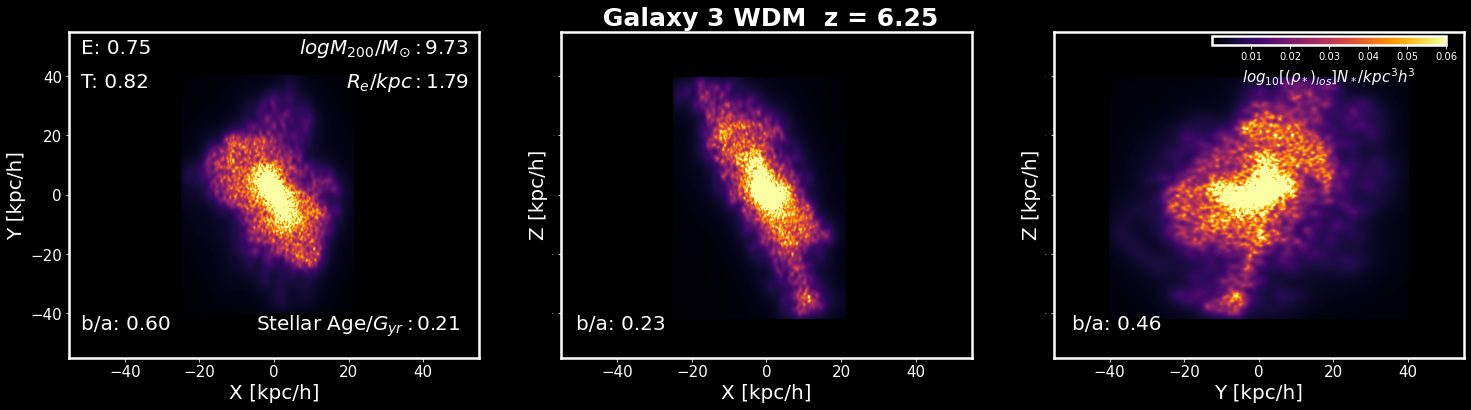
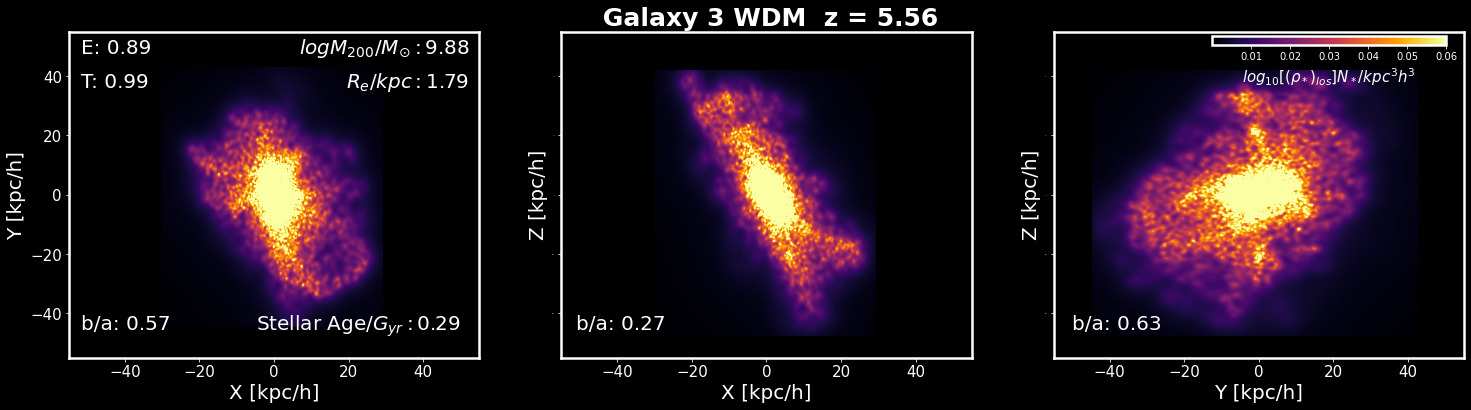
Below, we present the evolution of all analyzed galaxies across all available redshifts and DM models. Each row of galaxies shows the same galaxy observed from three different perspectives/projections and, consequently, has been counted as individual galaxies for the ”b/a vs log a” figures. In contrast, for the ”3D C/A vs 3D B/A” figures, each row represents a single analyzed galaxy, explaining why the number of data points is smaller in the latter.