Cluster Haptic Texture Database:
Haptic Texture Database with Variety in
Velocity and Direction of Sliding Contacts
Abstract
Human perception integrates multisensory information, with tactile perception playing a key role in object and surface recognition. While human-machine interfaces with haptic modalities offer enhanced system performance, existing datasets focus primarily on visual data, overlooking comprehensive haptic information. Previous haptic texture databases have recorded sound and acceleration signals, but often ignore the nuanced differences between probe-texture and finger-texture interactions. Recognizing this shortcoming, we present the Cluster Haptic Texture Database, a multimodal dataset that records visual, auditory, and haptic signals from an artificial urethane rubber fingertip interacting with different textured surfaces. This database, designed to mimic the properties of the human finger, includes five velocity levels and eight directional variations, providing a comprehensive study of tactile interactions. Our evaluations reveal the effectiveness of classifiers trained on this dataset in identifying surfaces, and the subtleties of estimating velocity and direction for each surface.
Index Terms:
Haptic Database, Textured Surfaces, Texture Rendering, Haptics, Machine Learning.I Introduction
Human perception is known to be multisensory, and we perceive sensations by integrating different sources of information accessed through different sensory modalities in the brain. In particular, human tactile perception comprises the submodalities of kinesthesia and touch, both of which play an important role in the perception of objects and surfaces. When exploring an object, kinesthesia is important for determining geometric properties such as the object’s surface shape [1]. Therefore, human-machine interfaces that incorporate haptic modalities have great potential to improve the reality and performance of systems [2].
Besides haptic perception, visual and auditory inputs significantly influence the perception of surface geometric properties. The haptic dataset, which is crucial for artificial intelligence and machine learning research, should include rich data from these three sensory modalities and their submodalities. In the field of machine learning, texture databases such as VisTex [3] and ImageNet [4] have been actively developed for use in computer vision research. Although these data-rich open-source databases have contributed significantly to the research community, they consist only of images, i.e., visual data, and are inadequate as haptic datasets.
Some previous studies have proposed tactile texture databases that include the above-mentioned multimodal data. However, these studies focused on recording sound and acceleration signals generated by sliding a rigid probe on a real surface [5, 6, 7, 8, 9, 10]. There is a significant difference in mechanical behavior between this rigid probe-texture interaction and a soft, finger-like texture interaction [11, 12]. Other studies have recorded load and vibration [13, 14], skin vibration [15, 16], normal and frictional force [17], and load, sound, and vibration data with captured visual images [18] on real surfaces as bare fingers slide over textured surfaces.
However, to our knowledge, there is no comprehensive dataset that includes visual, auditory, and tactile modalities with controlled sliding velocity and direction. This means that the degree of change in tactile data for different speeds and directions of sliding contact depends on the roughness of the textured surface and its manufacturing method (natural, fabric, etc.), but the datasets proposed so far cannot represent such differences well. Therefore, if a dataset with a variety of velocities and directions in sliding contact can be realized, it will not only be useful for the above-mentioned perception and machine learning research but also greatly contribute to the realization of a human-machine interface that can present enriched tactile sensations.
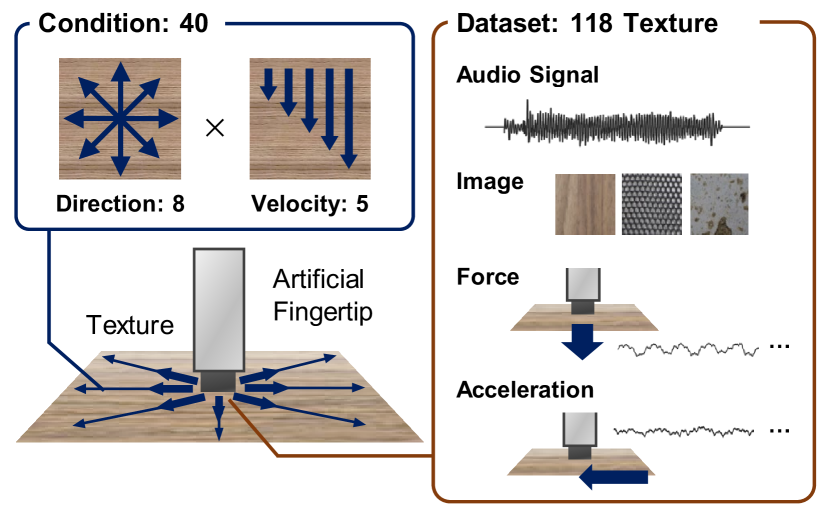
To address this gap, we propose the Cluster Haptic Texture Database, a multimodal visual, auditory, and haptic dataset consisting of signals generated by sliding contact of an artificial urethane rubber fingertip with physical properties similar to those of a human finger with different textured surfaces. We recorded the position, the applied load, the sound generated by the contact, and the acceleration signal at the tip of the artificial finger. We also set five velocity levels and eight directional variations based on 40 mm/s, which is the used velocity for human sliding contact in the previous study [17]. The concept of the data to be recorded in our dataset is shown in Fig. 1.
We compared the accuracy of the classifiers trained on different combinations of data from different modalities to identify different surfaces to explore the validity and applicability of the proposed dataset. In addition, we compared the accuracy of velocity or direction classification for each surface and discussed the characteristics of surfaces where velocity or direction estimation underperformed. In this paper, Section II describes the data acquisition equipment, data acquisition protocol, and surfaces used; Section III describes the performance of machine learning for surface identification and the characteristics of each surface in estimating velocity and direction; Section IV discusses the experimental results; and Section V concludes the paper and suggests future work.
II Methods
This section presents information about the texture surface materials in the Cluster Haptic Texture Database, the measurement equipment, and the procedures for acquiring texture data.
II-A Hardware Setup
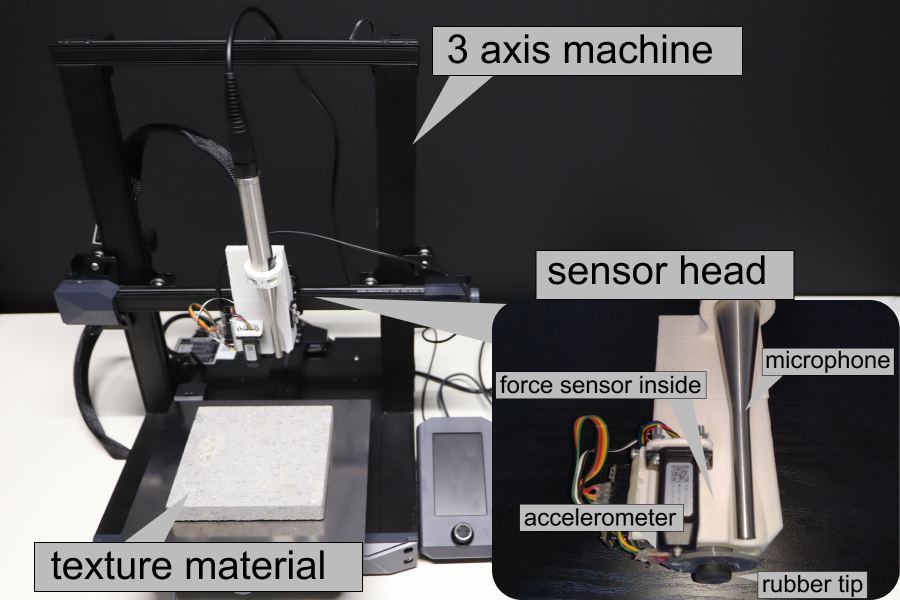
To acquire the sliding interaction information of the textured surface at different and controlled velocities and directions, we developed a special measuring device based on a 3D printer to construct a texture dataset using this information. Figure 2 shows the configuration of the measurement system. The system consists of a 3D printer, an artificial urethane rubber fingertip attached to the 3D printer as an end-effector, a directional microphone, and a force sensor and accelerometer attached to the artificial finger. The 3D printer and all sensors were connected to a single PC (Dell G15 5511, Dell), and the measurement information was recorded along with time stamps. Since the measurement process involves contact between the artificial fingertip and the material, we performed the measurements free from the influence of environmental noise by placing the measurement device in a soundproof enclosure. The details of the components are described below.
II-A1 3D Printer
A 3D printer (Ender-3 S1, Creality) was used as the XYZ stage, and the filament ejection unit was removed to make room for the end-effector. The 3D printer’s modeling bed sheet was removed to expose the metal. This is because we used a magnetic sheet to attach the textured material to this bed. In addition, we controlled the operation of the 3D printer by sending G-code from a PC connected to the 3D printer.
II-A2 Artificial Fingertip
A cylindrical urethane rubber tip (SCXN15-25, MISUMI) was used as the artificial fingertip attached to the end-effector. The hardness of the rubber tip was Shore A15, which was determined based on the results of a previous study [19]. The diameter of the cylindrical rubber tip was 15 mm, and this value was determined based on the average index finger contact area (Ellipse with a major axis radius of 6.8 mm and minor axis radius of 5.7 mm, area of about 122 mm2) in the AIST hand dimension database [20, 21], ensuring that the cross-sectional area of the cylinder was close to this value.
II-A3 Microphone
A directional microphone (M30, Earthworks) was attached to the end effector using an ABS plastic mount. The microphone was mounted so that its sound pickup was directed at the point where the artificial fingertip made contact with the textured surface. The frequency response of the microphone is extremely flat, from 10 Hz to 30 kHz, with a sensitivity of 39.5 mV/Pa. The microphone output was connected to a PC via a USB audio interface (UR22mkII, Steinberg). The sampling rate of the recordings was 44.1 kHz.
II-A4 Force Sensor
A force sensor (FSR402, Interlink Electronics) was placed between the artificial fingertip and the end-effector structure to which the fingertip was attached. The force sensor has a measuring range of 0.2 N to 20 N. The sensor output was connected to the A/D conversion input pin of the microcontroller (Teensy 3.2, PJRC) and converted to a 10-bit digital value before being sent to the PC via a USB serial interface. The sampling rate of the sensor values in the microcontroller was 1 kHz.
II-A5 Accelerometer
An accelerometer sensor module (ADXL335 - 5V ready triple-axis accelerometer, Adafruit) with a 3-axis MEMS accelerometer (ADXL335, Analog Devices) was mounted on an artificial fingertip to record acceleration information. This accelerometer was also used in the previous study [22], with a measurement range of 3 g and an accuracy of 300 mV/g. The accelerometer was installed to align the coordinate axes of the 3D printer and the accelerometer. The sensor output was connected to a PC via a microcontroller like the force sensor. The sampling rate of the sensor values was 1 kHz for the force sensor.
II-B Textures
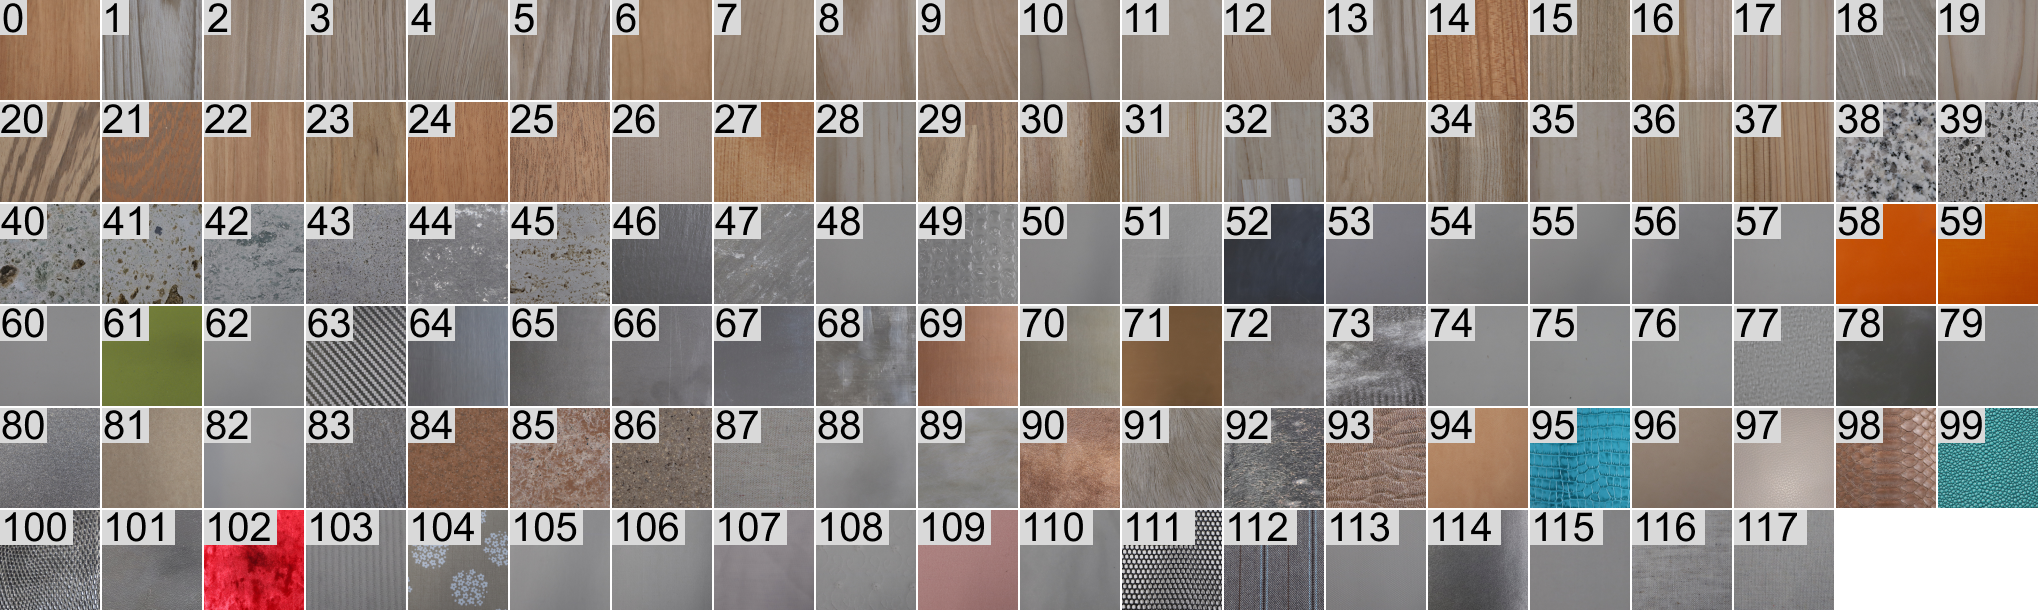
Based on the texture materials from the LMT Haptic Database proposed in [7], we have collected 118 materials in 9 categories, as shown in Fig. 3. The materials include 38 types of wood, 10 types of stone, 16 types of polymer, 10 types of metal, 5 types of glass, 3 types of composite, 5 types of ceramic, 15 types of biological leather, and 16 types of clothes. Each material was processed into a 100 mm 100 mm square shape, except for samples that were difficult to process, such as stone. These materials were attached with adhesive to a thin magnetic sheet (Mag sheet, Nichie Co., Ltd.) to secure them to the metal bed of the 3D printer.
II-C Recording Procedure
We recorded the position of the artificial fingertip, the applied load, the sound generated by the contact, and the acceleration signal at the fingertip. The position data was obtained from the 3D printer, while sensors captured the load, sound, and acceleration signals. We tested five velocities (20 mm/s, 30 mm/s, 40 mm/s, 50 mm/s, and 60 mm/s) and eight directions (intercardinal direction), resulting in 40 combinations. This variation in sliding speed was determined in reference to previous studies [23, 24, 25]. The following measurements were made for each of the 130 textures:
-
1.
Place the material on the bed of the equipment.
-
2.
Find the height at which the force of the rubber tip against the material is 1 N and set z = 0. The initial position (center of the bed) is set to x = 0, y = 0.
-
3.
For each of the eight intercardinal directions, calculate the target x and y coordinate values so that the sliding distance of the artificial fingertip is 80 mm, and move the artificial fingertip to this position at the height of z = 0. The sensor values are taken from the start point to the end point of each sliding.
-
4.
Repeat 3) for five velocity variations.
-
5.
Repeat 3) and 4) again. In other words, a total of = 80 tracing motions are performed for one material.
II-D Data Processing
We implemented a data acquisition program in Python to receive sensor values on a PC. We created separate threads for the microphone (USB audio interface) and the force sensor/accelerometer (microcontroller) for multi-threaded processing. Each sensor value was also timestamped using the kernel clock in the operating system.
We also captured close-up color images of all textured materials using a digital image scanner. The texture images stored in the database are square images with 2,362 pixels on each side. The texture size was, with a few exceptions, 100 mm 100 mm, and the scan resolution was 600 dpi, which corresponds to a physical scale of 24 pixels/mm.
We intend to make the database available for free download from our website immediately after acceptance of the paper. We will permit its use, reference, and analysis, subject to the copyright of Cluster, Inc.
III Experiments
We aimed to determine how sensor data, in particular sound and acceleration information characterizing the physical and geometric properties of the texture material, can be used for texture identification. To this end we performed a texture classification task using all of the sensor data. In addition, we performed a texture classification task on the sensor data obtained from each texture, analyzing its characterization based on variations in traversal velocity and direction, considering either as a label.
III-A Features and Classifiers
For the sound data recorded with the microphone, a set of features called Mel Frequency Cepstral Coefficients (MFCC) [26] were used for classification based on research in the audio domain. For the acceleration data, no features were extracted, and the time series data were used for classification as is.
For the classifiers, we used the support vector machine (SVM), decision tree algorithm, and random forest algorithm used in previous studies [27, 18] for classification. In addition to these classical classifiers, we also tried classifiers using a CNN-based model. Here, we used ResNet [28], a trained image database, as the model and constructed the classifier by transfer learning with our tactile texture database. In addition, in the CNN-based model, the input data must be two-dimensional array data. Therefore, we constructed time-series sound or acceleration data as spectral images of MCSS, which were used as input for transfer learning. We used PyTrch d as the neural network training framework.
In the experiments, we divided the data from our texture dataset in the ratio of 70:10:20 for training, validation, and testing, respectively, to train and evaluate the classifiers. Accuracy, Precision, Recall, and F1 Score were used as indices for the evaluation of the classifiers.
III-B Experiment I: Texture Classification
III-B1 Classification using audio signals
Since the raw audio data recorded by microphones contains redundant information, processes such as filtering and feature extraction are necessary to remove these redundancies and improve classification performance. As described in Section III-A, we extracted features using MFCC, which is commonly used in audio classification, and then input the amplitude intensity of each frequency, converted to a decibel scale to the classifier.
| Classifiers | Accuracy (%) | Precision (%) | Recall (%) | F1 score (%) |
|---|---|---|---|---|
| SVC | 27.16 ±1.0 | 32.49 ±2.52 | 28.80 ±1.31 | 25.67 ±1.49 |
| Decision Tree | 16.30 ±1.47 | 16.82 ±1.45 | 16.51 ±1.58 | 16.14 ±1.46 |
| Random Forest | 47.63 ±1.59 | 49.07 ±2.07 | 48.10 ±1.72 | 46.54 ±2.06 |
| CNN (ResNet) | 87.71 ±1.57 | 88.52 ±1.02 | 87.71 ±1.57 | 87.34 ±1.43 |
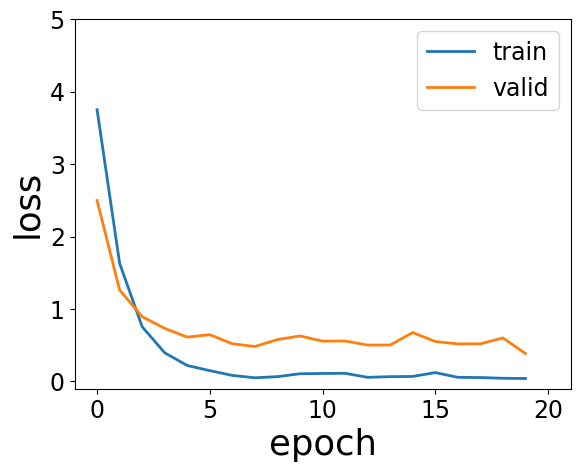
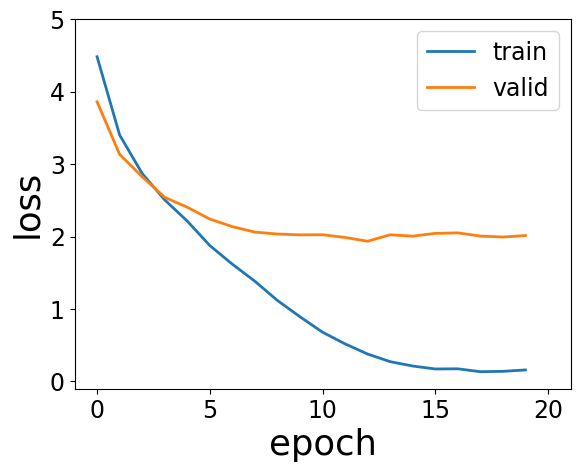
The classification of tactile textures using audio data was classified using the three machine learning models used in previous studies and a CNN-based model and evaluated using the four parameters described in Section III-A. Training, validation, and testing were performed three times for each classifier. The performance characteristics of each classifier are listed in Table I. Among the classical machine learning models, the random forest classifier performed best, classifying with an accuracy of about 48%, while the CNN-based classifier with ResNet showed an accuracy of about 88%, showing that it is much more suitable for classification than the classical machine learning models. The training curve of the CNN-based classifier is also shown in Fig. 4a. The training and validation curves are close to each other, and the validation curve is stable at a low value, indicating no overfitting or underfitting. In addition, the training and test losses are small, at 0.072 and 0.078, respectively, indicating that the classification model performs well.
III-B2 Classification using acceleration signals
| Classifiers | Accuracy (%) | Precision (%) | Recall (%) | F1 score (%) |
|---|---|---|---|---|
| SVC | 0.57 ±0.17 | 0.0 ±0.0 | 0.08 ±0.0 | 0.0 ±0.0 |
| Decision Tree | 5.42 ±0.29 | 5.59 ±0.42 | 5.57 ±0.46 | 5.44 ±0.41 |
| Random Forest | 11.44 ±0.99 | 11.18 ±0.90 | 12.00 ±0.54 | 10.34 ±0.85 |
| CNN (ResNet) | 40.33 ±2.20 | 41.93 ±2.89 | 40.32 ±2.20 | 38.45 ±1.98 |
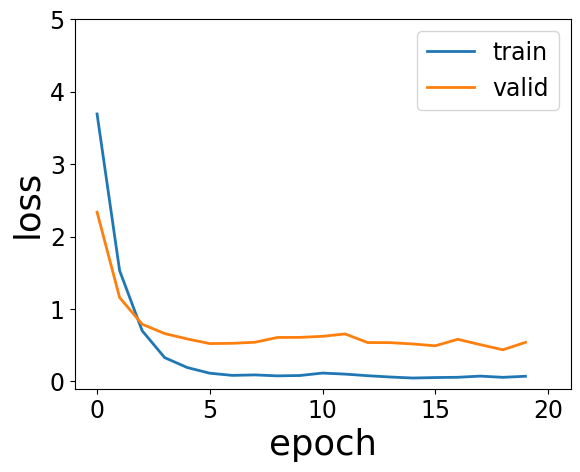
Acceleration data is assumed to capture vibration signals caused by friction as the fingertip slides. To match the conditions of Experiment 1, we converted the vibration signals obtained from the accelerometers into a two-dimensional array for training. We took a three-dimensional vector of raw sensor values, then transformed these three-dimensional vectors into a two-dimensional array with three dimensions (number of axes) the number of samples in the time series. The performance characteristics of each classifier are shown in Table II. As in the classification of audio signals, the random forest classifier performs best among the classical models, but the CNN-based classifiers show considerably better classification performance. On the other hand, unlike the classification using audio signals, the CNN-based classifier shows an accuracy of only about 40 %. The validation curve is higher than that of the classifier trained on audio signals but still stable at a low value (Fig. 4b).
III-B3 Classification using audio and acceleration signals
| Classifiers | Accuracy (%) | Precision (%) | Recall (%) | F1 score (%) |
|---|---|---|---|---|
| SVC | 9.46 ±1.17 | 10.64 ±0.65 | 10.48 ±1.08 | 8.05 ±0.86 |
| Decision Tree | 16.68 ±0.30 | 18.20 ±0.29 | 17.72 ±0.03 | 17.37 ±0.17 |
| Random Forest | 48.11 ±0.67 | 50.11 ±1.59 | 47.86 ±1.43 | 46.13 ±1.86 |
| CNN (ResNet) | 93.43 ±0.89 | 93.69 ±0.35 | 93.43 ±0.01 | 92.92 ±0.63 |
We investigated the classification performance of a multimodal classifier combining audio and acceleration data. For training, we concatenated the two-dimensional arrays of the time series of audio features and the time series of acceleration to form a single two-dimensional data. The performance characteristics of each classifier are shown in Table III. It was found that training with multimodal information improved the accuracy of the classifiers using the three models other than SVM compared to the classification of audio signals alone. In particular, the classification performance is exceptionally high, about 93 %, for the CNN-based classifier. The training and validation curves are close to each other, and the validation curve is stable at a low value, as shown in Fig. 4c.
III-B4 Summary and Discussion
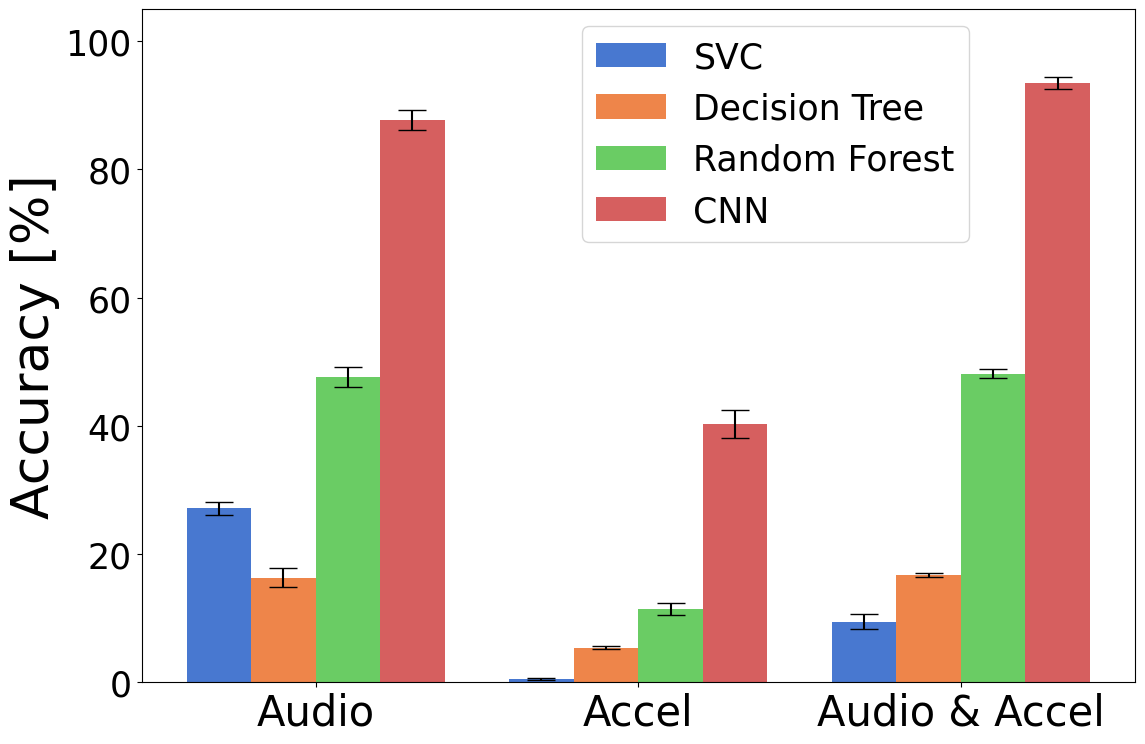
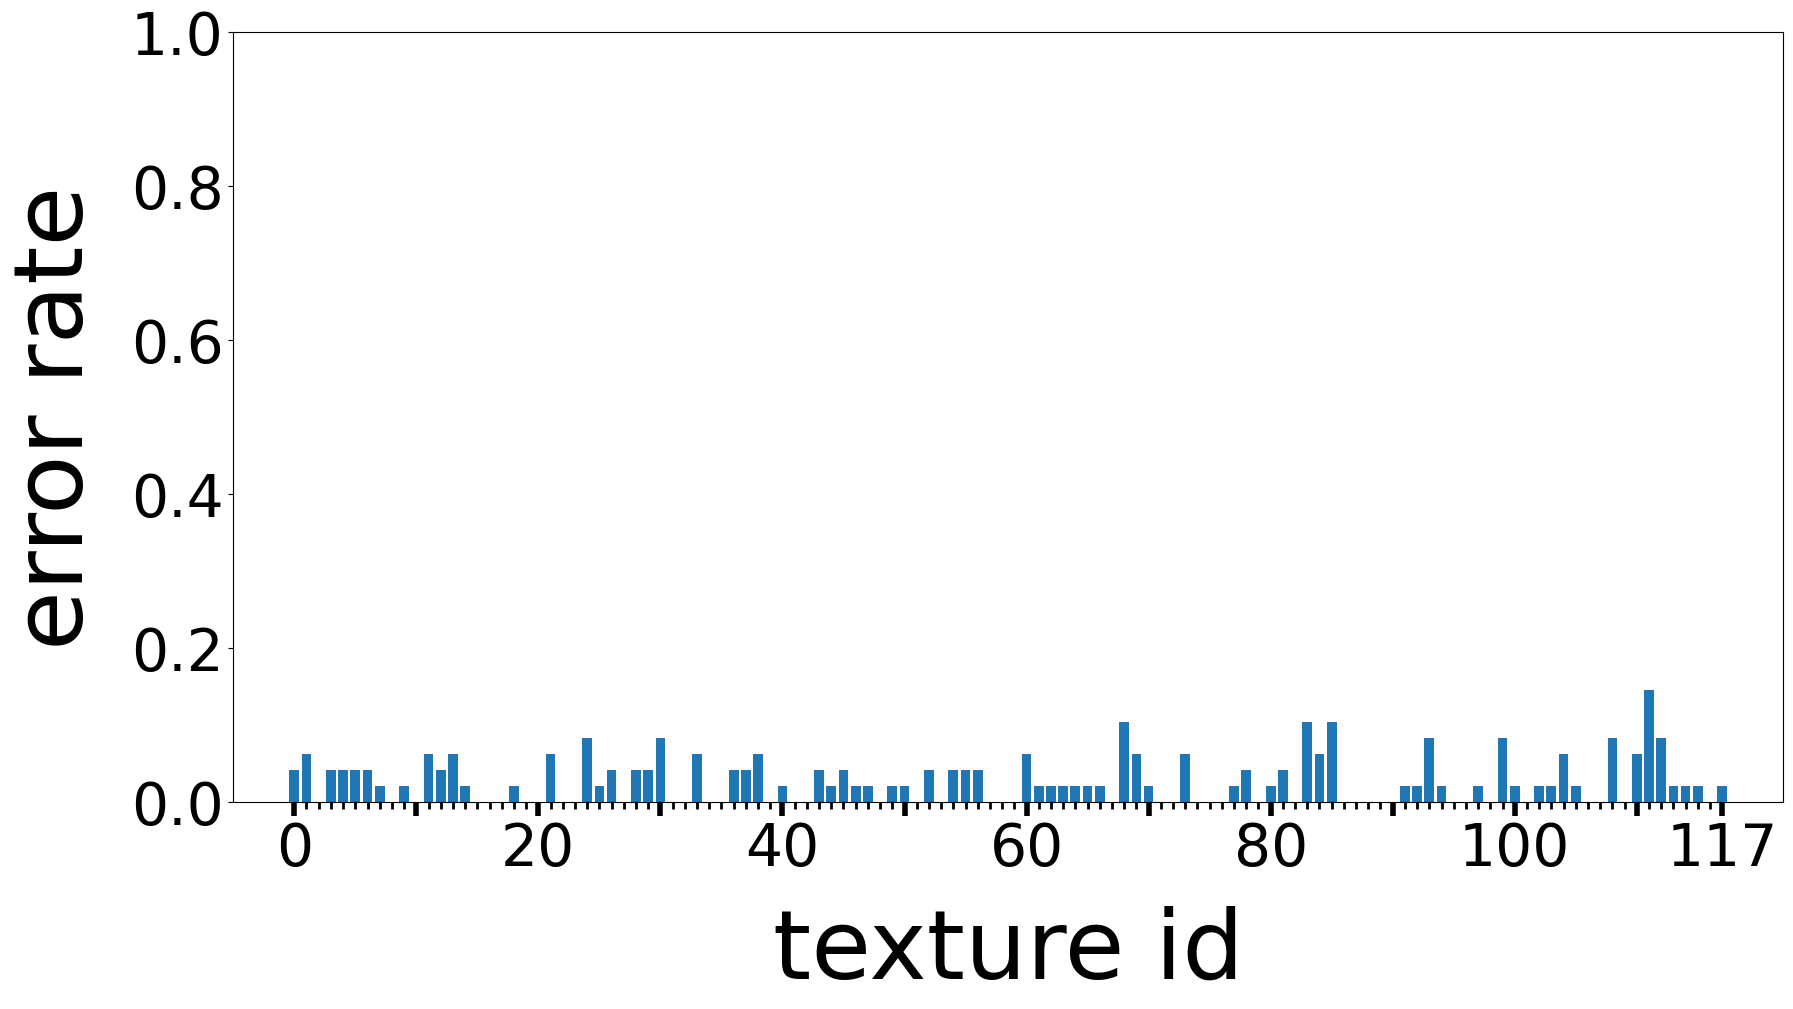
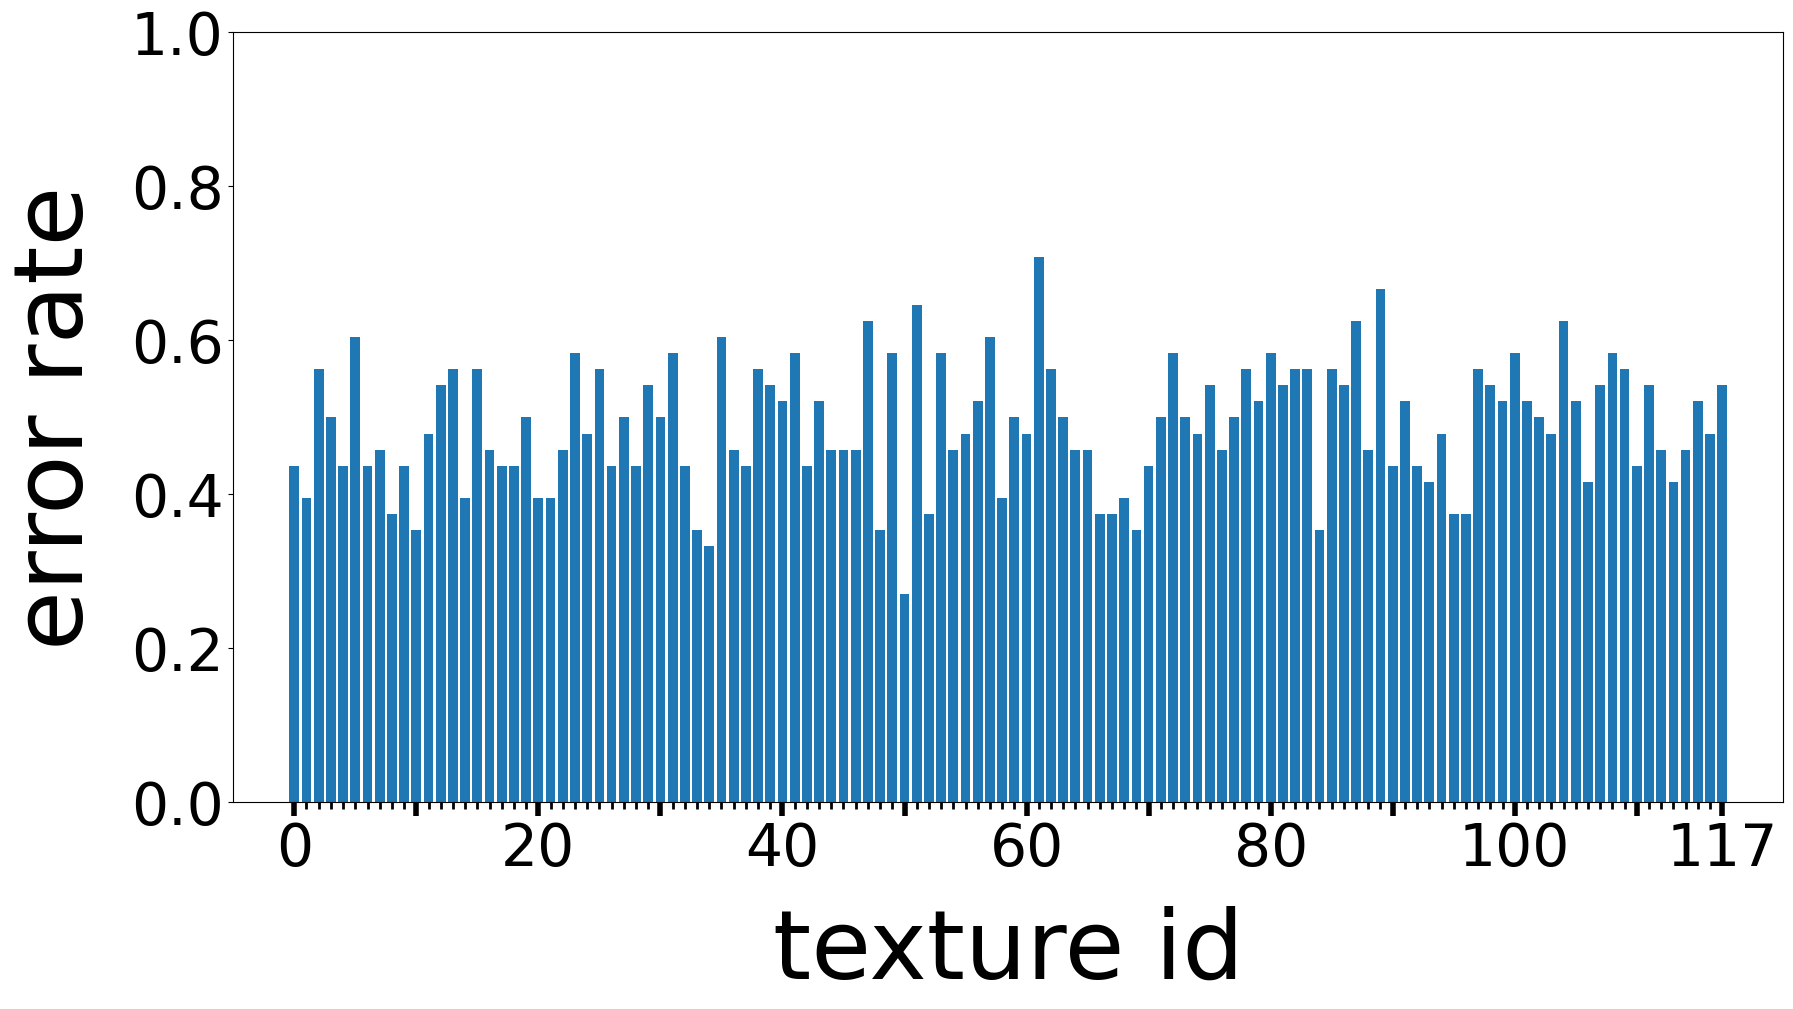
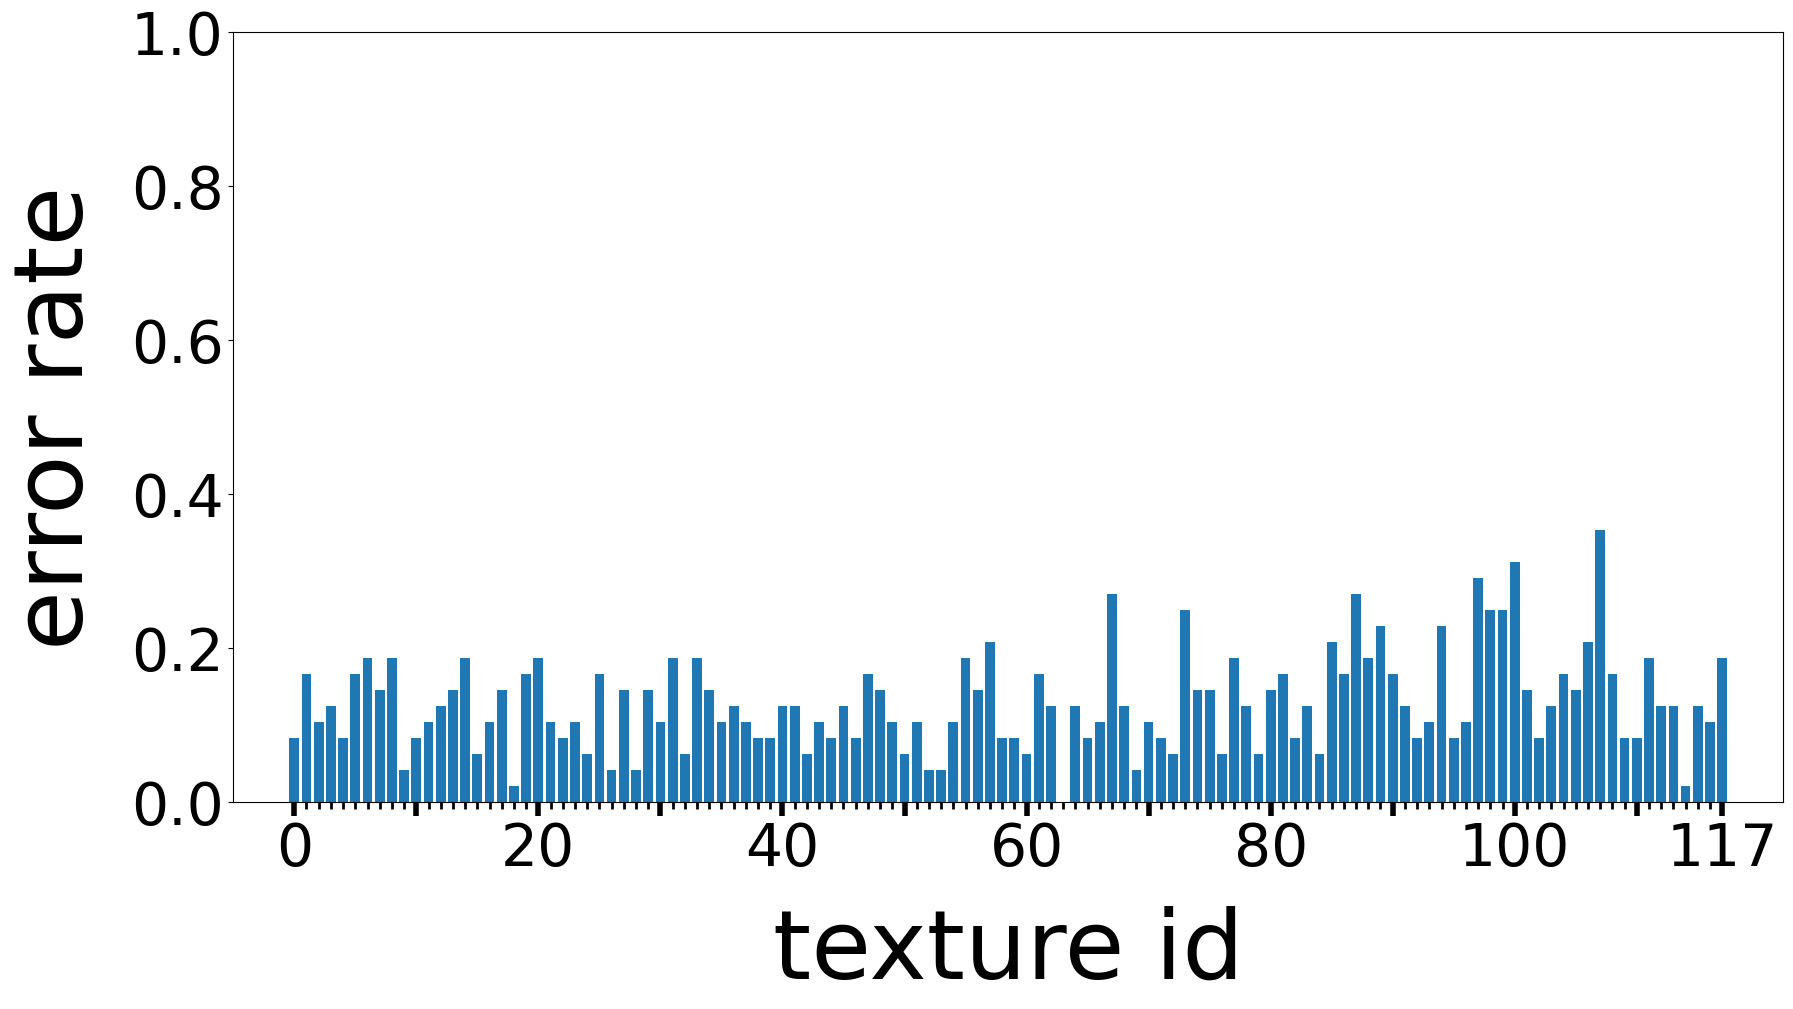
Figure 5 shows the classification results for each condition, with the CNN-based classifier showing by far the highest accuracy in all conditions compared to the three classical machine learning models. The classifiers using multimodal (audio and acceleration) data also show higher accuracy than classifiers using single-modal data, with the exception of the SVM model.
Compared to the classifiers using audio and multimodal data, the classifiers using acceleration data performed much worse for all training models. This may be due to the fact that for the acceleration data, the classifiers were trained by constructing a two-dimensional array using the raw values. In a previous study [18], acceleration data was trained after feature extraction processing using MFCC as well as audio data, but the accuracy was not improved by using this feature extraction process. Therefore, if it is possible to identify features that can adequately capture the characteristics of tactile vibration signals, the classification performance can be improved by extracting these features and training the data.
In addition, similar trends were observed in the performance of all classifiers (SVC, decision tree, random forest, and CNN), except for the classification of audio data, where the accuracy was in the order of lowest to highest for SVC, decision tree, random forest, and CNN, respectively. Interestingly, the results are quite consistent with those of the previous study [18], including the reversal of the rankings of the SVC and decision tree models only in the classification of audio data.
III-C Experiment II: Velocity Classification
We classified five velocities to evaluate how variations in the velocity of tracing affect the sensor signal in our haptic texture database.
III-C1 Classification
We used a CNN-based classifier for the velocity classifier, which had the highest classification accuracy in Experiment I. Unlike Experiment I, where the texture material ID served as the label, we set five different traversal velocities as the label in this experiment. For each texture, a separate classifier was trained. The classification accuracy of the velocity labels was then calculated for each texture material. A total of three training and estimation cycles were performed, and the average of these three cycles was used as the classification accuracy value.
III-C2 Results and Discussion
The classification accuracies of velocity labels by texture for classifiers using audio signals, acceleration signals, and both audio and acceleration signals are shown in Fig. 6a-c, respectively. The error rate is low when both audio and acceleration signals are used, especially when the audio signal is used, with an average error rate of 13.02 %, while the velocity labels are classified with a high accuracy of 86.98 %. The classification accuracy using acceleration signals was not better, but it can be assumed that this is due to the low accuracy of the texture classification itself.
| Texture w/ high error rate | Texture w/ low error rate | ||
|---|---|---|---|
| ID: Name | error rate | ID: Name | error rate |
| 107: Chiffon | 35.42 | 63: Carbon fiber | 0.00 |
| 100: Lizard skin | 31.25 | 114: Polyester | 2.08 |
| 97: Cow leather | 29.17 | 18: Chesnut | 2.08 |
| 67: Aluminium | 27.08 | 9: Birch | 4.17 |
| 87: Jute | 27.08 | 52: ABS | 4.17 |
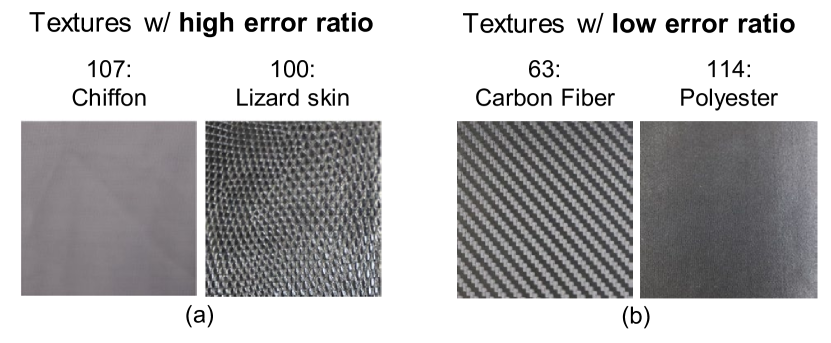
The velocity classification accuracy was examined separately for the texture materials in order to consider the results in terms of the physical properties of the textures. A list of texture material types with high and low error rates and their error rates for classifiers using both audio and acceleration signals is shown in Table IV. Table IV shows that chiffon and lizard skin textures have relatively high error rates. Since chiffon is very thin and soft and has a high coefficient of friction in contact with the artificial fingertip, while lizard skin has a very rough surface, it is expected that the sensor signal measurements for these textured materials will vary erratically with changes in velocity. On the other hand, materials with low error rates, such as carbon fiber and polyester, have very smooth surfaces and low coefficients of friction, so the sensor signal measurements change regularly with changes in velocity, and the velocity labels can be classified with high accuracy. The texture material images of chiffon and lizard skin are shown in Fig. 7a, and those of carbon fiber and polyester are shown in Fig. 7b.
III-D Experiment III: Direction Classification
To clarify how changes in touch direction affect the signal captured by the sensor in our tactile texture database, we performed a classification task to classify eight different touch directions.
III-D1 Classification
For the direction classification, we used the same CNN-based classifier as in Experiment II. In this experiment, eight different traversing directions were set as labels to be classified, and a separate classifier was trained on each texture separately to compute the classification accuracy of the direction labels. As in Experiment II, a total of three cycles of training and inference were performed, and the average of these three cycles was used as the classification accuracy value.
III-D2 Results and Discussion
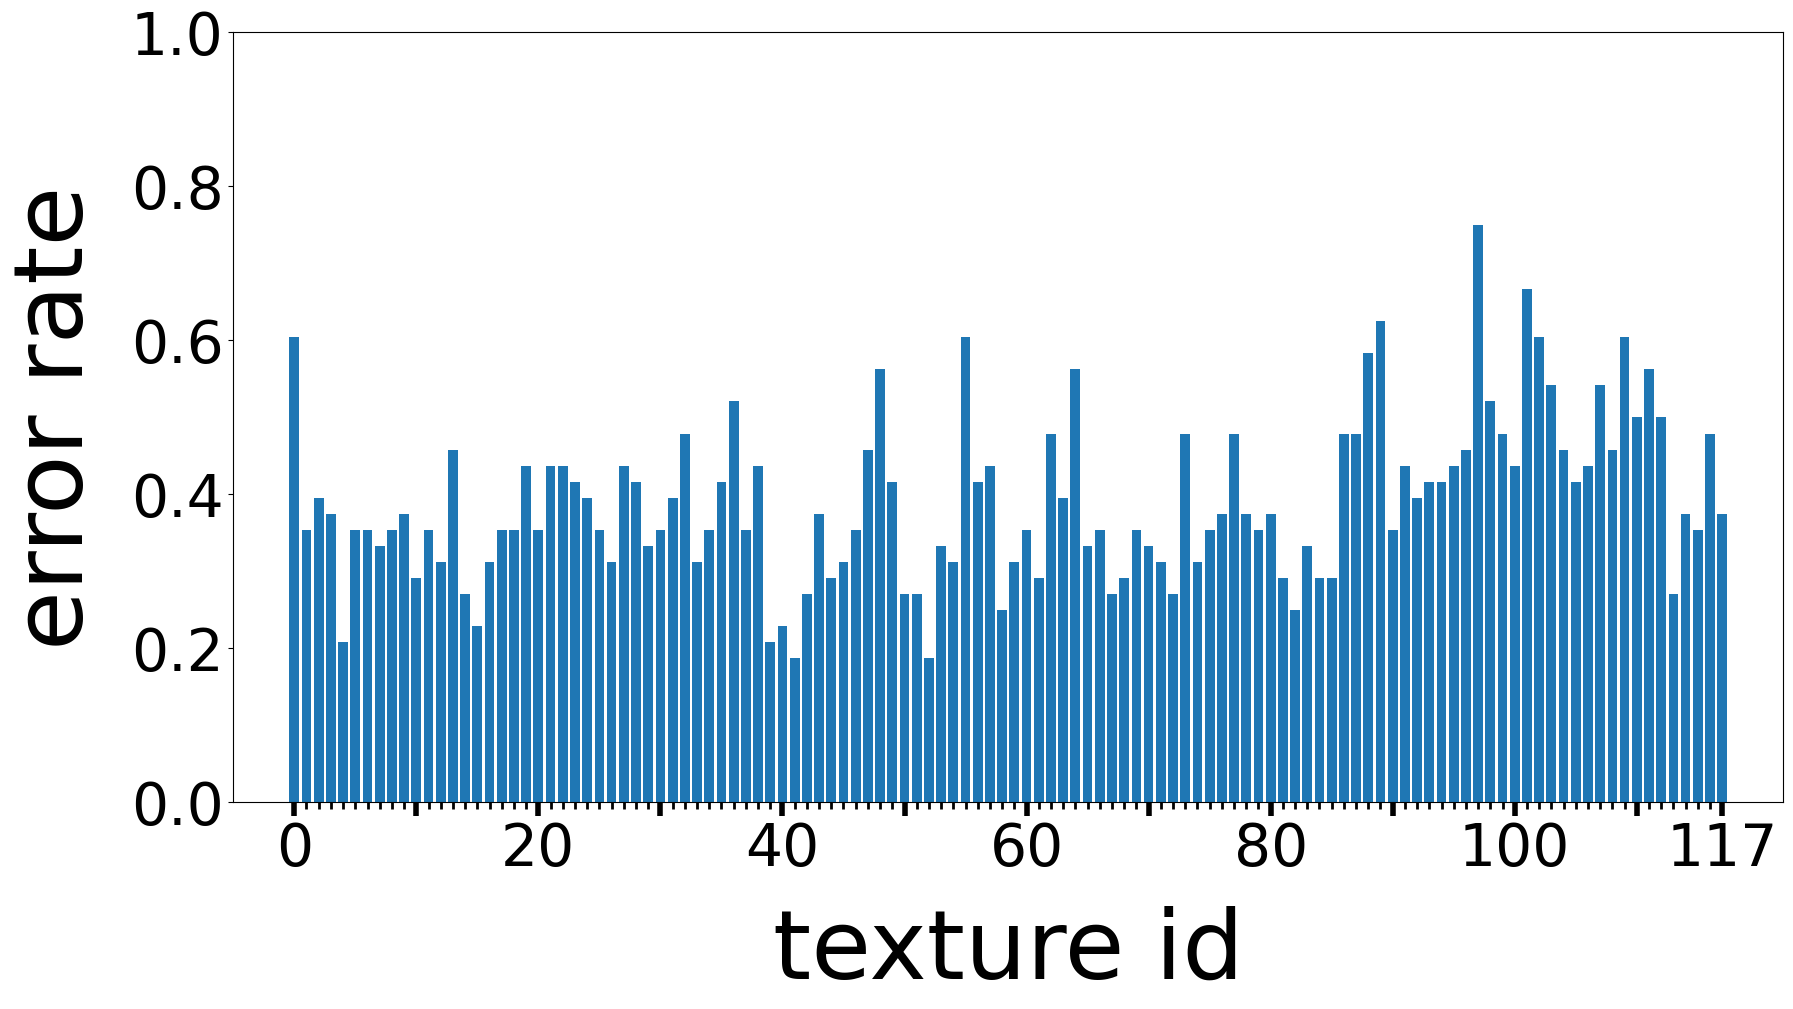
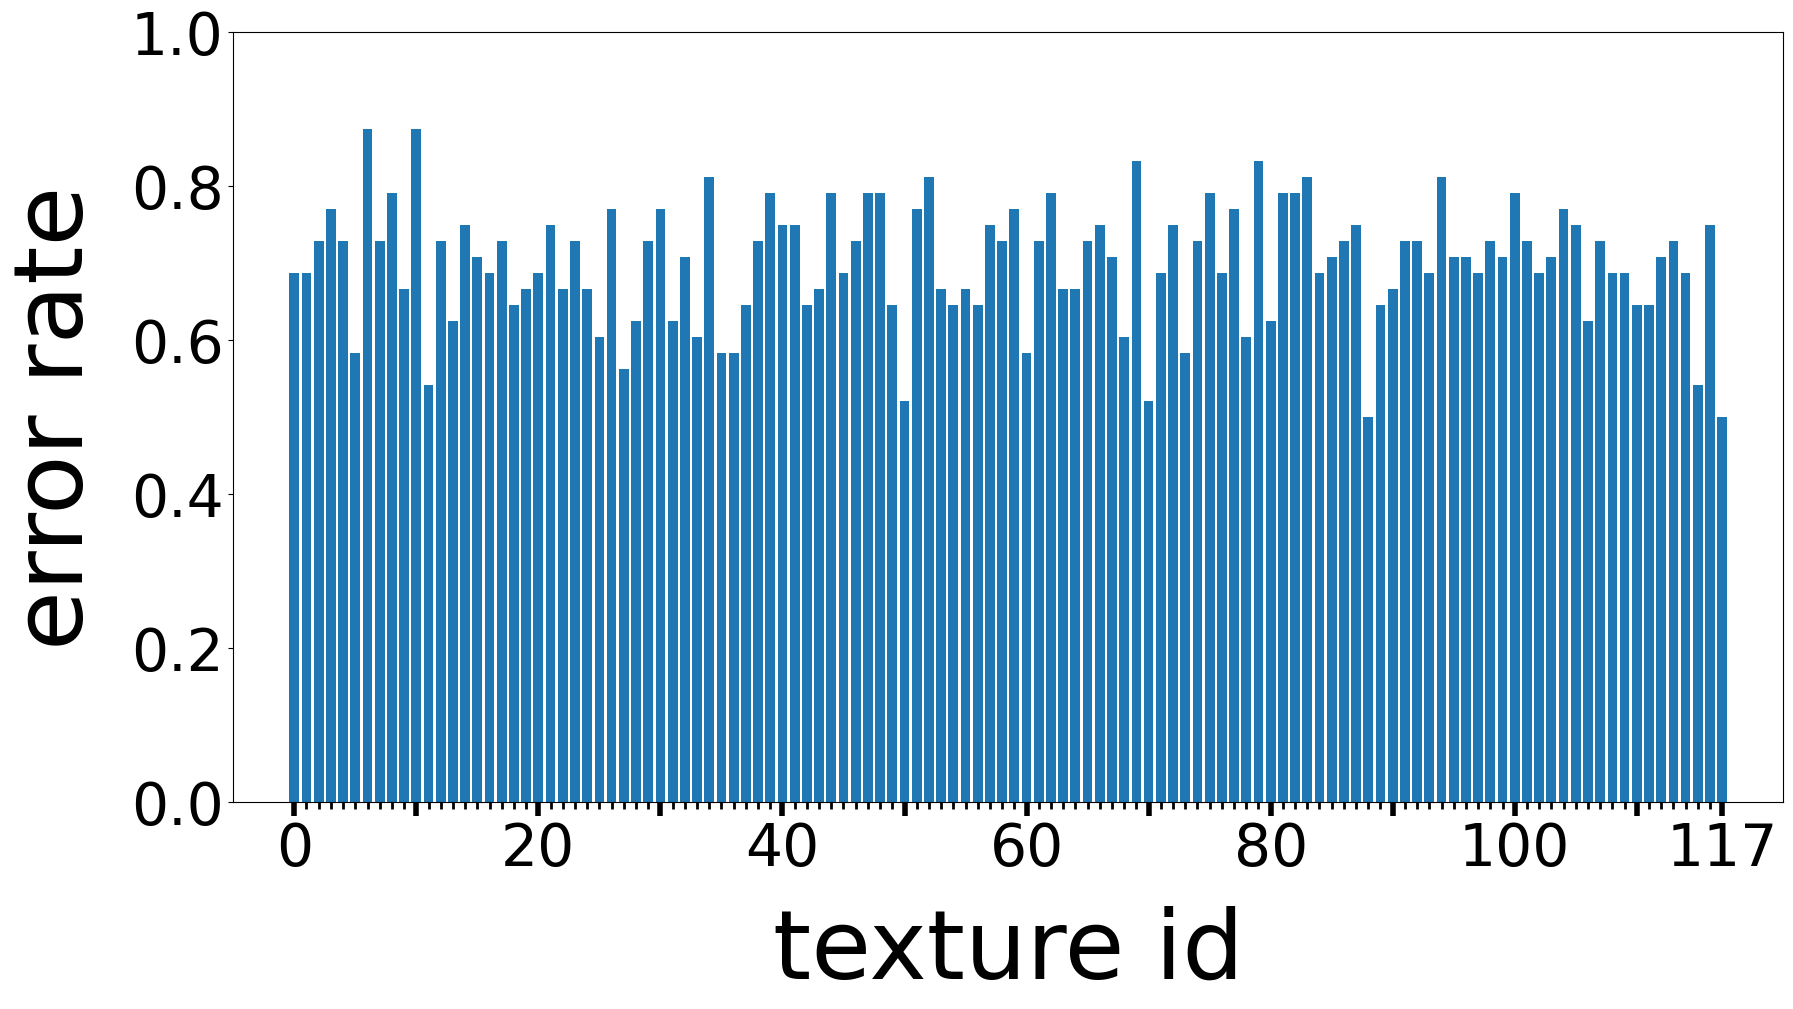
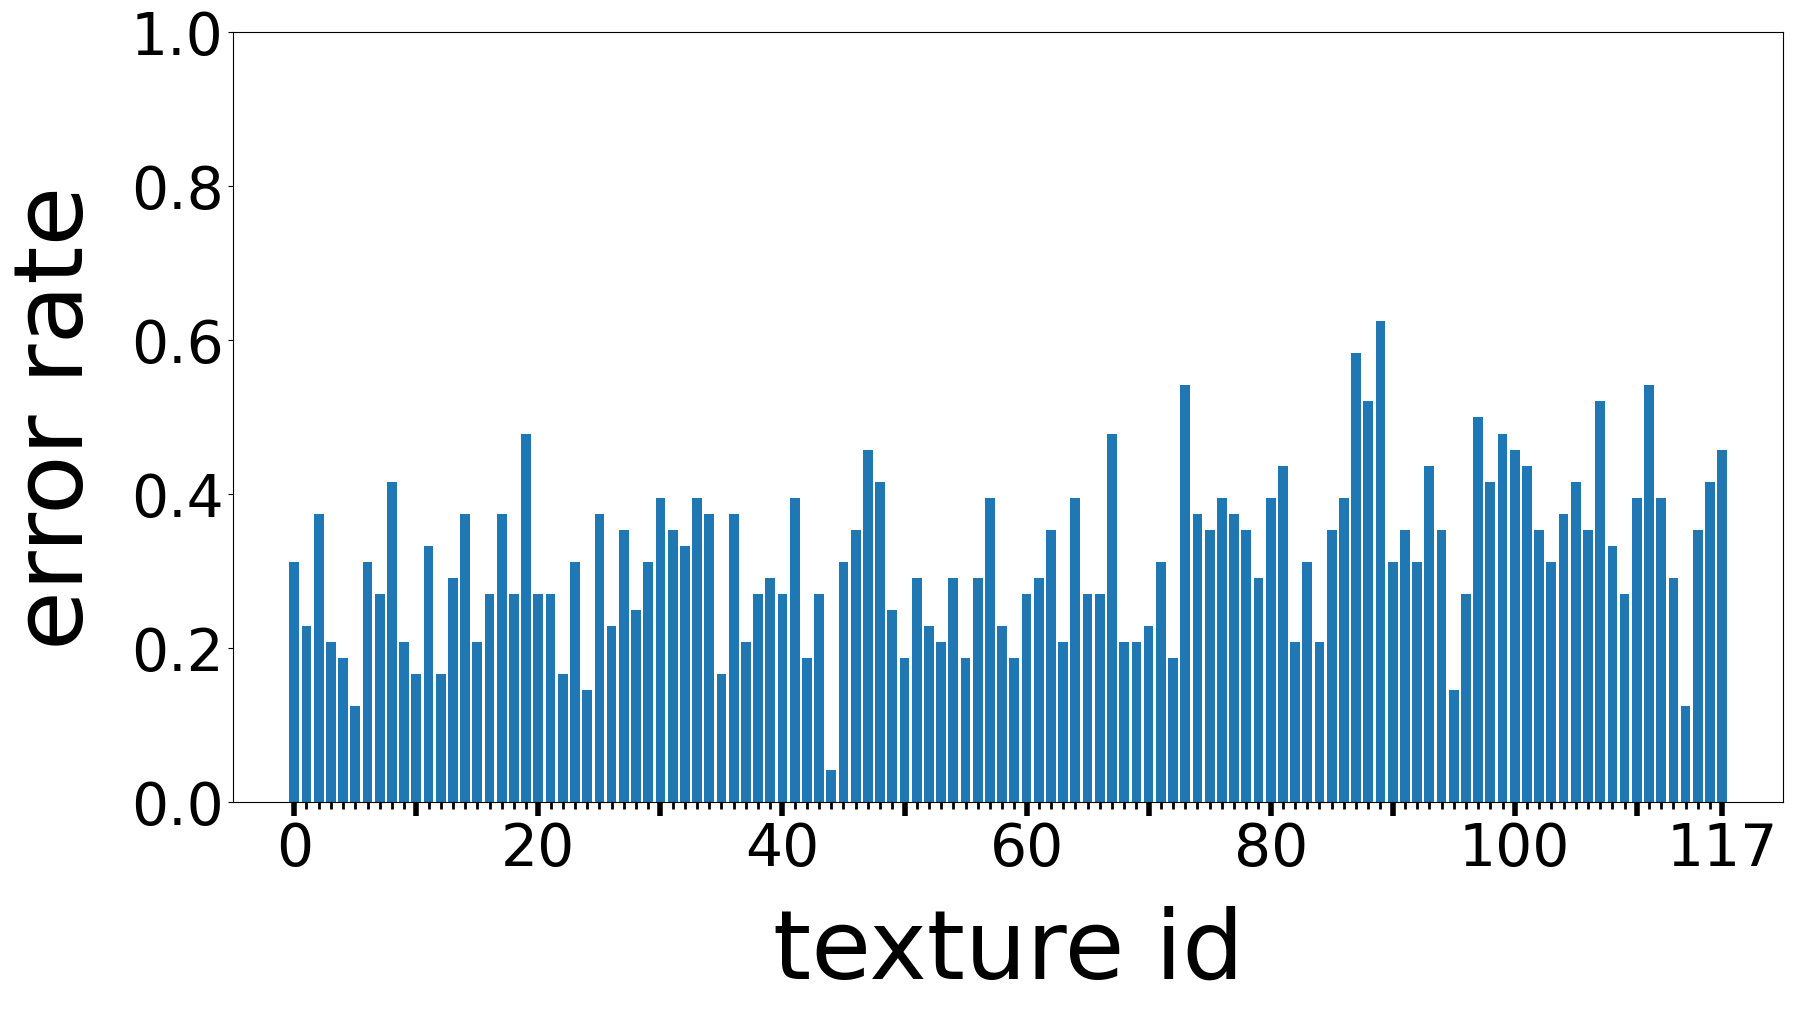
The classification accuracies of direction labels by texture for classifiers using audio signals, acceleration signals, and both audio and acceleration signals are shown in Fig. 8a-c, respectively. Compared to the speed label classification in Experiment II, the error rate tended to be higher for all classifiers using any data in the direction label classification. The classifier with the lowest average error rate was the one that used both audio and acceleration signals, with an average error rate of 32.01 %, meaning that the direction labels were classified with 67.99 % accuracy. The classification accuracy using the acceleration signal was not good, similar to the results of Experiment II.
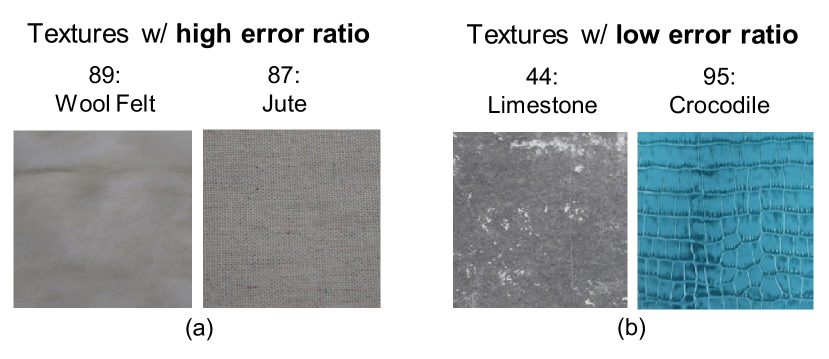
The materials were also examined separately to discuss the physical properties of the results in terms of direction classification accuracy. A list of texture material types with high and low error rates and their error rates for classifiers using both audio and acceleration signals is shown in Table V. From Table V, it can be seen that the textures with the highest error rates were wool felt and jute, but these textures did not have any surface irregularities, or if they did, they were regular. Therefore, it can be concluded that these textures do not have a directional dependence on the tracing and that the same sensor signal is obtained regardless of the direction in which the tracing slides. On the other hand, materials with low error rates, such as limestone and crocodile leather, have irregular surface patterns and uneven textures. Therefore, these textures were highly direction-dependent for tracing, which may have increased the accuracy of direction label classification. Texture material images of wool felt and jute are shown in Fig. 9a, and texture material images of limestone and alligator skin are shown in Fig. 9b.
| Texture w/ high error rate | Texture w/ low error rate | ||
|---|---|---|---|
| ID: Name | error rate | ID: Name | error rate |
| 89: Wool felt | 62.50 | 44: Limestone | 4.17 |
| 87: Jute | 58.33 | 95: Crocodile leather | 12.50 |
| 73: Steel wool | 54.17 | 5: Ash | 12.50 |
| 111: Mesh | 54.17 | 24: Mahogany | 14.58 |
| 88: Cotton | 52.08 | 114: Polyester | 18.75 |
IV Discussion
IV-A Relation between physical properties and error rate in velocity and direction classification
When we discussed the accuracy of velocity and direction classification, we considered the physical properties of textures. However, for some materials, it was difficult to explain their classification accuracy results in terms of the physical properties of the texture. For example, aluminum, with its smooth metal-derived surface, seems to be able to classify velocity labels with high accuracy, but in fact, the error rate in velocity classification was high. On the other hand, polyester, with its smooth surface and lack of patterns, might be expected to have low accuracy in classifying direction labels, but in reality, it had a low error rate in direction classification and was able to classify direction labels with high accuracy. Such exceptions highlight the complexity of the relationship between texture properties and classification accuracy. However, it could be possible to search for this cause by analyzing the time-series information of the signals measured on these texture materials and also by identifying features that are different from the physical properties of the textures.
IV-B Multimodal learning and classification with the addition of visual image information
We have shown that multimodal learning with audio and acceleration signals in texture classification in Experiment I improves classification accuracy over classifiers trained on submodality alone. On the other hand, we also record visual image information for each texture material. Since this image information is a two-dimensional array, it can be added to the multimodal training, especially for CNN-based classifiers. By using the visual image information, it is possible to construct a classifier that uses all modalities (visual, auditory, and haptic), which can further improve the accuracy of texture classification. However, since image information is not time-series data, simply combining it with audio or acceleration signals may not provide an optimal learning strategy.
IV-C Using load values measured by force sensor
We use a force sensor attached to the artificial fingertips to measure the loads applied to the fingertip, but we do not use this load information to train the classifiers in our experiments. This is because, in principle, our measuring device acquires data by sliding the textured materials at a height where a constant load of 1 N is applied, and we concluded that the influence of load variations contributing to classification accuracy is small. However, for materials that are uneven or have a high coefficient of friction, the load applied to the artificial fingertip may vary more than expected, and the appropriate use of this load measurement data may allow for a more complete analysis of the contact state.
V Conclusion
We introduced the Cluster Haptic Texture Database, a multimodal dataset that captures visual, auditory, and tactile signals from a soft artificial fingertip sliding over various materials. The dataset contains 118 texture classes and records the position of the artificial finger, the applied load, the sound generated by the contact, and the acceleration signal at the fingertip. It also has five variations in velocity and eight variations in direction. We compared the accuracy of classifiers trained on audio signals, acceleration signals, and multimodal information from audio and acceleration signals to explore the features of the proposed dataset. The results showed that the CNN-based classifier achieved the best performance regardless of the type of data used for training, and multimodal learning of audio and acceleration signals had a positive impact on classification accuracy. In addition, we compared the accuracy of velocity or direction classification for different texture materials and discussed the characteristics of surfaces with poor velocity or direction estimation. With a few exceptions, the results suggest that the physical properties of the texture material can well explain the high and low accuracy of velocity and direction classification.
A future effort would be to construct a system that generates tactile vibration information from visual texture images by training on this tactile texture dataset. Such a system has been proposed in the past [29, 30], but by learning on a velocity and direction-dependent dataset, it may be possible to generate data that more closely resembles the tactile vibration of real textures. In addition, our dataset could be used to realize texture representation that takes advantage of the velocity and direction information in a tactile display system [31, 32, 33], where the velocity and direction of the user’s fingertip sliding can be obtained. This can directly contribute to improving the reality of texture representation in tactile display systems.
References
- [1] S. J. Lederman and R. L. Klatzky, “Haptic perception: A tutorial,” Attention, Perception & Psychophysics, vol. 71, no. 7, pp. 1439–1459, Oct. 2009.
- [2] A. El Saddik, “The potential of haptics technologies,” IEEE Instrumentation & Measurement Magazine, vol. 10, no. 1, pp. 10–17, Feb. 2007.
- [3] R. Picard, C. Graczyk, S. Mann, J. Wachman, L. Picard, and L. Campbell, “VisTex: Vision texture database,” 1995.
- [4] J. Deng, W. Dong, R. Socher, L.-J. Li, K. Li, and L. Fei-Fei, “Imagenet: A large-scale hierarchical image database,” in Proceedings of 2009 IEEE Conference on Computer Vision and Pattern Recognition (CVPR), 2009, pp. 248–255.
- [5] H. Culbertson, J. Unwin, B. E. Goodman, and K. J. Kuchenbecker, “Generating haptic texture models from unconstrained tool-surface interactions,” in Proceedings of 2013 World Haptics Conference (WHC), Apr. 2013, pp. 295–300.
- [6] H. Culbertson, J. J. Lopez Delgado, and K. J. Kuchenbecker, “One hundred data-driven haptic texture models and open-source methods for rendering on 3D objects,” in Proceedings of 2014 IEEE Haptics Symposium (HAPTICS), Feb. 2014, pp. 319–325.
- [7] M. Strese, J.-Y. Lee, C. Schuwerk, Q. Han, H.-G. Kim, and E. Steinbach, “A haptic texture database for tool-mediated texture recognition and classification,” in Proceedings of 2014 IEEE International Symposium on Haptic, Audio and Visual Environments and Games (HAVE), Oct. 2014, pp. 118–123.
- [8] H. Zheng, L. Fang, M. Ji, M. Strese, Y. Ozer, and E. Steinbach, “Deep learning for surface material classification using haptic and visual information,” IEEE Transactions on Multimedia, vol. 18, no. 12, pp. 2407–2416, Dec. 2016.
- [9] M. Strese, Y. Boeck, and E. Steinbach, “Content-based surface material retrieval,” in Proceedings of 2017 IEEE World Haptics Conference (WHC), Jun. 2017, pp. 352–357.
- [10] A. Burka, S. Hu, S. Helgeson, S. Krishnan, Y. Gao, L. A. Hendricks, T. Darrell, and K. J. Kuchenbecker, “Proton: A visuo-haptic data acquisition system for robotic learning of surface properties,” in Proceedings of 2016 IEEE International Conference on Multisensor Fusion and Integration for Intelligent Systems (MFI), 2016, pp. 58–65.
- [11] T. Yoshioka, S. J. Bensmaïa, J. C. Craig, and S. S. Hsiao, “Texture perception through direct and indirect touch: an analysis of perceptual space for tactile textures in two modes of exploration,” Somatosensory & Motor Research, vol. 24, no. 1-2, pp. 53–70, 2007.
- [12] R. L. Klatzky and S. J. Lederman, “Tactile roughness perception with a rigid link interposed between skin and surface,” Perception & Psychophysics, vol. 61, no. 4, pp. 591–607, May 1999.
- [13] M. Wiertlewski, C. Hudin, and V. Hayward, “On the 1/f noise and non-integer harmonic decay of the interaction of a finger sliding on flat and sinusoidal surfaces,” in Proceedings of 2011 IEEE World Haptics Conference (WHC), Jun. 2011, pp. 25–30.
- [14] J. Platkiewicz, A. Mansutti, M. Bordegoni, and V. Hayward, “Recording device for natural haptic textures felt with the bare fingertip,” in Haptics: Neuroscience, Devices, Modeling, and Applications (Proceedings of 2014 EuroHaptics Conference). Springer, 2014, pp. 521–528.
- [15] Y. Tanaka, Y. Horita, and A. Sano, “Finger-Mounted skin vibration sensor for active touch,” in Haptics: Perception, Devices, Mobility, and Communication (Proceedings of 2012 EuroHaptics Conference). Springer, 2012, pp. 169–174.
- [16] L. P. Kirsch, X. E. Job, M. Auvray, and V. Hayward, “Harnessing tactile waves to measure skin-to-skin interactions,” Behavior Research Methods, vol. 53, no. 4, pp. 1469–1477, Aug. 2021.
- [17] J. Jiao, Y. Zhang, D. Wang, X. Guo, and X. Sun, “HapTex: A database of fabric textures for surface tactile display,” in Proceedings of 2019 IEEE World Haptics Conference (WHC), 2019, pp. 331–336.
- [18] A. Devillard, A. Ramasamy, D. Faux, V. Hayward, and E. Burdet, “Concurrent haptic, audio, and visual data set during bare finger interaction with textured surfaces,” in Proceedings of 2023 IEEE World Haptics Conference (WHC), 2023, pp. 101–106.
- [19] K. Kuramitsu, T. Nomura, S. Nomura, T. Maeno, and Y. Nonomura, “Friction evaluation system with a human finger model,” Chemistry Letters, vol. 42, no. 3, pp. 284–285, Mar. 2013.
- [20] M. Kouchi, N. Miyata, and M. Mochimaru, “An analysis of hand measurements for obtaining representative japanese hand models,” in SAE Technical Paper, no. 2005-01-2734, Jun. 2005, pp. 1–7.
- [21] Artificial Intelligence Research Center, AIST, “AIST japanese hand dimension data,” https://www.airc.aist.go.jp/dhrt/hand/data/list.html, accessed: 2023-9-25.
- [22] M. Strese, L. Brudermueller, J. Kirsch, and E. Steinbach, “Haptic material analysis and classification inspired by human exploratory procedures,” IEEE Transactions on Haptics, vol. 13, no. 2, pp. 404–424, 2020.
- [23] A. Isleyen, Y. Vardar, and C. Basdogan, “Tactile roughness perception of virtual gratings by electrovibration,” IEEE Transactions on Haptics, vol. 13, no. 3, pp. 562–570, 2020.
- [24] Y. Vardar, A. Isleyen, M. K. Saleem, and C. Basdogan, “Roughness perception of virtual textures displayed by electrovibration on touch screens,” in Proceedings of 2017 IEEE World Haptics Conference (WHC), Jun. 2017, pp. 263–268.
- [25] D. J. Meyer, M. Wiertlewski, M. A. Peshkin, and J. E. Colgate, “Dynamics of ultrasonic and electrostatic friction modulation for rendering texture on haptic surfaces,” in Proceedings of 2014 IEEE Haptics Symposium (HAPTICS), Feb. 2014, pp. 63–67.
- [26] B. Vimal, M. Surya, Darshan, V. S. Sridhar, and A. Ashok, “MFCC based audio classification using machine learning,” in Proceedings of 12th International Conference on Computing Communication and Networking Technologies (ICCCNT). IEEE, Jul. 2021, pp. 1–4.
- [27] F. Rong, “Audio classification method based on machine learning,” in Proceedings of 2016 International Conference on Intelligent Transportation, Big Data & Smart City (ICITBS), Dec. 2016, pp. 81–84.
- [28] K. He, X. Zhang, S. Ren, and J. Sun, “Deep residual learning for image recognition,” in Proceedings of the 2015 IEEE Conference on Computer Vision and Pattern Recognition (CVPR), Dec. 2015, pp. 770–778.
- [29] S. Cai, L. Zhao, Y. Ban, T. Narumi, Y. Liu, and K. Zhu, “GAN-based image-to-friction generation for tactile simulation of fabric material,” Computers & Graphics, vol. 102, pp. 460–473, Feb. 2022.
- [30] R. Song, X. Sun, and G. Liu, “Cross-Modal generation of tactile friction coefficient from audio and visual measurements by transformer,” IEEE Transactions on Instrumentation and Measurement, 2023.
- [31] O. Bau, I. Poupyrev, A. Israr, and C. Harrison, “TeslaTouch: electrovibration for touch surfaces,” in Proceedings of the 23rd Annual ACM Symposium on User Interface Software and Technology (UIST), Oct. 2010, pp. 283–292.
- [32] Y. Miyatake, T. Hiraki, D. Iwai, and K. Sato, “HaptoMapping: Visuo-haptic augmented reality by embedding user-imperceptible tactile display control signals in a projected image,” IEEE Transactions on Visualization and Computer Graphics, vol. 29, no. 4, pp. 2005–2019, Apr. 2023.
- [33] M. Ito, R. Sakuma, H. Ishizuka, and T. Hiraki, “AirHaptics: Vibrotactile presentation method using an airflow from audio speakers of smart devices,” in Proceedings of the 28th ACM Symposium on Virtual Reality Software and Technology (VRST), no. Article 39, Nov. 2022, pp. 1–2.