cor2 \fntext[cor2]Corresponding author \cortext[cor1]These two authors equally contributed to this work
label0]organization=Univ. of Bordeaux, CNRS, Institut de Mathématiques de Bordeaux, IMB, UMR5251, addressline=351 cours de la Libération, city=Talence, postcode=F-33400, country=France
label1]organization=INRIA Bordeaux, MONC team, addressline=200 avenue de la Vieille Tour, city=Talence, postcode=F-33400 , country=France
Conceptualization, Methodology, Software, Validation, Writing - Original Draft
Resources, Data curation
label2]organization=Univ. Bordeaux, INSERM, Bordeaux Institute in Oncology, BRIC, U1312, MIRCADE team,addressline=146 rue Léo Saignat, city=Bordeaux, postcode=33000, country=France
label3]organization=Univ. Bordeaux, CNRS, INSERM, Bordeaux Imaging Centre, BIC, UAR 3420, US 4,addressline=146 rue Léo Saignat, city=Bordeaux, postcode=33000, country=France
Software
Resources, Supervision
Supervision, Project administration, Funding acquisition
Supervision, Project administration, Funding acquisition, Writing - Review
Supervision, Project administration, Funding acquisition, Writing - Review & Editing
Enhancing Cell Instance Segmentation in Scanning Electron Microscopy Images via a Deep Contour Closing Operator
Abstract
Accurately segmenting and individualizing cells in scanning electron microscopy (SEM) images is a highly promising technique for elucidating tissue architecture in oncology. While current artificial intelligence (AI)-based methods are effective, errors persist, necessitating time-consuming manual corrections, particularly in areas where the quality of cell contours in the image is poor and requires gap filling.
This study presents a novel AI-driven approach for refining cell boundary delineation to improve instance-based cell segmentation in SEM images, also reducing the necessity for residual manual correction. A Convolutional Neural Network (CNN) Closing Operator (COp-Net) is introduced to address gaps in cell contours, effectively filling in regions with deficient or absent information. The network takes as input cell contour probability maps with potentially inadequate or missing information and outputs corrected cell contour delineations. The lack of training data was addressed by generating low integrity probability maps using a tailored partial differential equation (PDE), for which we publicly provide the source code.
We showcase the efficacy of our approach in augmenting cell boundary precision using both private SEM images from patient-derived xenograft (PDX) hepatoblastoma tissues and publicly accessible images datasets. The proposed cell contour closing operator exhibits a notable improvement in tested datasets, achieving respectively close to (private data) and (public data) increase in the accurately-delineated cell proportion compared to state-of-the-art methods. Additionally, the need for manual corrections was significantly reduced, therefore facilitating the overall digitalization process.
Our results demonstrate a notable enhancement in the accuracy of cell instance segmentation, particularly in highly challenging regions where image quality compromises the integrity of cell boundaries, necessitating gap filling. Therefore, our work should ultimately facilitate the study of tumour tissue bioarchitecture in onconanotomy field.
keywords:
Segmentation \sepinstance \sepcell \sepscanning electron microscopy \sepdeep neural networkAI-driven methods allow refining cell delineation in SEM images
A deep cell contour closing operator is proposed
CNN are suitable to fill cell contours in regions with deficient/absent information
Low integrity in cell boundaries can be simulated using partial differential equation
Cell instance segmentation is enhanced in private and public datasets
1 Introduction
In recent years, there has been a growing interest in studying tissue architecture, particularly in the field of oncology, where a deeper understanding of intracellular and intercellular ultrastructure could lead to major advancements in tumour therapy (Johnson et al., 2022; Han et al., 2023; Machireddy et al., 2023a, b). \AcfSEM has become a crucial imaging technique for providing nanometer-resolution views of the ultrastructure of whole cells and tissues (Denk and Horstmann, 2004; Riesterer et al., 2019). This technology enables the visualization of organelles such as nuclei, mitochondria, nucleoli, and lipid droplets and so on, but also the study of the organization of cells into the tissue, an essential step for understanding tumour tissue development mechanisms and drug resistance. Therefore, the analysis of bioarchitectural parameters within and among tumour cells holds great promise in onconanotomy field, paving the way for a better understanding of tumour tissue 3D organization (Senneville et al., 2021).
To this end, an instance segmentation of SEM images is mandatory, which involves identifying and separating individual structures, including detecting the boundaries of each structure and assigning a unique label to each. Each organelle or cellular component possesses distinct characteristics, including number, size, shape, texture, or grey level in images. Consequently, their individual segmentations present diverse methodological challenges (Senneville et al., 2021). Manual segmentation is laborious, necessitating automated methods to comprehend the functioning of a heterogeneous lesion in its entirety. Therefore, several studies focused on the development of algorithms for segmenting organelles within cells (Machireddy et al., 2023a; Wei et al., 2020). However, cell segmentation and labelling constitute crucial data for collecting cell population statistics. To accomplish this, numerous studies have relied on manually segmenting a subset of cells for inter-cell comparison (Johnson et al., 2022). However, in particular and unlike organoids, tumour tissue is subject to a great deal of pressure, which means that cells are often tightly packed together. In addition, depending on the tissue fixation method and microscope parameters used, cell membranes are more or less visible. Therefore, enhancing computer-aided instance segmentation of closely spaced cells presents a significant challenge addressed within this paper.
Recently, artificial intelligence (AI) has proven to be an extremely powerful tool for facilitating segmentation (Karabag et al., 2020; Liu et al., 2021). Among the significant advances, the U-Net architecture introduced by Ronneberger et al. (2015) has attracted a great deal of interest, particularly in image segmentation. A notable enhancement to U-Net is the use of weight maps in the loss function to more accurately account for cell boundary details, helping to improve segmentation accuracy. Guerrero-Peña et al. (2018) introduced two innovative weight maps integrated into the weighted cross-entropy loss function, which consider the geometric characteristics of cell contours. The shape-aware map assigns substantial weights to narrow and concave areas, leading to superior instance segmentation outcomes. Additionally, by incorporating a third class representing touching borders, they improved the discriminative capability of the network. Alternative methods utilize a combination of techniques, integrating deep learning, optical flow, and cross-slice linking, to extrapolate segmentations or manual corrections beyond the original plane (Senneville et al., 2021; Machireddy et al., 2023b; Wen et al., 2023). More recently, Isensee et al. (2021) presented a self-configuring method for biological and medical images segmentation named nnU-Net. This deep learning open-source algorithm automatically configures itself, including preprocessing, data augmentation, network architecture, training and post-processing for any new task and surpasses most existing approaches on many public datasets with various dimensions. Additionally, Isensee et al. (2024) have reaffirmed the continued prominence of Convolutional Neural Network (CNN) and nnU-Net as the leading techniques in medical segmentation. For the specific case of cell instance segmentation, Wang et al. (2022) proposed a method which is conducted using a super voxel-based clustering algorithm. Moreover, they provided an overview of the existing deep learning model for 2D and 3D cell segmentation and lists their major drawbacks. Recently, a general-purpose algorithm called Cellpose has been developed and continuously updated to achieve instance cell segmentation across various microscopy modalities and fluorescent markers (Stringer et al., 2021; Pachitariu and Stringer, 2022; Stringer and Pachitariu, 2024). The authors proposed a vector flow representation that can be predicted by a neural network. Then, by running a gradient ascent procedure for all pixels in an image and checking which pixels converged to the same fixed point, they can assign different label to each cell.
While the aforementioned end-to-end methods show strong efficiency in segmenting cells and assigning a unique label to each, a challenge inherently persist in practice in areas where cell contours are not straightforward, even for a biological expert. In practice, addressing these issues involve filling gaps manually in cell contour segmentation. Gap filling in contour objects can be assessed using the developments performed in the field of mathematical morphology since the 1970s. This task can be typically achieved through a closing operation, which involves dilation followed by erosion (Serra, 2011). This approach is effective when the structures are relatively simple and sparse. However, it falls short when the gaps are elongated, large, and numerous, as it tends to excessively alter the overall structure. Filling gaps in object contour segmentation can be seen as an inpainting problem necessitating prior localization knowledge of regions to be corrected. Many works use diffusion partial differential equation (PDE) to solve this problem such as heat equation (Qin et al., 2012) and Cahn-Hilliard equation (Bertozzi et al., 2007b, a; Bosch and Stoll, 2015). Moreover, Schönlieb (2023) also provides three inpainting codes using heat equation, Total Variation (TV) inpainting and TV-H-1 inpainting. All of these models are commonly used to restore damaged images as fingerprint image or gray scale photography with little inpainting area. However, they require the missing regions as input, which is a real drawback in applications where there are numerous such regions. Nowadays, the most effective methodologies rely on CNN capable of autonomously detecting absent line segments and accurately reinstating them with appropriate thickness and curvature, even within images exhibiting numerous omissions (Sasaki et al., 2017; Chen et al., 2018, 2019).
To enhance the aforementioned techniques for cell instance segmentation, our approach focuses on delineating cell boundaries, and our contributions are threefold:
-
1.
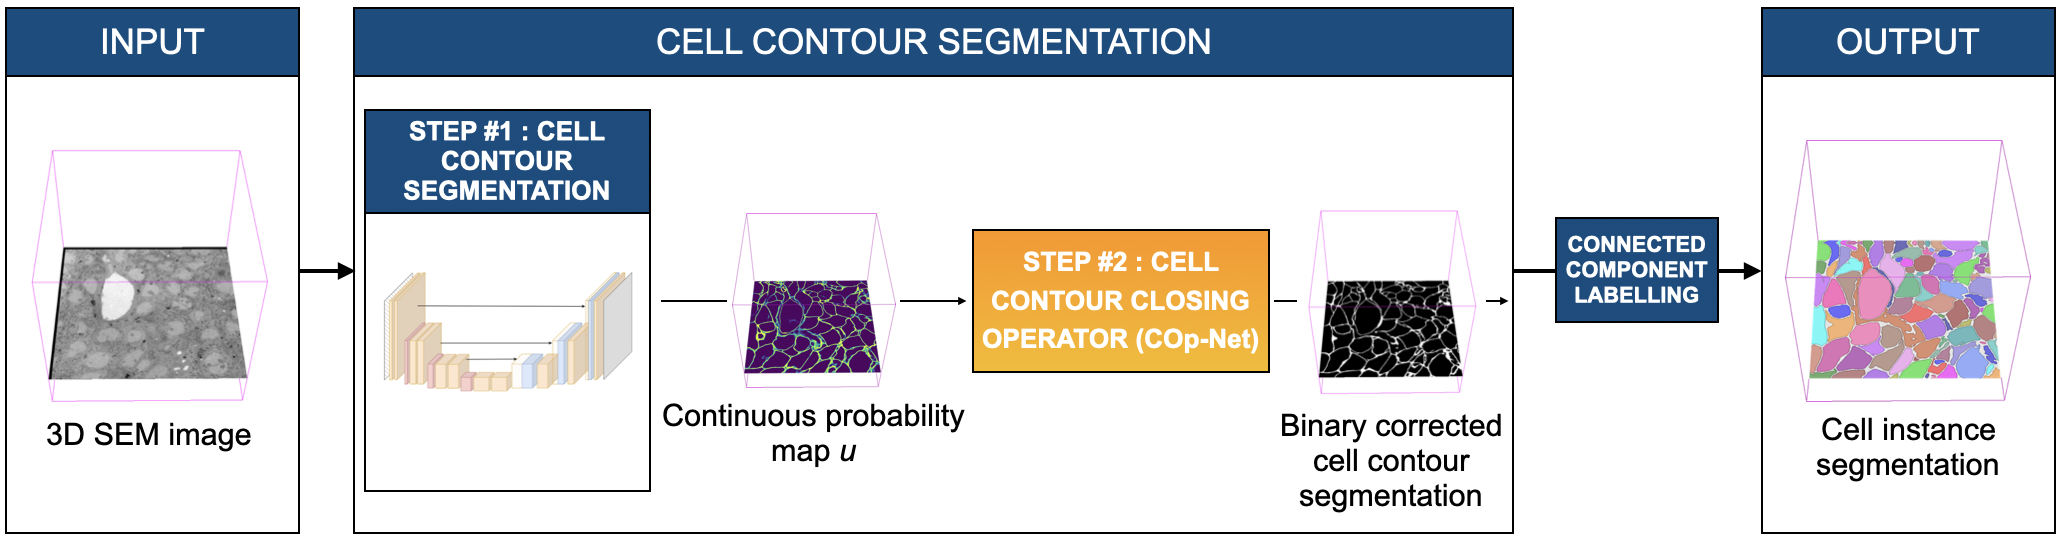
An AI-driven cell contour Closing Operator (COp-Net) is proposed: a dedicated CNN-based closing network, embedded in an iterative scheme, is introduced to detect and fill specific gaps, as summarized in Figure 1.
-
2.
A novel data simulation approach is proposed to simulate local areas with inadequate or missing information using a fully dedicated PDE during training, for which we publicly provide the code online for reproducibility purpose.
-
3.
The proposed approach is assessed for cell instance segmentation using both private high-quality SEM images from patient-derived xenograft (PDX) tumour tissues and publicly available datasets.
The remainder of the paper is structured as follows: Section 2 presents the complete cell instance segmentation pipeline, detailing each component. Section 3 analyses the performance on private and public validation datasets, showcasing stability in corrections and a significant increase in the proportion of correctly identified cells. Finally, Section 4 discusses the presented results, evaluates the usefulness of each component, and suggests future avenues for exploration.
2 Material and methods
Our approach for cell instance segmentation relies on the delineation of cell boundaries, which consists of two steps summarized in Figure 1. First, a voxelwise cell contour probability map is generated from a 3D SEM image (Step #1/section 2.1). A CNN Closing Operator (COp-Net) is subsequently applied to address gaps in cell contours (Step #2/section 2.2). Ultimately, a connected component algorithm is applied to generate the cell instance segmentation.
Note that, our implementation heavily rely on the utilization of the open-source nnU-Net algorithm for both steps due to its self-configuring capabilities, its robust data augmentation, versatile 2D and 3D architectures and performance which align with the standards of leading techniques in medical image segmentation (Isensee et al., 2024).
2.1 Generation of cell contour probability maps (Step #1)
The nnU-Net algorithm (Isensee et al., 2021) was trained in a supervised end-to-end manner on ground truth cell contours to produce cell contour probability maps. Note that either a 2D or 3D architecture was employed depending on the slice thickness of the training dataset. This information is provided for each dataset used for training in section 2.3. Additionally, the original implementation of nnU-Net allows saving probabilities by skipping the last activation layer. In the resulting maps (noted throughout the rest of the manuscript), each pixel (resp. voxel) value represents the probability of it being part of a cell contour.
2.2 Deep cell contour Closing Operator (COp-Net/Step #2)
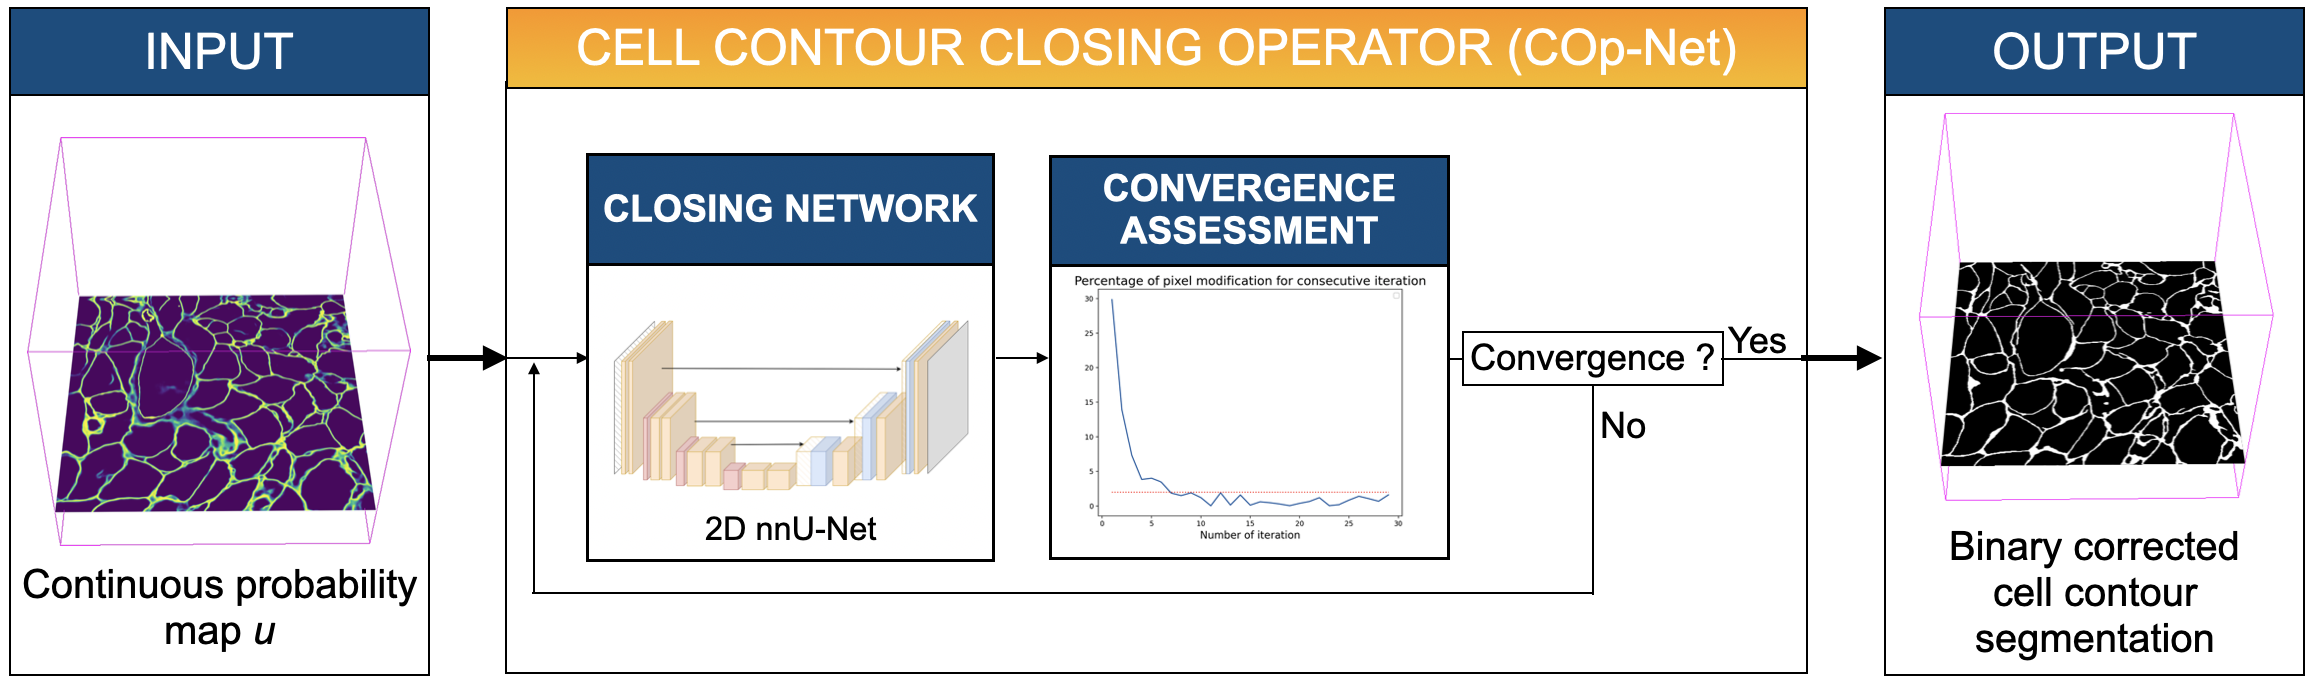
At this point, we have cell contour probability maps that contain locally inadequate or missing information. The proposed cell contour correction network, COp-Net, is then applied to automatically rectify these maps (see Figure 2). We employed a 2D convolutional neural network (CNN) architecture to enable a direct comparison with state-of-the-art cell instance segmentation techniques, which are trained in a 2D context (section 2.4.3 and section 2.4.4). Once trained, the COp-Net was applied on a slice-by-slice basis on . Once more, we exploited the nnU-Net algorithm (Isensee et al., 2021, 2024), utilizing its 2D architecture. The proposed closing operator is embedded in an iterative scheme with a dedicated convergence criterion. In the subsequent sections, we elaborate on each component of COp-Net.
2.2.1 Simulating training data using PDE
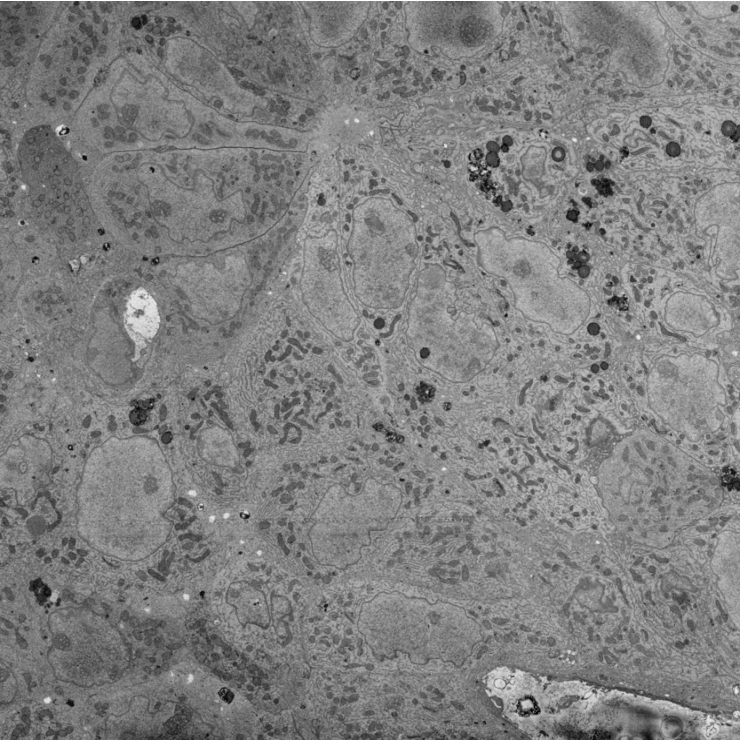
The closing network underwent supervised end-to-end training utilizing degraded ground truth cell contour segmentations as inputs to predict their corresponding correct versions. The inputs comprised 2D pixel-wise maps representing cell contour probabilities, incorporating locally partial or missing information generated from ground truth segmentations (see Fig. 3), which were intentionally perturbed using the following PDE:
| (1) |
being the image domain ( for the two dimensional case), the image boundary, the 2D pixel coordinates, is the vector normal to the image boundary at location , the ground truth cell contour segmentation used as an initial guess, the simulated probability of cell contour at location , and the scheme time. Eq. (1) was solved using the Crank-Nicolson time scheme and finite differences111Codes are publicly available at : https://xxxxxxxxxxxxxxxxxxxxxxxxxx (Crank and Nicolson, 1947). Neumann boundary conditions were applied ( constant along the normal border direction).
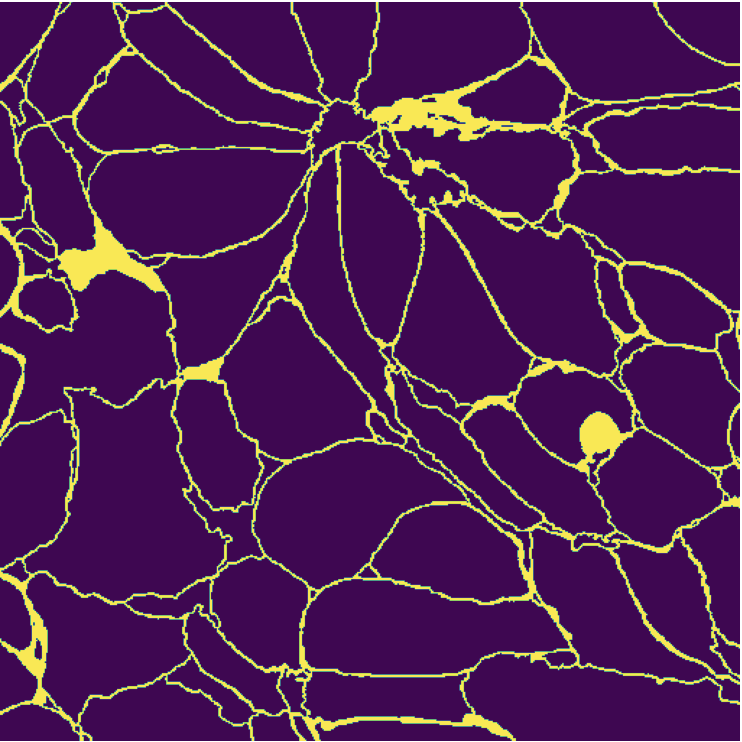
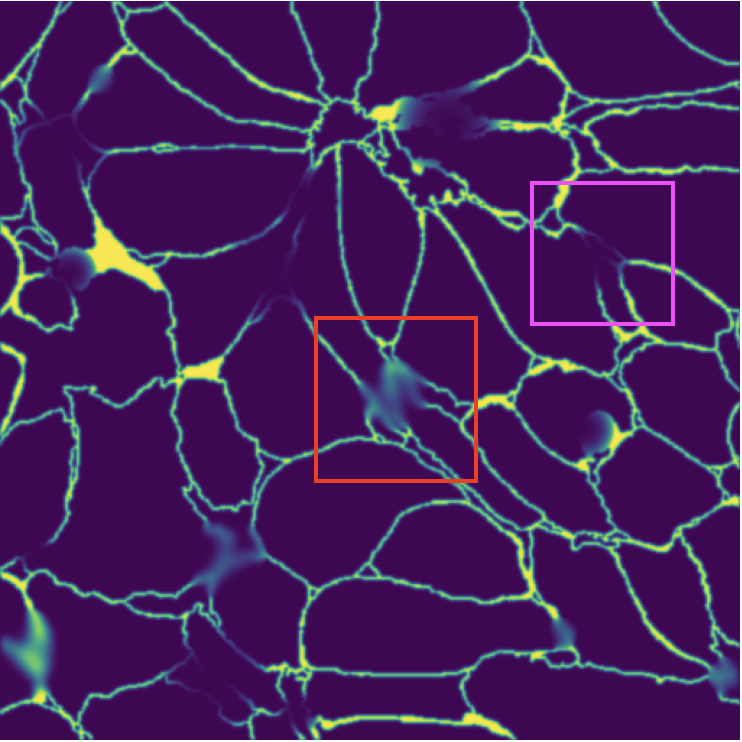
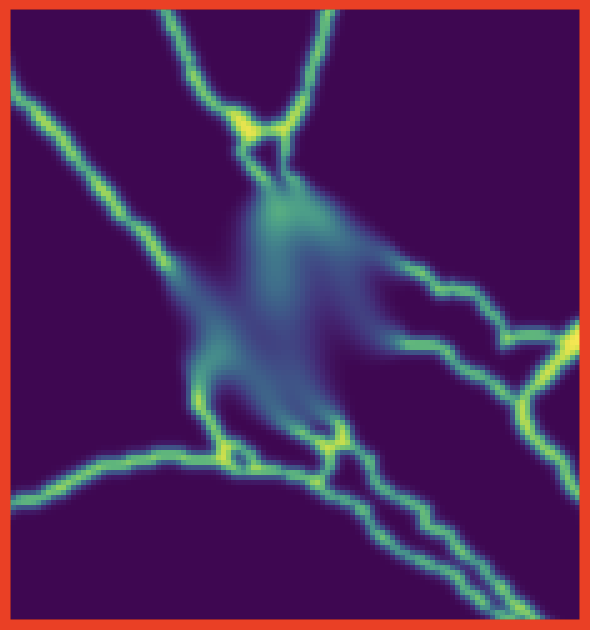
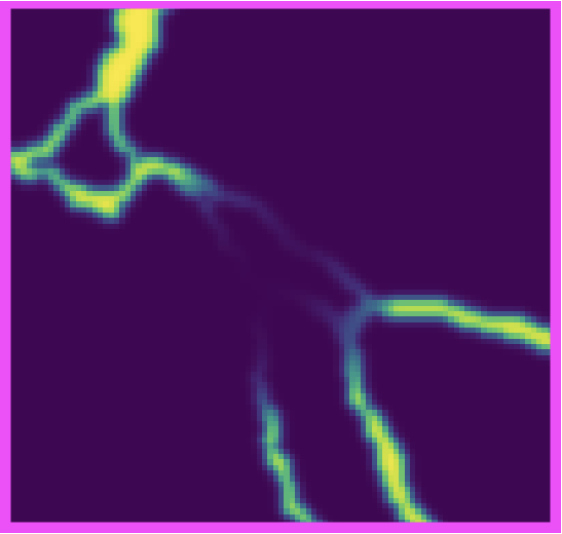
While the first contribution in the right part of Eq. (1) is tailored to simulate isotropically diffused cell contour probabilities (refer to Fig. 3c and 3d), the second contribution addresses local signal drop (refer to Fig. 3c and 3e). The first perturbation mechanism is determined by the pixelwise map (, and being pre-defined minimal and maximal diffusion values, respectively). The second perturbation is guided by the associated pixelwise perturbation map (). Both and maps were randomly generated, and their mathematical formulations are presented in Eq. (2):
| (2) |
and being the number of local diffusions and the number of local drops in the cell contour probability map, respectively. These local perturbations were applied within distinct circular regions (with radius , ) centered on randomly positioned pixels with coordinates . The radius were drawn randomly following a uniform distribution ( and representing pre-defined minimum and maximum radius values, respectively).
Note that the above method encompass six hyper-parameters , , , , , and for generating random local perturbations to the ground truth cell contour probability map. While some parameters were set empirically to typical values, the main ones were optimized through a grid search analysis, as detailed in section 2.4.2.
2.2.2 Iterative scheme
Once trained, the proposed closing network was applied iteratively until the percentage of modified pixels between two consecutive iterations fell below a threshold. In this way, the network detects and fills gaps incrementally as it iterates. A typical threshold value of was employed to terminate the iterative process.
2.3 Dataset
This section presents a comprehensive overview of the data obtained from a serial block face-SEM (SBF-SEM), used for training and validation purposes. The proposed approach for cell instance segmentation was assessed using both private high image quality SEM PDX tumour tissues and publicly available datasets.
2.3.1 Private PDX tumour tissue datasets
The private datasets, described in Figure 4, consist of image stacks acquired using SBF-SEM from two distinct PDX hepatoblastoma tissues: one tissue sample (referred to as T1 in the remainder of this manuscript) was designated for training purposes, while the other (referred to as T2) was reserved for external validation. For additional information about these PDX samples, the reader is referred to Senneville et al. (2021).
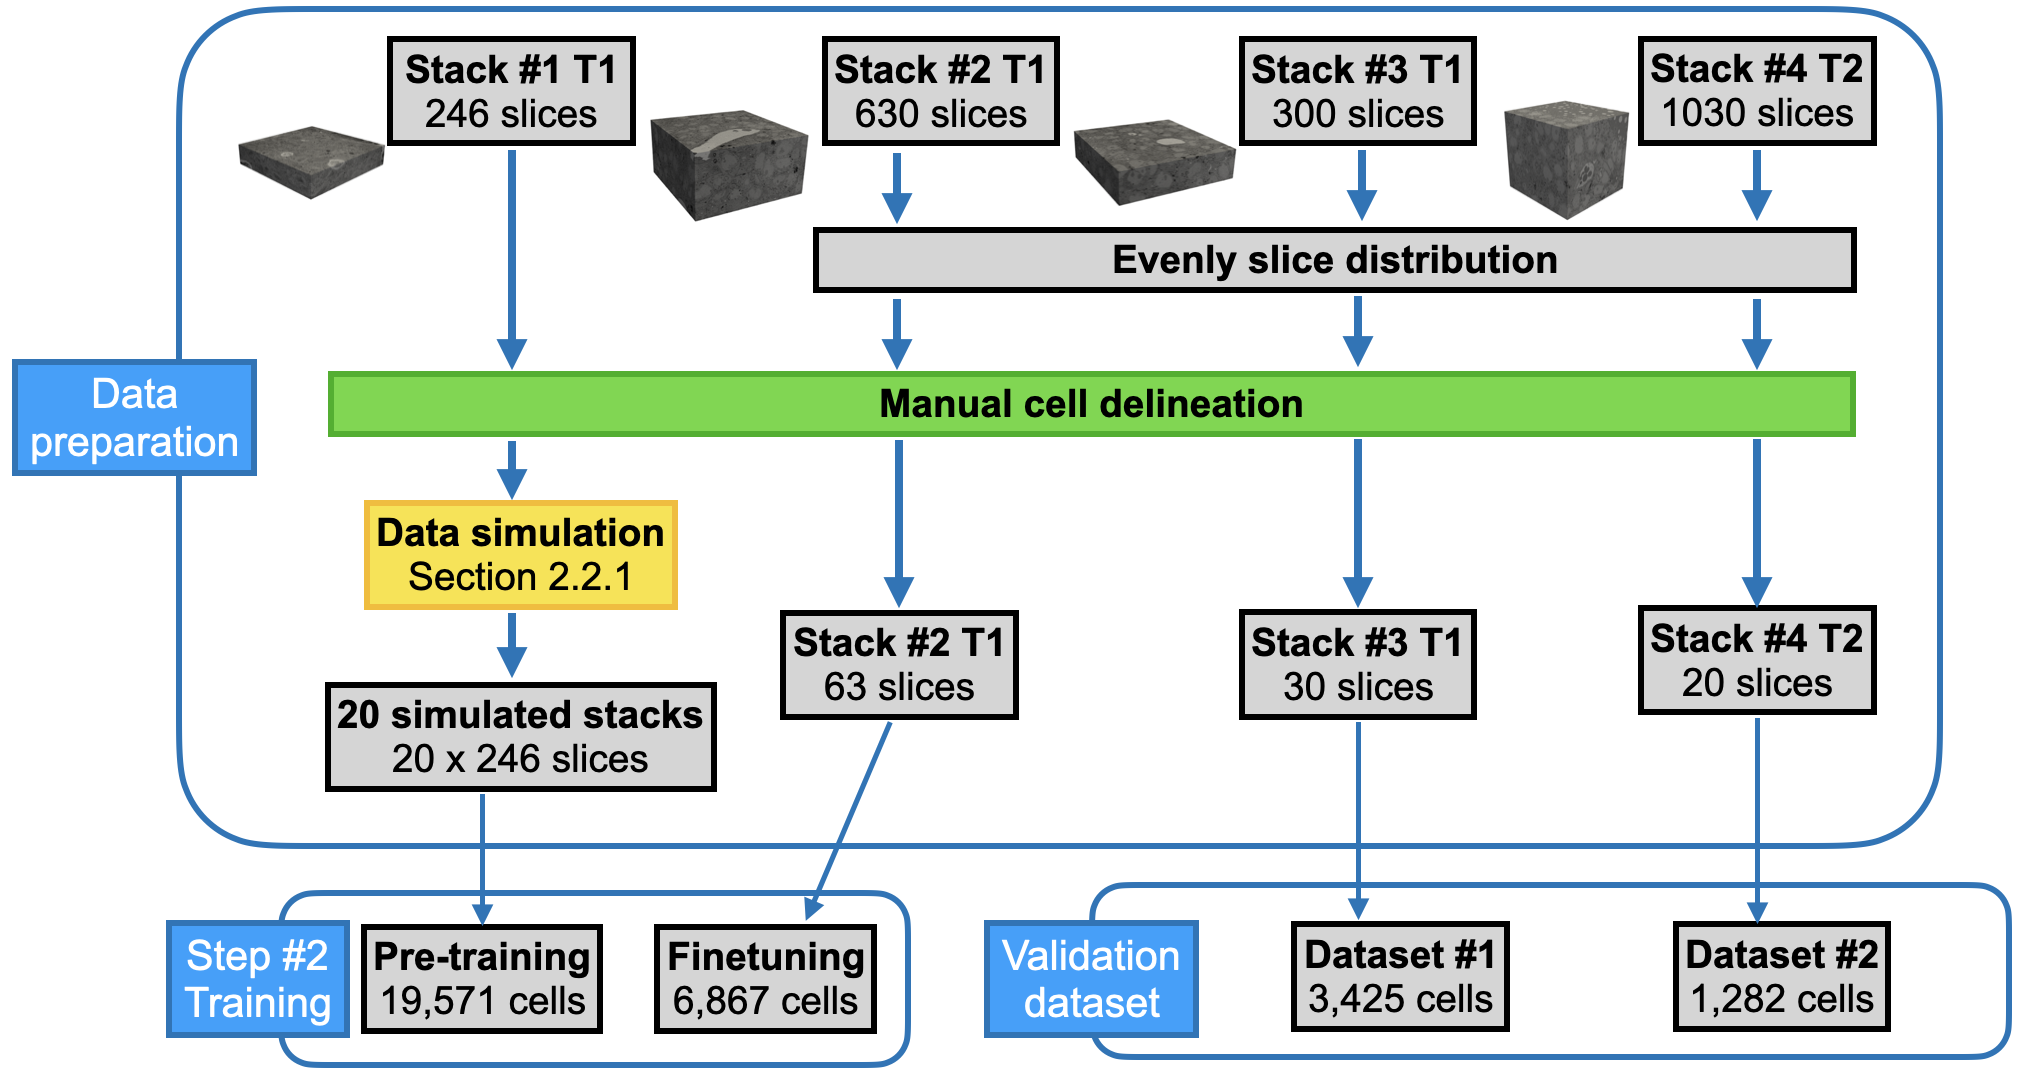
Image pre-processing
Intensity standardization was accomplished by individually applying z-scoring on a slice-by-slice basis. Subsequently, all images were resized to achieve a standardized in-plane dimension of pixels. Image alignment was completed within each stack to correct for spatial drifts (translations) occurred during SBF-SEM acquisition.
Training dataset
The first stack (Stack #1 T1, 246 slices, acquisition parameters: voxel size µm3, Field Of View (FOV) µm2) underwent a complete manual segmentation using a semi-automatic method (for additional information about the method employed, the interested reader is referred to Senneville et al. (2021)). These manual segmentations were first employed to train for the initial cell contour segmentation network (Step , section 2.1). In that case, the 3D architecture of nnU-Net was employed in Step #1. Then, the 246 manual 2D segmentations ( cell delineations) were employed to generate 2D cell contour probability maps with locally partial or missing information (see section 2.2.1) to pre-train the closing network (Step #2).
Fine-tuning dataset
The second stack (Stack #2 T1, 630 slices, acquisition parameters: voxel size µm3, FOV µm2) belongs to the same tissue as Stack #1 (T1) but represents a different region. Stack #2 underwent manual segmentation on every tenth slice, resulting in a total of cell delineations across 63 slices. Cell contour probability maps with locally missing information were generated using the previously trained initial cell contour segmentation network (Step #1, section 2.1). These slices were utilized to fine-tune the closing network embedded in the proposed COp-Net (see section 2.2).
Validation datasets
Two additional stacks acquired from two different tumours were used to validate the proposed approach: Stack #3 T1 (300 slices) is from the same tissue as Stack #1 and Stack #2 (T1) but represents a different area, while Stack #4 T2 (1,030 slices) is from a distinct PDX. These stacks share the same acquisition parameters: voxel size µm3, FOV µm2. Stack #3 (T1) underwent manual segmentation on every tenth slice, while Stack #4 (T2) underwent manual segmentation on every fiftieth slice. This process yielded and cell delineations in 30 and 21 slices, respectively, providing validation on two different tissues.
2.3.2 Publicly available HeLa cells dataset
The DIC-C2DH-HeLa cells dataset (Ulman et al., 2017; Maska et al., 2023) was utilized to validate the proposed approach. These 2D images of HeLa cells on a flat glass were acquired to achieve a cell-tracking task over time and are publicly available222Available at : https://celltrackingchallenge.net/2d-datasets/. The Zeiss LSM 510 Meta microscope was used with a pixel size µm2, a FOV µm2, and a time step of 10 minutes. Each images has a standardized in-plane dimension of pixels. A first dataset (84 images, cell delineations) was used to train the initial cell contour segmentation network (Step #1, section 2.1). In this specific context of 2D images, the 2D architecture of nnU-Net was employed in Step #1. A second dataset (84 images, cell delineations) was used to evaluate our proposed approach. Note that, for a fair comparison with competitive approaches, the proposed COp-Net was neither trained nor fine-tuned on either of these public datasets.
2.4 Experimental setup
2.4.1 Assessment of COp-Net
The effectiveness of COp-Net for individual cell labelling (i.e., assigning a unique label to each cell) and improving cell contour segmentation (thus reducing the reliance on manual delineation) were both evaluated.
Individual cell labelling
To evaluate the accuracy of cell instance segmentation, we first computed the percentage of cells that were correctly individually labelled. A cell was deemed correctly segmented if the overlap between its mask and the corresponding mask in the ground truth exceeded . Additionally, to provide deeper insights into the necessary corrections, we calculated the percentage of merged cells (false negative contours) and split cells (false positive contours).
Cell contour segmentation
To evaluate the effectiveness of COp-Net in enhancing cell contour segmentation, we calculated the Normalized Surface Distance (NSD) and the centerline Dice (clDice), following the guidelines outlined in the generic framework for metric selection proposed by Maier-Hein et al. (2024).
Statistical tests
Statistical analysis of each metric was performed using asymmetric Mann-Whitney U Test. Results were deemed statistically significant when the -value fell below the conventional threshold of .
2.4.2 Hyper-parameters analysis
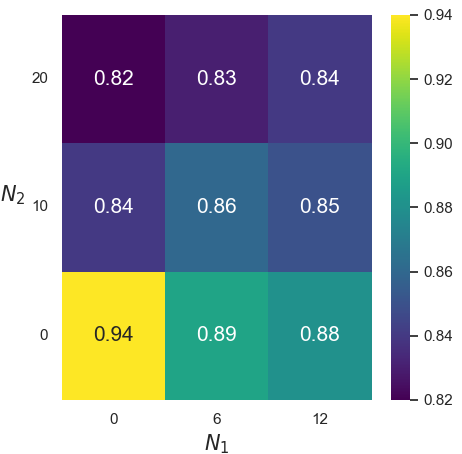
We recall that the approach proposed for simulating training data relies on six hyper-parameters. The two primary ones, and , which respectively represent the number of local diffusion and local drop in cell contour probabilities, were evaluated through a grid search across the domain in the private PDX training data described in section 2.3.1. More specifically, the closing network was trained on data simulated from Stack #1 using various values of and , and evaluated on Stack #2 using the aforementioned assessment metrics (section 2.4.1). Default values of 6 and 10 were employed for and , respectively. The four remaining hyper-parameters in Eq. (2) have been set to typical values for local disturbances, as follows: µm, µm, µm2.s-1 and µm2.s-1.
2.4.3 Comparison with a competing cell instance segmentation algorithm
We compared our approach with Cellpose, a state-of-the-art generalist algorithm for cellular segmentation across various image types, which has been continually enhanced and supported to date (Stringer et al., 2021; Pachitariu and Stringer, 2022; Stringer and Pachitariu, 2024). This 2D CNN-based algorithm produces vertical and horizontal vector flow representations along with a probability map that classifies pixels as either inside or outside cells. Cell labelling is accomplished by applying a gradient ascent procedure to pixels where the probability exceeds 0.5. Cell contour segmentation was also achieved using a specialized function from the SimpleITK library (Lowekamp et al., 2013) applied to the probability map generated by Cellpose.
To ensure a fair comparison with our approach, the latest publicly available “cyto3” model was fine-tuned using the segmented slices from Stack #1 and Stack #2 (which are detailed in section 2.3.1).
2.4.4 Comparison with a competing gap inpainting approach
We also compared our approach with a deep inpainting model designed for detecting and filling gaps in binary root segmentations (Chen et al., 2018). Their architecture is built on a 2D fully convolutional encoder-decoder network with skip connections, similar to U-Net. Since the network input requires binary cell contours and to ensure a fair comparison with our approach, an adapted data simulation is proposed. Cell contours were indeed removed in randomly located circles with random radii (µm) following a uniform distribution in the manually segmented Stack #1, generating pre-training images. Then, the network was finetuned using the segmented slices from Stack #2.
2.5 Hardware and implementation details
All training and model evaluations have been completed on a computer running Ubuntu 20.04.6 LTS with the Intel(R) Xeon(R) Gold 6248R CPU and a NVIDIA RTX A6000 GPU with 48 GB of VRAM. All implementation were performed using Python 3.9. The StackReg module within the pystackreg v0.2.7 library was used for aligning the stacks on a slice-by-slice basis (see section 2.3.1). The nnU-Net v2.3.1 was employed and publicly available333Available at : https://github.com/MIC-DKFZ/nnUNet/tree/v2.3.1. The Cellpose v3.0.8 was employed and publicly available444Available at : https://github.com/MouseLand/cellpose/tree/v3.0.8. SciPy v1.12.0 library was employed to compute statistical tests. SimpleITK v2.2.1 library (Lowekamp et al., 2013) and Scikit-image v0.22.0 were employed to generate connected component labels (see Fig. 1).
3 Results
3.1 Private PDX tumour tissue datasets
Figure 5 provides a visual comparison of the results obtained using the proposed approach and the competing methods on the private validation dataset #2 (default hyper-parameters, as defined in section 2.4.2). The input SEM image (Fig. 5a) and the manual ground truth segmentation (Fig. 5b) are reported, along with results obtained using the Cellpose algorithm (Stringer et al., 2021) (Fig. 5c), the Step #1 alone (Fig. 5d), the competing gap inpainting method (Chen et al., 2018) (Fig. 5e) and the proposed additional module COp-Net (Fig. 5f). In this central slice of the stack, a comparable number of accurately labelled cells can be observed using Cellpose and nnU-Net. While a visual improvement is slightly noticeable with the competing gaps inpainting method (Chen et al., 2018), the number of accurately labelled cells further increases using COp-Net (Fig. 5f). As expected, segmented cell contours (white pixels) more closely matched the cell boundaries when using approaches involving nnU-Net applied to cell boundaries.
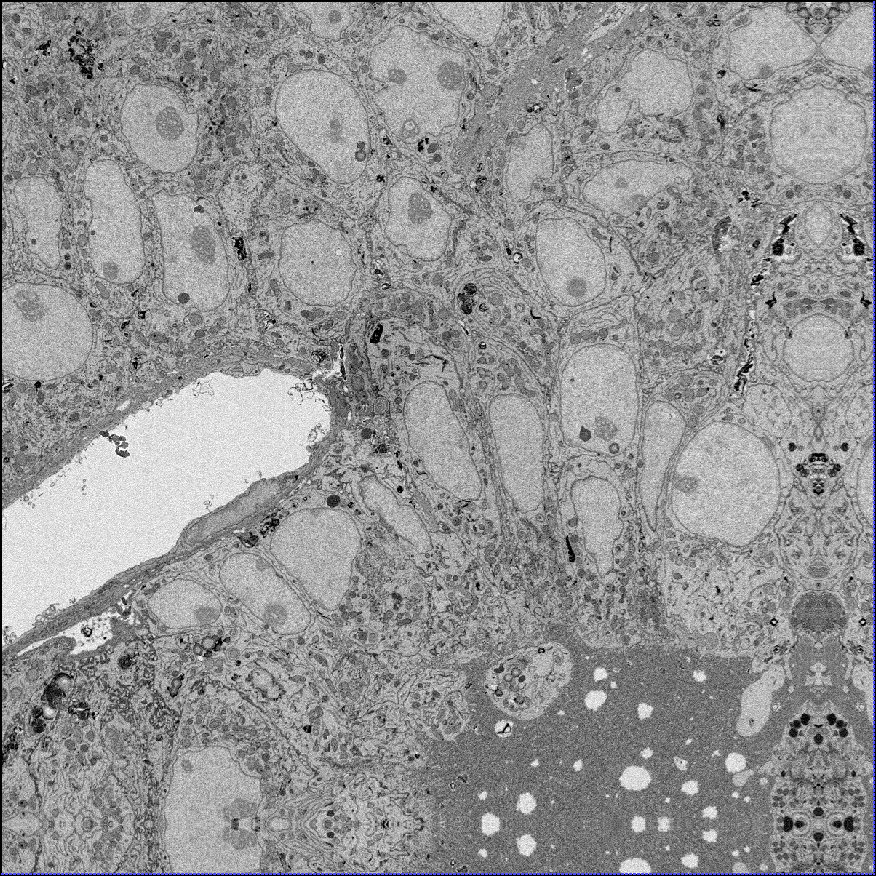
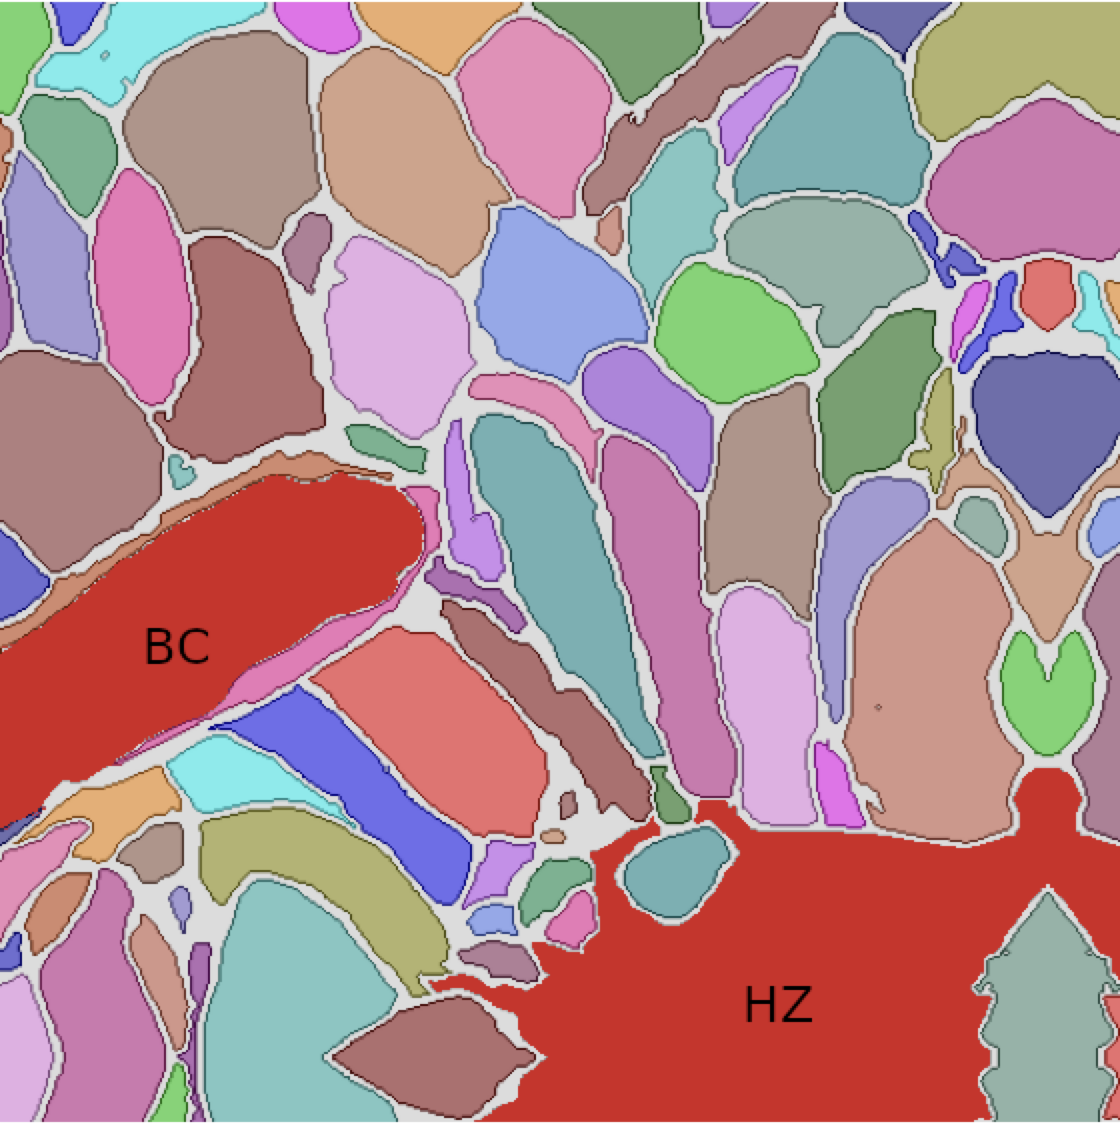
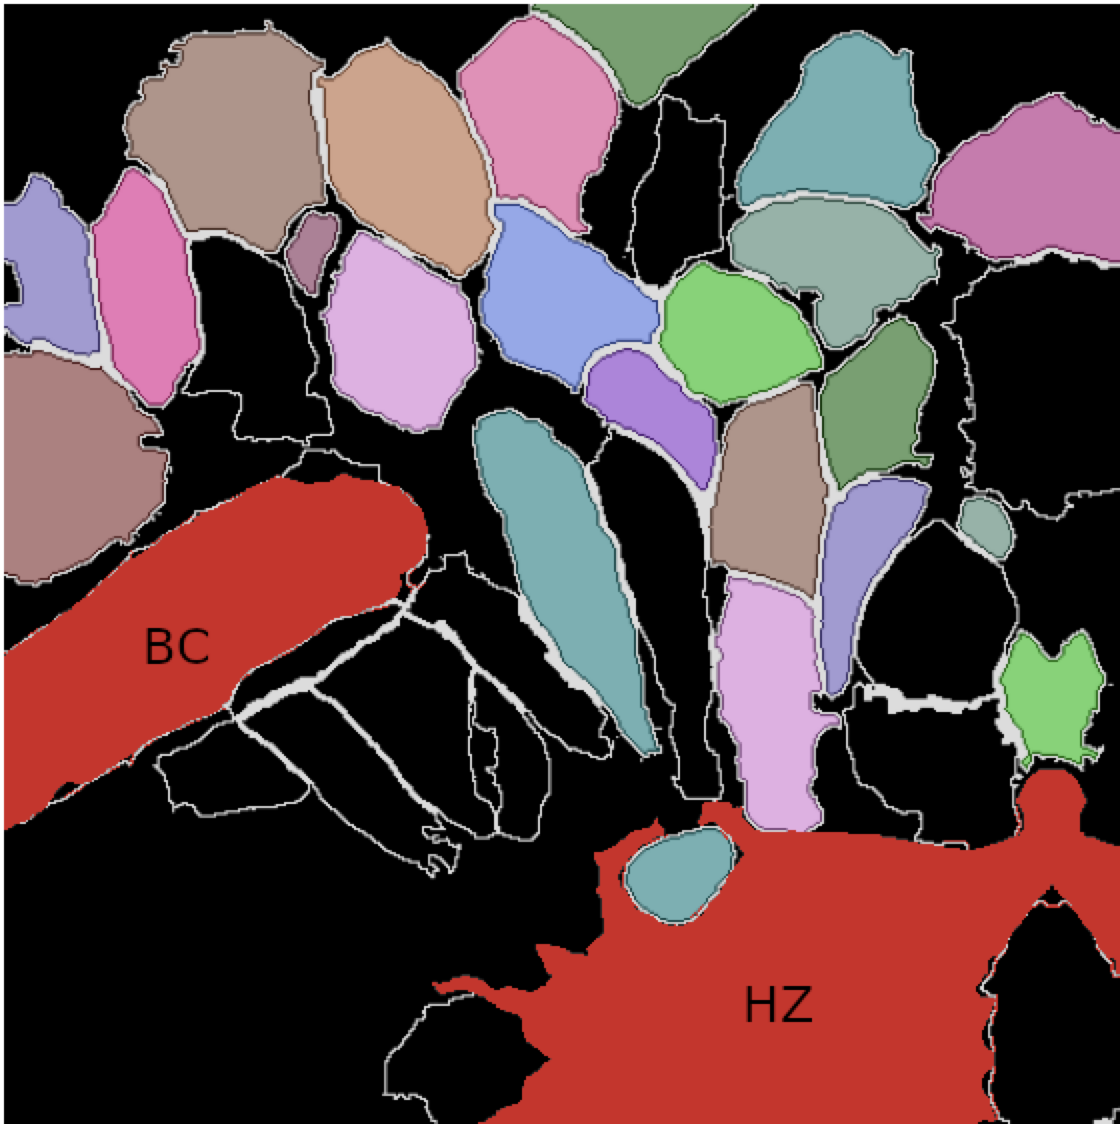
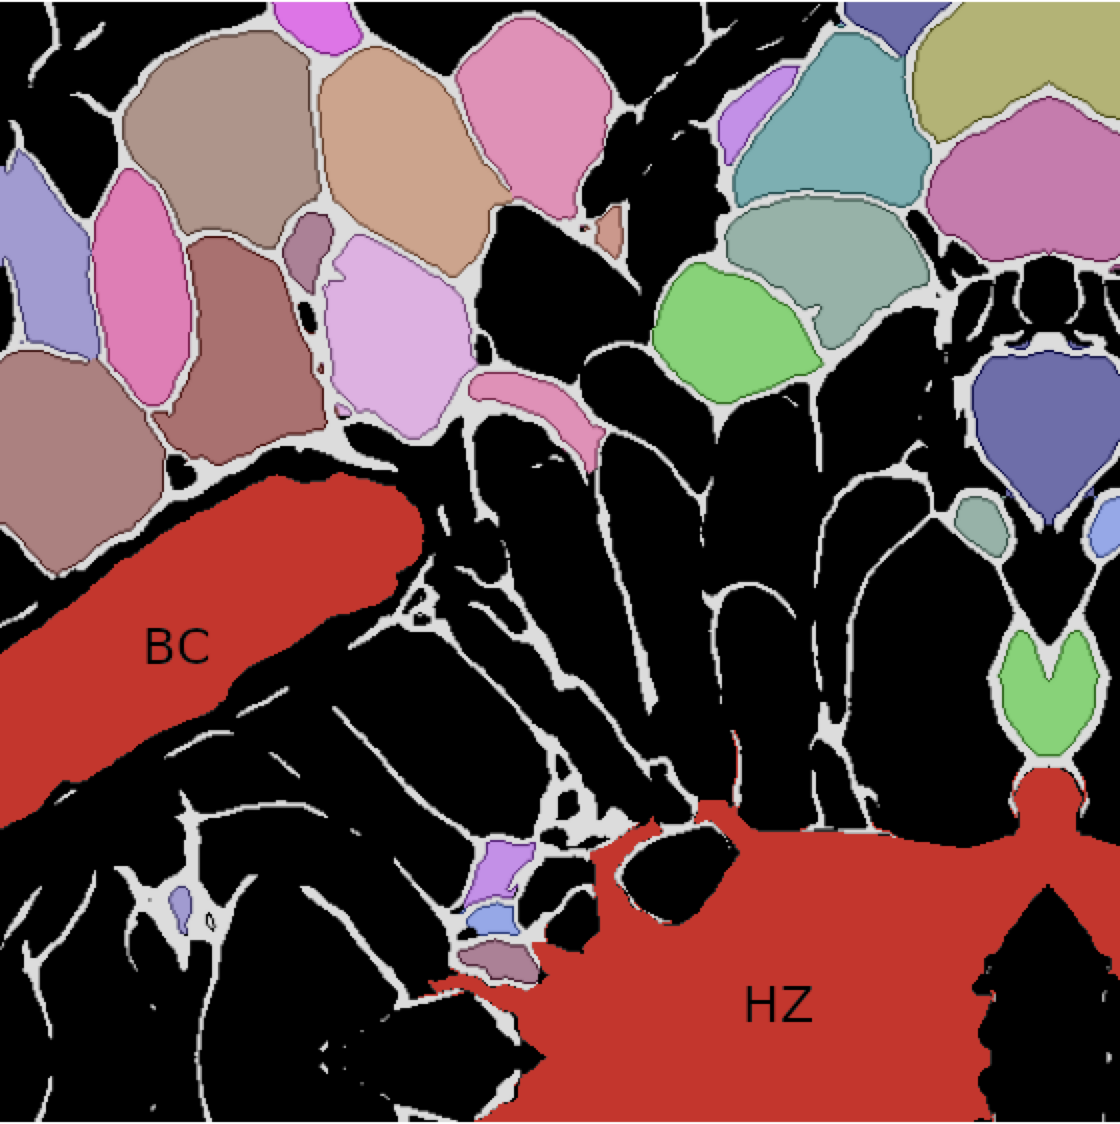
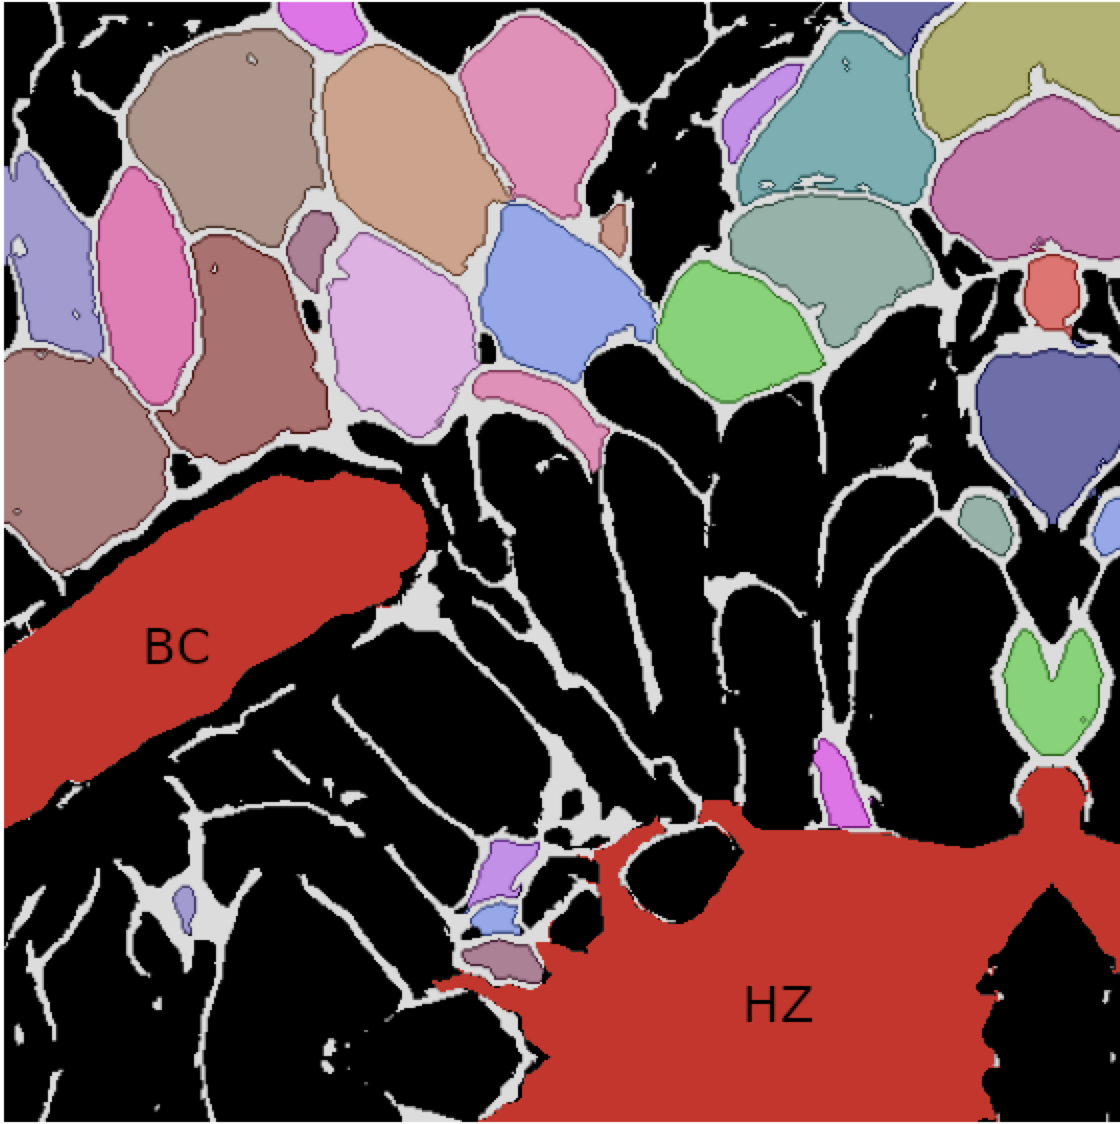
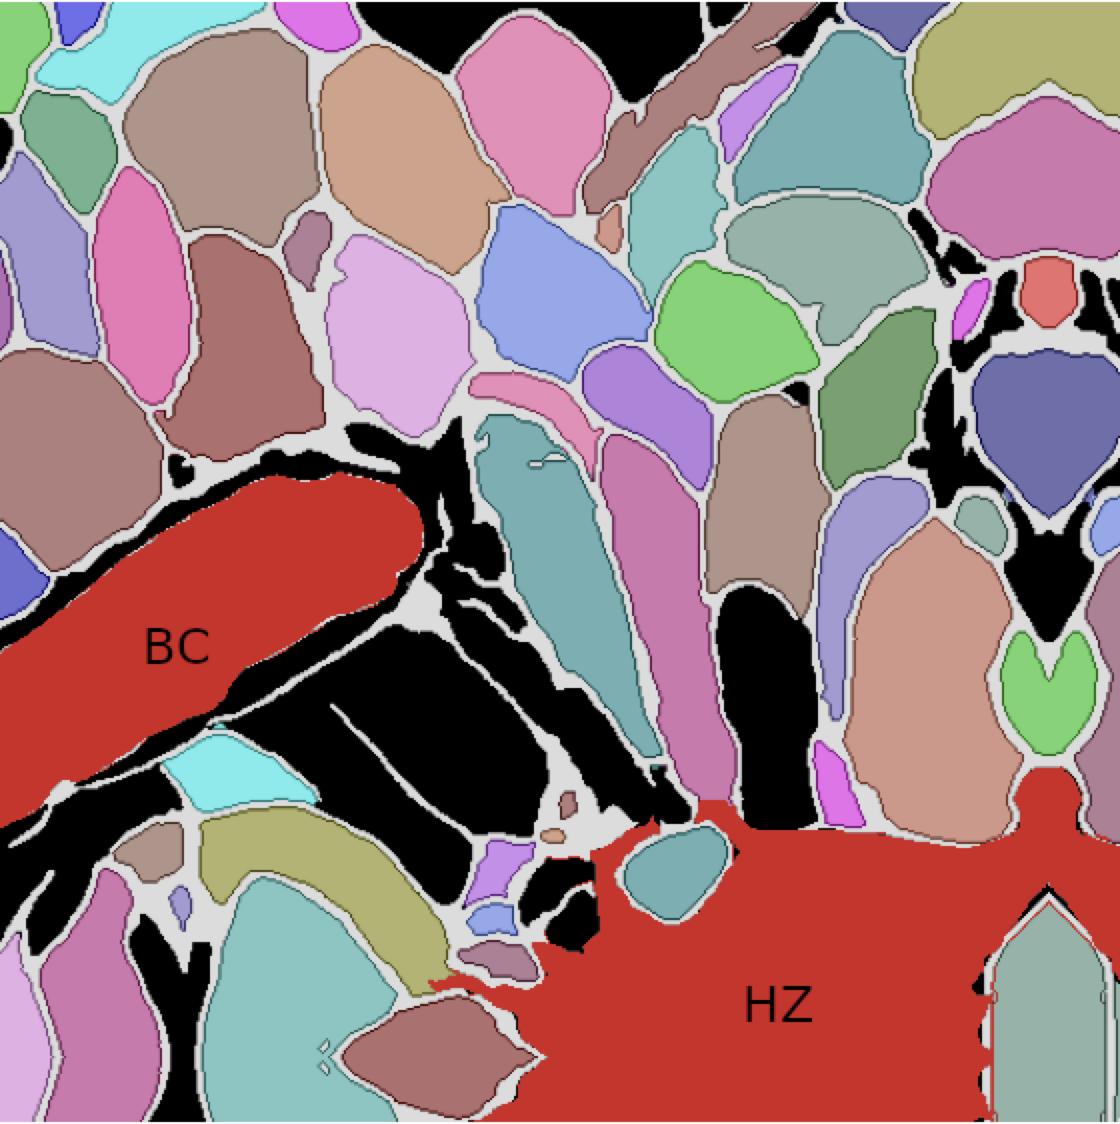
Table 1 confirms these visual observations for both validation datasets (3,425 cell delineations) and (1,282 cell delineations). The use of COp-Net resulted in a substantial improvement in NSD and clDice compared to the initial cell contour segmentation (Step #1), with only a minor increase in the inherent proportion of erroneously split cells (statistically insignificant increase). It can be noticed that the clDice between segmented cell contours in consecutive slices averaged (Stack #4), indicating consistent correction across successive slices. The proposed COp-Net significantly enhanced the performances in individual cell labelling up to and cell contour delineation (clDice) up to , surpassing the capabilities of the existing state-of-the-art gaps inpainting and cell instance segmentation approaches.
|
Labelled cells
[] |
Merged cells
[] |
Split cells
[] |
NSD [A.U.] | clDice [A.U.] | |
| Cellpose | |||||
| Validation dataset 1 | |||||
| Validation dataset 2 | |||||
| nnU-Net | |||||
| Validation dataset 1 | |||||
| Validation dataset 2 | |||||
| nnU-Net + (Chen et al., 2018) | |||||
| Validation dataset 1 | |||||
| Validation dataset 2 | |||||
| nnU-Net + COp-Net (1st iteration) | |||||
| Validation dataset 1 | |||||
| Validation dataset 2 | |||||
| nnU-Net + COp-Net (Full convergence) | |||||
| Validation dataset 1 | |||||
| Validation dataset 2 | |||||
Figure 6 displays assessment metrics obtained during iterative inference of COp-Net on both validation datasets. The proportion of correctly labelled cells primarily improved during the initial iterations (Fig. 6a) and did not improve significantly thereafter. Using iterative inference of COp-Net, the proportion of correctly labelled cells significantly increased from (no iteration) to (full convergence/ iteration) on validation dataset #1 (validation dataset #2: no iteration , full convergence/ iteration ). Conversely, cell contour accuracy deteriorated at some point over iterations, as evidenced by the decline in NSD (Fig. 6b) and clDice (Fig. 6c).
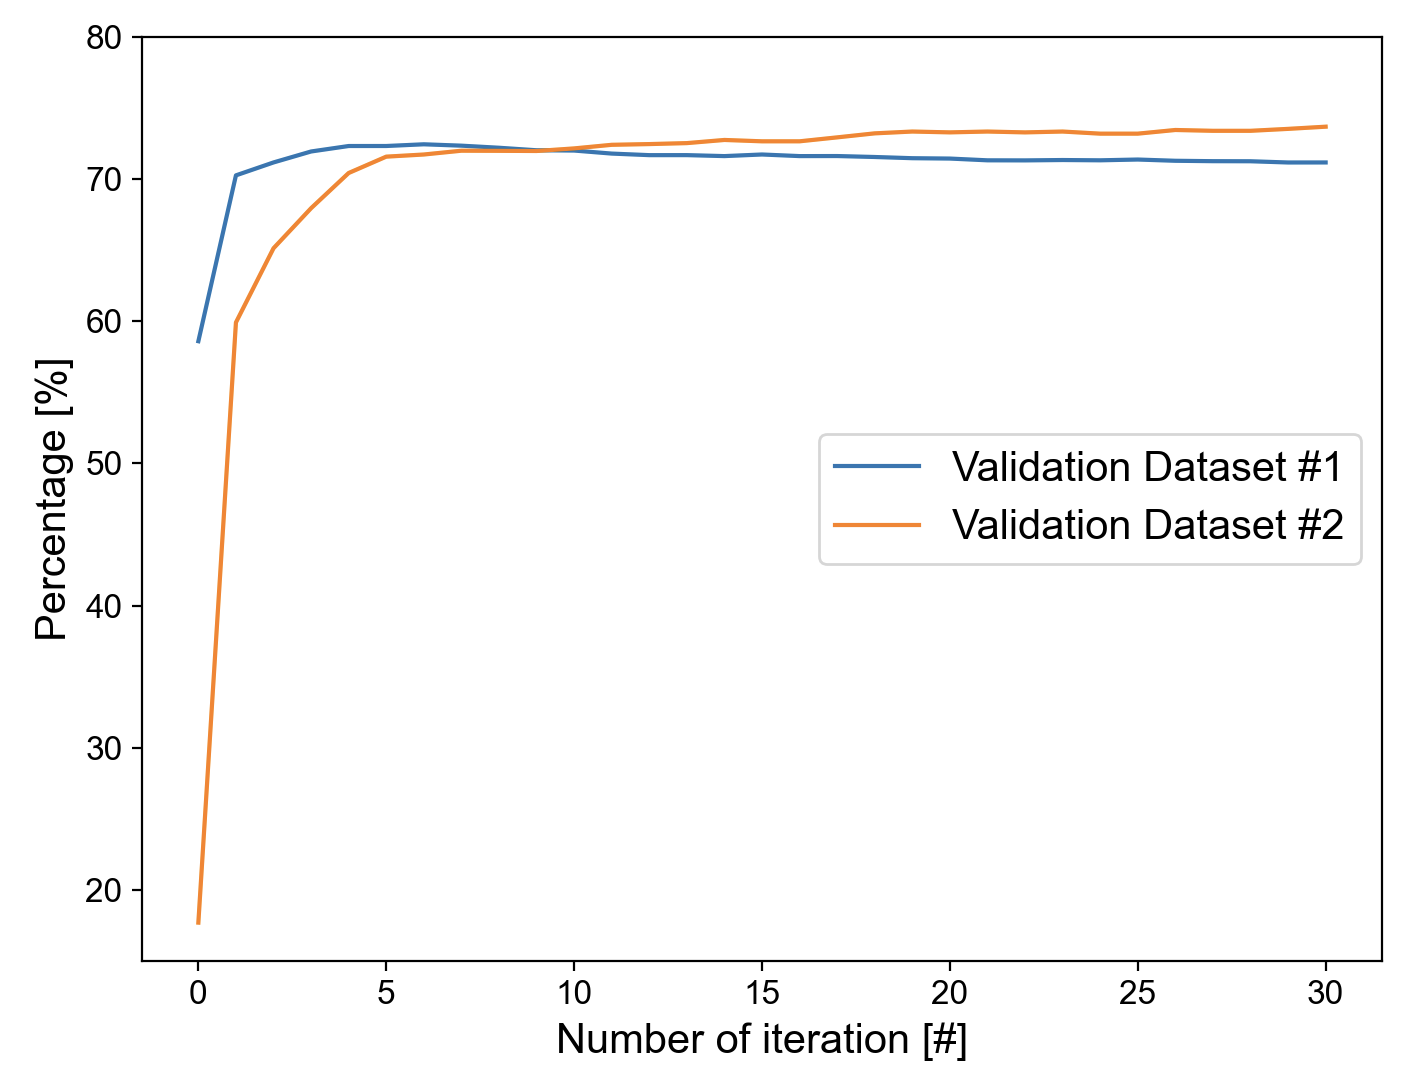
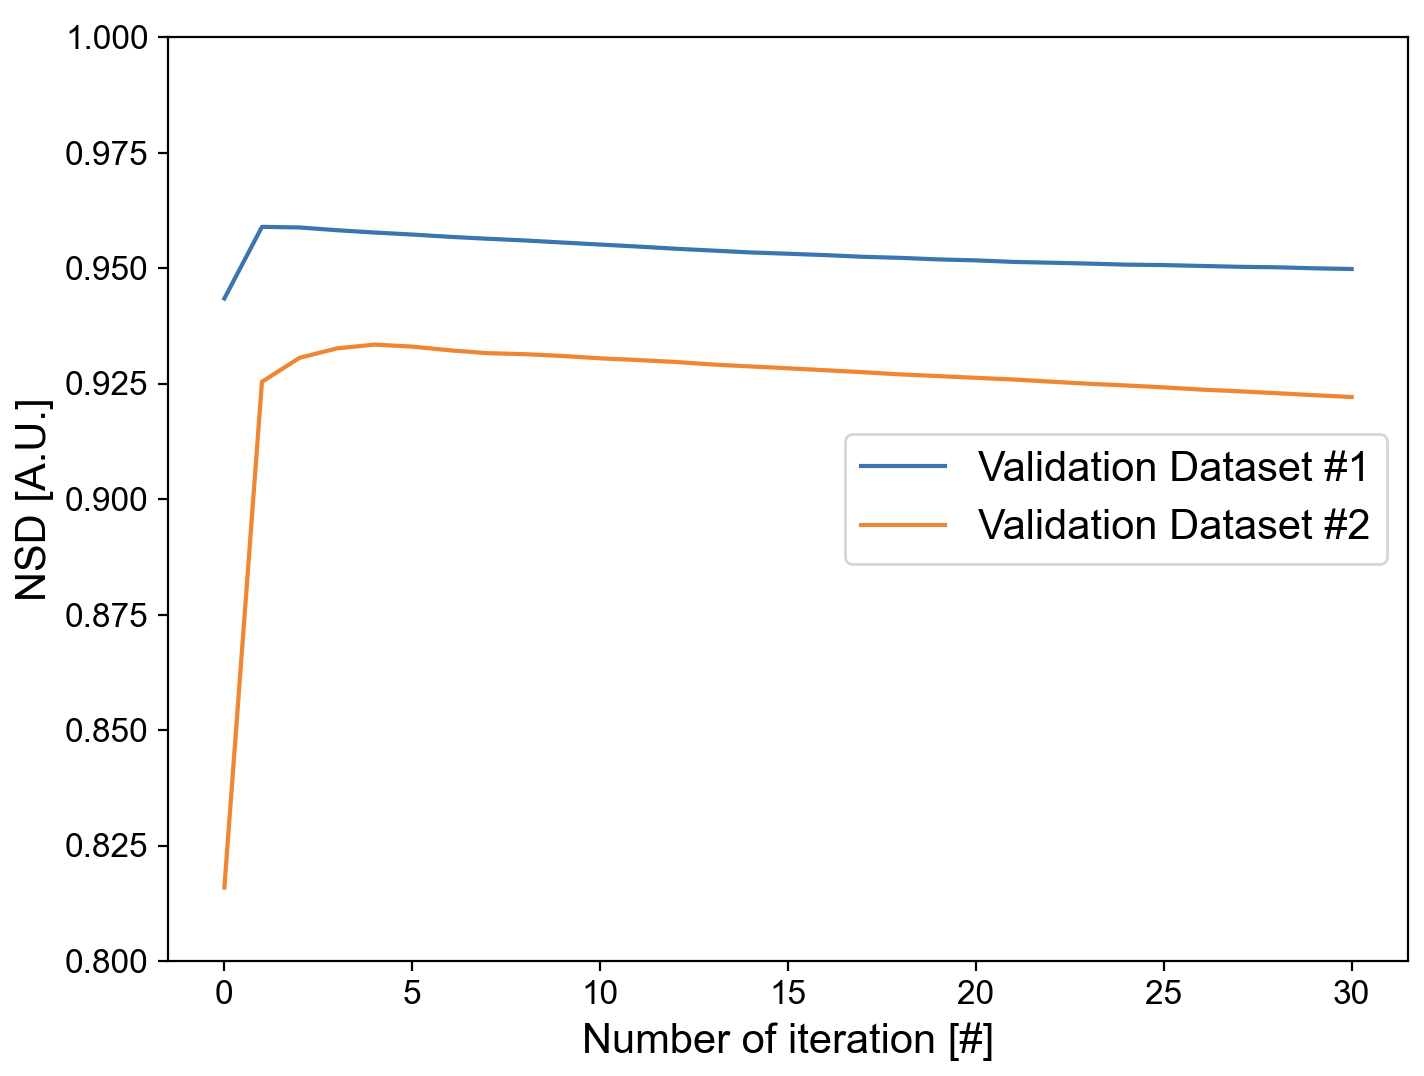
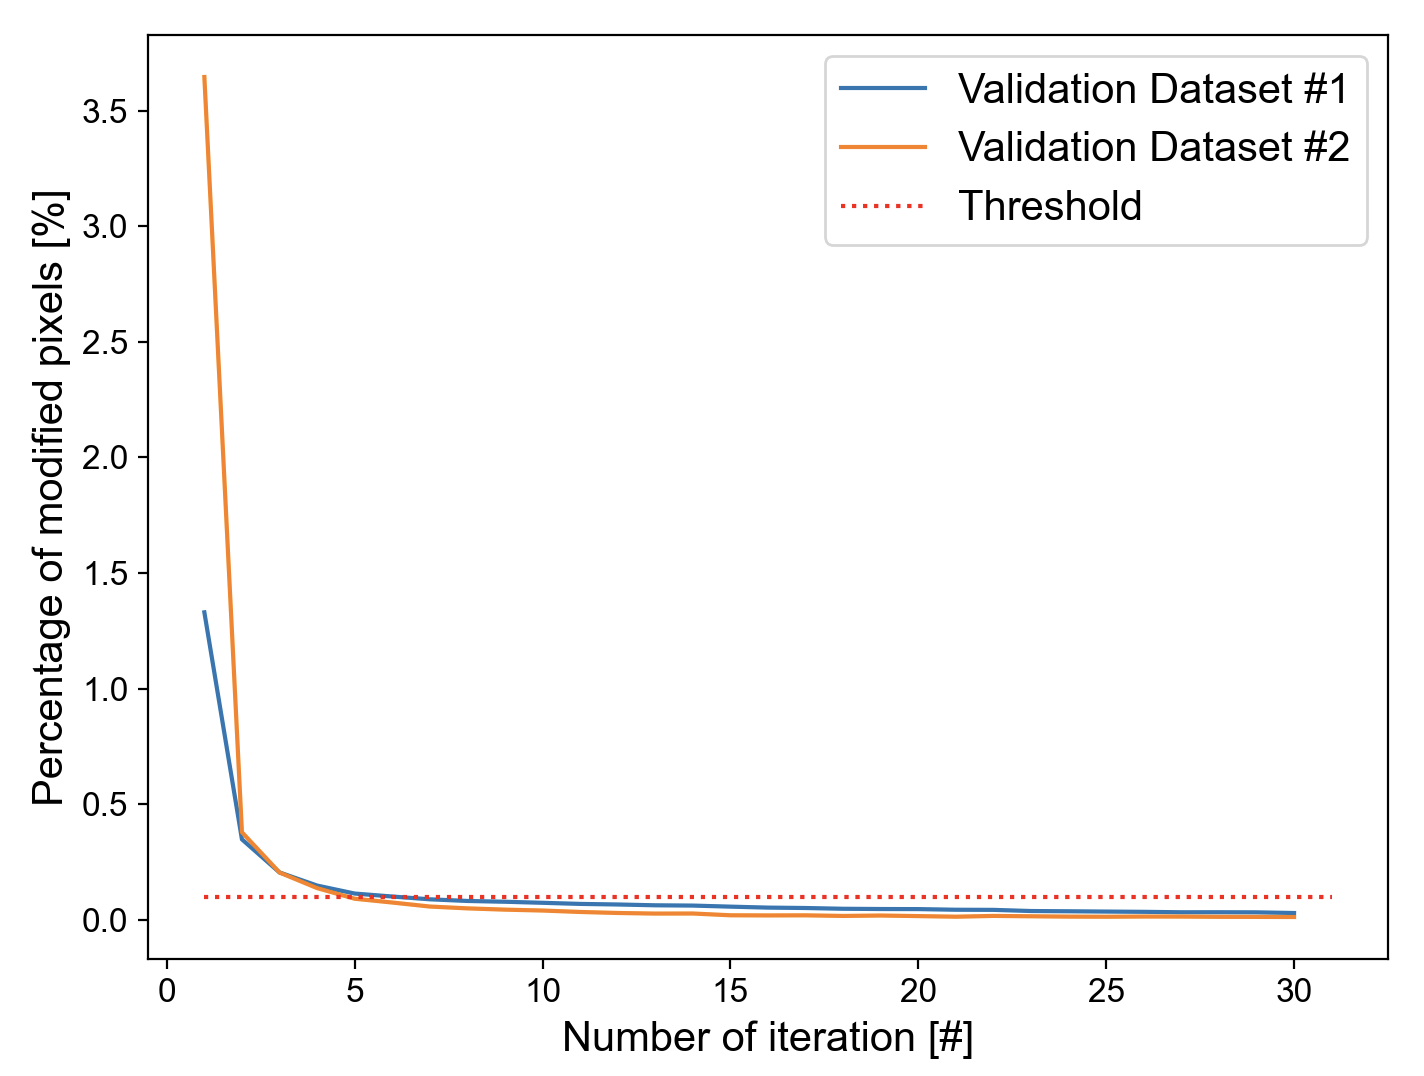
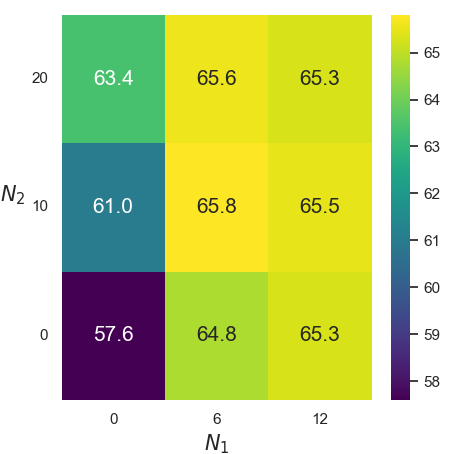
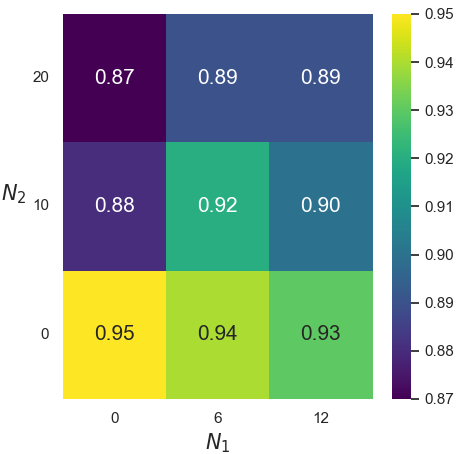
Figure 7 reports assessment metrics obtained during grid-search of hyper-parameters and . An insufficient number of perturbation areas in the training data (low or values) resulted in an inadequate detection and filling of gaps, as shown in Fig. 7a. Conversely, highly degraded training data (high or values) resulted in worsened assessment metrics. A balanced trade-off was achieved with (default hyper-parameters, as defined in section 2.4.2).
3.2 Publicly available HeLa cells dataset
Figure 8 provides a visual comparison of the results obtained using the proposed approach and the competing methods on the public validation dataset DIC-C2DH-HeLa (default hyper-parameters, as defined in section 2.4.2). The grayscale image (Fig. 8a) and the publicly available ground truth segmentation (Fig. 8b) are reported, along with those obtained using Cellpose (Stringer et al., 2021) (Fig. 8c), the nnU-net (Fig. 8d), the competing gap inpainting method (Chen et al., 2018) (Fig. 8e) and the nnU-net supplemented with COp-Net (Fig. 8f). The competing gaps inpainting approach (Chen et al., 2018) did not improve the initial cell contour segmentation (Fig. 8e). The highest number of accurately labelled cells and the most accurate segmented cell contours (white pixels) were achieved by supplementing the nnU-Net with the proposed correction module COp-Net (Fig. 5f).
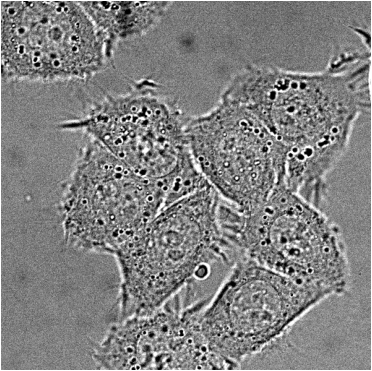
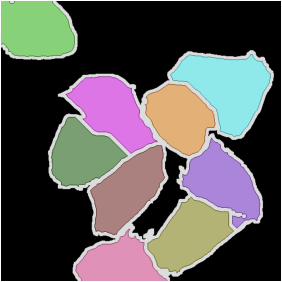
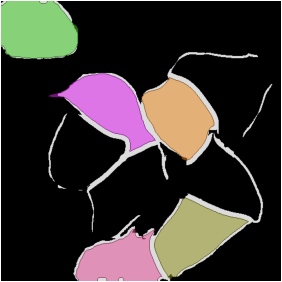
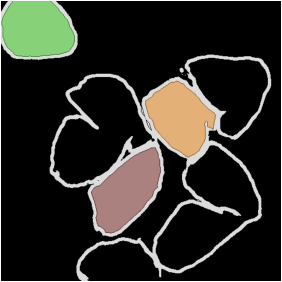

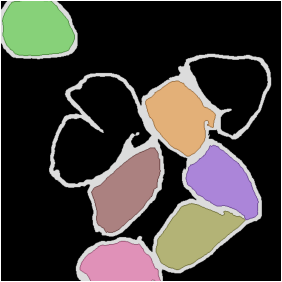
Table 2 confirms these visual observations across the entire validation dataset ( cell delineations). Assessment metrics improved using iterative inference of COp-Net: the proportion of correctly labelled cells significantly increased from (no iteration) to (first iteration) and (three iterations), indicating that the most significant improvements occur during initial iterations. It should be noted that the best assessment metrics were achieved with COp-Net, together with a minor (statistically insignificant) increase in the proportion of erroneously split cells.
|
Labelled cells
[] |
Merged cells
[] |
Split cells
[] |
NSD [A.U.] | clDice [A.U.] | |
| Cellpose | |||||
| nnU-Net | |||||
| nnU-Net + (Chen et al., 2018) | |||||
| nnU-Net + COp-Net (1st iter.) | |||||
| nnU-Net + COp-Net (Full conv.) |
4 Discussion
Our study enhances cell instance segmentation in SEM images by integrating a state-of-the-art segmentation technique (nnU-net) with an innovative AI-based cell contour closing operator COp-Net. The first step of the proposed approach (Step #1), based on the nnU-Net framework, enables the calculation of cell contour probability maps containing valuable information that can be utilized by an additional closing operator (Step #2). To train the deep closing operator, we propose an innovative simulation strategy based on isotropic diffusion of cell contour probabilities, coupled with local dropout. Obtained results demonstrate the effectiveness of our approach for accurate cellular labelling. Moreover, we observed higher NSD and clDice scores, and a reduced proportion of erroneously merged cells, indicating a significant decrease in false negatives in the output cell contours, thereby reducing the need for residual manual correction.
Two state-of-the-art approaches serve as baselines for assessing our method: one cell instance segmentation algorithm (Cellpose) and one gap inpainting approach (Chen et al., 2018). In the following, we elucidate the conceptual differences compared to these two approaches, the reasons underlying improvements of our approach and outline potential avenues for further enhancement in future work. First, it must be underlined that the Cellpose algorithm implements a 2D CNN architecture combined with a gradient ascent procedure for labelling that imposes constraints on cell size variability. This hampered the use of this approach with our private PDX datasets, which contain 2D slices extracted from 3D datasets, resulting in heterogeneous cell sizes in the obtained in-plane images. Conversely, our approach, which does not impose constraints on cell size variability, proved to be more suitable for our private PDX datasets (see Table 1). On the other hand, the competing gap inpainting approach (Chen et al., 2018) automatically detects and fills cell contour gaps from binary segmentations using a 2D CNN architecture. A key improvement of our method is the use of probability maps instead of binary segmentations as input. This allows the application of a tailored PDE to further enhance the representation of missing data in the network.
When considering the segmentation results obtained with Step across the diverse datasets, it is apparent that generalizing this step is challenging, especially for images acquired from different tissues. The segmentation algorithm relies on grayscale images and learned content, making it sensitive to slight variations even with identical acquisition parameters. Our proposed cell contour COp-Net (Step #2) exhibits better generalization since it does not depend on grayscale images obtained via SEM. Instead, it uses continuous probability maps, leading to more consistent performance on the tested datasets.
While assessment metrics improved with iterative inference of COp-Net, cell contour accuracy deteriorated after a certain number of iterations. This trade-off is governed by the convergence threshold used in the iterative inference scheme of COp-Net. As shown in Figure 6, this threshold was optimized to enhance individual cell differentiation (see Fig. 6a) and preserve cell contours (see Fig. 6b).
It is noteworthy that, from a morphological perspective in the computer vision community, a closing operator consists of image dilation followed by image erosion (Serra, 2011). Our attempts to perform contour these two tasks using two dedicated specialized networks did not yield satisfactory results. Interestingly, a single network proved effective for both tasks.
Our study has some limitations that will be addressed in future studies. First, we employed a 2D architecture for the cell contour closing operator COp-Net due to the challenges in obtaining manually segmented data and to facilitate comparison with the two aforementioned state-of-the-art techniques. While it is reasonable to expect that performance could be enhanced using a 3D nnU-Net architecture, adopting such an approach introduces additional challenges related to data acquisition, computational memory costs, and processing time. Alternatively, our attempts on the 3D PDX datasets for orthogonal slice inferences and 2.5D strategies were not satisfactory due to the interpolations required to correct for significant pixel anisotropy in the out-of-plane direction. Since our proposed module significantly reduces the necessary correction efforts across the datasets at hand, we can now aim to correct entire stacks within reasonable timeframes, thus laying the groundwork for exploring three-dimensional neural networks in future studies. Second, it should be emphasized that the performance of the proposed approach stems from the fact that the effectiveness of the closing network (Step ) is intricately tied to both the initial segmentation performance and the generation of realistic cell contour probability maps. Further optimization may be investigated in both directions in future work.
5 Conclusion
The proposed approach significantly refines cell contour delineation and enhances cell instance segmentation outperforming the capabilities of state-of-the-art cell instance segmentation and gap inpainting approaches. To accomplish this, we integrated a state-of-the-art segmentation technique with an additional deep closing operator to fill cell contours in regions with poor or missing informations. The deep closing operator embeds a dedicated convolutional neural network in an iterative scheme. An innovative training strategy is proposed by generating low integrity probability maps using a tailored partial differential equation, for which we provide the code online.
This study represents a significant advancement in the architectural analysis of tumour tissues, offering a robust tool for cell instance segmentation in 2D and 3D context across multiple sample. Such detailed and accurate segmentation is crucial for the field of onconanotomy, as it allows for precise mapping and understanding of tumour micro-environments. The ability to analyse and compare 3D tissue structures can lead to improved diagnostics and treatment planning, ultimately enhancing patient care in oncology.
Data availability
The DIC-C2DH-HeLa cell training and test datasets are publicly available at https://celltrackingchallenge.net/2d-datasets/. The private SEM PDX datasets are involved in ongoing studies concerning tumor tissue development mechanisms and drug resistance and, therefore, will not be made publicly available.
Code availability
The source code for simulating cell contour probability maps by solving Eq. (1) is publicly available at https://xxxxxxxxxxxxxxxxxxxxx.
Declaration of Generative AI and AI-assisted technologies in the writing process
During the preparation of this work, the author(s) used ChatGPT 3.5 in order to rephrase sentences to make them clearer and more precise, as well as to provide improvements for specific wording. After using this tool/service, the authors reviewed and edited the content as needed and take full responsibility for the content of the publication.
Declaration of competing interest
Dr C.F. Grosset received a 2-year research grant from Aquitaine Science Transfer and is part of the scientific board of Paediatis.
Acknowledgement
Computational analysis was carried out using the PlaFRIM experimental testbed, supported by Inria, CNRS (LABRI and IMB), Université de Bordeaux, Bordeaux INP and Conseil Régional d’Aquitaine (see https://www.plafrim.fr/). Imaging was performed on the Bordeaux Imaging Center, member of the FranceBioImaging national infrastructure (ANR-10-INBS-04).
Funding
This work was supported by grants to FR from Inserm and Inria in the frame of the "Santé Numerique" joint program and the Institut National du Cancer (INCa) (N° 2023-018). CFG and MIRCADE also received donations from the following charities: Aidons Marina; Aline en Lutte contre la Leucémie; Cassandra; E.S.CA.P.E.; Eva pour la Vie; Fondation for Addie?s Research; Grandir sans Cancer; Les Amis de Marius; Les Récoltes de l’Espoir; Monaco Liver Disorder, Nathanaël, du Rêve et de l’Espoir; Noëline, ma Fille, ma Bataille; Pour Emma; Scott & Co; Tous Avec Agosti/Kiwanis International and Warrior Enguerrand. The authors don’t have any financial benefit from those Foundations and charities.
References
- Bertozzi et al. (2007a) Bertozzi, A.L., Esedoglu, S., Gillette, A., 2007a. Analysis of a two-scale cahn–hilliard model for binary image inpainting. Multiscale Modeling & Simulation 6, 913–936. doi:10.1137/060660631.
- Bertozzi et al. (2007b) Bertozzi, A.L., Esedoglu, S., Gillette, A., 2007b. Inpainting of binary images using the cahn–hilliard equation. IEEE Transactions on Image Processing 16, 285–291. doi:10.1109/TIP.2006.887728.
- Bosch and Stoll (2015) Bosch, J., Stoll, M., 2015. A fractional inpainting model based on the vector-valued cahn–hilliard equation. SIAM Journal on Imaging Sciences 8, 2352–2382. doi:10.1137/15M101405X.
- Chen et al. (2018) Chen, H., Giuffrida, M.V., Doerner, P., Tsaftaris, S.A., 2018. Root gap correction with a deep inpainting model, in: British Machine Vision Conference. URL: https://api.semanticscholar.org/CorpusID:52290914.
- Chen et al. (2019) Chen, H., Giuffrida, M.V., Doerner, P., Tsaftaris, S.A., 2019. Adversarial large-scale root gap inpainting, in: 2019 IEEE/CVF Conference on Computer Vision and Pattern Recognition Workshops (CVPRW), pp. 2619–2628. doi:10.1109/CVPRW.2019.00318.
- Crank and Nicolson (1947) Crank, J., Nicolson, P., 1947. A practical method for numerical evaluation of solutions of partial differential equations of the heat-conduction type. Mathematical Proceedings of the Cambridge Philosophical Society 43, 50–67. doi:10.1017/S0305004100023197.
- Denk and Horstmann (2004) Denk, W., Horstmann, H., 2004. Serial block-face scanning electron microscopy to reconstruct three-dimensional tissue nanostructure. PLOS Biology 2. doi:10.1371/journal.pbio.0020329.
- Guerrero-Peña et al. (2018) Guerrero-Peña, F.A., Marrero Fernandez, P.D., Ing Ren, T., Yui, M., Rothenberg, E., Cunha, A., 2018. Multiclass weighted loss for instance segmentation of cluttered cells, in: 2018 25th IEEE International Conference on Image Processing (ICIP), pp. 2451–2455. doi:10.1109/ICIP.2018.8451187.
- Han et al. (2023) Han, M., Bushong, E.A., Segawa, M., Tiard, A., Wong, A., Brady, M.R., Momcilovic, M., Wolf, D.M., Zhang, R., Petcherski, A., Madany, M., Xu, S., Lee, J.T., Poyurovsky, M.V., Olszewski, K., Holloway, T., Gomez, A., John, M.S., Dubinett, S.M., Koehler, C.M., Shirihai, O.S., Stiles, L., Lisberg, A., Soatto, S., Sadeghi, S., Ellisman, M.H., Shackelford, D.B., 2023. Spatial mapping of mitochondrial networks and bioenergetics in lung cancer. Nature 615, 712–719. doi:10.1038/s41586-023-05793-3.
- Isensee et al. (2021) Isensee, F., Jaeger, P.F., Kohl, S.A.A., Petersen, J., Maier-Hein, K.H., 2021. nnu-net: a self-configuring method for deep learning-based biomedical image segmentation. Nature Methods 18, 203–211. doi:10.1038/s41592-020-01008-z.
- Isensee et al. (2024) Isensee, F., Wald, T., Ulrich, C., Baumgartner, M., Roy, S., Maier-Hein, K., Jaeger, P.F., 2024. nnu-net revisited: A call for rigorous validation in 3d medical image segmentation. arXiv:2404.09556.
- Johnson et al. (2022) Johnson, B., Creason, A., Stommel, J., Keck, J., Parmar, S., Betts, C., Blucher, A., Boniface, C., Bucher, E., Burlingame, E., Camp, T., Chin, K., Eng, J., Estabrook, J., Feiler, H., Heskett, M., Hu, Z., Kolodzie, A., Kong, B., Labrie, M., Lee, J., Leyshock, P., Mitri, S., Patterson, J., Riesterer, J., Sivagnanam, S., Somers, J., Sudar, D., Thibault, G., Weeder, B., Zheng, C., Nan, X., Thompson, R., Heiser, L., Spellman, P., Thomas, G., Demir, E., Chang, Y., Coussens, L., Guimaraes, A., Corless, C., Goecks, J., Bergan, R., Mitri, Z., Mills, G., Gray, J., 2022. An omic and multidimensional spatial atlas from serial biopsies of an evolving metastatic breast cancer. Cell Reports Medicine 3. doi:10.1016/j.xcrm.2022.100525. publisher Copyright: © 2022 The Authors.
- Karabag et al. (2020) Karabag, C., Jones, M.L., Peddie, C.J., Weston, A.E., Collinson, L.M., Reyes-Aldasoro, C.C., 2020. Semantic segmentation of hela cells: An objective comparison between one traditional algorithm and four deep-learning architectures. PLOS ONE 15, 1--21. doi:10.1371/journal.pone.0230605.
- Liu et al. (2021) Liu, X., Song, L., Liu, S., Zhang, Y., 2021. A review of deep-learning-based medical image segmentation methods. Sustainability 13. doi:10.3390/su13031224.
- Lowekamp et al. (2013) Lowekamp, B., Chen, D., Ibanez, L., Blezek, D., 2013. The design of simpleitk. Frontiers in Neuroinformatics 7. doi:10.3389/fninf.2013.00045.
- Machireddy et al. (2023a) Machireddy, A., Thibault, G., Loftis, K.G., Stoltz, K., Bueno, C.E., Smith, H.R., Riesterer, J.L., Gray, J., Song, X., 2023a. Robust segmentation of cellular ultrastructure on sparsely labeled 3d electron microscopy images using deep learning doi:10.2139/ssrn.3830021.
- Machireddy et al. (2023b) Machireddy, A., Thibault, G., Loftis, K.G., Stoltz, K., Bueno, C.E., Smith, H.R., Riesterer, J.L., Gray, J.W., Song, X., 2023b. Segmentation of cellular ultrastructures on sparsely labeled 3d electron microscopy images using deep learning. Frontiers in Bioinformatics 3, 1308708. doi:10.3389/fbinf.2023.1308708.
- Maier-Hein et al. (2024) Maier-Hein, L., Reinke, A., Godau, P., Tizabi, M.D., Buettner, F., Christodoulou, E., Glocker, B., Isensee, F., Kleesiek, J., Kozubek, M., Reyes, M., Riegler, M.A., Wiesenfarth, M., Kavur, A.E., Sudre, C.H., Baumgartner, M., Eisenmann, M., Heckmann-Nötzel, D., Rädsch, T., Acion, L., Antonelli, M., Arbel, T., Bakas, S., Benis, A., Blaschko, M.B., Cardoso, M.J., Cheplygina, V., Cimini, B.A., Collins, G.S., Farahani, K., Ferrer, L., Galdran, A., van Ginneken, B., Haase, R., Hashimoto, D.A., Hoffman, M.M., Huisman, M., Jannin, P., Kahn, C.E., Kainmueller, D., Kainz, B., Karargyris, A., Karthikesalingam, A., Kofler, F., Kopp-Schneider, A., Kreshuk, A., Kurc, T., Landman, B.A., Litjens, G., Madani, A., Maier-Hein, K., Martel, A.L., Mattson, P., Meijering, E., Menze, B., Moons, K.G.M., Müller, H., Nichyporuk, B., Nickel, F., Petersen, J., Rajpoot, N., Rieke, N., Saez-Rodriguez, J., Sánchez, C.I., Shetty, S., van Smeden, M., Summers, R.M., Taha, A.A., Tiulpin, A., Tsaftaris, S.A., Van Calster, B., Varoquaux, G., Jäger, P.F., 2024. Metrics reloaded: Recommendations for image analysis validation. Nat Methods 21, 195--212. doi:10.1038/s41592-023-02151-z. epub 2024 Feb 12.
- Maska et al. (2023) Maska, M., Ulman, V., Delgado-Rodriguez, P., Gómez-de Mariscal, E., Ne?asová, T., Guerrero Peña, F.A., Ren, T.I., Meyerowitz, E.M., Scherr, T., Löffler, K., Mikut, R., Guo, T., Wang, Y., Allebach, J.P., Bao, R., Al-Shakarji, N.M., Rahmon, G., Toubal, I.E., Palaniappan, K., Lux, F., Matula, P., Sugawara, K., Magnusson, K.E.G., Aho, L., Cohen, A.R., Arbelle, A., Ben-Haim, T., Raviv, T.R., Isensee, F., Jäger, P.F., Maier-Hein, K.H., Zhu, Y., Ederra, C., Urbiola, A., Meijering, E., Cunha, A., Muñoz-Barrutia, A., Kozubek, M., Ortiz-de Solórzano, C., 2023. The cell tracking challenge: 10 years of objective benchmarking. Nature Methods 20, 1010--1020. doi:10.1038/s41592-023-01879-y.
- Pachitariu and Stringer (2022) Pachitariu, M., Stringer, C., 2022. Cellpose 2.0: how to train your own model. Nature Methods 19, 1634--1641. URL: https://doi.org/10.1038/s41592-022-01663-4, doi:10.1038/s41592-022-01663-4.
- Qin et al. (2012) Qin, C., Wang, S., Zhang, X., 2012. Simultaneous inpainting for image structure and texture using anisotropic heat transfer model. Multimedia Tools and Applications 56, 469--483. doi:10.1007/s11042-010-0601-4.
- Riesterer et al. (2019) Riesterer, J.L., López, C.S., Stempinski, E.S., Williams, M., Loftis, K., Stoltz, K., Thibault, G., Lanicault, C., Williams, T., Gray, J.W., 2019. A workflow for visualizing human cancer biopsies using large-format electron microscopy. bioRxiv doi:10.1101/675371.
- Ronneberger et al. (2015) Ronneberger, O., Fischer, P., Brox, T., 2015. U-net: Convolutional networks for biomedical image segmentation, in: Navab, N., Hornegger, J., Wells, W., Frangi, A. (Eds.), Medical Image Computing and Computer-Assisted Intervention : MICCAI 2015, Springer, Cham. doi:10.1007/978-3-319-24574-4_28.
- Sasaki et al. (2017) Sasaki, K., Iizuka, S., Simo-Serra, E., Ishikawa, H., 2017. Joint gap detection and inpainting of line drawings, in: 2017 IEEE Conference on Computer Vision and Pattern Recognition (CVPR), pp. 5768--5776. doi:10.1109/CVPR.2017.611.
- Schönlieb (2023) Schönlieb, C.B., 2023. Higher-order total variation inpainting. URL: https://www.mathworks.com/matlabcentral/fileexchange/34356-higher-order-total-variation-inpainting. retrieved on 2024-07-22.
- Senneville et al. (2021) Senneville, B., Khoubai, F.Z., Bevilacqua, M., Labedade, A., Flosseau, K., Chardot, C., Branchereau, S., Ripoche, J., Cairo, S., Gontier, E., Grosset, C., 2021. Deciphering tumour tissue organization by 3d electron microscopy and machine learning. Communications Biology 4. doi:10.1038/s42003-021-02919-z.
- Serra (2011) Serra, J., 2011. Lecture notes on morphological operators. URL: https://people.cmm.minesparis.psl.eu/users/serra/cours/T-34.pdf. retrieved on 2024-07-22.
- Stringer and Pachitariu (2024) Stringer, C., Pachitariu, M., 2024. Cellpose3: one-click image restoration for improved cellular segmentation. bioRxiv URL: https://www.biorxiv.org/content/early/2024/02/12/2024.02.10.579780, doi:10.1101/2024.02.10.579780.
- Stringer et al. (2021) Stringer, C., Wang, T., Michaelos, M., Pachitariu, M., 2021. Cellpose: a generalist algorithm for cellular segmentation. Nature Methods 18, 100--106. doi:10.1038/s41592-020-01018-x.
- Ulman et al. (2017) Ulman, V., Maska, M., Magnusson, K.E.G., Ronneberger, O., Haubold, C., Harder, N., Matula, P., Matula, P., Svoboda, D., Radojevic, M., Smal, I., Rohr, K., Jaldén, J., Blau, H.M., Dzyubachyk, O., Lelieveldt, B., Xiao, P., Li, Y., Cho, S.Y., Dufour, A.C., Olivo-Marin, J.C., Reyes-Aldasoro, C.C., Solis-Lemus, J.A., Bensch, R., Brox, T., Stegmaier, J., Mikut, R., Wolf, S., Hamprecht, F.A., Esteves, T., Quelhas, P., Demirel, O., Malmstrom, L., Jug, F., Tomancak, P., Meijering, E., Muñoz-Barrutia, A., Kozubek, M., Ortiz-de Solorzano, C., 2017. An objective comparison of cell-tracking algorithms. Nature Methods 14, 1141--1152. doi:10.1038/nmeth.4473.
- Wang et al. (2022) Wang, A., Zhang, Q., Han, Y., Megason, S., Hormoz, S., Mosaliganti, K.R., Lam, J.C.K., Li, V.O.K., 2022. A novel deep learning-based 3d cell segmentation framework for future image-based disease detection. Scientific Reports 12, 342. doi:10.1038/s41598-021-04048-3.
- Wei et al. (2020) Wei, D., Lin, Z., Franco-Barranco, D., Wendt, N., Liu, X., Yin, W., Huang, X., Gupta, A., Jang, w.D., Wang, X., Arganda-Carreras, I., Lichtman, J., Pfister, H., 2020. MitoEM Dataset: Large-scale 3D Mitochondria Instance Segmentation from EM Images. volume 12265. pp. 66--76. doi:10.1007/978-3-030-59722-1_7.
- Wen et al. (2023) Wen, C., Matsumoto, M., Sawada, M., Sawamoto, K., Kimura, K.D., 2023. Seg2link: an efficient and versatile solution for semi-automatic cell segmentation in 3d image stacks. Scientific Reports 13, 7109. doi:10.1038/s41598-023-34232-6.