The Atlas of AI Incidents in Mobile Computing: Visualizing the Risks and Benefits of AI Gone Mobile
Abstract.
Today’s visualization tools for conveying the risks and benefits of AI technologies are largely tailored for those with technical expertise. To bridge this gap, we have developed a visualization that employs narrative patterns and interactive elements, enabling the broader public to gradually grasp the diverse risks and benefits associated with AI. Using a dataset of 54 real-world incidents involving AI in mobile computing, we examined design choices that enhance public understanding and provoke reflection on how certain AI applications—even those deemed low-risk by law—can still lead to significant incidents.
Visualization: https://social-dynamics.net/mobile-ai-risks
1. Introduction
Artificial Intelligence (AI) is now omnipresent, seamlessly integrating into mobile devices and profoundly influencing sectors like workplaces, healthcare, and education. These sensor-equipped, AI-powered devices have transformed workplace productivity by enabling effortless communication and efficient task management (Mirjafari et al., 2019; Aseniero et al., 2020; Choi et al., 2021; Constantinides et al., 2020). They also provide cost-effective, objective metrics on physical and mental health, facilitating large-scale behavioral monitoring (Zhou et al., 2023; Park et al., 2023; Constantinides et al., 2018; Perez-Pozuelo et al., 2021). In education, real-time data from these devices assist students in planning and controlling their learning activities (Ciolacu et al., 2019). However, the rise of AI in mobile devices also brings substantial risks, particularly in terms of privacy and security. AI can lead to data leakage and unauthorized surveillance, raising serious concerns about the confidentiality and integrity of personal information. Advances in federated learning and differential privacy offer promising ways to mitigate these risks (McMahan et al., 2017; Dwork, 2008), but ensuring transparency in AI decision-making remains a formidable challenge, especially in sensitive fields like healthcare. Moreover, security issues extend beyond data breaches to include physical risks, such as skin irritations caused by device materials (Mills et al., 2016; Kelly, 2014). Thus, while AI-enhanced mobile technologies offer significant benefits, they demand rigorous risk assessments and public engagement to fully understand their implications (Constantinides et al., 2024b).
Current tools for communicating the risks and benefits of AI technologies are predominantly aimed at technically proficient audiences. These tools, including impact assessment reports (Microsoft, 2022; Stahl et al., 2023), harm description templates (Buçinca et al., 2023), and databases such as the IBM Risk Atlas (IBM watsonx, 2023) and AI Risk Database (Robust Intelligence, 2023), focus on detailing technical risks for AI practitioners (Constantinides et al., 2024a; Hong et al., 2020), often neglecting the broader societal implications. Out of nearly four hundred AI auditing tools, only two attempted to communicate risks to non-specialists (Ojewale et al., 2024), revealing a significant communication gap. This gap leaves the general public without a comprehensive understanding of AI’s potential trade-offs and broader impacts. To bridge this gap, we designed a visualization that uses narrative patterns and interactive elements to make the risks and benefits of AI in mobile computing accessible to a wide audience. We populated this visualization with data from 54 real-world AI incidents reported in the news, exploring design choices that enhance public understanding and provoke reflection on how even low-risk AI uses can lead to significant incidents.
2. Related Work
We next reviewed research across three areas: the risks and benefits of AI in mobile uses, databases of AI incidents, and visualizations for technology risks and benefits.
Risk and Benefits of AI in Mobile Computing. Integrating AI into mobile devices offers substantial benefits but also significant risks. These risks include data leakage and unauthorized surveillance, intensified by the intimate nature of mobile devices (Haris et al., 2014; Constantinides and Quercia, 2022; Das Swain et al., 2023). Advances in federated learning and differential privacy are helping mitigate these risks by enhancing data security and allowing AI models to be trained directly on devices, thus preventing exposure of sensitive data (McMahan et al., 2017; Dwork, 2008). Despite these improvements, challenges in AI explainability persist, particularly in high-stakes areas such as healthcare, where transparency is paramount (Saraswat et al., 2022). On the benefit side, AI-powered mobile devices significantly enhance physical and mental health monitoring, facilitate large-scale behavioral monitoring (Zhou et al., 2023; Park et al., 2023; Constantinides et al., 2018; Perez-Pozuelo et al., 2021), and enable real-time data collection and analytics in educational settings (Ciolacu et al., 2019).
Databases of AI Incidents. Databases cataloging AI incidents are crucial for understanding and mitigating the socio-technical risks associated with AI. These databases gather information from various sources, including internet news reports and contributions from AI communities. The AI Incident Database, for example, automatically collects online news reports of AI-related harms (McGregor, 2021). The OECD AI Incidents Monitor tracks international media sources to document failures in human-AI interactions (OECD, Patrick J. McGovern Foundation, 2024). Meanwhile, the AI, Algorithmic, and Automation Incidents and Controversies Repository takes a curated approach, involving human oversight to classify and review incidents (AIAAIC, 2023). Technical databases like the Adversarial Threat Landscape for Artificial-Intelligence Systems focus on adversarial techniques and real-world attack case studies (MITRE ATLAS, 2022). The forthcoming AI Vulnerability Database aims to support developers and auditors by cataloging instances of AI failures (AVID, 2022). These databases often provide publicly accessible data (AIAAIC, 2023) and use detailed taxonomies (OECD, Patrick J. McGovern Foundation, 2024; McGregor, 2021), enabling the analysis of incident patterns and effective communication to various audiences (Wei and Zhou, 2023).
Visualizations for Technology Risks and Benefits. Visualization tools play a key role in elucidating how AI technologies operate, uncovering biases in datasets, and highlighting model vulnerabilities (Subramonyam and Hullman, 2024). For example, visualizing disparities within datasets can reveal sampling biases, while comparing model inputs and outputs can expose decision-making inconsistencies (Bellamy et al., 2018; IBM watsonx, 2023). Visualizations that help internalize model logic, assess risk, and calibrate trust can support many different types of stakeholders, particularly model makers (e.g., developers, data scientists), model breakers (e.g., product managers, risk officers, model adopters), and model users (e.g., domain experts or laypeople) (Hong et al., 2020).
Research Gap. Current visualizations often target technically proficient audiences familiar with complex concepts like confusion matrices or activation maps (Subramonyam and Hullman, 2024). To communicate AI risks and benefits effectively to non-experts, information needs to be simplified and made relatable to personal contexts (Franconeri et al., 2021). This can be achieved through visualization techniques that incorporate narratives (Segel and Heer, 2010), metaphors (Van Koningsbruggen et al., 2024; Zelenka et al., 2021), interactive elements (IEEE VIS, 2018), and personalized presentations (Luccioni et al., 2021), making the risks and benefits of AI more accessible and engaging for the general public.
3. Visualizing the Risks and Benefits of AI Uses
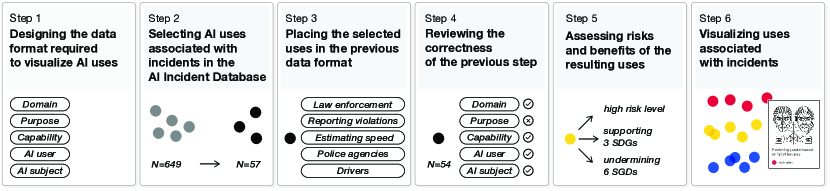
To develop our visualization, we went through six steps (Figure 1). These steps included: establishing a data format to represent various AI uses; curating a dataset of 54 AI applications in mobile computing based on real-world incidents from the AI Incident Database (AIID); and developing a narrative-style visualization tool to highlight both the risks and benefits of these uses. We chose AIID because it provides a standardized and verified repository of AI incidents.
3.1. Curating a Dataset of Risks and Benefits
Step 1: Designing Data Format. We created a standardized format to ensure consistent descriptions of AI applications across different technologies (first step in Figure 1). This format, inspired by the EU AI Act’s five-component risk assessment framework (Golpayegani et al., 2023), includes: the domain specifying the application industry or sector (e.g., well-being), the purpose explaining the goal (e.g., providing meditation guidance on a mobile app), the capability describing the technology (e.g., real-time stress level tracking), the AI user operating the system (e.g., health coaches), and the AI subject affected by the system (e.g., app owners).
Step 2: Selecting AI Uses. We focused on AI applications related to mobile computing (second step in Figure 1), drawing from the AIID. By March 2024, the AIID contained 649 incidents, mostly from the US, spanning from 2013 to 2024. After eliminating duplicates, we analyzed 639 unique incidents, filtering those relevant to mobile devices. This process involved searching descriptions for mentions of mobile applications and technologies, ultimately selecting 57 uses.
Step 3: Formatting the Data. Using OpenAI’s GPT-4.0 API (OpenAI, 2023), we paraphrased incident descriptions into detailed accounts of the AI uses involved (third step in Figure 1). These were then structured into our predefined format. For instance, incident #264, related to an AI system that measures vehicle speeds using a mobile phone camera (Lam, 2022), was categorized as: [Domain: Law enforcement, Purpose: Documenting and reporting traffic violations from video data, Capability: Estimating vehicle speed from video data, AI user: mobile app users, AI subject: drivers].
Step 4: Reviewing and Refining. Two authors who are experts in mobile computing reviewed the formatted uses, achieving 91% agreement (fourth step in Figure 1). Minor rephrasing was needed for five uses, and two duplicates were merged, resulting in a final set of 54 applications.
Step 5: Assessing Risks and Benefits. We chose two frameworks to assess each use’s risks and benefits: the EU AI Act (European Comission, 2024) and the 17 Sustainable Development Goals (SDGs) (United Nations, 2023). The EU AI Act, the world’s first AI regulation, follows a risk-based approach (European Comission, 2024). It classifies the uses of technology based on the potential harm to society, dividing them into low-risk, high-risk, and unacceptable-risk categories, with stricter rules for higher risks. The SDGs address how technology use can impact people, planet, prosperity, peace, and partnerships (United Nations, 2023), and can be used to assess AI’s long-term impacts, both positive and negative (Cowls et al., 2021; Constantinides et al., 2024b).
With these two frameworks at hand, two experts in compliance classified the risks of each application according to the EU AI Act and evaluated their support for or potential to undermine the SDGs. The assessment identified 29 low-risk, 16 high-risk, and 9 unacceptable-risk uses, with a 90% agreement between the experts. The uses were found to support nine SDGs while potentially undermining 14, with an 85% agreement among the evaluators. For each use and SDG, the authors jointly listed one to three examples of potential risks and benefits. Discrepancies were resolved through discussions.
3.2. Visualizing the Risks and Benefits
To elucidate the risks and benefits associated with AI in mobile computing, we employed visual narrative design techniques (sixth step in Figure 1). These techniques simplify complexity and introduce information progressively (Figure 2). The resulting tool (Figure 3), a web-based application constructed with HTML5, JavaScript, and D3.js, is available online at https://social-dynamics.net/mobile-ai-risks.
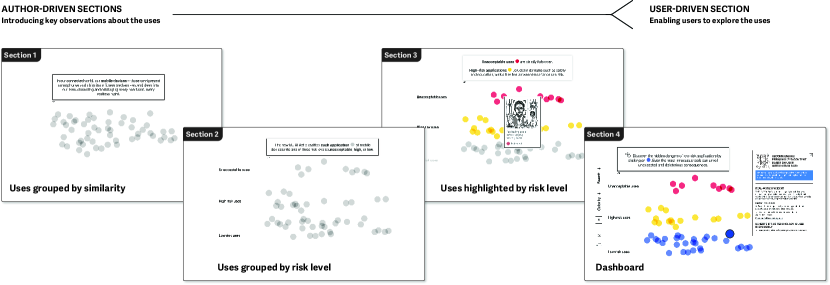
Visual Narrative Design. We structured the visualization using the Martini Glass model (Segel and Heer, 2010), which starts with guided storytelling before transitioning to user-driven exploration (Figure 2). This approach ensures that users are first introduced to key observations and then encouraged to delve deeper into the dataset on their own. The tool consists of four consecutive sections (Figure 2):
-
(1)
Introduction to Mobile Computing Technologies: The first section presents a map of AI uses in mobile computing, each represented as a dot (Franconeri et al., 2021). We utilized sentence-level BERT (SBERT) embeddings (Reimers and Gurevych, 2019) and t-distributed stochastic neighbor embedding (t-SNE) (van der Maaten and Hinton, 2008) to spatially distribute these dots based on semantic similarity.
-
(2)
Risk Levels: The second section highlights how uses of the same technology can vary in risk, illustrated through an animated transition that categorizes the dots into unacceptable, high, or low risk groups.
-
(3)
Shared Traits of Risk Groups: The third section explains the common characteristics of each risk category, emphasizing through color-coding how, despite regulations, all uses can still pose harm.
-
(4)
Interactive Dashboard: The final section introduces a dashboard that encourages users to explore the low-risk uses, revealing that even these can cause harm if poorly implemented. For instance, TikTok’s “For You” algorithm, though generally deemed low-risk, was linked to disinformation about the Ukraine war (McGregor and Lam, 2022).
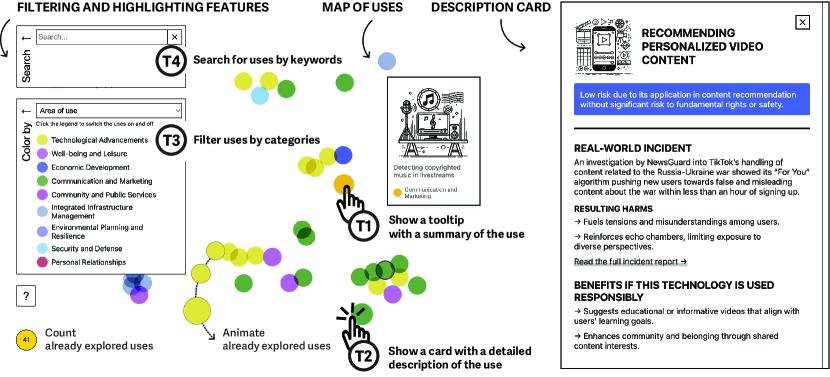
User Interface and Interaction Design. The dashboard is divided into three main parts (Figure 3), corresponding to the so-called visual information-seeking mantra (Shneiderman, 1996):
-
(1)
Overview: The central map of uses allows users to hover over or click on dots to get summaries and risk tags (Figure 3, T1).
-
(2)
Detailed Descriptions: Clicking on a dot brings up a card with a comprehensive description, including real-world incident examples and potential benefits if the use is responsibly developed (Figure 3, T2).
- (3)
Our interface design employs bold and highly contrasting colors to distinguish between various use categories, ensuring they stand out prominently (Franconeri et al., 2021). This design strategy also incorporates larger fonts and bold borders to enhance visibility, creating a clear contrast between interactive elements and the background.
4. Discussion and Conclusion
Our visualization adopts a straightforward, five-component data format, effectively communicating the risks and benefits of specific AI applications, such as voice-activated mobile controls, and illustrating the broader impact of mobile computing technology. By representing uses as countable dots, grouped by similarities and distinguished by risk levels, we simplify complex AI relationships for a wide audience, including those with limited numeracy and AI literacy (Franconeri et al., 2021).
The dual narrative approach—combining author-driven and user-driven elements—enables us to educate and empower diverse groups within the general public. For instance, in educational settings, our visualization can teach students about AI’s ethical considerations and societal impacts (Feffer et al., 2023). In corporate environments, it can guide technology deployment strategies, ensuring employees understand both the advantages and potential hazards of AI (Constantinides and Quercia, 2022). In research contexts, it can showcase the community’s contributions to the field by, for example, extracting uses from academic papers and creating conference dashboards (Moon and Rodighiero, 2020; Gómez, 2024).
Ultimately, our goal is to foster proactive discussions about mobile technology, weighing both its risks and benefits.
References
- (1)
- AIAAIC (2023) AIAAIC. 2023. AI, Algorithmic, and Automation Incidents and Controversies (AIAAIC) Repository. https://www.aiaaic.org/aiaaic-repository
- Aseniero et al. (2020) Bon Adriel Aseniero, Marios Constantinides, Sagar Joglekar, Ke Zhou, and Daniele Quercia. 2020. MeetCues: Supporting online meetings experience. In 2020 IEEE Visualization Conference (VIS). IEEE, 236–240.
- AVID (2022) AVID. 2022. AI Vulnerability Database. https://avidml.org/database/
- Bellamy et al. (2018) Rachel K.E. Bellamy, Kuntal Dey, Michael Hind, Samuel C. Hoffman, et al. 2018. AI Fairness 360: An Extensible Toolkit for Detecting, Understanding, and Mitigating Unwanted Algorithmic Bias. https://arxiv.org/abs/1810.01943
- Buçinca et al. (2023) Zana Buçinca, Chau Minh Pham, Maurice Jakesch, Marco Tulio Ribeiro, Alexandra Olteanu, and Saleema Amershi. 2023. AHA!: Facilitating AI Impact Assessment by Generating Examples of Harms. arXiv preprint arXiv:2306.03280 (2023).
- Choi et al. (2021) Jun-Ho Choi, Marios Constantinides, Sagar Joglekar, and Daniele Quercia. 2021. KAIROS: Talking heads and moving bodies for successful meetings. In Proceedings of the 22nd International Workshop on Mobile Computing Systems and Applications. 30–36.
- Ciolacu et al. (2019) Monica Ionita Ciolacu, Leon Binder, Paul Svasta, Ioan Tache, and Dan Stoichescu. 2019. Education 4.0 – Jump to innovation with IoT in Higher Education. In 2019 IEEE 25th International Symposium for Design and Technology in Electronic Packaging (SIITME). IEEE, 135–141.
- Constantinides et al. (2024a) Marios Constantinides, Edyta Bogucka, Daniele Quercia, Susanna Kallio, and Mohammad Tahaei. 2024a. RAI Guidelines: Method for Generating Responsible AI Guidelines Grounded in Regulations and Usable by (Non-)Technical Roles. Proceedings of the ACM on Human-Computer Interaction CSCW (2024), 1–28.
- Constantinides et al. (2024b) Marios Constantinides, Edyta Bogucka, Sanja Scepanovic, and Daniele Quercia. 2024b. Good Intentions, Risky Inventions: A Method for Assessing the Risks and Benefits of AI in Mobile and Wearable Uses. Proceedings of the ACM on Human-Computer Interaction 8, MHCI (2024), 1–30.
- Constantinides et al. (2018) Marios Constantinides, Jonas Busk, Aleksandar Matic, Maria Faurholt-Jepsen, Lars Vedel Kessing, and Jakob E. Bardram. 2018. Personalized versus generic mood prediction models in bipolar disorder. In Proceedings of the 2018 ACM International Joint Conference and 2018 International Symposium on Pervasive and Ubiquitous Computing and Wearable Computers. 1700–1707.
- Constantinides and Quercia (2022) Marios Constantinides and Daniele Quercia. 2022. Good Intentions, Bad Inventions: How Employees Judge Pervasive Technologies in the Workplace. IEEE Pervasive Computing 22, 1 (2022), 69–76.
- Constantinides et al. (2020) Marios Constantinides, Sanja Šćepanović, Daniele Quercia, Hongwei Li, Ugo Sassi, and Michael Eggleston. 2020. ComFeel: Productivity is a matter of the senses too. Proceedings of the ACM on Interactive, Mobile, Wearable and Ubiquitous Technologies 4, 4 (2020), 1–21.
- Cowls et al. (2021) Josh Cowls, Andreas Tsamados, Mariarosaria Taddeo, and Luciano Floridi. 2021. A definition, benchmark and database of AI for social good initiatives. Nature Machine Intelligence 3, 2 (Feb. 2021), 111–115. https://doi.org/10.1038/s42256-021-00296-0
- Das Swain et al. (2023) Vedant Das Swain, Lan Gao, William A. Wood, Srikruthi C. Matli, Gregory D. Abowd, and Munmun De Choudhury. 2023. Algorithmic Power or Punishment: Information Worker Perspectives on Passive Sensing Enabled AI Phenotyping of Performance and Wellbeing. In Proceedings of the 2023 CHI Conference on Human Factors in Computing Systems. 1–17.
- Dwork (2008) Cynthia Dwork. 2008. Differential privacy: A survey of results. In International conference on theory and applications of models of computation. Springer, 1–19. https://doi.org/10.1007/978-3-540-79228-4_1
- European Comission (2024) European Comission. 2024. Regulation of the European Parliament and of the Council on laying down harmonised rules on artificial intelligence and amending Regulations (EC) No 300/2008, (EU) No 167/2013, (EU) No 168/2013, (EU) 2018/858, (EU) 2018/1139 and (EU) 2019/2144 and Directives 2014/90/EU, (EU) 2016/797 and (EU) 2020/1828 (Artificial Intelligence Act). Retrieved June 13, 2024 from https://www.europarl.europa.eu/doceo/document/TA-9-2024-0138-FNL-COR01_EN.pdf
- Feffer et al. (2023) Michael Feffer, Nikolas Martelaro, and Hoda Heidari. 2023. The AI Incident Database as an Educational Tool to Raise Awareness of AI Harms: A Classroom Exploration of Efficacy, Limitations, and Future Improvements. In Proceedings of the 3rd ACM Conference on Equity and Access in Algorithms, Mechanisms, and Optimization. 1–11.
- Franconeri et al. (2021) Steven L. Franconeri, Lace M. Padilla, Priti Shah, Jeffrey M. Zacks, and Jessica Hullman. 2021. The Science of Visual Data Communication: What Works. Psychological Science in the Public Interest 22, 3 (2021), 110–161. https://doi.org/10.1177/15291006211051956 arXiv:https://doi.org/10.1177/15291006211051956 PMID: 34907835.
- Golpayegani et al. (2023) Delaram Golpayegani, Harshvardhan J. Pandit, and Dave Lewis. 2023. To Be High-Risk, or Not To Be–Semantic Specifications and Implications of the AI Act’s High-Risk AI Applications and Harmonised Standards. In Proceedings of the 2023 ACM Conference on Fairness, Accountability, and Transparency (FAccT ’23). ACM, 905–915. https://doi.org/10.1145/3593013.3594050
- Gómez (2024) John Alexis Guerra Gómez. 2024. CHI 2024 Papers Explorer. Retrieved June 8, 2024 from https://johnguerra.co/viz/chi2024Papers
- Haris et al. (2014) Muhammad Haris, Hamed Haddadi, and Pan Hui. 2014. Privacy leakage in mobile computing: Tools, methods, and characteristics. arXiv preprint arXiv:1410.4978 (2014).
- Hong et al. (2020) Sungsoo Ray Hong, Jessica Hullman, and Enrico Bertini. 2020. Human Factors in Model Interpretability: Industry Practices, Challenges, and Needs. Proc. ACM Hum.-Comput. Interact. 4, CSCW1, Article 68 (may 2020), 26 pages. https://doi.org/10.1145/3392878
- IBM watsonx (2023) IBM watsonx. 2023. AI Risk Atlas. Retrieved November 8, 2023 from https://dataplatform.cloud.ibm.com/docs/content/wsj/ai-risk-atlas/ai-risk-atlas.html?context=wx
- IEEE VIS (2018) IEEE VIS. 2018. Workshop on Visualization for AI Explainability. Retrieved December 2023 from https://visxai.io/2023.html
- Kelly (2014) Heather Kelly. 2014. Fitbit recalls activity tracker due to skin rashes. CNN. https://edition.cnn.com/2014/02/21/tech/gaming-gadgets/fitbit-force-recall/
- Lam (2022) Khoa Lam. 2022. AI-Based Vehicle Speed Estimation App Denounced by UK Drivers as Surveillance Technology. Retrieved June 28, 2024 from https://incidentdatabase.ai/cite/264/
- Luccioni et al. (2021) Alexandra Luccioni, Victor Schmidt, Vahe Vardanyan, and Yoshua Bengio. 2021. Using Artificial Intelligence to Visualize the Impacts of Climate Change. IEEE Computer Graphics and Applications 41, 1 (2021), 8–14. https://doi.org/10.1109/MCG.2020.3025425
- McGregor (2021) Sean McGregor. 2021. Preventing repeated real world AI failures by cataloging incidents: The AI Incident Database. In Proceedings of the AAAI Conference on Artificial Intelligence, Vol. 35. 15458–15463.
- McGregor and Lam (2022) Sean McGregor and Khoa Lam. 2022. TikTok’s ”For You” Algorithm Directed New Users towards Disinformation about the War in Ukraine. Retrieved June 28, 2024 from https://incidentdatabase.ai/cite/185
- McMahan et al. (2017) Brendan McMahan, Eider Moore, Daniel Ramage, Seth Hampson, and Blaise Aguera y Arcas. 2017. Communication-efficient learning of deep networks from decentralized data. In Artificial intelligence and statistics. PMLR, 1273–1282. https://proceedings.mlr.press/v54/mcmahan17a/mcmahan17a.pdf
- Microsoft (2022) Microsoft. 2022. Microsoft’s framework for building AI systems responsibly. Retrieved January 22, 2024 from https://blogs.microsoft.com/on-the-issues/2022/06/21/microsofts-framework-for-building-ai-systems-responsibly/
- Mills et al. (2016) Adam J. Mills, Richard T Watson, Leyland Pitt, and Jan Kietzmann. 2016. Wearing safe: Physical and informational security in the age of the wearable device. Business Horizons 59, 6 (2016), 615–622.
- Mirjafari et al. (2019) Shayan Mirjafari, Kizito Masaba, Ted Grover, Weichen Wang, Pino Audia, Andrew T. Campbell, Nitesh V. Chawla, Vedant Das Swain, Munmun De Choudhury, Anind K. Dey, et al. 2019. Differentiating higher and lower job performers in the workplace using mobile sensing. Proceedings of the ACM on Interactive, Mobile, Wearable and Ubiquitous Technologies 3, 2 (2019), 1–24.
- MITRE ATLAS (2022) MITRE ATLAS. 2022. Adversarial Threat Landscape for Artificial-Intelligene Systems (MITRE) ATLAS. https://atlas.mitre.org/studies
- Moon and Rodighiero (2020) Chloe Ye Eun Moon and Dario Rodighiero. 2020. Mapping as a Contemporary Instrument for Orientation in Conferences. https://api.semanticscholar.org/CorpusID:244991909
- OECD, Patrick J. McGovern Foundation (2024) OECD, Patrick J. McGovern Foundation. 2024. The AI Incidents Monitor (AIM). https://oecd.ai/en/incidents-methodology
- Ojewale et al. (2024) Victor Ojewale, Ryan Steed, Briana Vecchione, Abeba Birhane, and Inioluwa Deborah Raji. 2024. Towards AI Accountability Infrastructure: Gaps and Opportunities in AI Audit Tooling. arXiv preprint arXiv:2402.17861 (2024).
- OpenAI (2023) OpenAI. 2023. Research on GPT-4 - latest updates. Retrieved August 7, 2023 from https://openai.com/research/gpt-4
- Park et al. (2023) Sungkyu Park, Assem Zhunis, Marios Constantinides, Luca Maria Aiello, Daniele Quercia, and Meeyoung Cha. 2023. Social dimensions impact individual sleep quantity and quality. Scientific Reports 13, 1 (2023), 1–11.
- Perez-Pozuelo et al. (2021) Ignacio Perez-Pozuelo, Dimitris Spathis, Emma A.D. Clifton, and Cecilia Mascolo. 2021. Wearables, smartphones, and artificial intelligence for digital phenotyping and health. In Digital Health. Elsevier, 33–54.
- Reimers and Gurevych (2019) Nils Reimers and Iryna Gurevych. 2019. Sentence-BERT: Sentence Embeddings using Siamese BERT-Networks. In Proceedings of the 2019 Conference on Empirical Methods in Natural Language Processing and the 9th International Joint Conference on Natural Language Processing (EMNLP-IJCNLP). 3982–3992. https://doi.org/10.18653/v1/D19-1410
- Robust Intelligence (2023) Robust Intelligence. 2023. AI Risk Databases. Retrieved January 8, 2024 from https://airisk.io
- Saraswat et al. (2022) Deepti Saraswat, Pronaya Bhattacharya, Ashwin Verma, Vivek Kumar Prasad, Sudeep Tanwar, Gulshan Sharma, Pitshou N. Bokoro, and Ravi Sharma. 2022. Explainable AI for Healthcare 5.0: Opportunities and Challenges. IEEE Access (2022).
- Segel and Heer (2010) Edward Segel and Jeffrey Heer. 2010. Narrative Visualization: Telling Stories with Data. IEEE Transactions on Visualization and Computer Graphics 16, 6 (2010), 1139–1148. https://doi.org/10.1109/TVCG.2010.179
- Shneiderman (1996) B. Shneiderman. 1996. The eyes have it: a task by data type taxonomy for information visualizations. In Proceedings 1996 IEEE Symposium on Visual Languages. 336–343. https://doi.org/10.1109/VL.1996.545307
- Stahl et al. (2023) Bernd Carsten Stahl, Josephina Antoniou, Nitika Bhalla, Laurence Brooks, Philip Jansen, Blerta Lindqvist, Alexey Kirichenko, Samuel Marchal, Rowena Rodrigues, Nicole Santiago, Zuzanna Warso, and David Wright. 2023. A systematic review of artificial intelligence impact assessments. Artificial Intelligence Review 56, 11 (2023), 12799–12831. https://doi.org/10.1007/s10462-023-10420-8
- Subramonyam and Hullman (2024) H. Subramonyam and J. Hullman. 2024. Are We Closing the Loop Yet? Gaps in the Generalizability of VIS4ML Research. IEEE Transactions on Visualization and Computer Graphics 30, 01 (jan 2024), 672–682. https://doi.org/10.1109/TVCG.2023.3326591
- United Nations (2023) United Nations. 2023. The 17 Sustainable Development Goals. Retrieved November 8, 2023 from https://sdgs.un.org/goals
- van der Maaten and Hinton (2008) Laurens van der Maaten and Geoffrey Hinton. 2008. Visualizing Data using t-SNE. Journal of Machine Learning Research 9, 86 (2008), 2579–2605. http://jmlr.org/papers/v9/vandermaaten08a.html
- Van Koningsbruggen et al. (2024) Rosa Van Koningsbruggen, Luke Haliburton, Beat Rossmy, Ceenu George, Eva Hornecker, and Bart Hengeveld. 2024. Metaphors and ‘Tacit’ Data: the Role of Metaphors in Data and Physical Data Representations. In Proceedings of the Eighteenth International Conference on Tangible, Embedded, and Embodied Interaction (Cork, Ireland) (TEI ’24). Association for Computing Machinery, New York, NY, USA, Article 7, 17 pages. https://doi.org/10.1145/3623509.3633355
- Wei and Zhou (2023) Mengyi Wei and Zhixuan Zhou. 2023. AI Ethics Issues in Real World: Evidence from AI Incident Database. In Proceedings of the 56th Hawaii International Conference on System Sciences (HICSS). Hawaii International Conference on System Sciences. https://doi.org/10.24251/hicss.2023.602
- Zelenka et al. (2021) Natalie Zelenka, Nina Di Cara, Huw Day, et al. 2021. Data Hazard Labels. Retrieved March 12, 2024 from https://datahazards.com/index.html
- Zhou et al. (2023) Ke Zhou, Marios Constantinides, Daniele Quercia, and Sanja Šćepanović. 2023. How Circadian Rhythms Extracted From Social Media Relate to Physical Activity and Sleep. In Proceedings of the International AAAI Conference on Web and Social Media, Vol. 17. 948–959.