The FAST Hi 21-cm absorption blind survey.
II – statistic exploration for associated and intervening systems
Abstract
We present an extragalactic Hi 21-cm absorption lines catalog from a blind search at z 0.35, using drift-scan data collected in 1616.9 hours by the ongoing Commensal Radio Astronomy FasT Survey (CRAFTS) and FAST All Sky Hi Survey (FASHI), which spans a sky area of 7456.8 deg2 and covers 84533 radio sources with a flux density greater than 12 mJy. 14 previously identified Hi absorbers and 20 newly discovered Hi absorbers were detected, comprising 14 associated systems, 11 intervening systems, and 9 systems with undetermined classifications. We fit Hi profiles with multi-components Gaussian functions, and calculate the redshift, width, flux density, optical depth and Hi column densities for each source. Through spectral stacking, the mean peak optical path, mean velocity-integrated optical path , mean FWHM and mean Hi column density N are measured to be 0.46 and 0.34; 25.85 and 4.62 ; 39.80 and 8.95 ; 0.470 and 0.085 T 1020cm-2K-1, for the associated and intervening samples, respectively. Statistical analysis also reveals that associated systems tend to be hosted by red (gr0.7) galaxies at lower redshifts, whereas galaxies hosting intervening Hi absorption are typically found at higher redshifts and are of a bluer (gr0.7) type. Additionally, it has been demonstrated that associated Hi 21-cm absorption connected to compact radio sources display higher N values compared to those linked with extended radio sources.
1 Introduction
The Hi 21-cm absorption lines are spectral features that arise from foreground gas absorbing the flux of a background bright radio source. Since the detectability of Hi absorption depends only on the column density of foreground gas and the strength of background radio sources, it could be a complement to the observation of Hi emission at higher redshifts. Hi absorption is an excellent tool to measure Hi content and constrain redshift-evolution of at intermediate redshifts , probe physical conditions in ISM (Heiles & Troland, 2003; Wolfire et al., 2003; Morganti & Oosterloo, 2018), trace mergers and interactions of galaxies (Dutta et al., 2018; Varenius et al., 2017), reveal evolution history of SFR density (Curran, 2017; Dutta, 2019), place stringent constraints on variation of fundamental constants of physics (Rahmani et al., 2012) and provide direct proof of cosmic acceleration (Darling, 2012; Yu et al., 2014; Kloeckner et al., 2015; Jiao et al., 2020; Lu et al., 2023).
In the study of Hi absorption systems, there are two primary categories. The first is the (source) associated absorption system, where the gas absorbing the light is located in the same extragalactic object (often an Active Galactic Nucleus, or AGN) that emits the bright continuum. Research in this area primarily focuses on the AGN itself and its interaction with Interstellar Medium (ISM) in the same extragalactic object. This research includes examining the kinematics and structure of the ISM in galaxies hosting AGNs and exploring how Hi gas might fuel supermassive black holes (SMBH).
The second category is known as the intervening absorption system, which occurs when gas in a foreground galactic or extragalactic object absorbs light from a bright, unrelated background source. These systems are commonly used to study ISM properties of both Galaxy and distant galaxies. A significant portion of post-reionization universe’s neutral hydrogen is found in the Damped Lyman-alpha systems (DLAs, ; (Wolfe et al., 2005)), observed in absorption lines of optical quasi-stellar objects (QSOs). However, the bright light from the background QSOs blinds the direct study of DLAs themselves. Despite extensive research, the precise physical nature of DLAs remains an unresolved issue (for recent work, see, e.g. Bordoloi et al. 2022).
Despite significant advances in this field, current findings are constrained by limited sample sizes and biases resulting from previously chosen targets. Conducting an unbiased large radio survey would directly tackle the DLA issue, helping to surmount these restrictions. Additionally, it would offer a more thorough understanding of the interaction between the AGN and the ISM of the host galaxy.
Due to the limitation that only Hi gas along the line of sight to the background radio source can be traced, and considering the sensitivity of the telescopes, only a small number of Hi absorption systems have been detected through blind surveys. Recently, there have been promising developments in the search for Hi absorption systems, utilizing the capabilities of advanced radio telescopes from the latest generation, including Allison et al. (2020); Su et al. (2022); Aditya et al. (2024) from the First Large Absorption Survey in Hi (FLASH; Allison et al. 2022), Gupta et al. (2021); Deka et al. (2023) from the MeerKAT Absorption Line Survey (MALS; Gupta et al. 2016), and the searches described below with FAST.
As the largest single-dish telescope in the world, FAST (Nan et al., 2011; Jiang et al., 2020) is equipped with a multibeam feed system and low-noise cryogenic receivers, ideal for conducting large blind Hi absorption surveys. Zhang et al. (2021) observed five Hi absorption systems that were previously identified in the 40 data release of the ALFALFA survey, with much higher spectral resolution and signal-to-noise ratio () than those obtained in previous searches, demonstrating the power of FAST in revealing detailed structures of Hi absorption lines. Zheng et al. (2020) carried out an OH absorption survey towards eight associated and one intervening Hi absorbers at redshifts of z [0.1919, 0.2241] using FAST, and constrained the OH-to-Hi relative abundance ([OH]/[HI]) to be 5.45 . Thanks to the high sensitivity of FAST, Kang et al. (2023) investigated the Hi absorption spectrum of PKS 1413+135, starting the first observational experiment to illustrate the cosmic acceleration by the direct measurement of time evolution of the redshift of Hi 21cm absorption. Yu et al. (2023) reported the discovery of three Hi absorbers toward low-power AGNs.
In Hu et al. (2023, hereafter Paper I), we carried out a purely blind Hi absorption survey in the 1300-1450 MHz band of 3155 deg2 CRAFTS data. Three known associated absorbers (UGC 00613, 3C 293 and 4C +27.14) and two new absorbers (NVSS J231240-052547 and NVSS J053118+315412) were detected. The search technique detailed in Paper I was then extended to a broader range of CRAFTS (Li et al., 2018) and FASHI (Zhang et al., 2024) data, leading to a discovery of an increased number of Hi 21cm absorption features.
In this paper, we report the largest 21cm-selected sample of Hi absorption from a purely blind search in the 1050-1450 MHz band in the sky covered by the CRAFTS and FASHI (1616.9 hours and 7456.8 deg2). Another 11 known Hi absorbers and 18 new Hi absorbers are found using our search pipeline. Combined with Paper I, a sample of 34 21cm-selected Hi absorption systems is obtained. We made a comprehensive statistical study for the intervening and associated absorption.
This paper is organized as follows: Section 2 describes the survey data and follow-up observation used in this work. We summarize data processing, candidate selection method and Hi absorption measuring method in Section 3. The physical properties of confirmed Hi absorption are presented in Section 4. Section 5 statistically studies the characters of associated and intervening absorption systems. We discuss the comoving absorption path and statistic completeness in Section 6. In Section 7 a summary of this work is presented. Throughout this paper we use H km s-1 Mpc-1, and .
2 Data
2.1 Radio Data
2.1.1 CRAFTS
CRAFTS is a multi-purpose drift-scan survey that aims to observe galactic and extragalactic Hi emissions, measure continuum signals, and search for new pulsars and fast radio bursts (FRB). The survey uses the FAST L-band Array of 19 feed-horns (FLAN, Dunning et al. (2017)) covering the frequency band from 1050 MHz to 1450 MHz. CRAFTS drift scans started in early 2020 with the 19-beam feed rotated by 23.4° to achieve a super-Nyquist sampling while drifting. Two-pass drift scans are planned to be made and over 22000 deg2 within a declination (DEC) range between and will be covered. Limited by allocated time, there is only one survey pass at present.
2.1.2 FASHI
FASHI is a comprehensive observational initiative designed to map the sky accessible by FAST, encompassing an area of about 22,000 square degrees within declinations from to and frequencies between 1050 and 1450 MHz. The primary objective of FASHI is to conduct a detailed survey of Hi gas in the nearby universe, with an additional goal to catalog at least 100,000 Hi galaxies. The survey employed a strategy of fixing declination and conducting drift scans throughout the project. From August 2020 to June 2023, FASHI successfully surveyed over 7,600 square degrees, achieving a median sensitivity of approximately 0.76 mJy beam-1 and a spectral line velocity resolution of about 6.4 at 1.4 GHz. In their findings, Zhang et al. (2024) reported the detection of 41,741 extragalactic Hi sources within the frequency range of 1305.51419.5 MHz, which corresponds to a redshift limit of z 0.09.
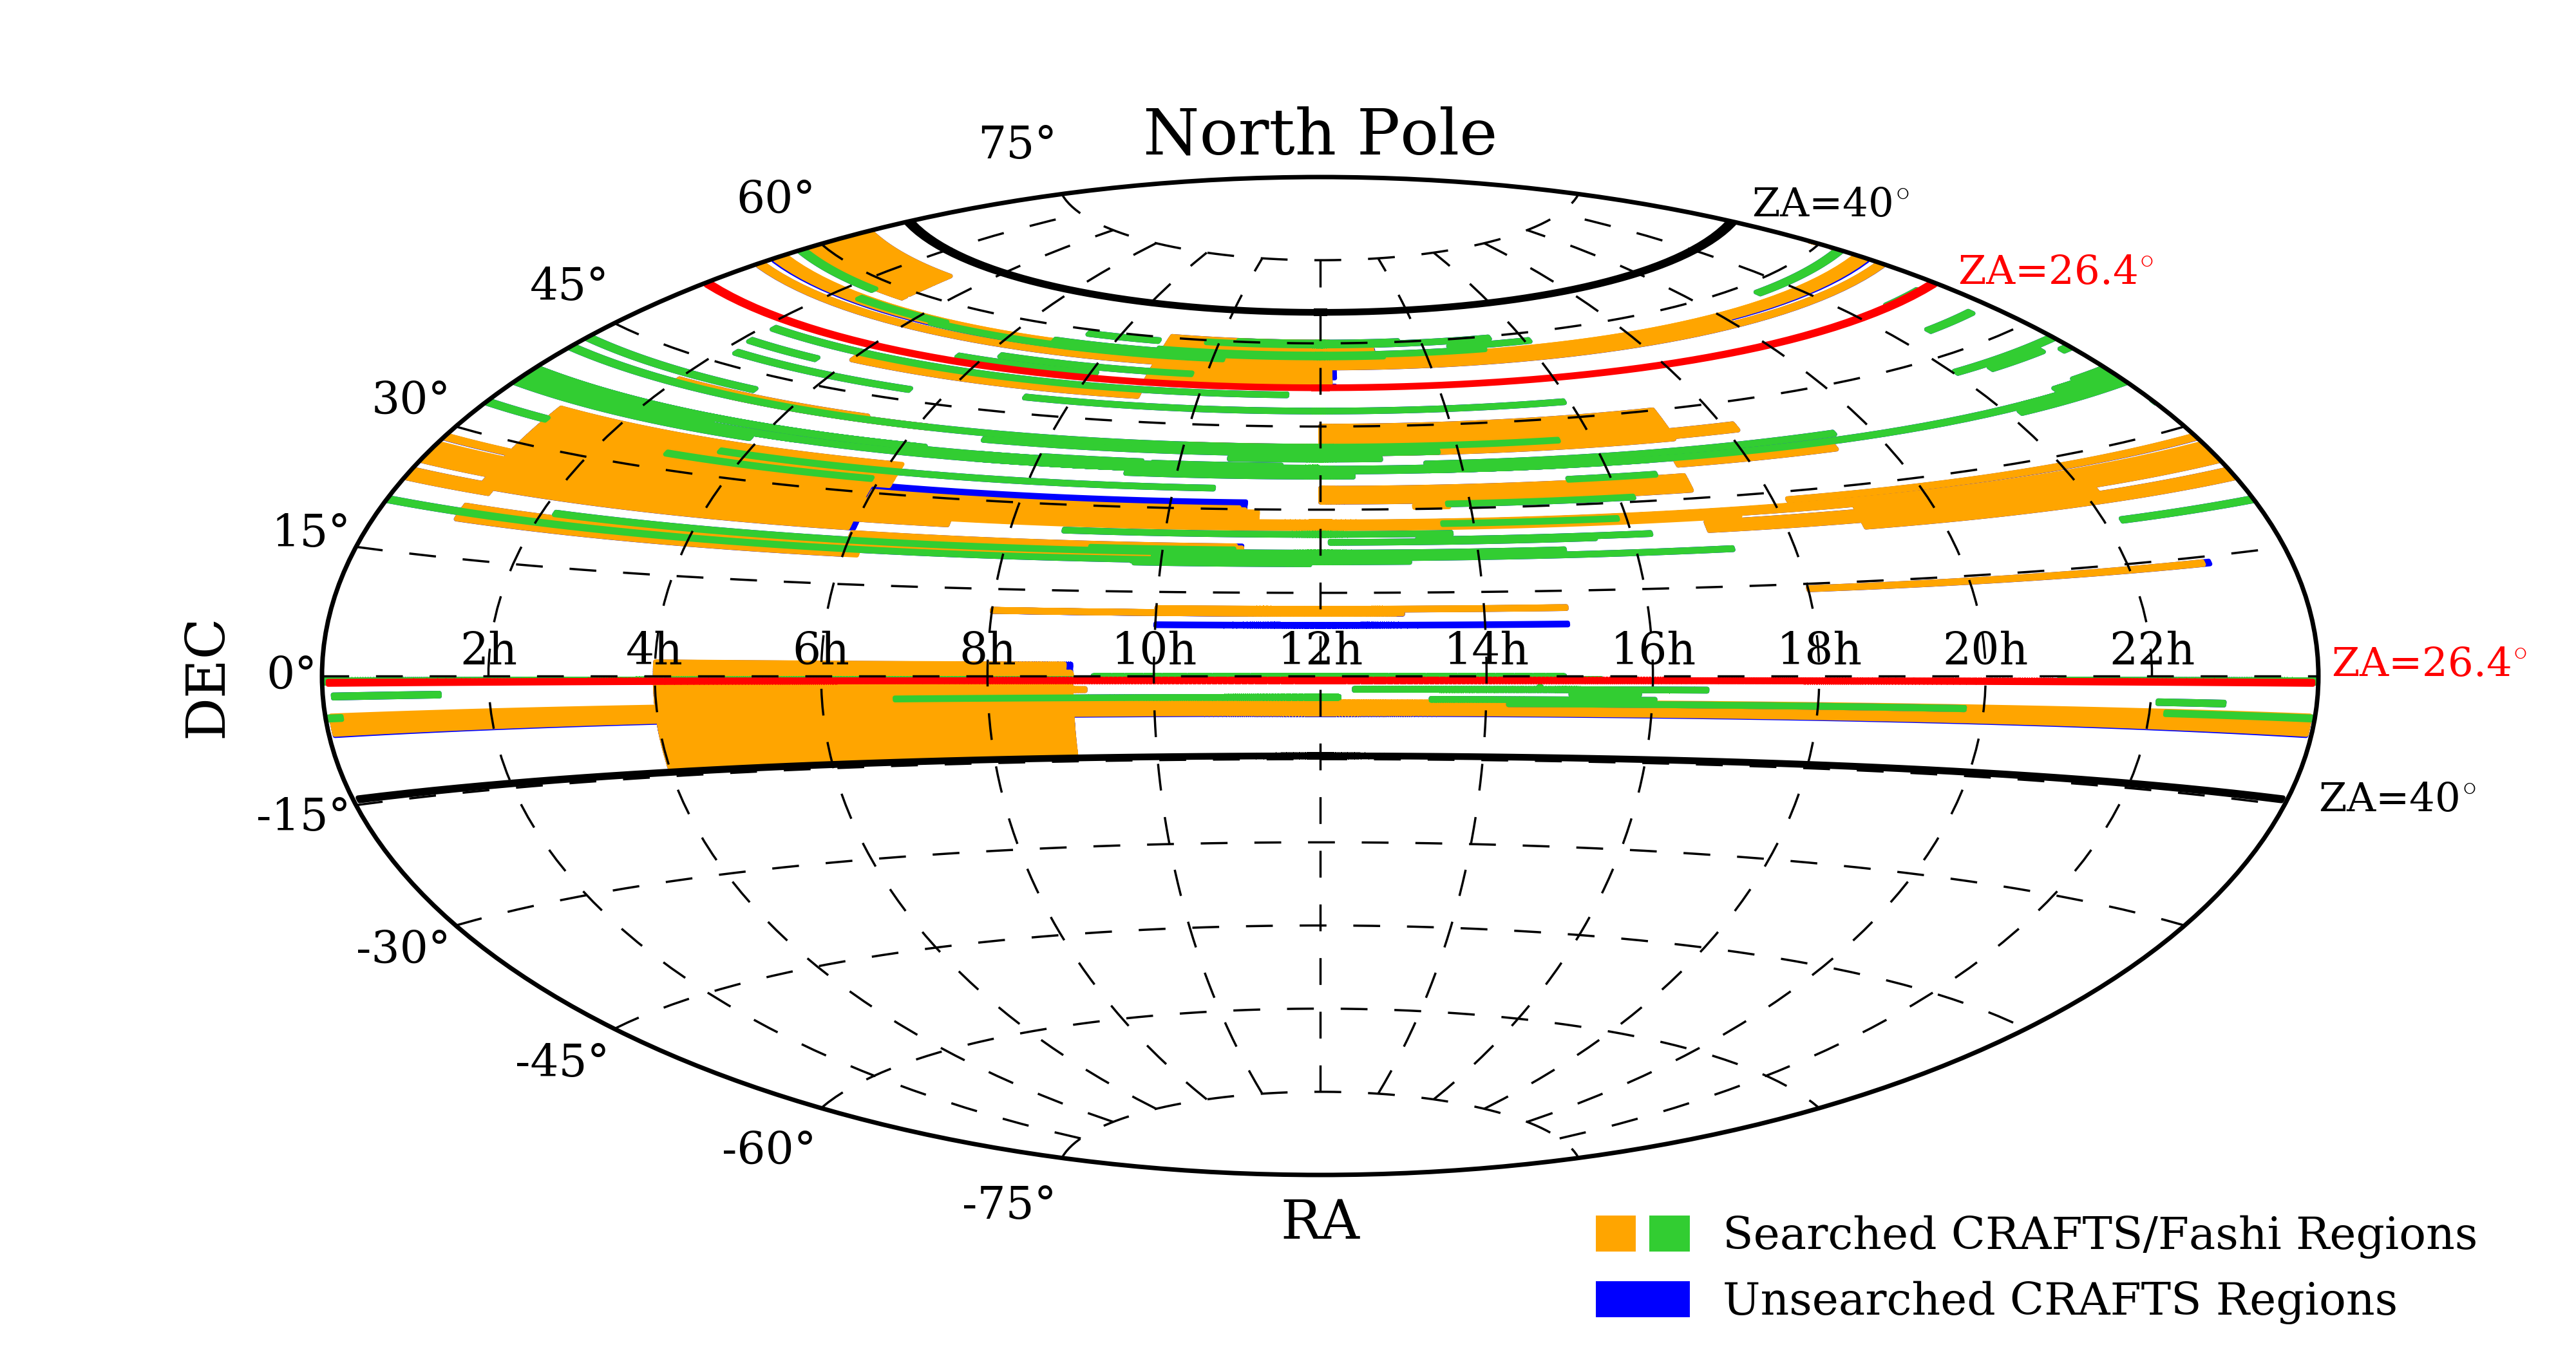
As of August 29, 2023, our search has been conducted in part of the CRAFTS and FASHI regions, marked by the orange and green labels in Figure 1. 111Further information about the finished scans can be found in http://groups.bao.ac.cn/ism/CRAFTS/CRAFTS/.
2.1.3 Follow-up Observation
In the blind searching in CRAFTS data, a total of 34 candidates, including 14 previously known Hi absorption systems and 20 newly discovered ones are detected. All absorption systems are verified by the CRAFTS data of several neighboring beams with a high signal-to-noise ratio. To confirm the signal of these 20 first discovered candidates and obtain a more significant Hi absorption feature for known absorption systems, we made several follow-up observations with FAST from 2021 to 2023.
To suppress the fluctuations in bandpass and remove the sky signal, follow-up observations used ON-OFF tracking mode. The integration time for both the source-on and source-off observations are set as 990s. A cycle of 330s source-on followed by 330s source-off observation is repeated 3 times for each target. The data set of follow-up observations has a time resolution of 1 s, and a frequency resolution of 7.63 kHz, covering the frequency from 1050 MHz to 1450 MHz.
2.2 Infrared Data
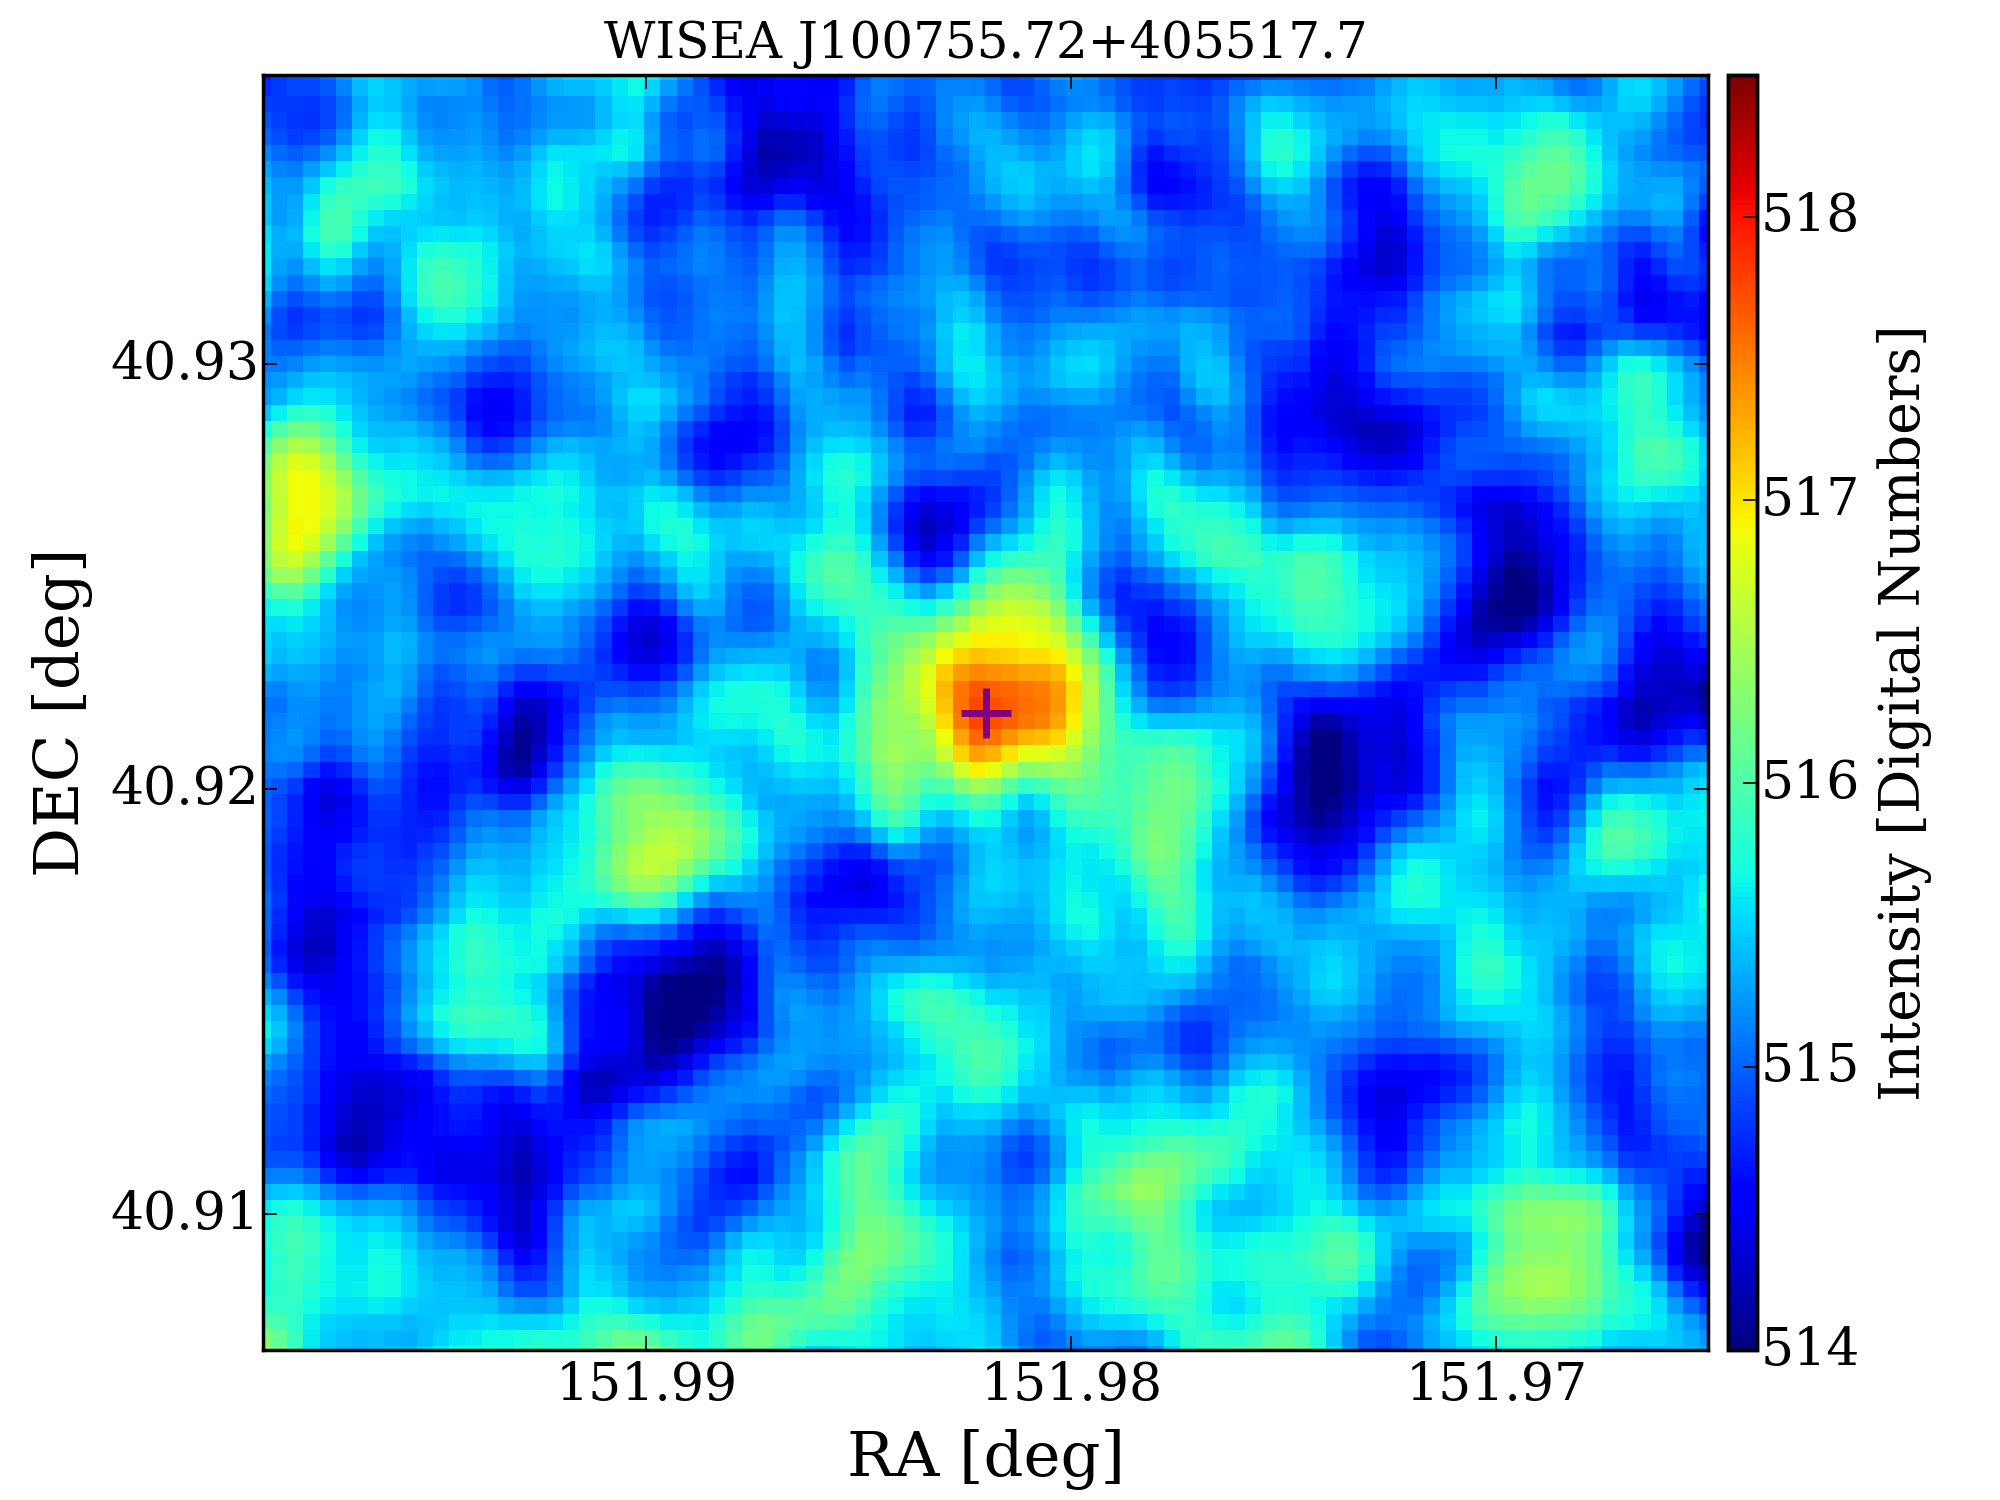
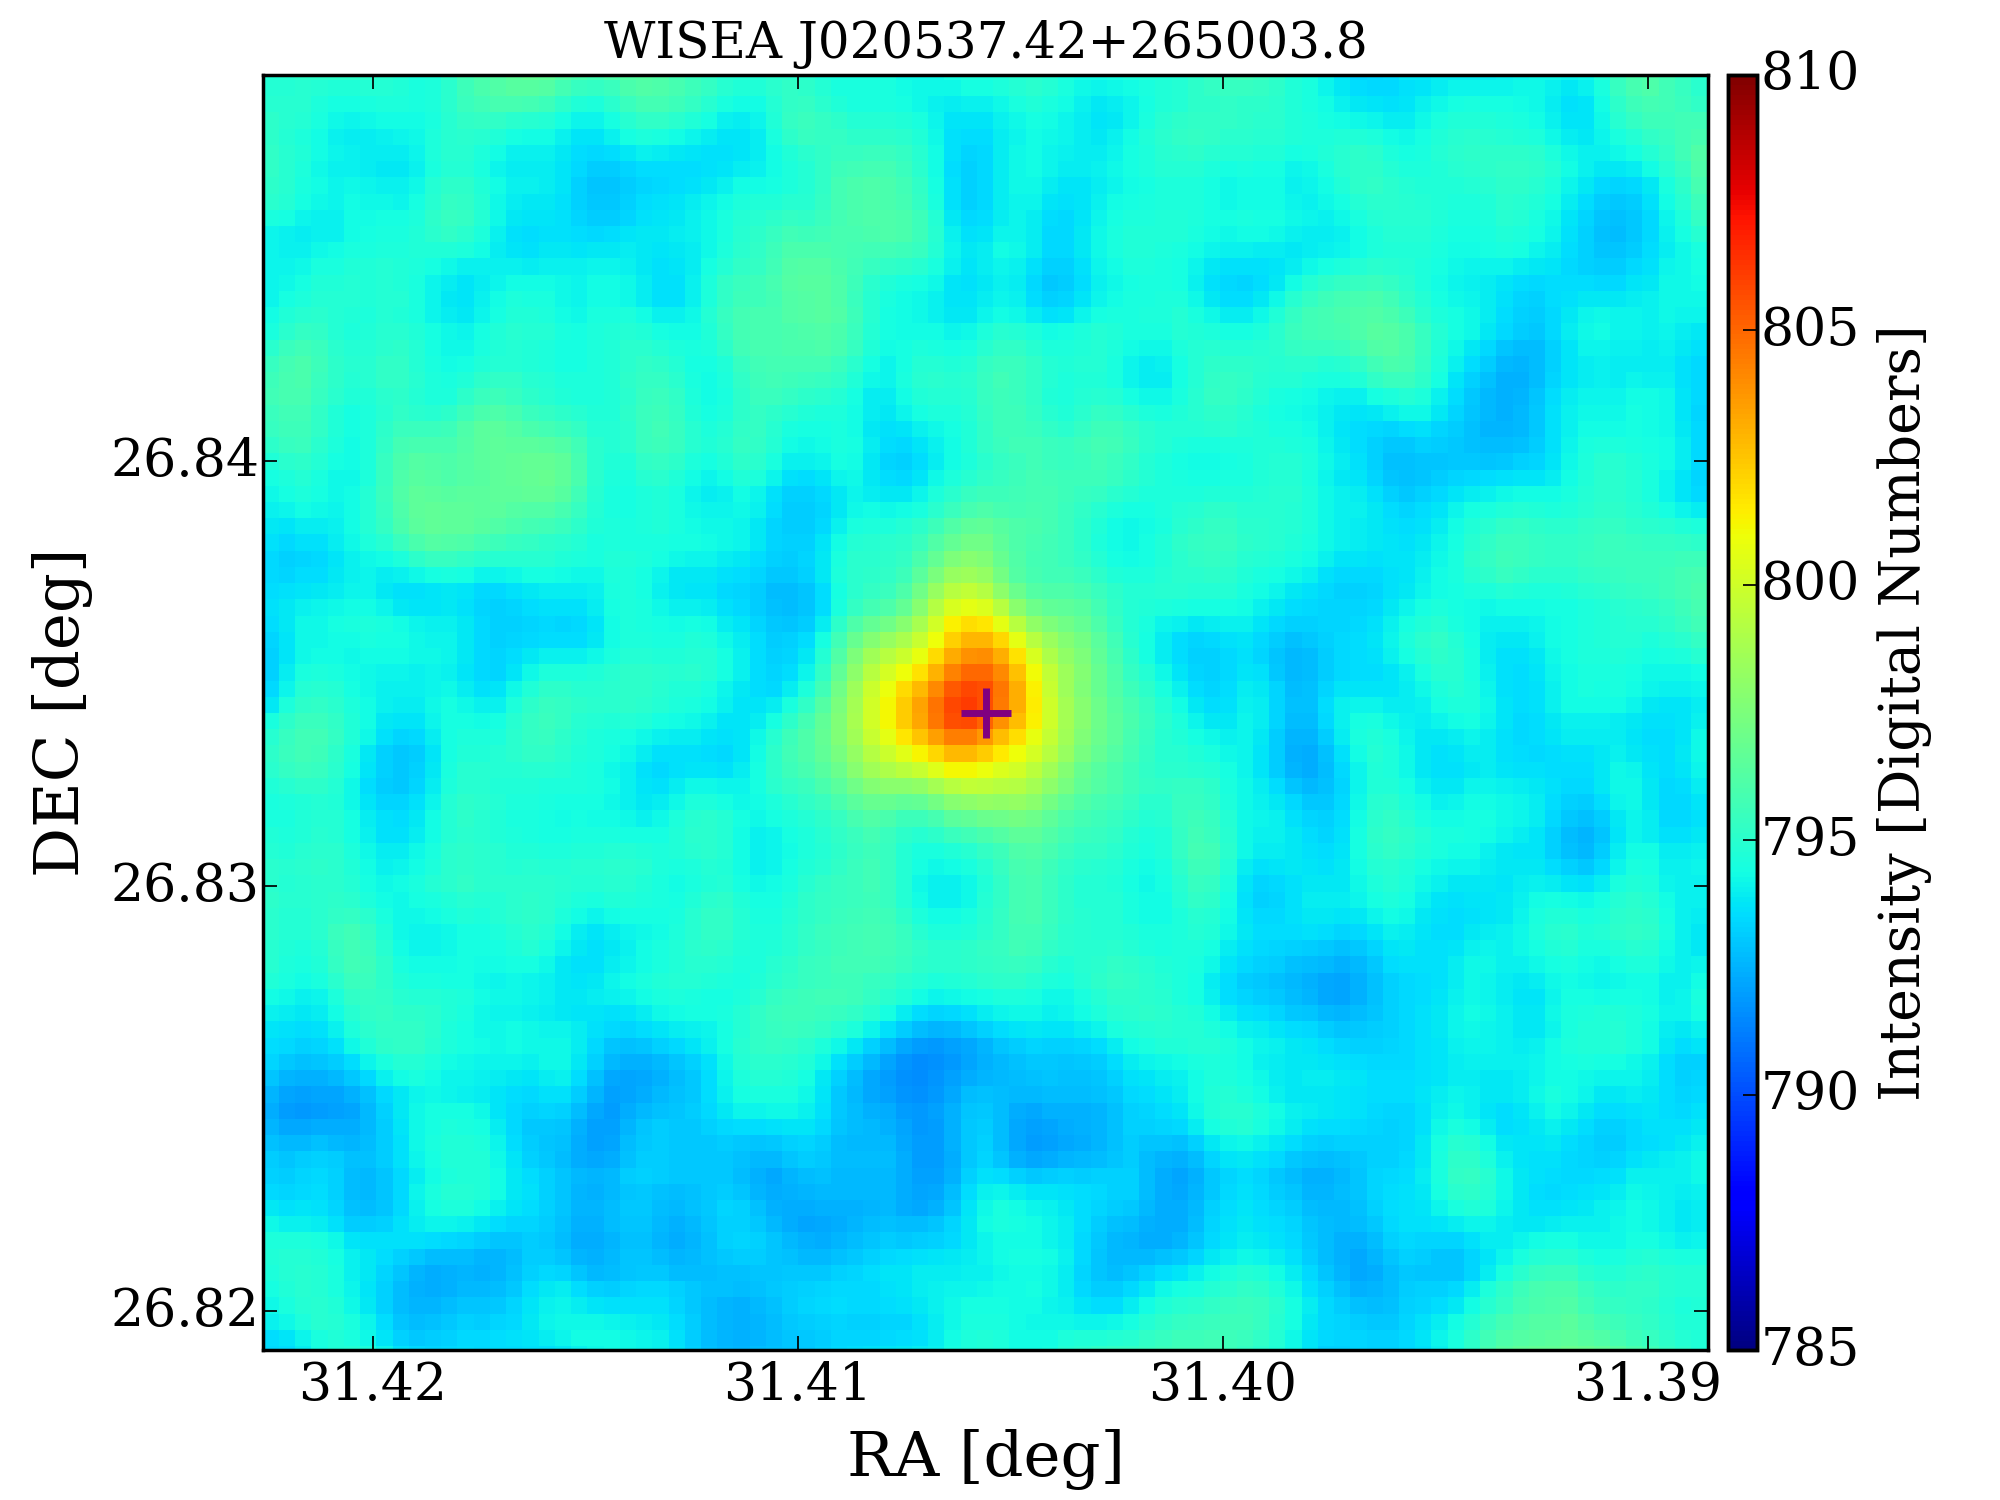
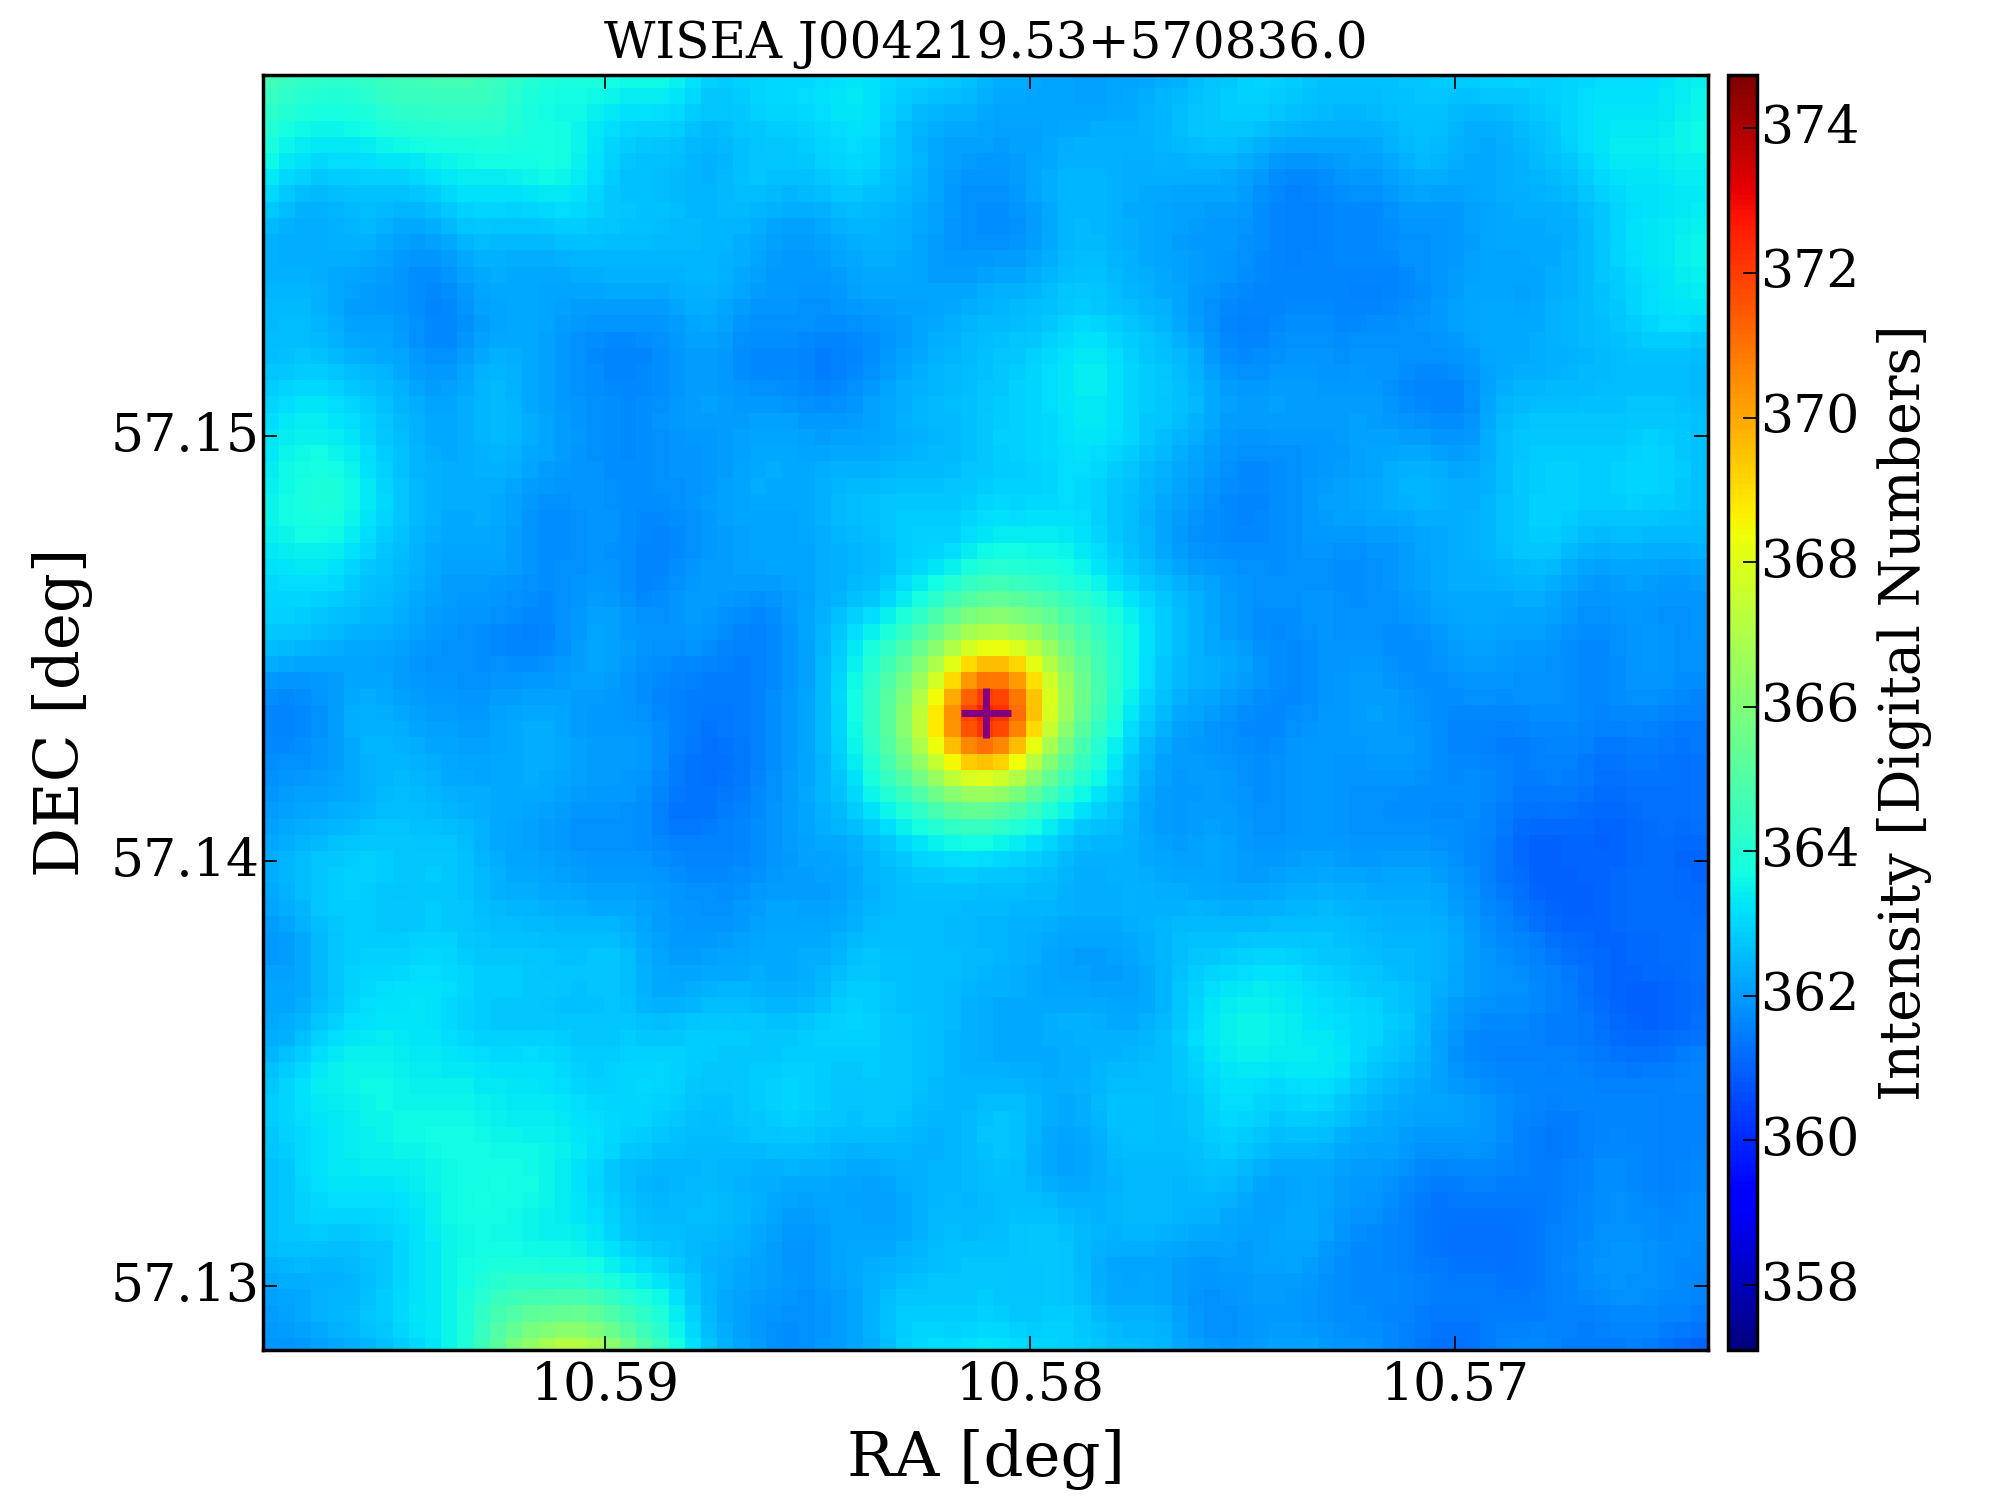
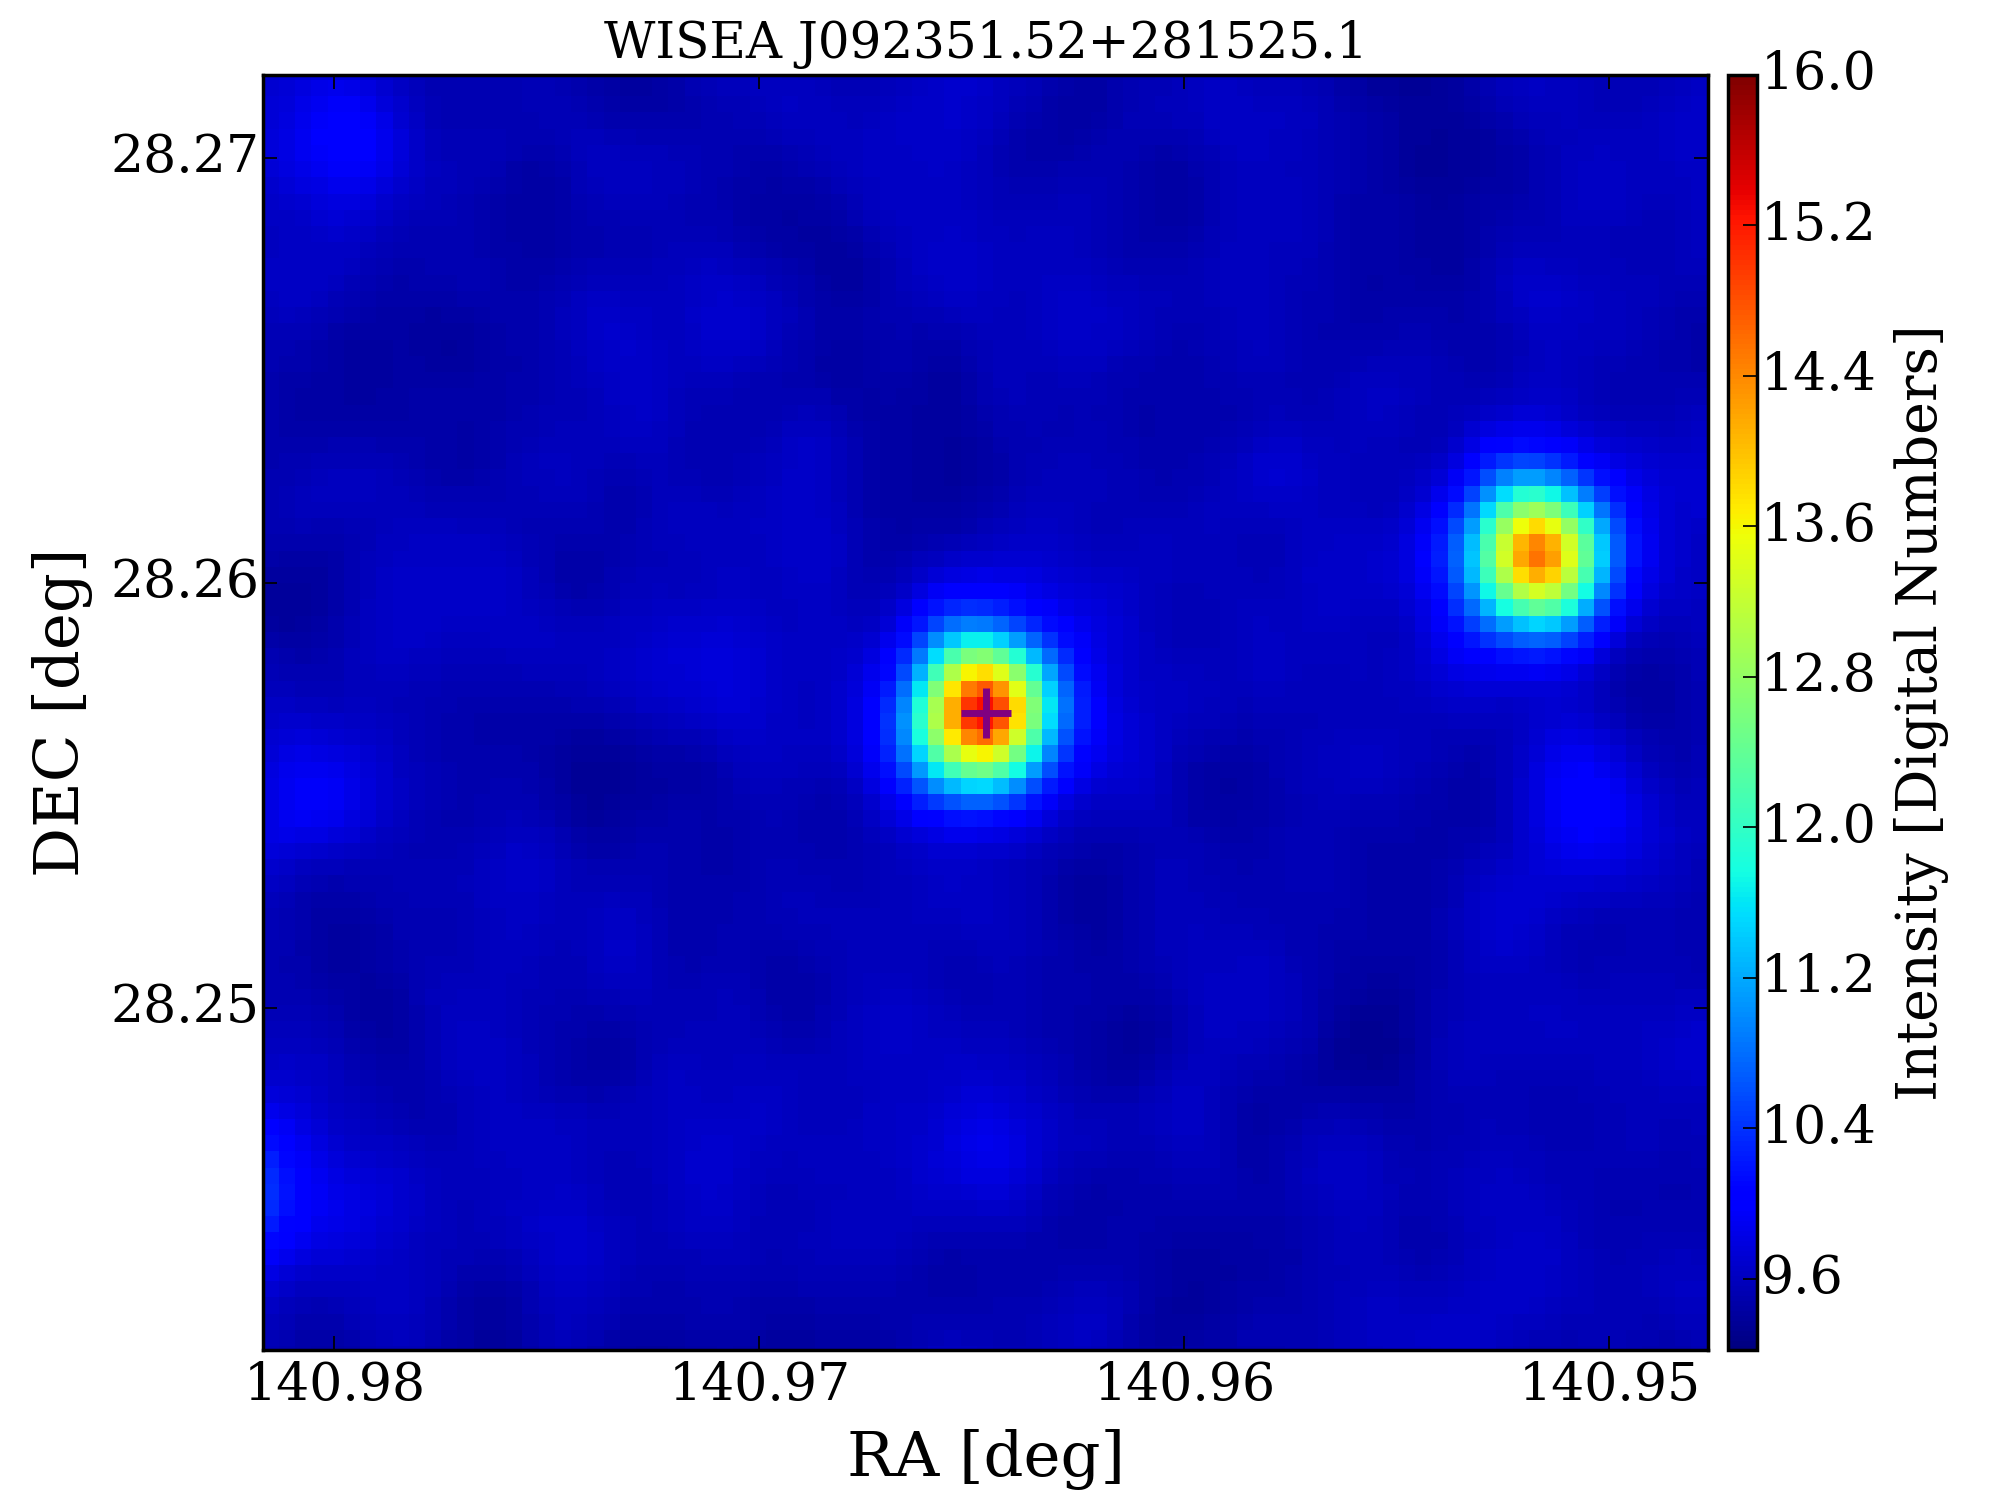
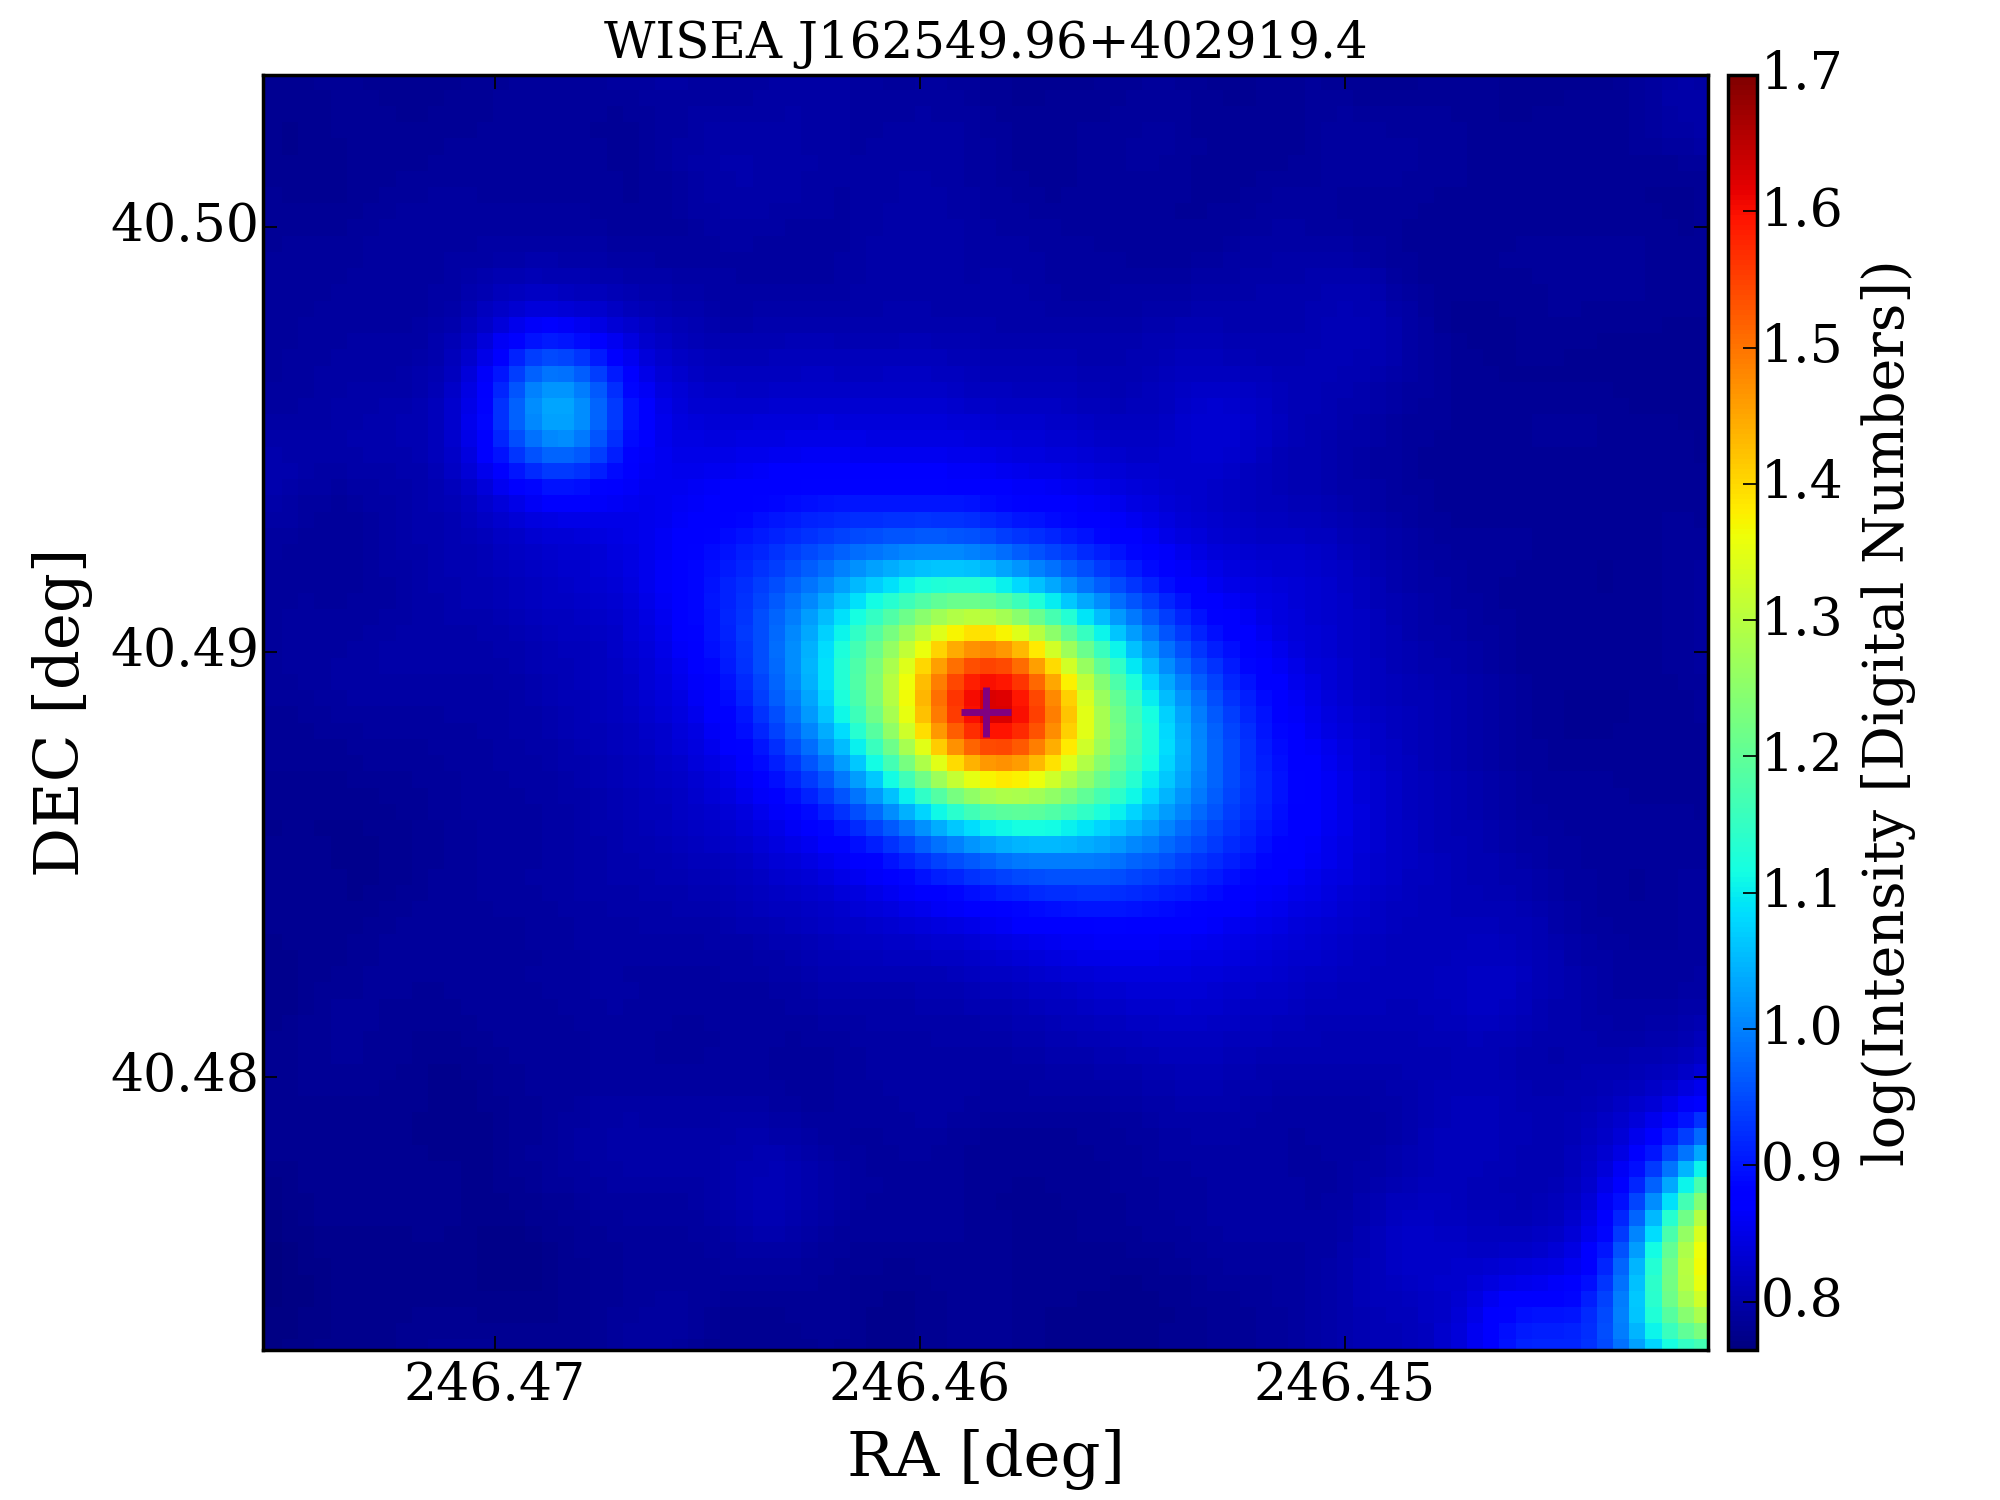
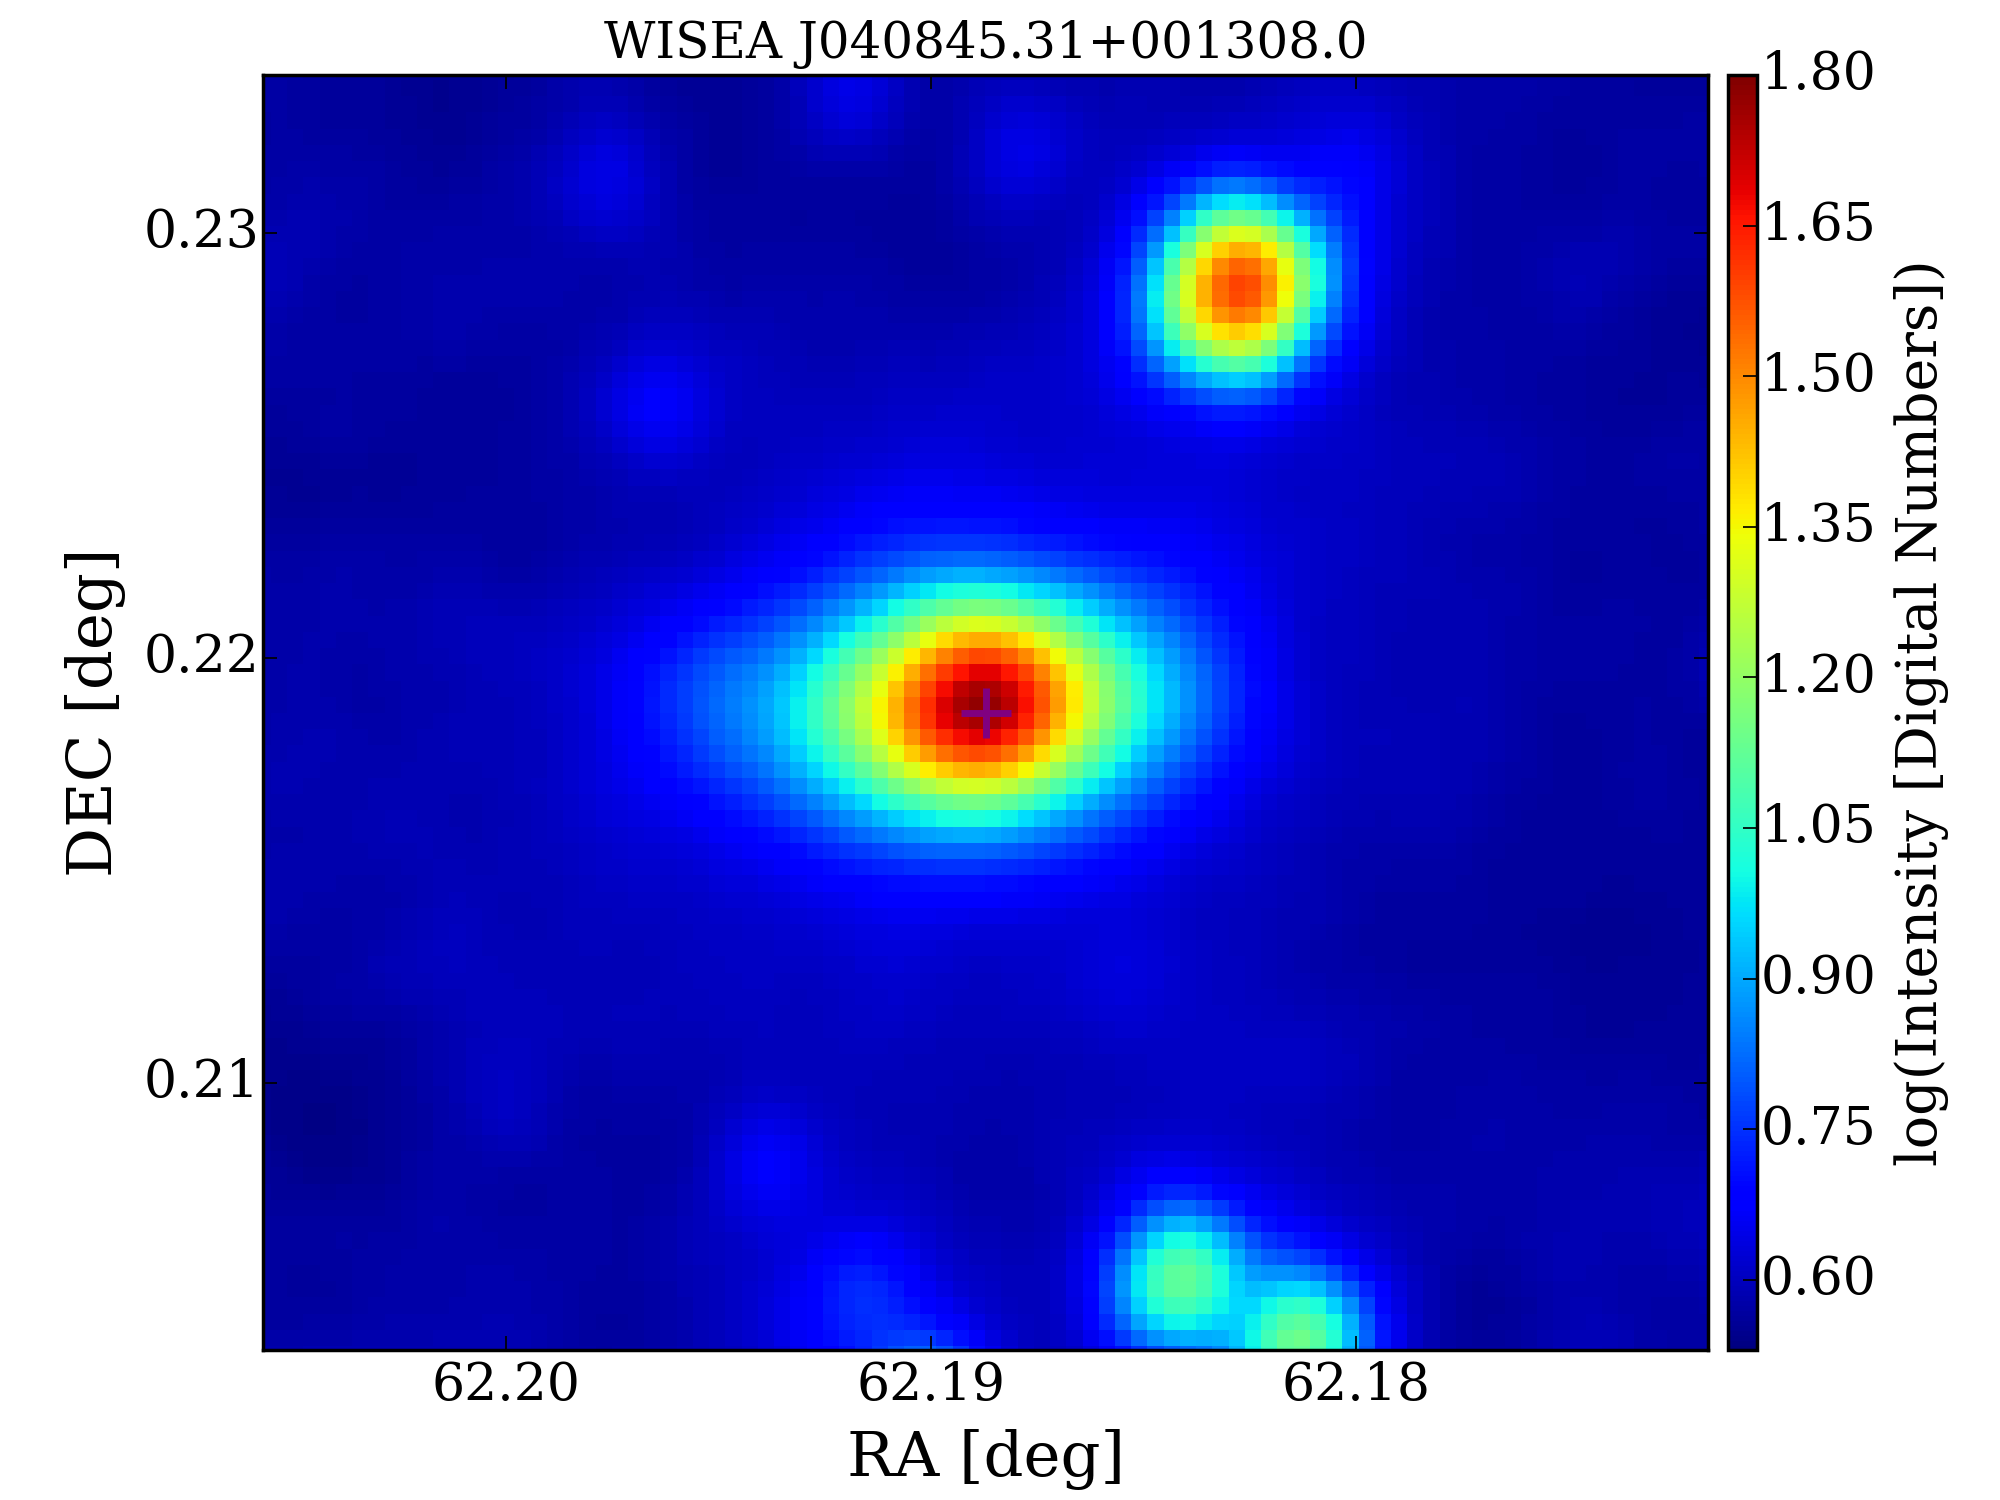
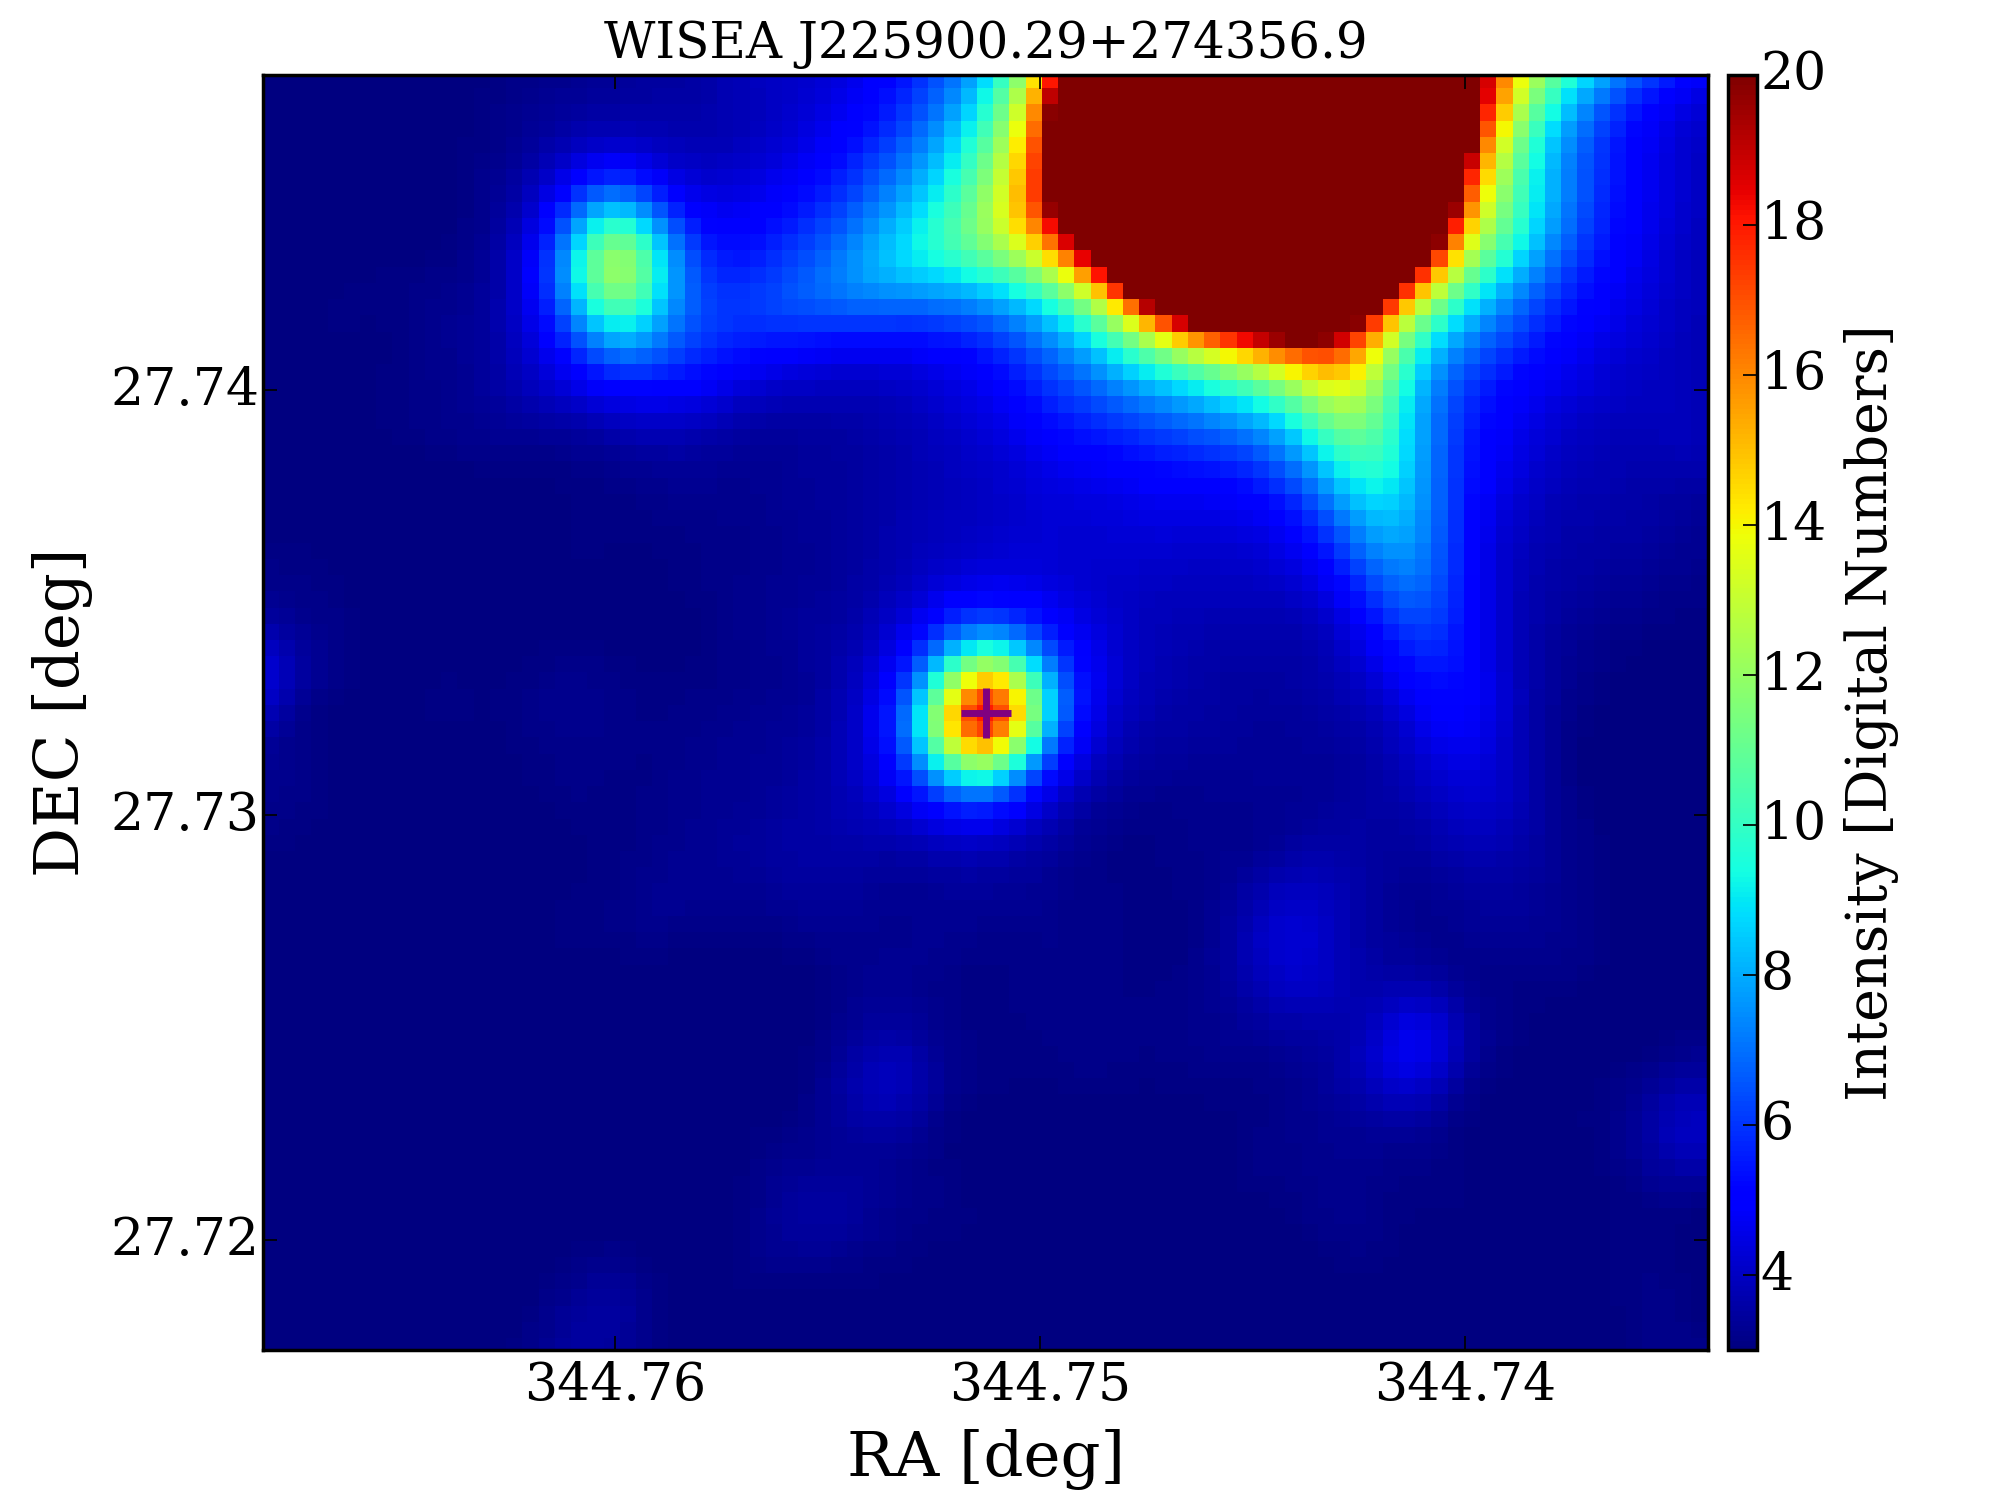
We extract the infrared properties of the absorption systems from the Wide-field Infrared Survey Explorer (WISE; Wright et al. 2010) data. WISE is an all-sky survey mapping the infrared sky at 3.4, 4.6, 12, and 22 m (W1, W2, W3, and W4) with angular resolutions of 6.1 arcsec, 6.4 arcsec, 6.5 arcsec and 12.0 arcsec in the four bands respectively. We recognize the WISE counterparts of the Hi absorption systems using the NASA/IPAC Extragalactic Database (NED, Helou et al. 1991). WISE continuum map, if available, for each Hi absorption system is extracted from the NASA/IPAC Infrared Science Archive (IRSA) and presented below.
2.3 Optical Data
The optical observation data of our background sources are obtained from the Sloan Digital Sky Survey (SDSS, York et al. 2000) Data Release 16. The optical counterparts of the background/foreground sources are selected by cross-matching the coordinates of the sources with the SDSS catalog using a 2-arcsec matching radius. Among the 29 Hi absorption detections presented in this paper, 6 are outside the footprint of SDSS.
3 Analysis
3.1 Searching Algorithms
Considering both CRAFTS and FASHI surveys have been conducted in the drift-scan mode, we rebinned the data into a time resolution of 12 s ( the transit time in drift scan, where is the declination of the pointing) and a frequency resolution of = 15.26 kHz, and applied the same data-processing method to them. The search technique has been described in detail in Paper I. In summary, after the removal of the baseline (estimated using a low-pass filter), Hi absorbers are blindly searched by cross-correlating flux spectra with Gaussian templates (matched-filtering approach, (Saintonge, 2007)). We searched for Hi absorption signal in both XX and YY polarizations of each beam. We select candidates with a combined velocity-integrated signal-to-noise ratio () exceeding 5.5 and those that are found at nearly the same frequency ( MHz) with an individual exceeding 3.5 in both XX and YY polarizations. Final candidates are selected by use of transit information recorded by the 19-beams of FAST.
3.2 Hi Absorption Measurement
Hi 21-cm absorption lines arise from foreground Hi gas absorbing the flux of the background bright radio source. The Hi column density of the foreground gas can be calculated by integrating observed absorption over velocity (Morganti & Oosterloo, 2018):
| (1) |
where and refer to optical depth and spin temperature of the Hi source, respectively. Under the assumption that , the optical depth can be expressed as:
| (2) |
where is covering factor. is the brightness temperature of the background continuum source, which can be deduced from the line-free parts of the spectrum or other databases. In this work, we use the given in the NED 222https://ned.ipac.caltech.edu. is the difference between the observed signal () of Hi gas and brightness temperature of background continuum source. If , the spectral line will be seen in emission, while if , absorption dominates.
Throughout this paper we take the assumption that and (Maccagni et al., 2017) for the calculation of and . The new Hi absorption will be classified as “associated absorption” if the redshift difference between the Hi absorption and the background is within 0.005.
4 Verified Hi Absorption Systems
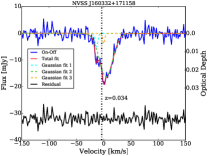
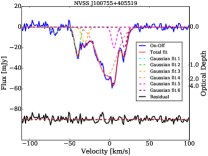
From August 2021 to October 2023, we conducted follow-up observations using FAST in the ON-OFF tracking observation mode, with 990 seconds of on-source integration for each absorption system. In total, we identified 34 Hi absorption, comprising 14 previously known absorbers and 20 newly discovered ones. The spectra of these Hi absorption were calibrated using a built-in noise diode that was activated for 1 second every 8 seconds. To remove the bandpass baseline, a polynomial function was fitted to the absorption line-free parts of the spectrum. We then employed multi-component Gaussian functions to fit the profiles of authentic Hi absorption.
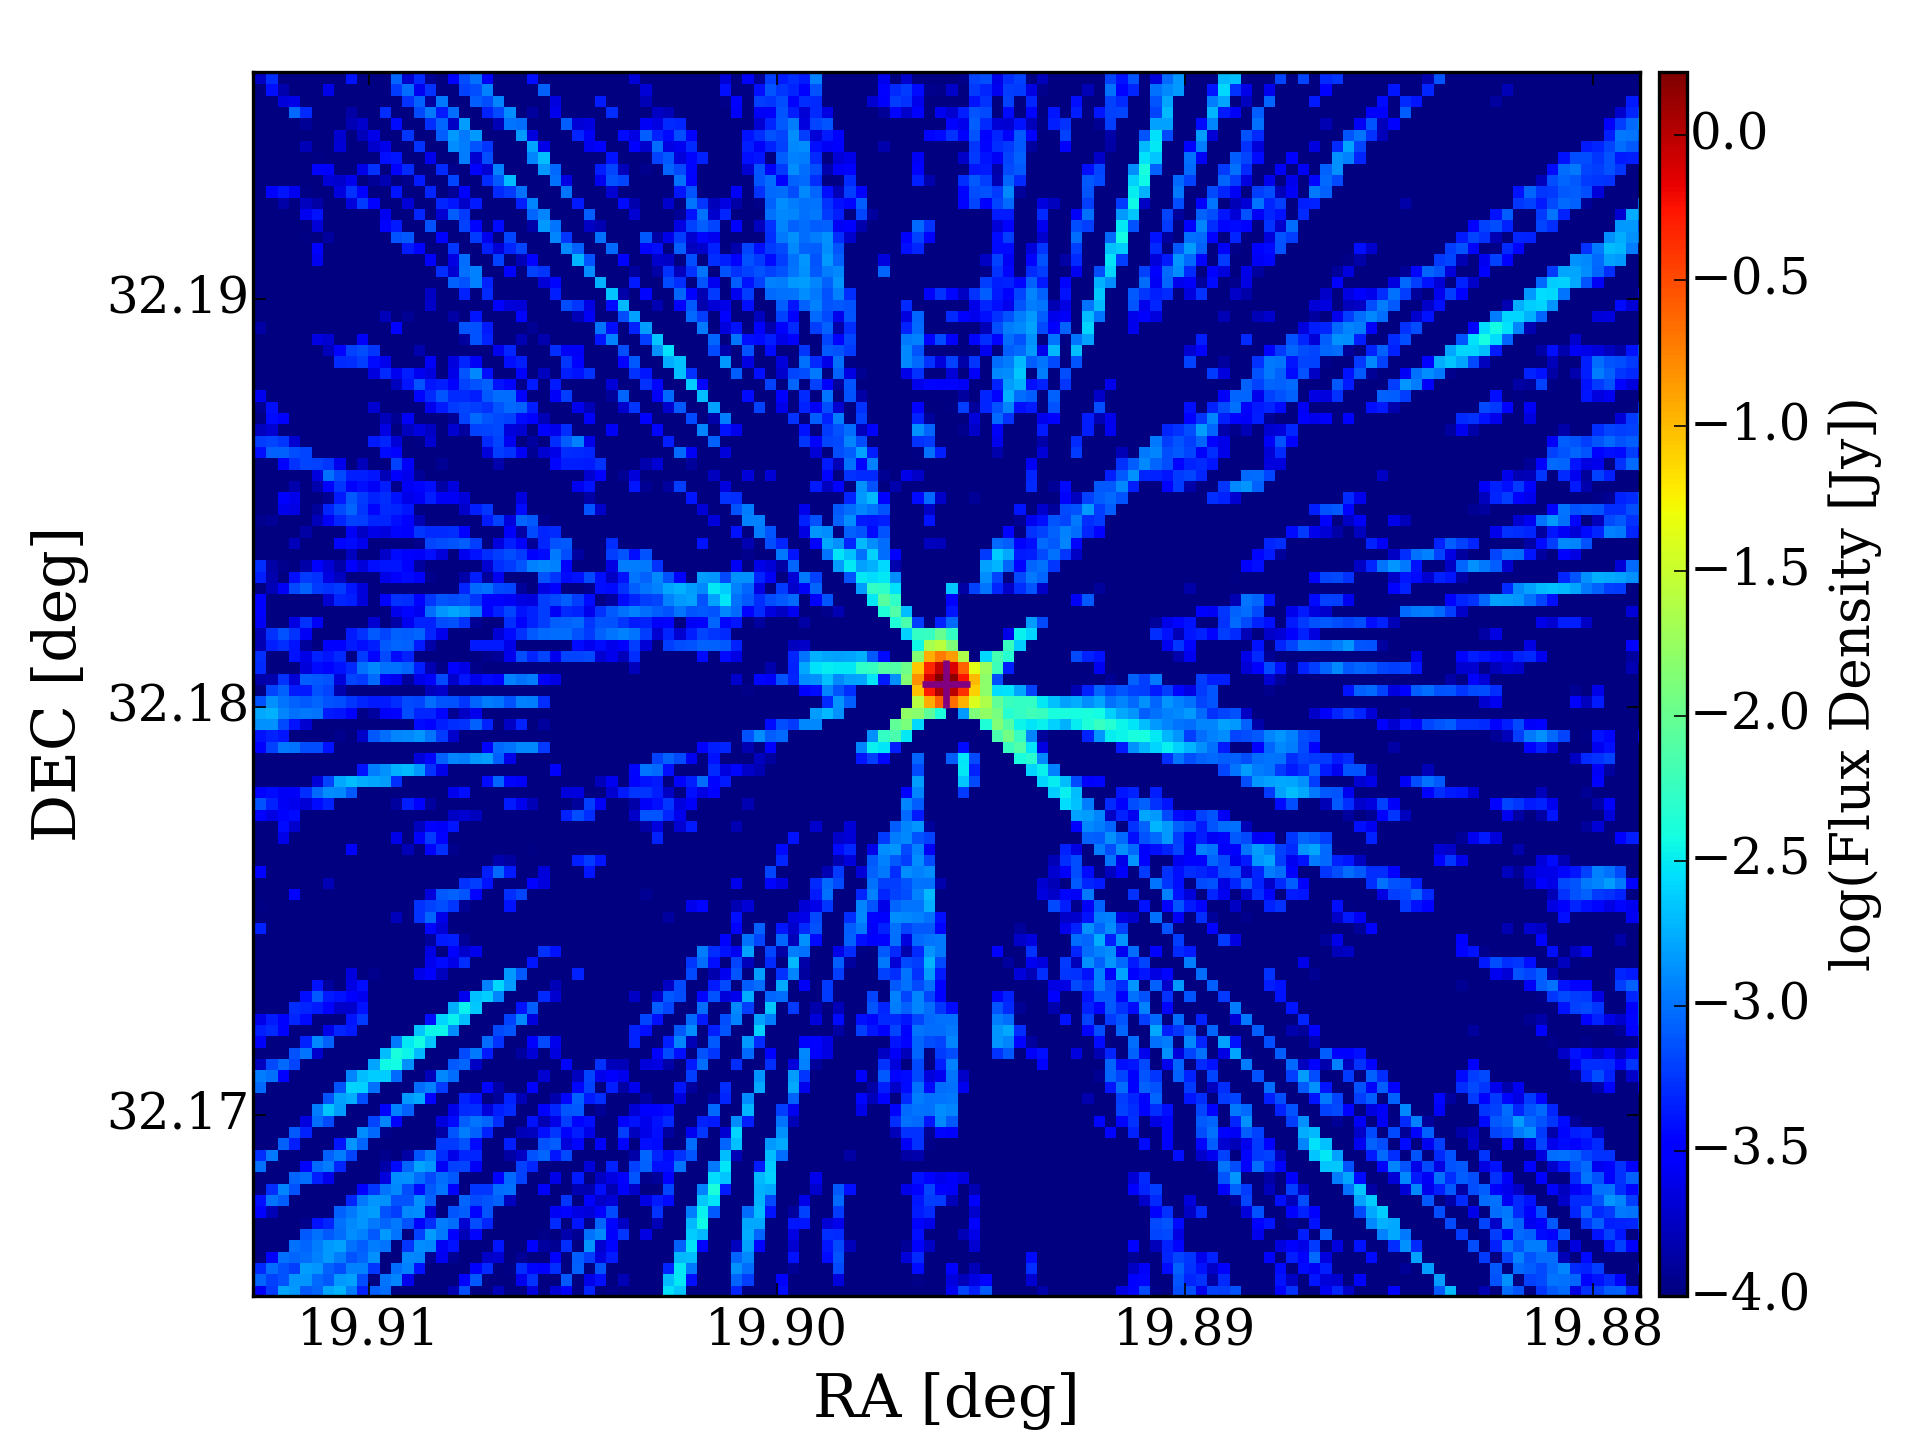
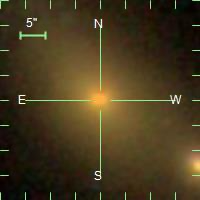
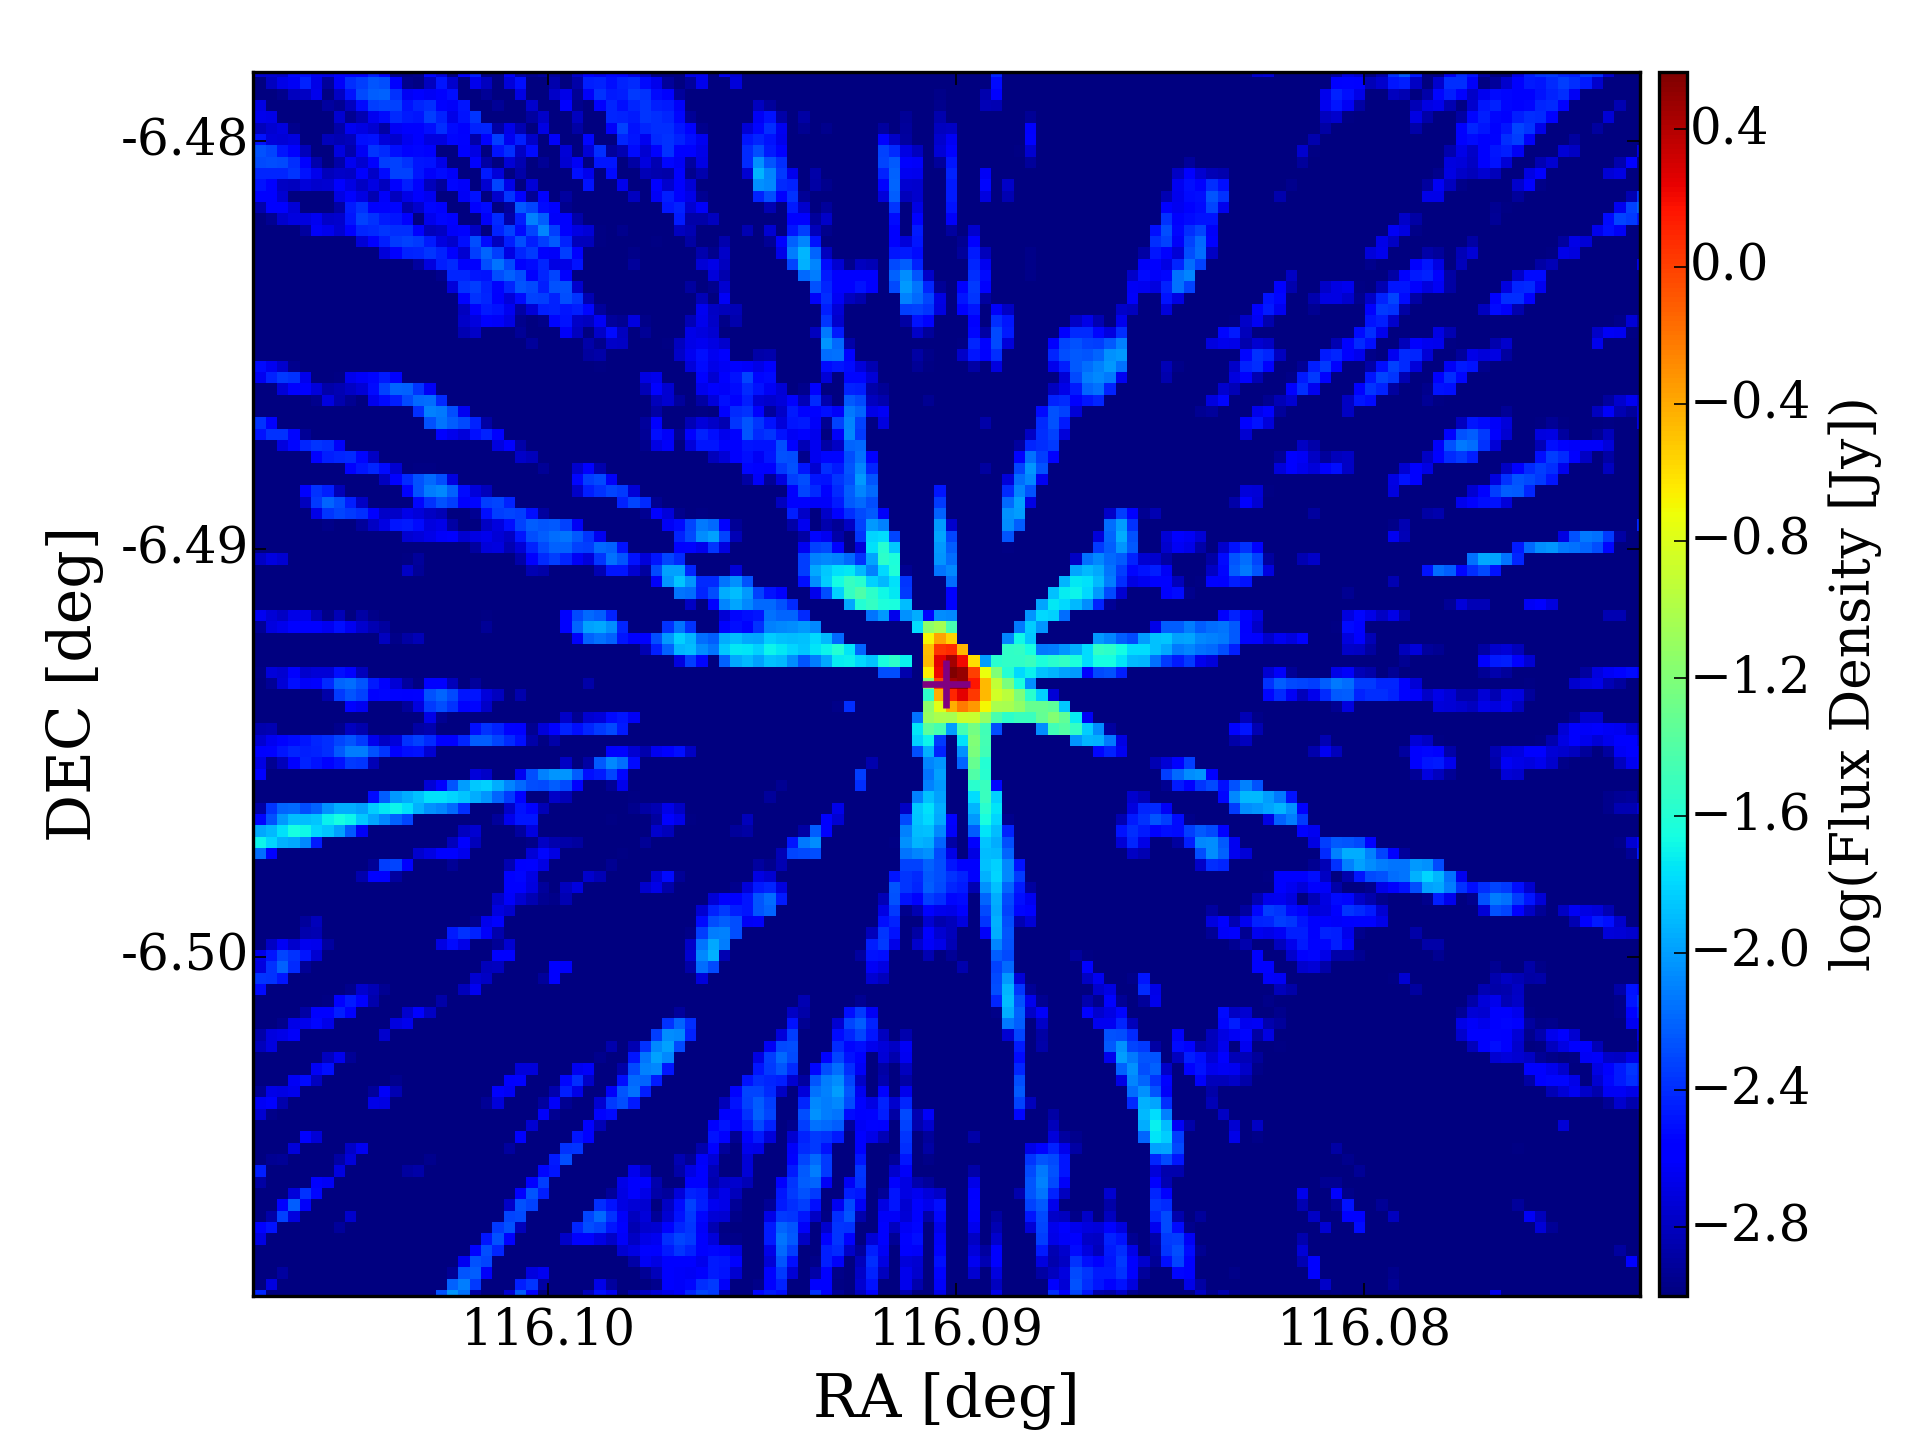
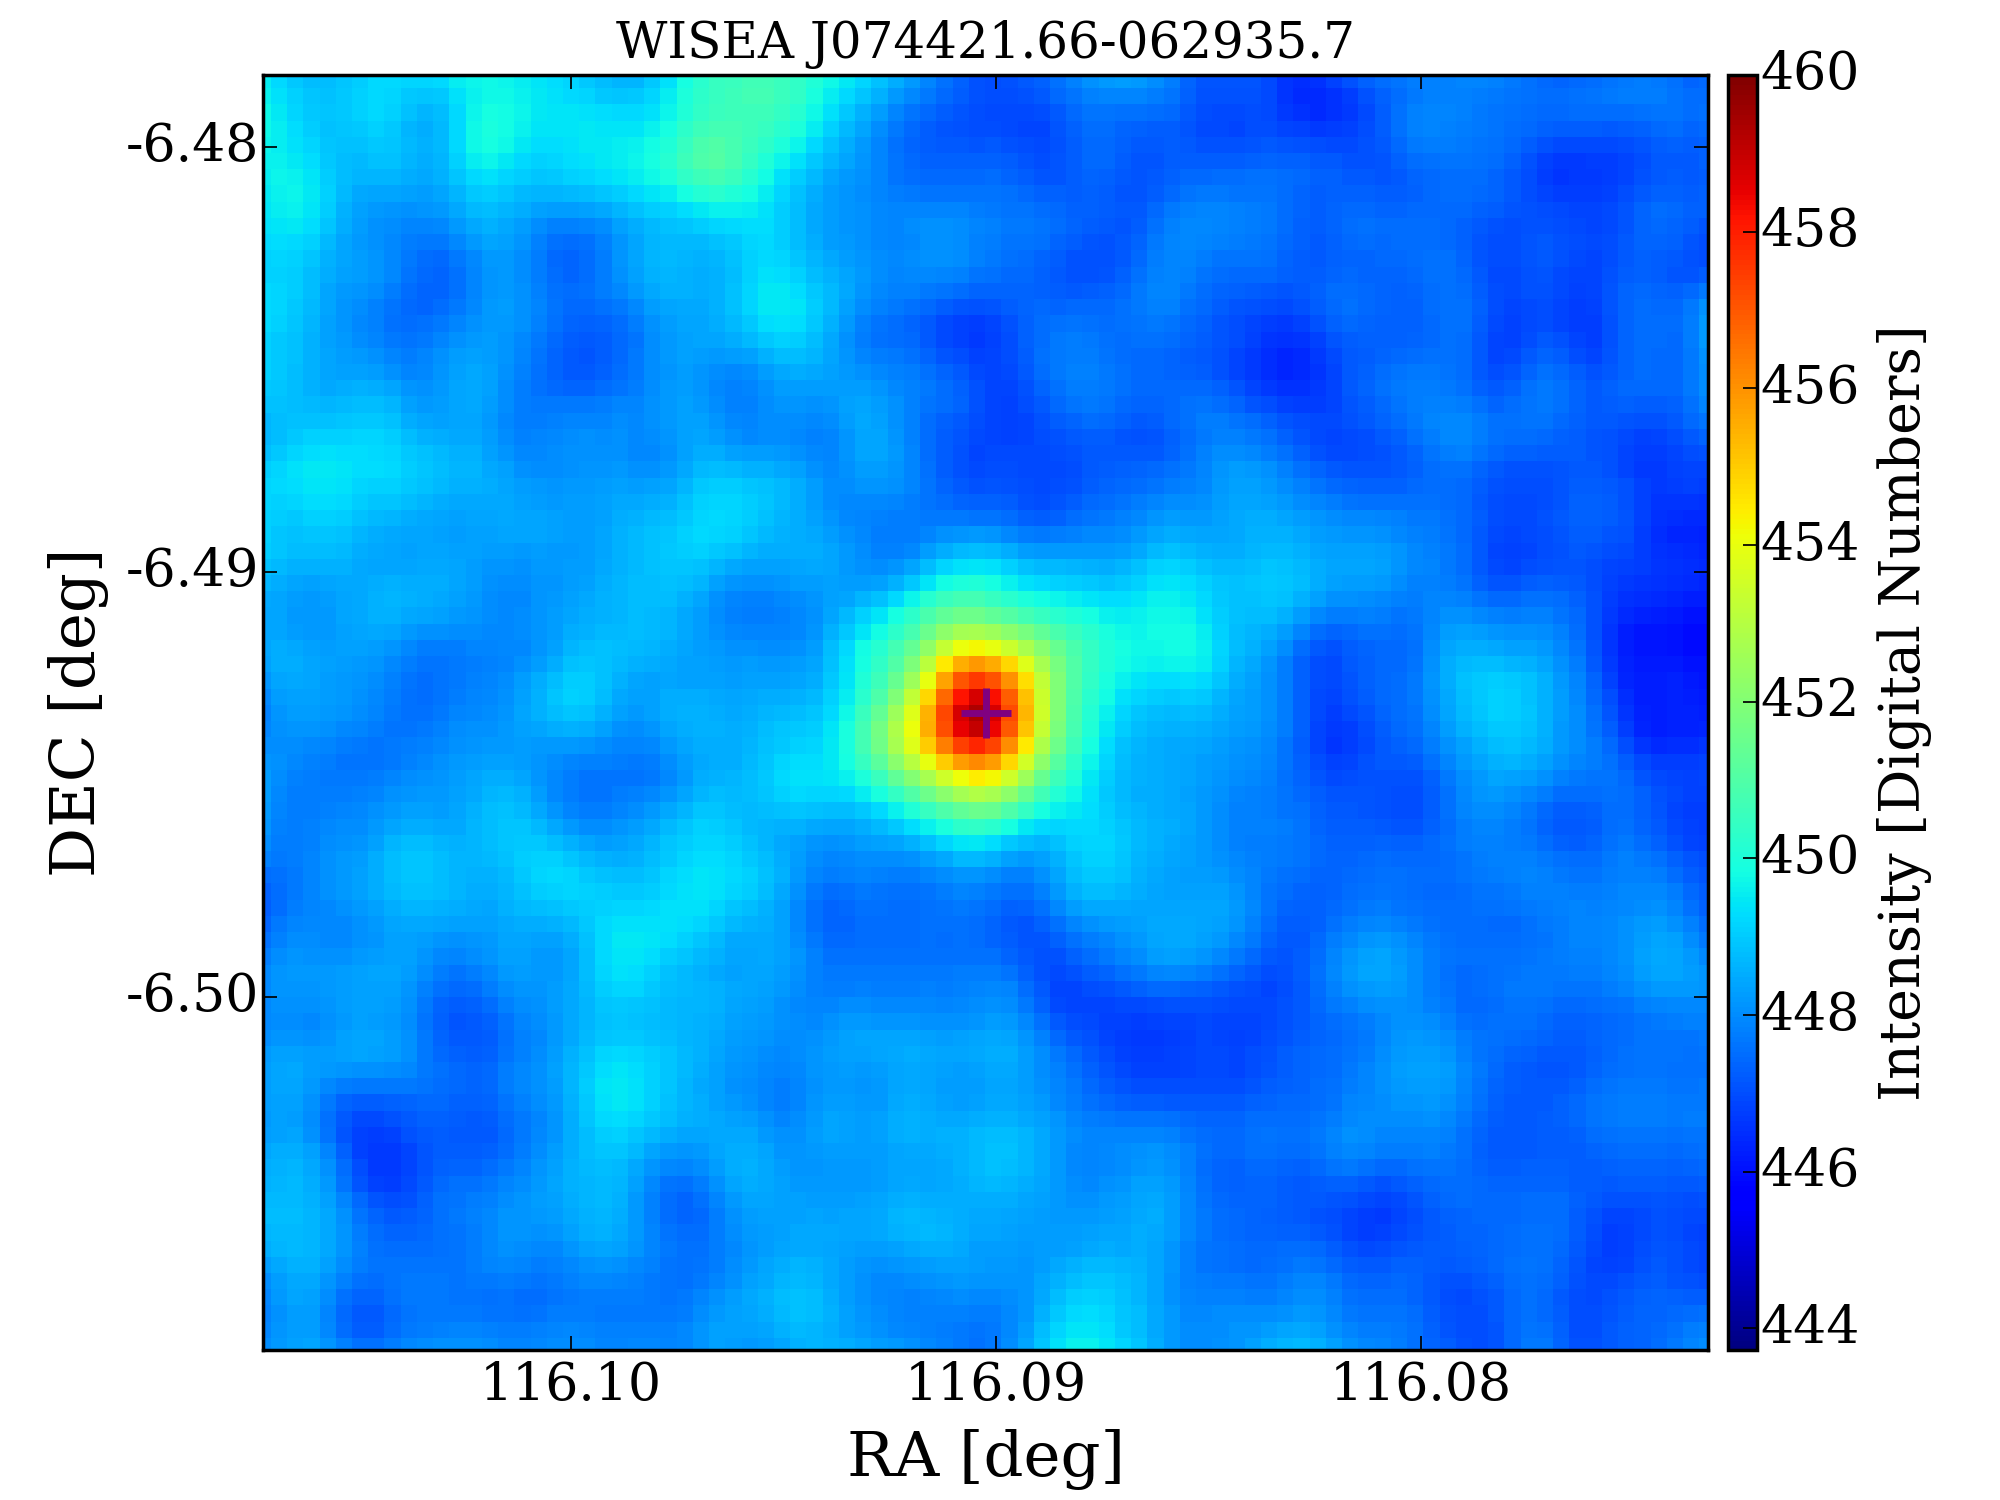
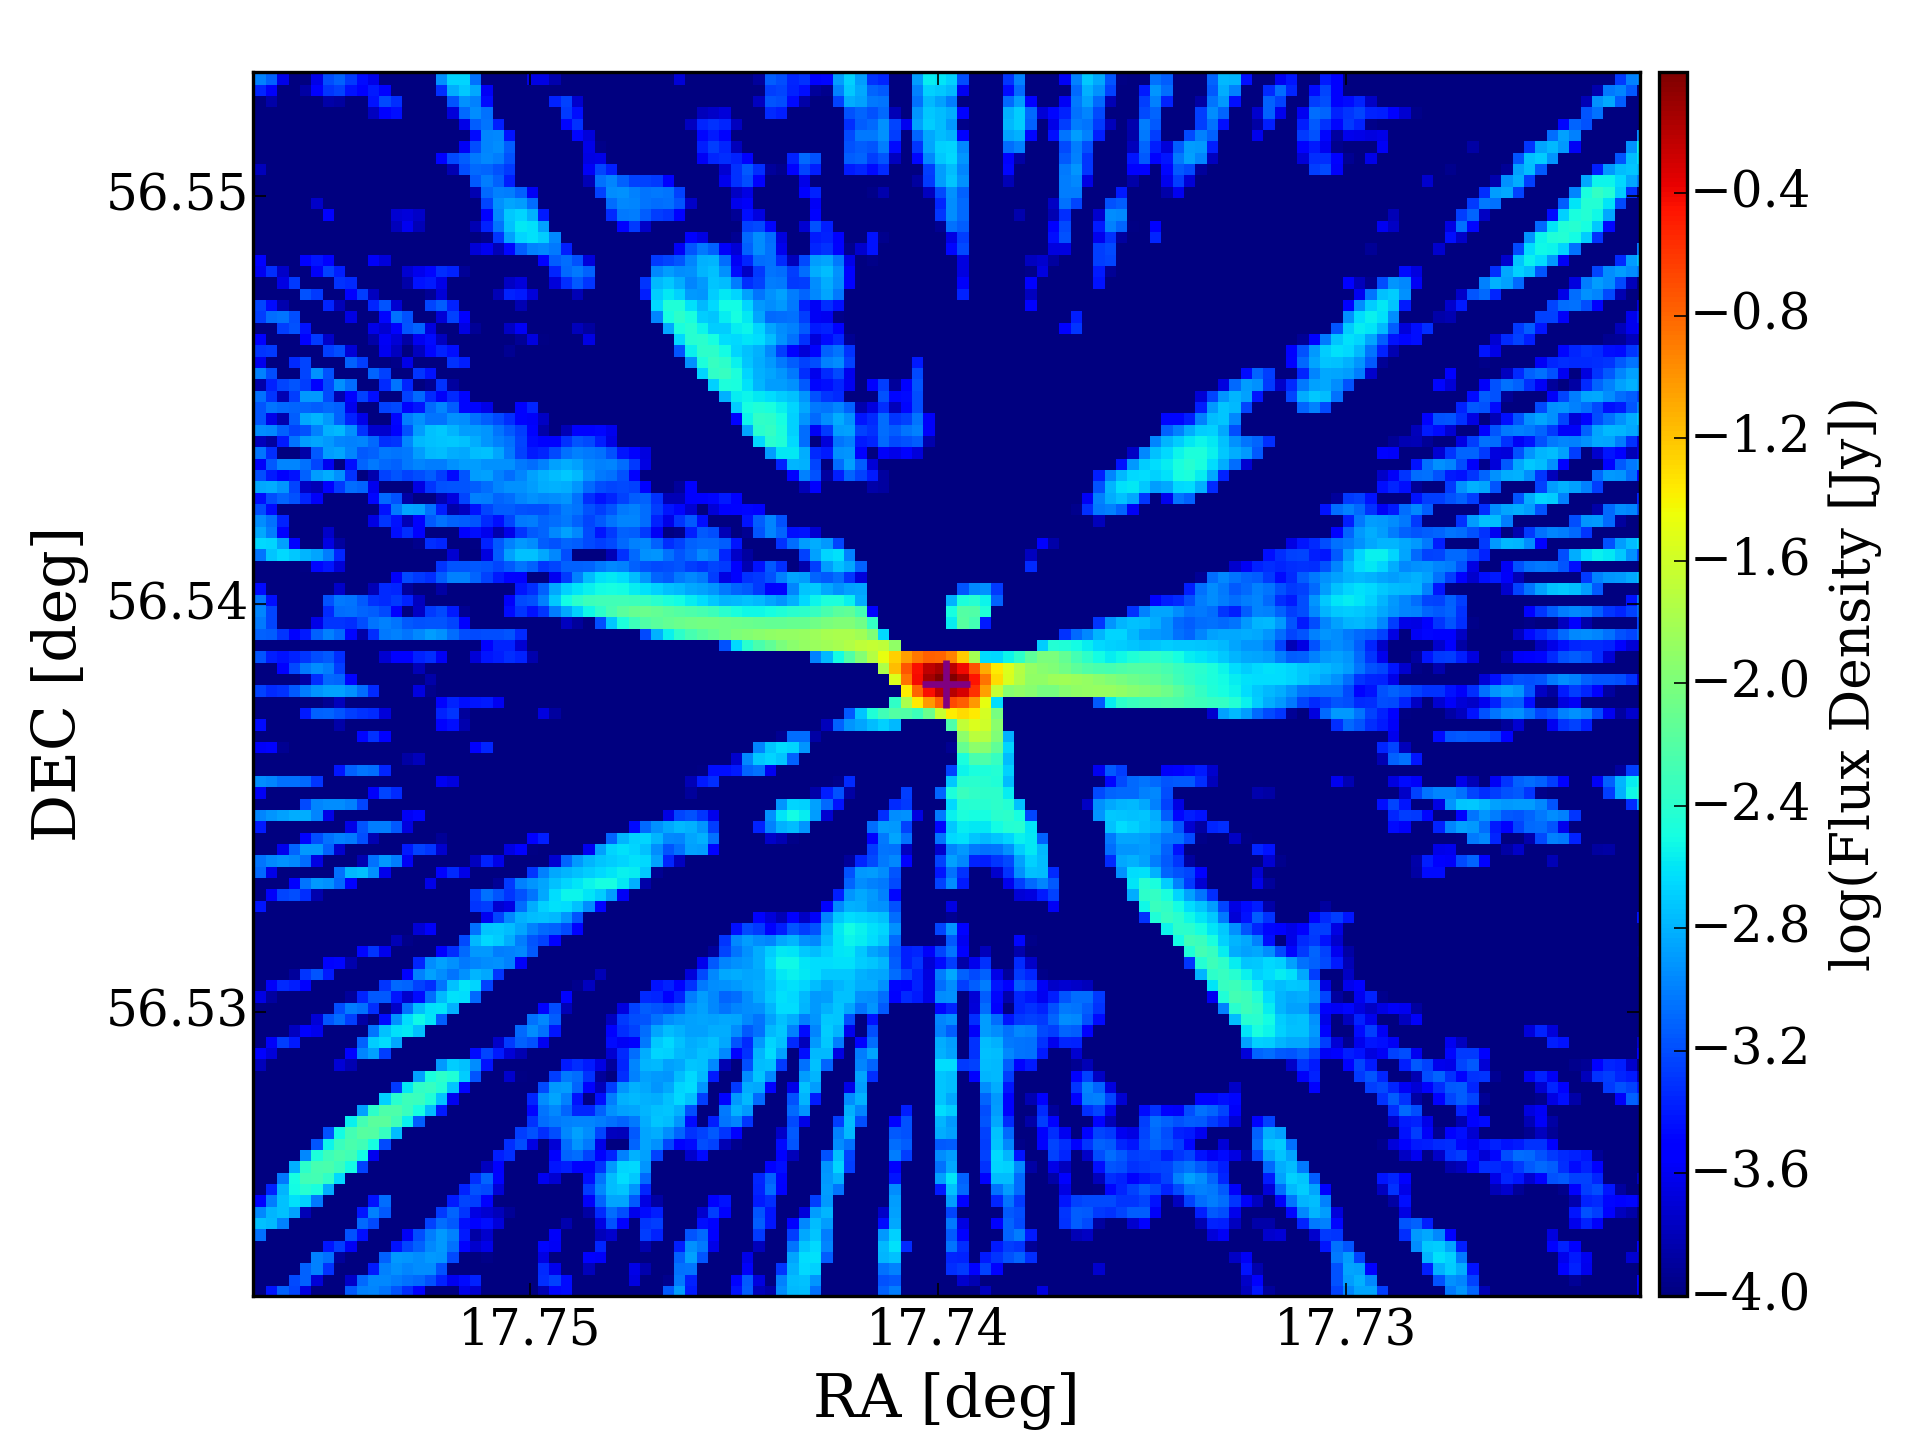
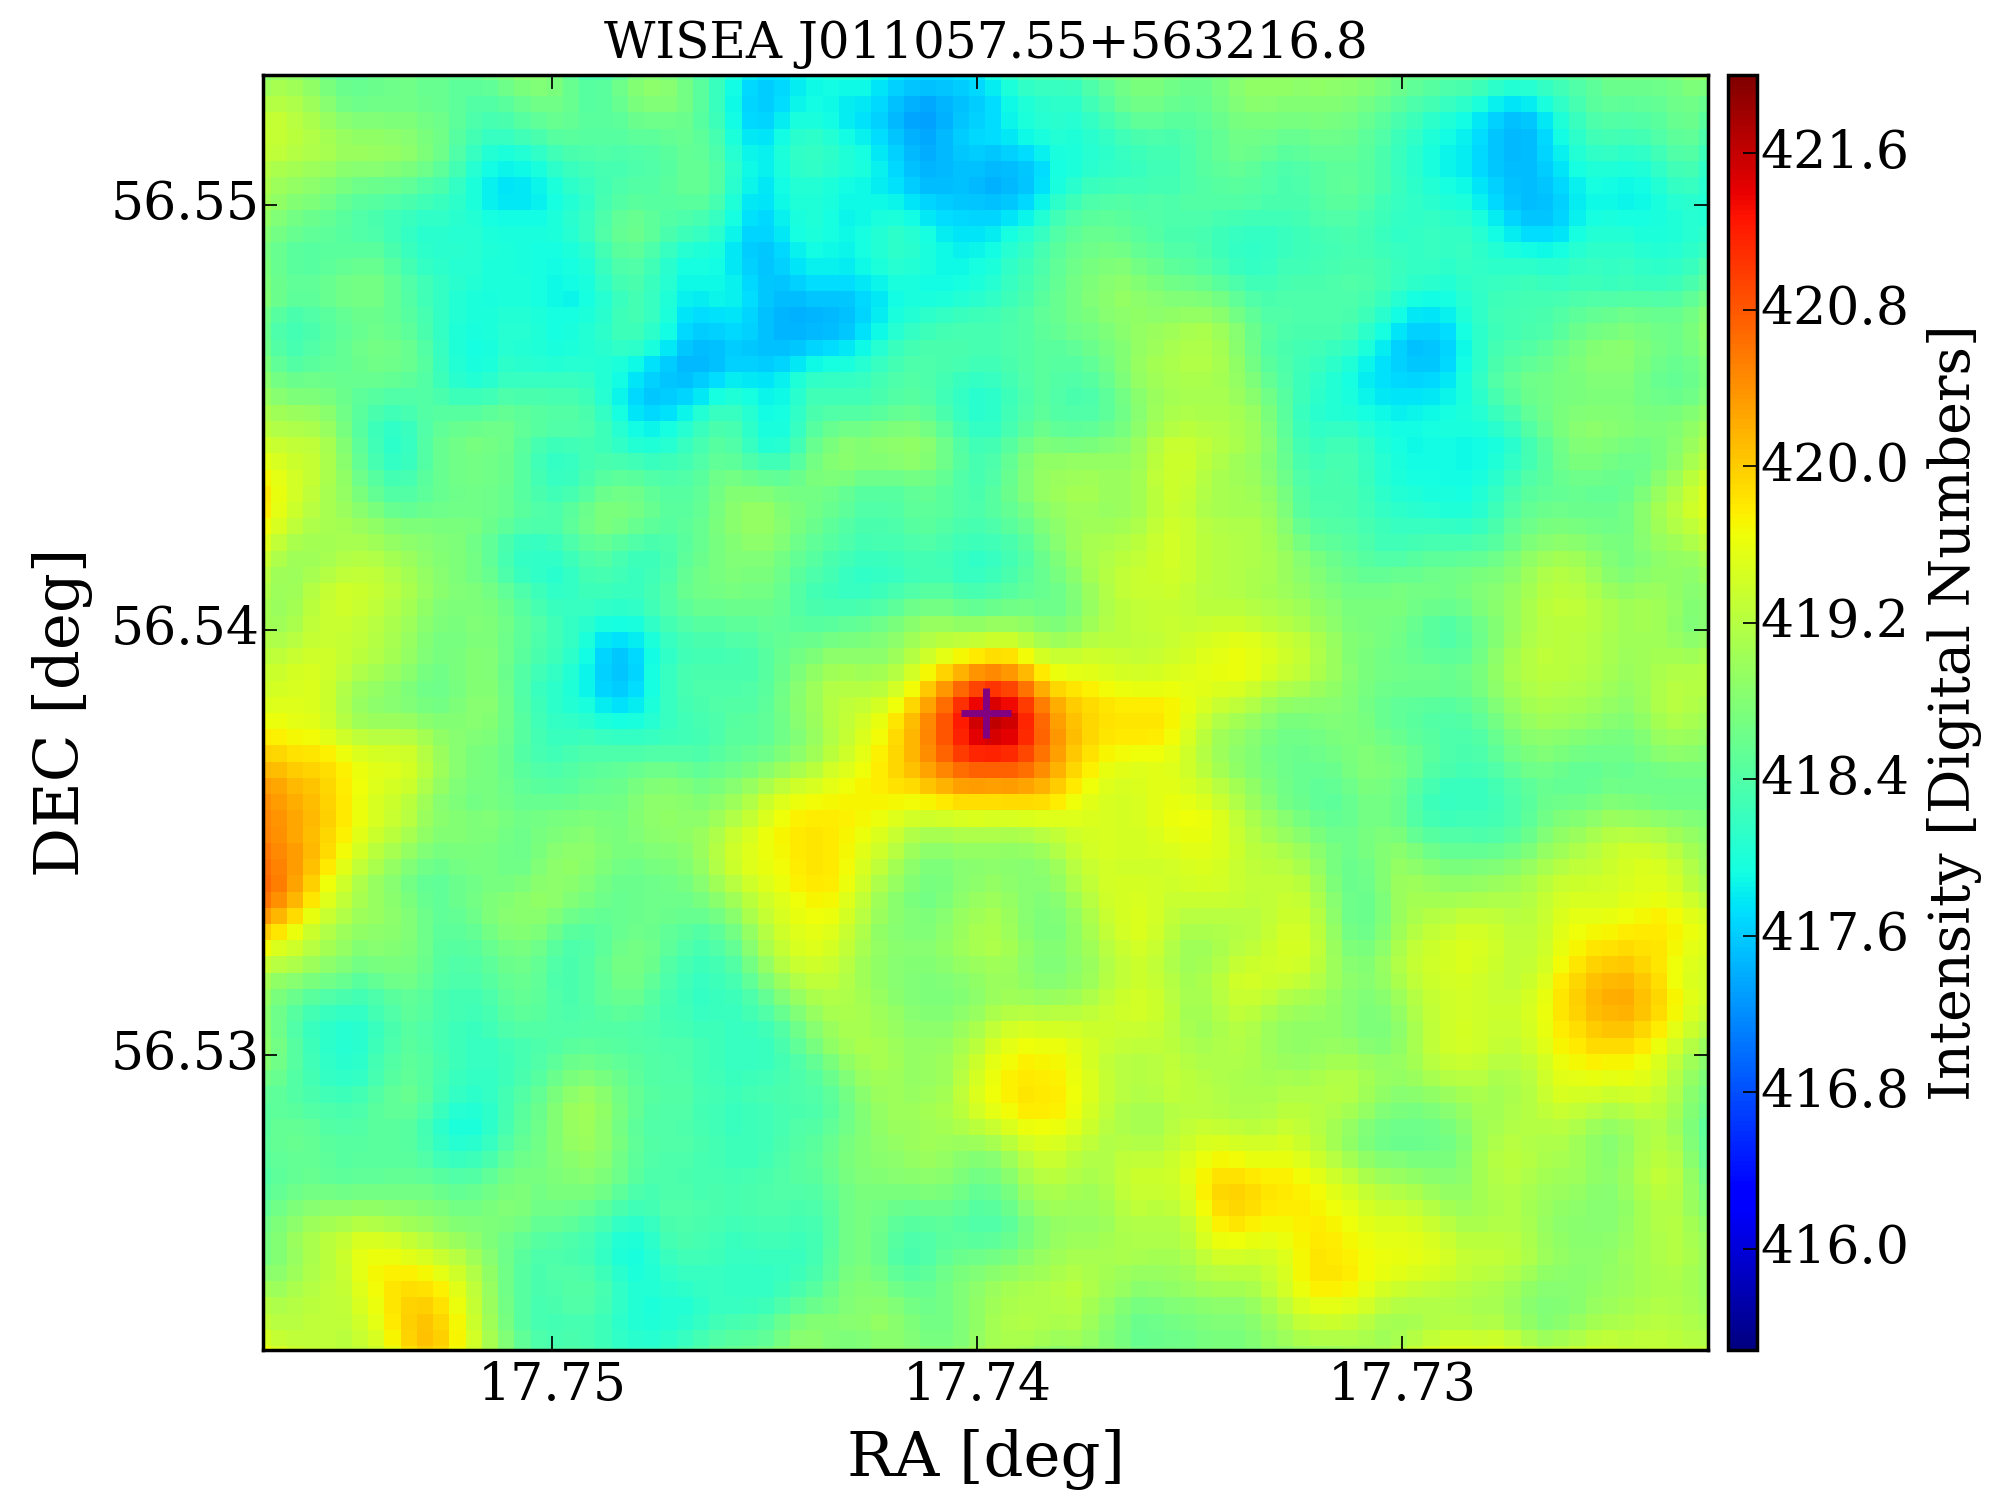
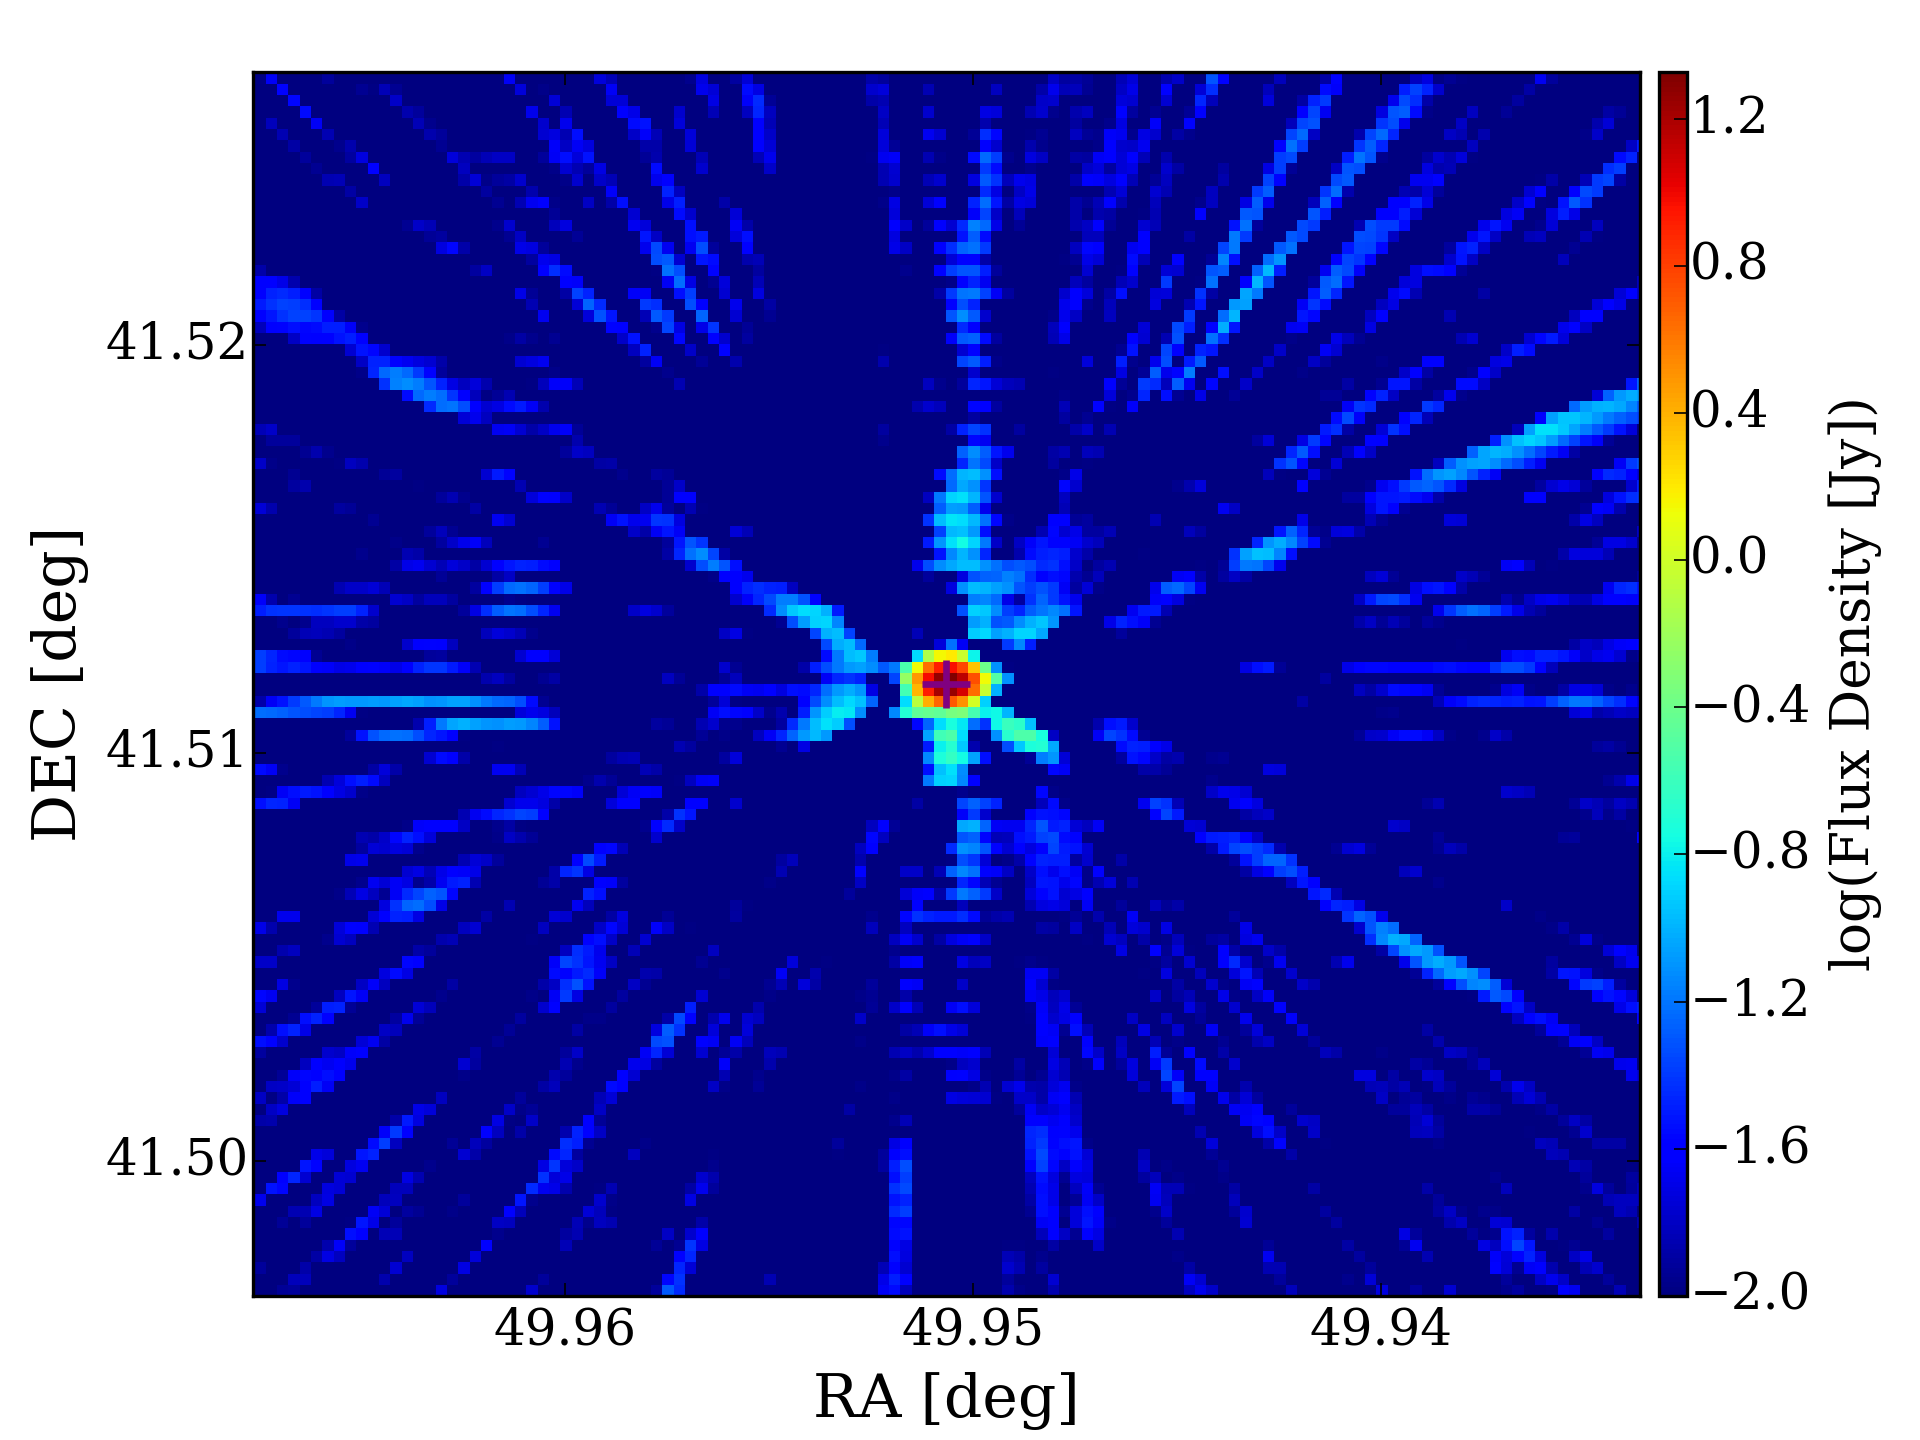
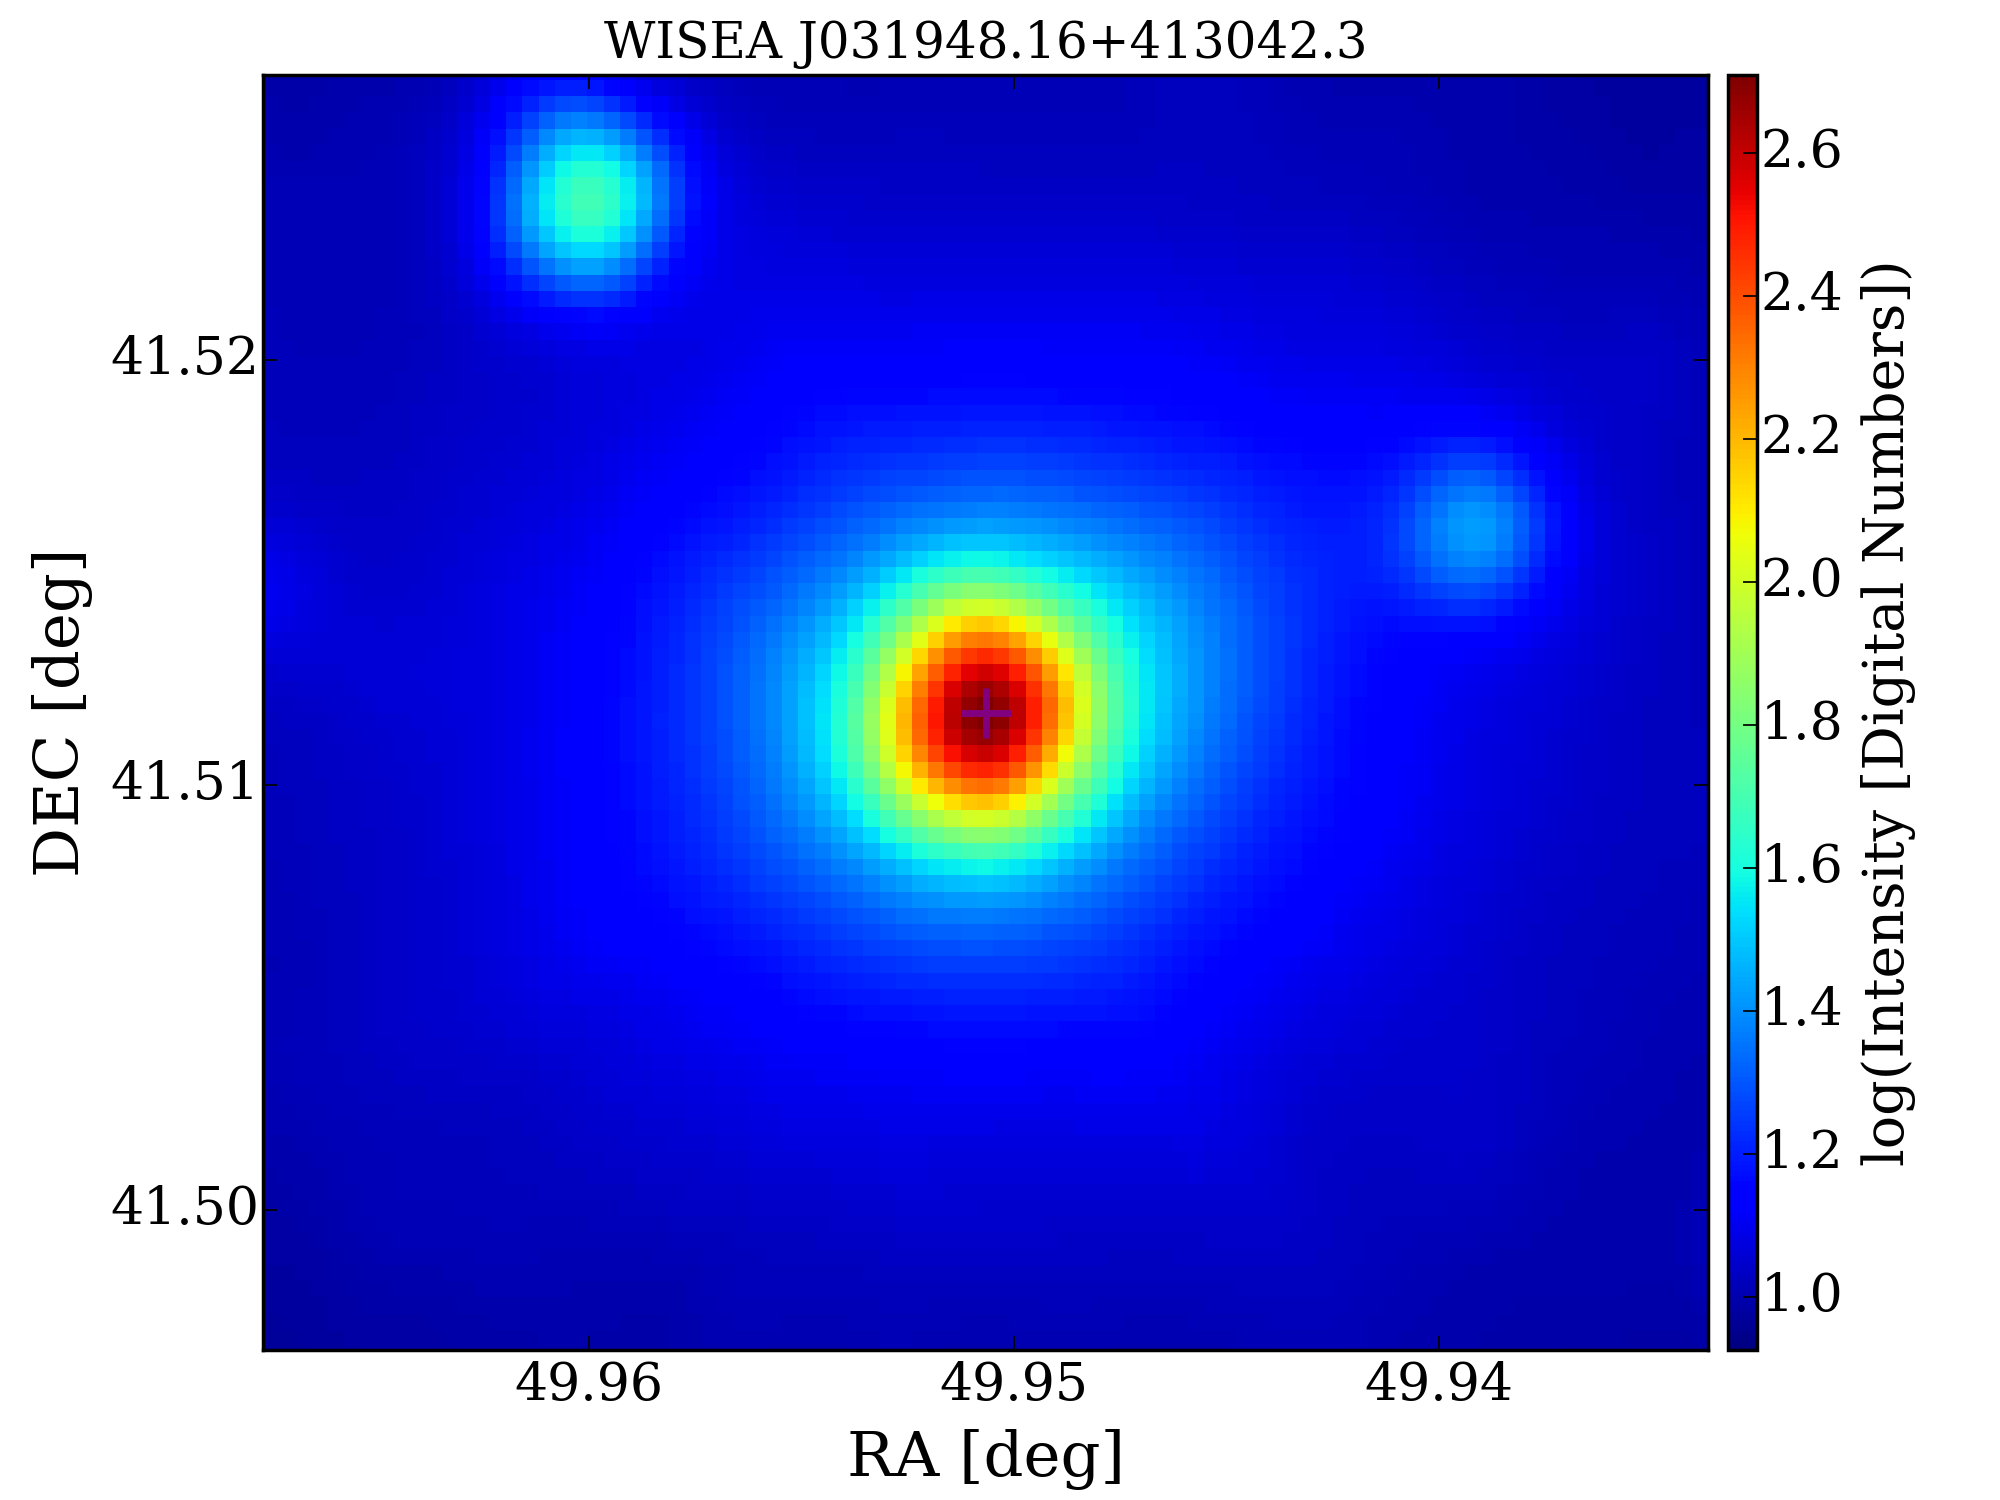
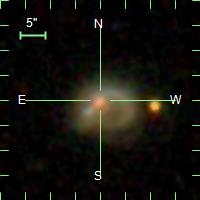
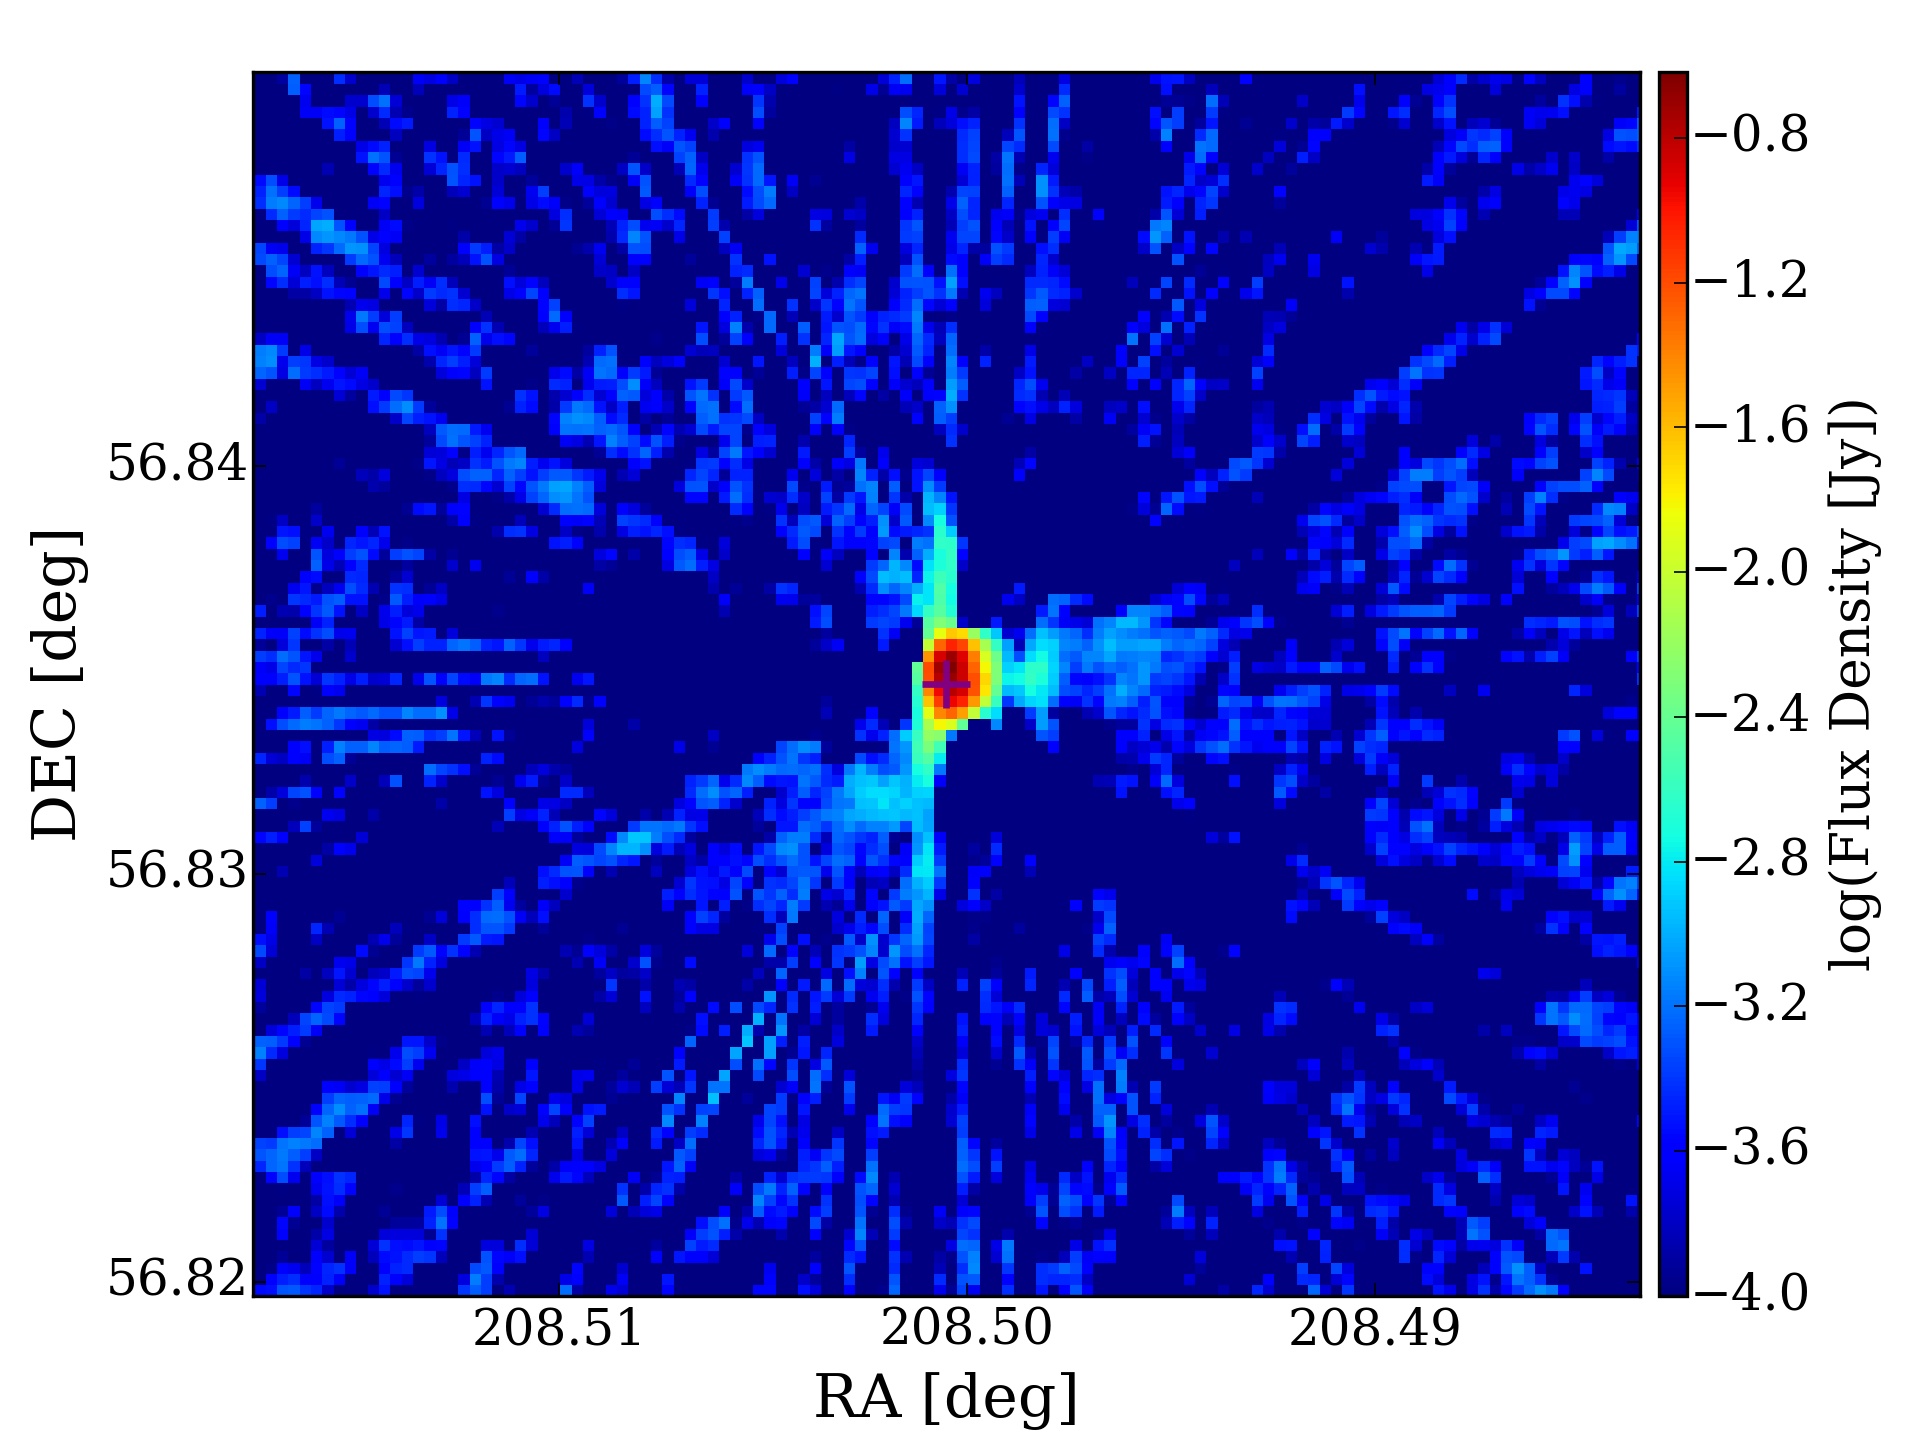
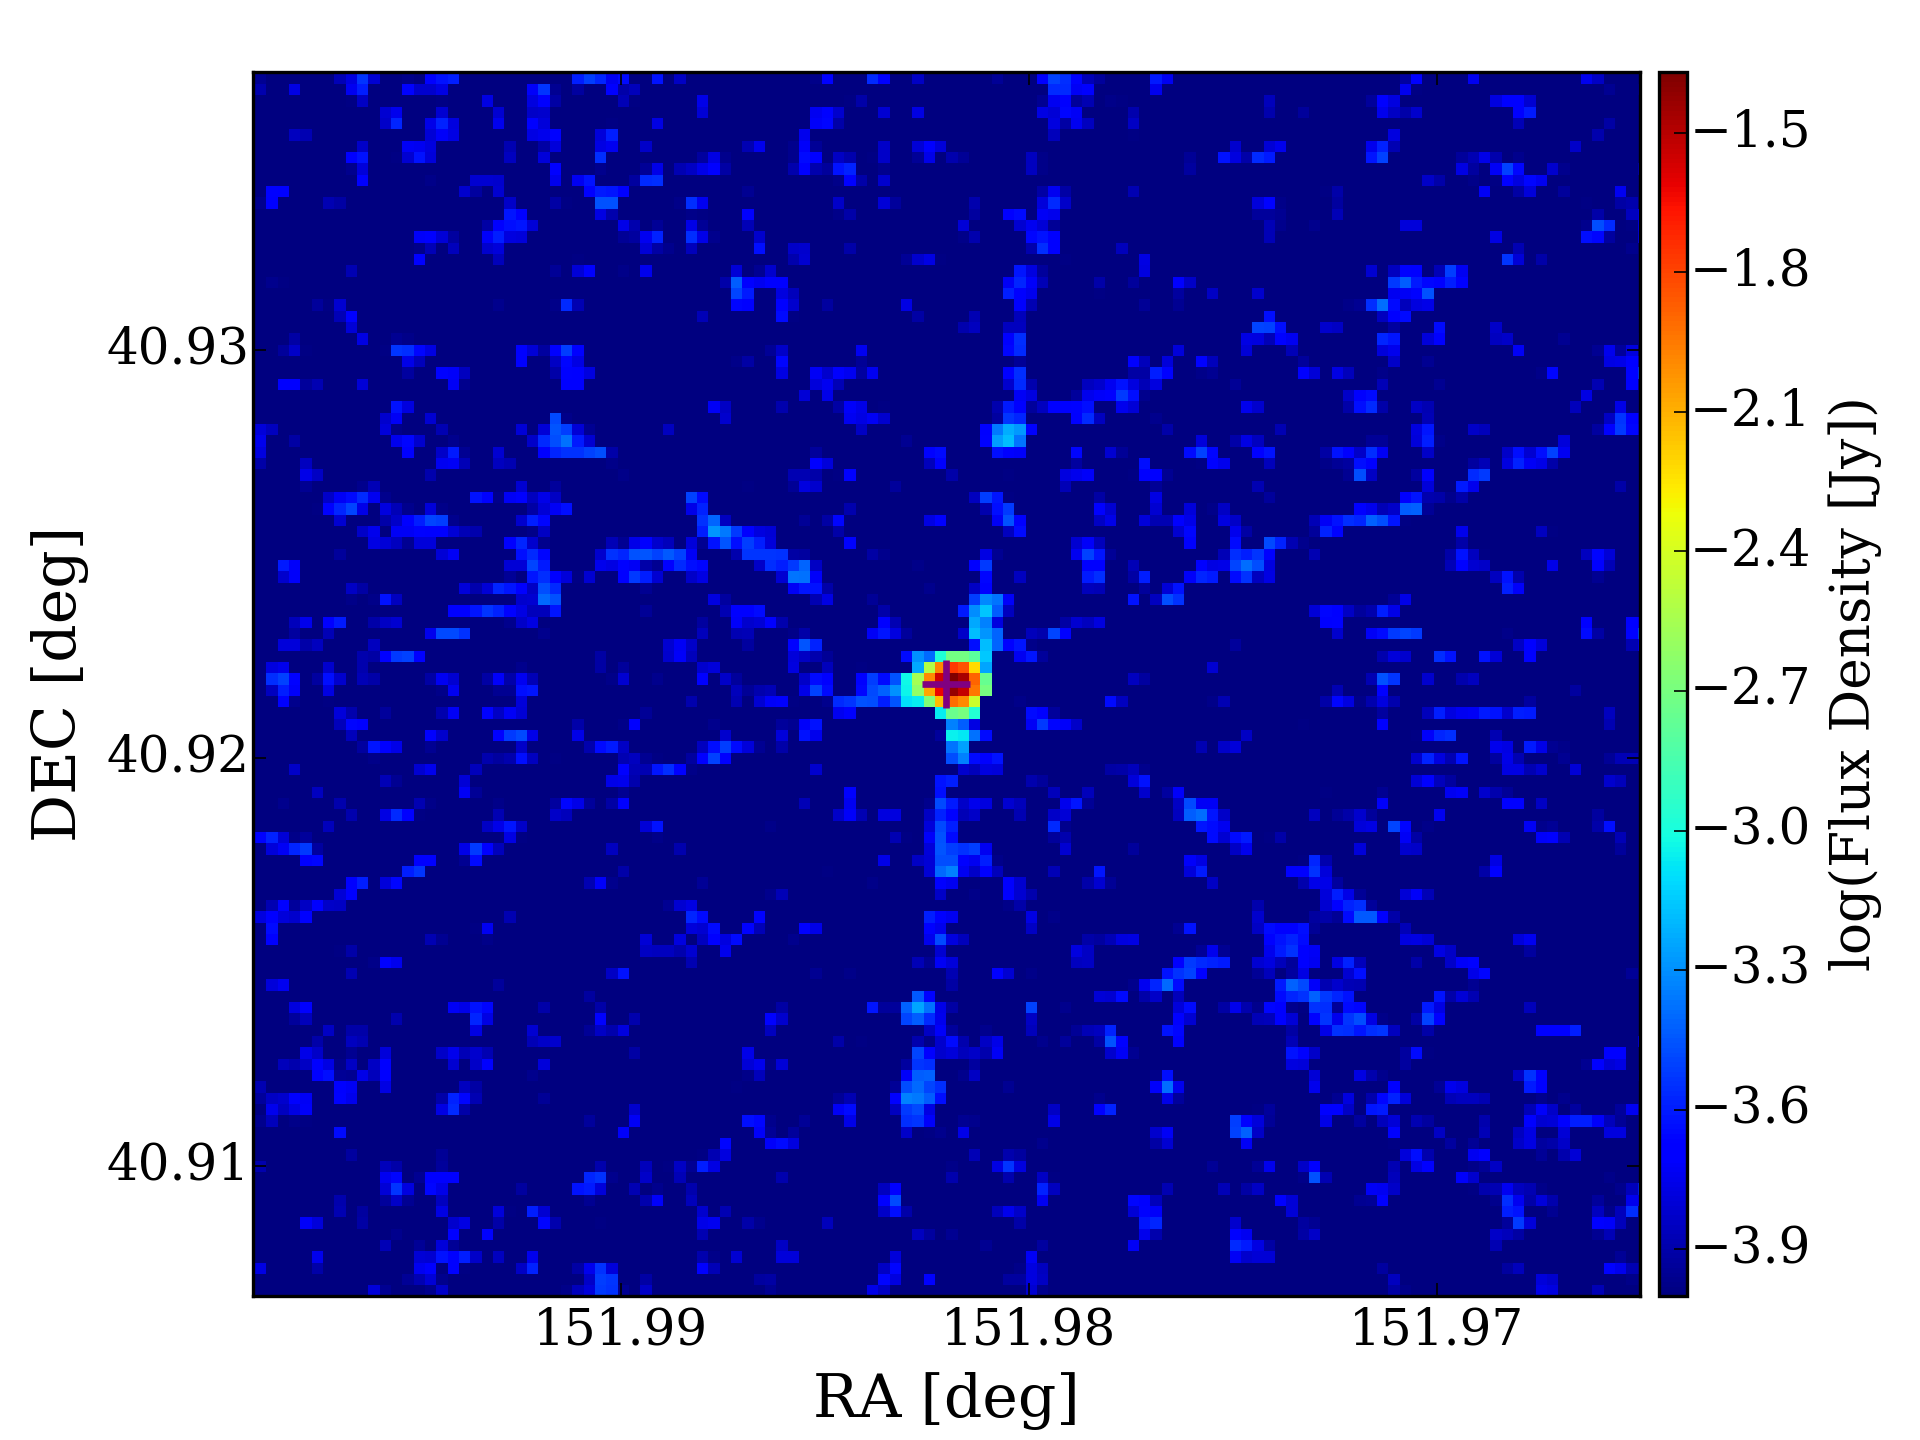
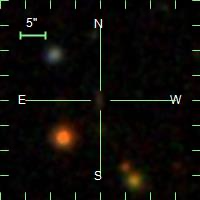
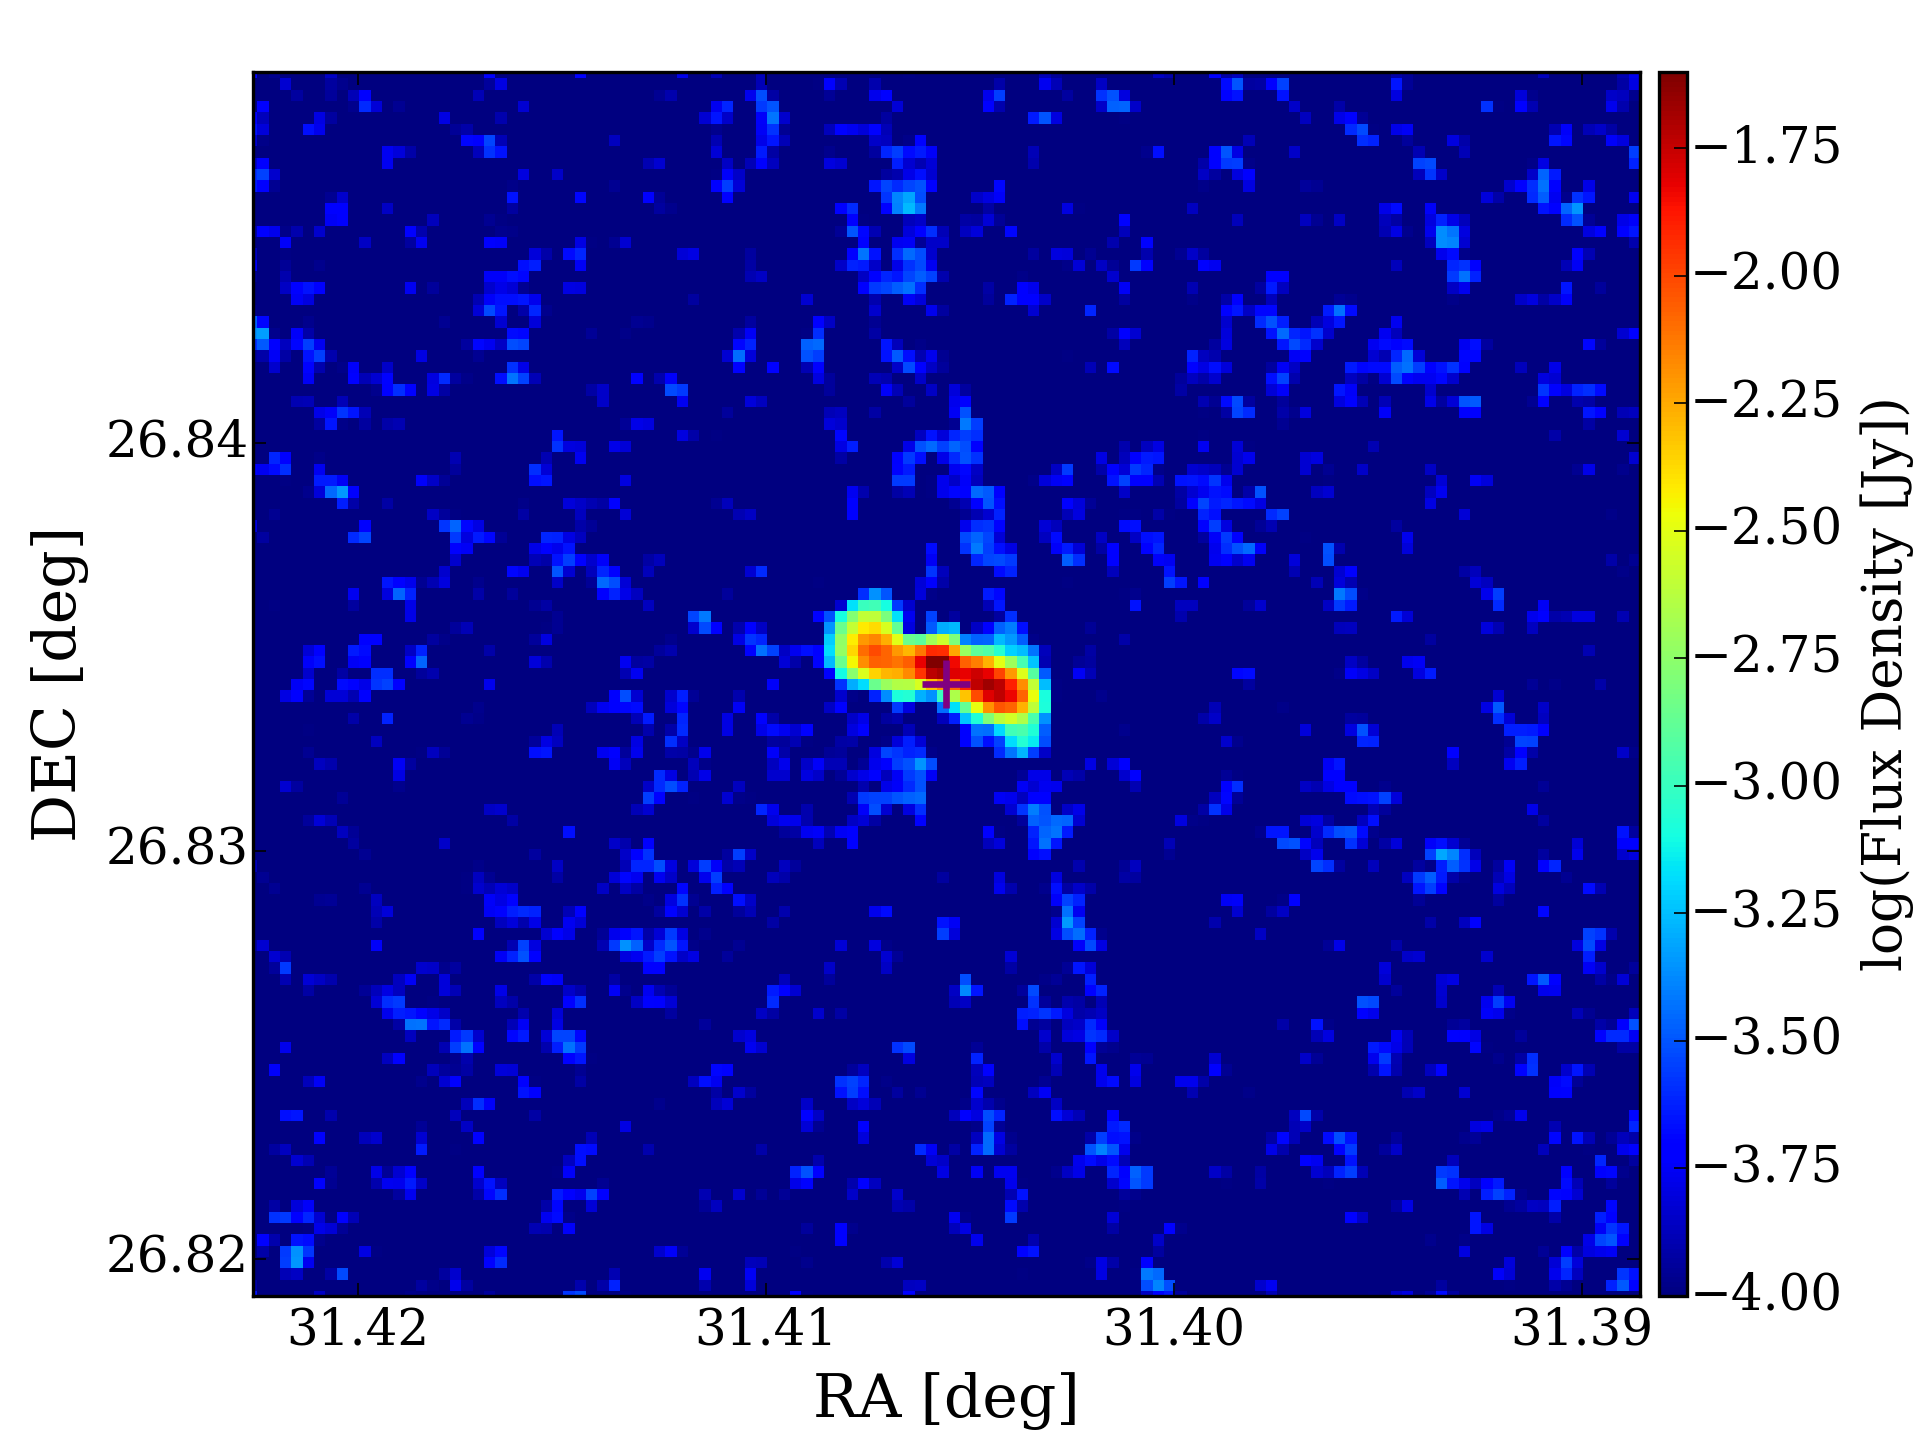
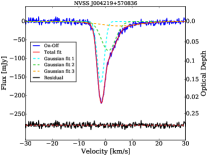
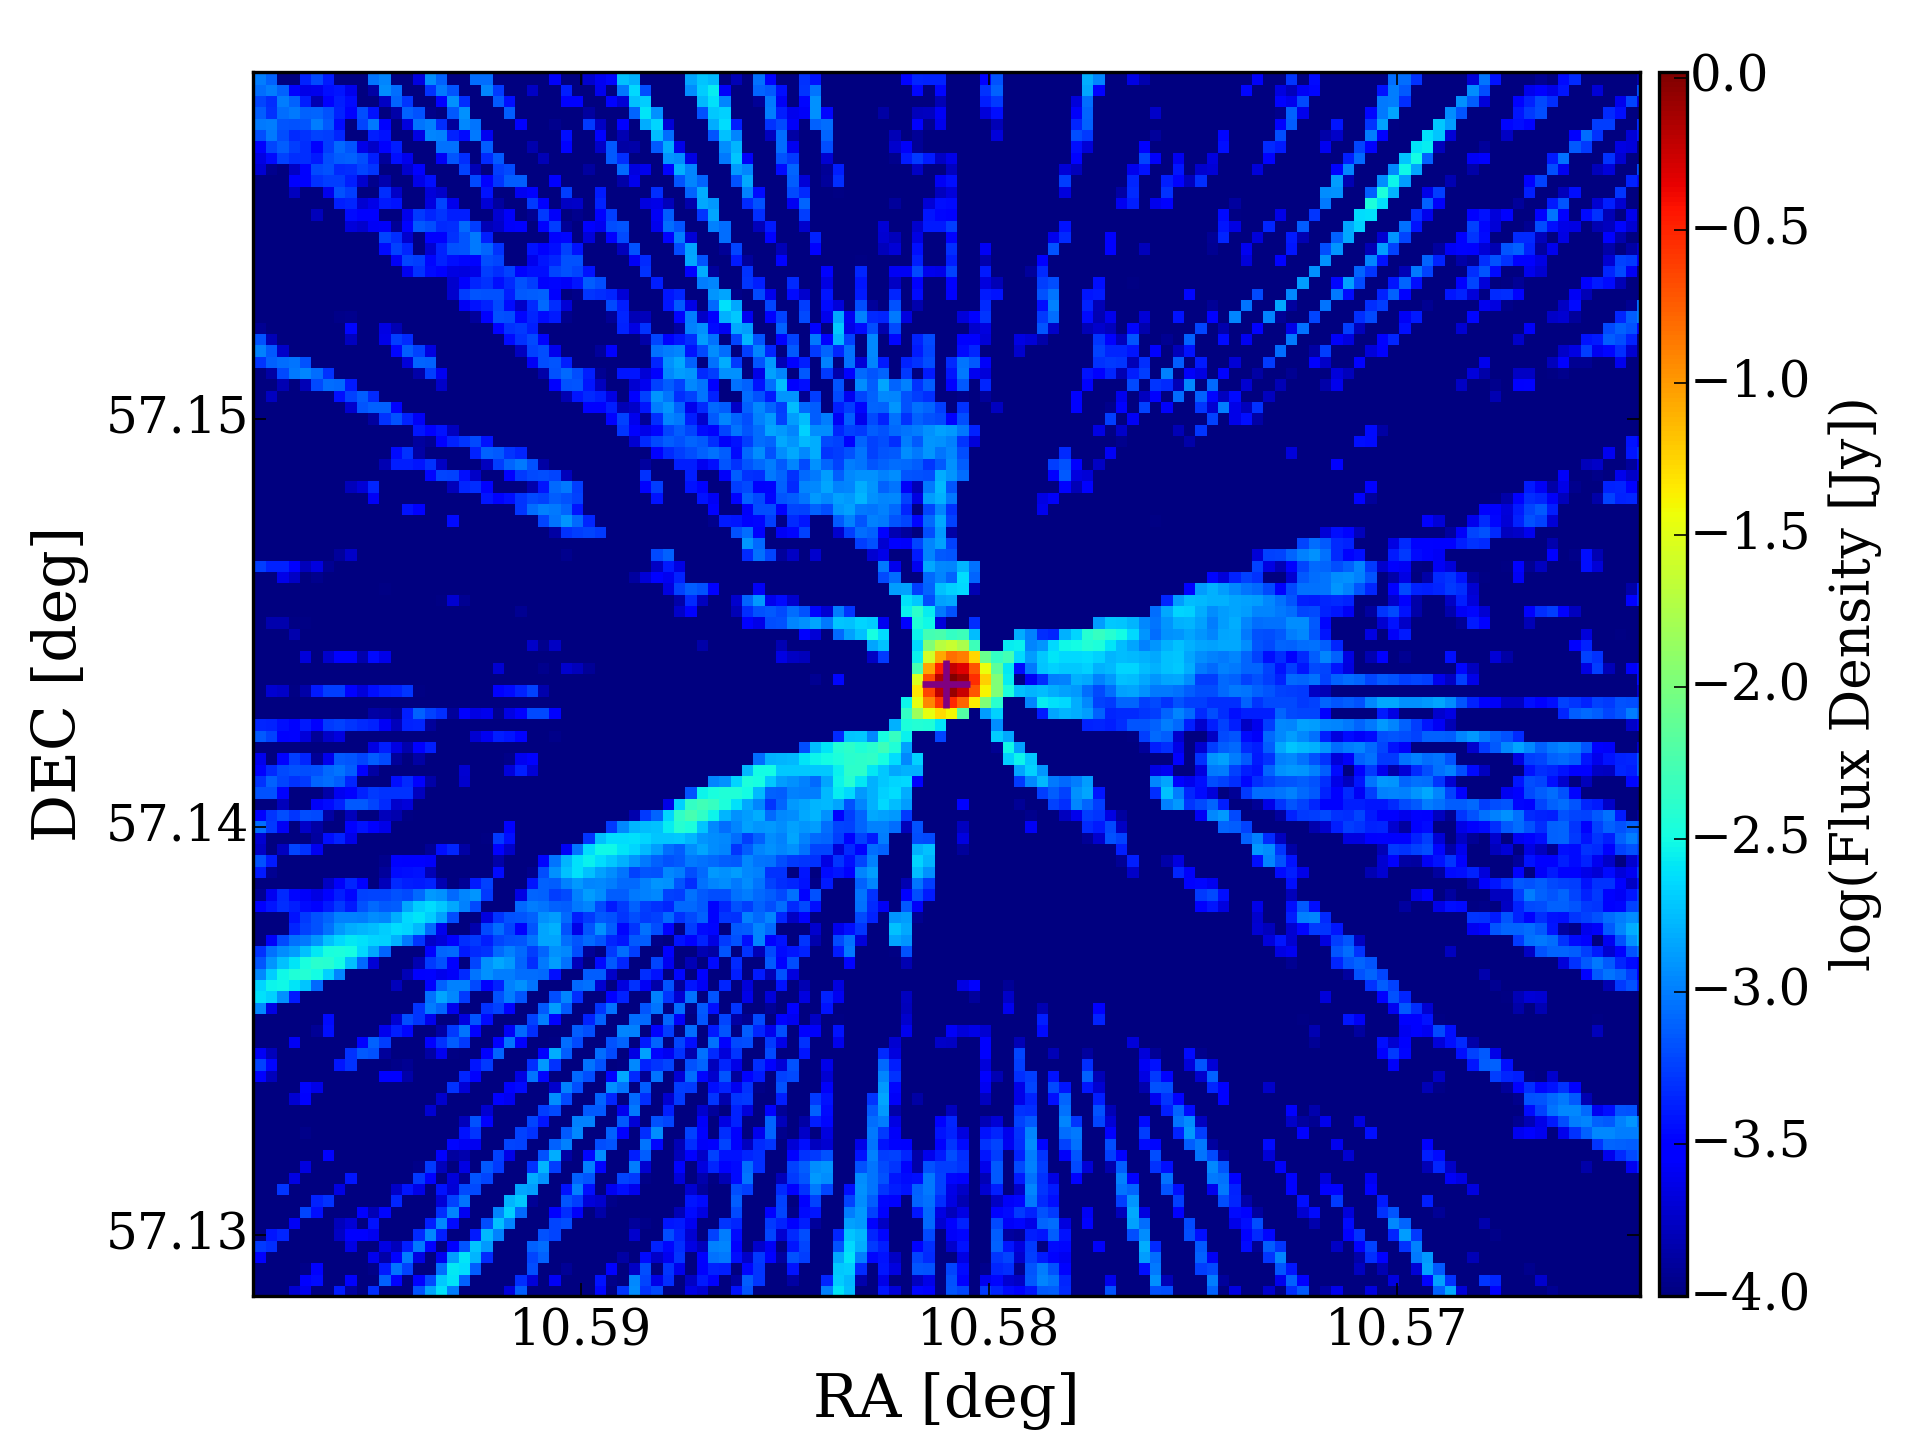
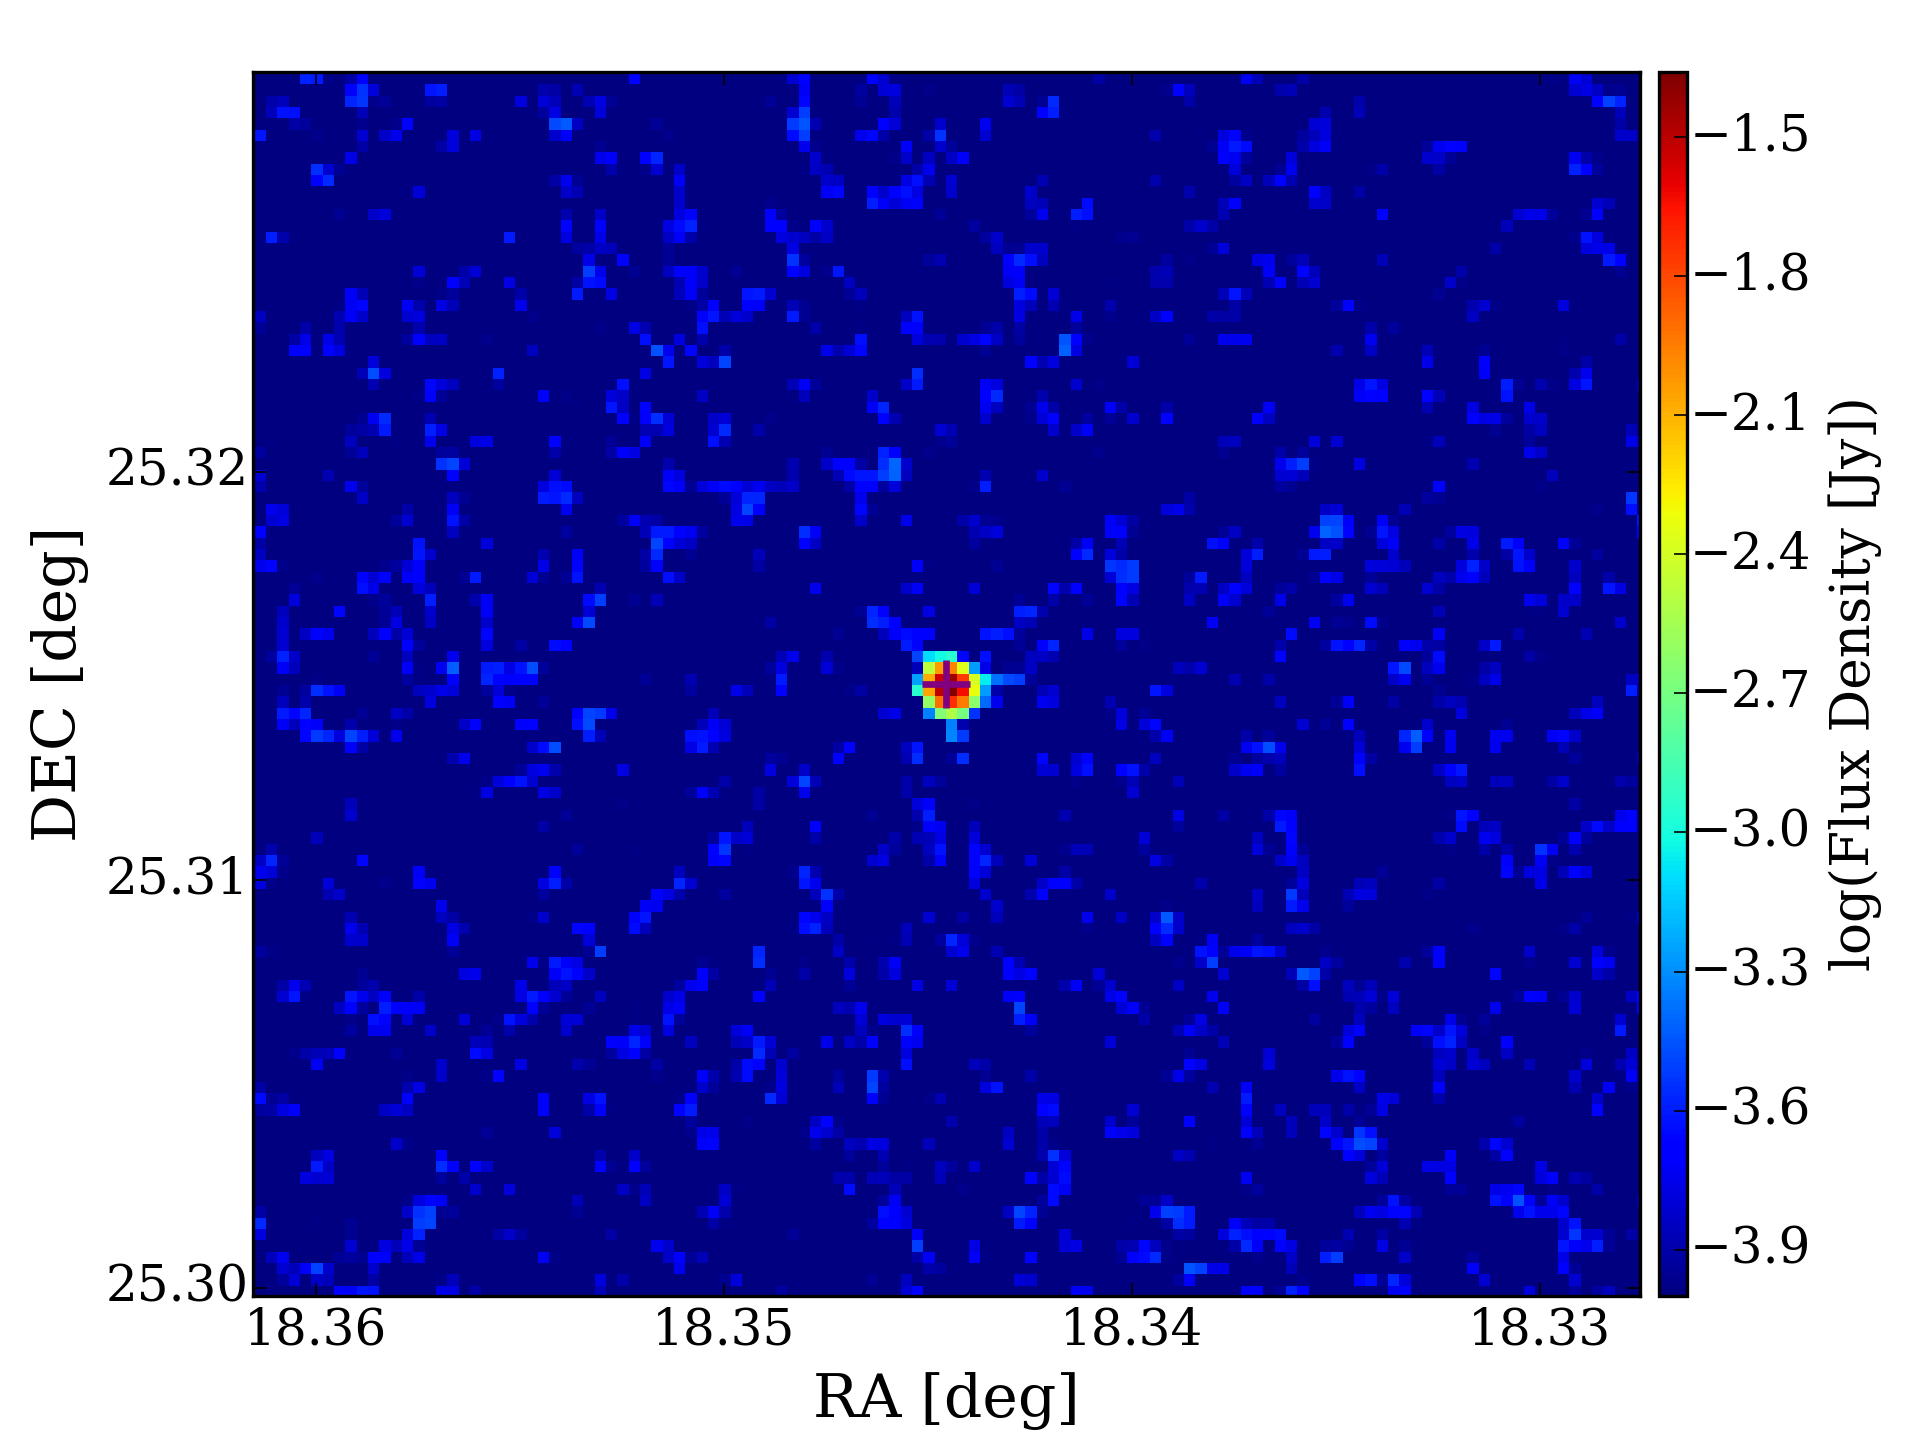
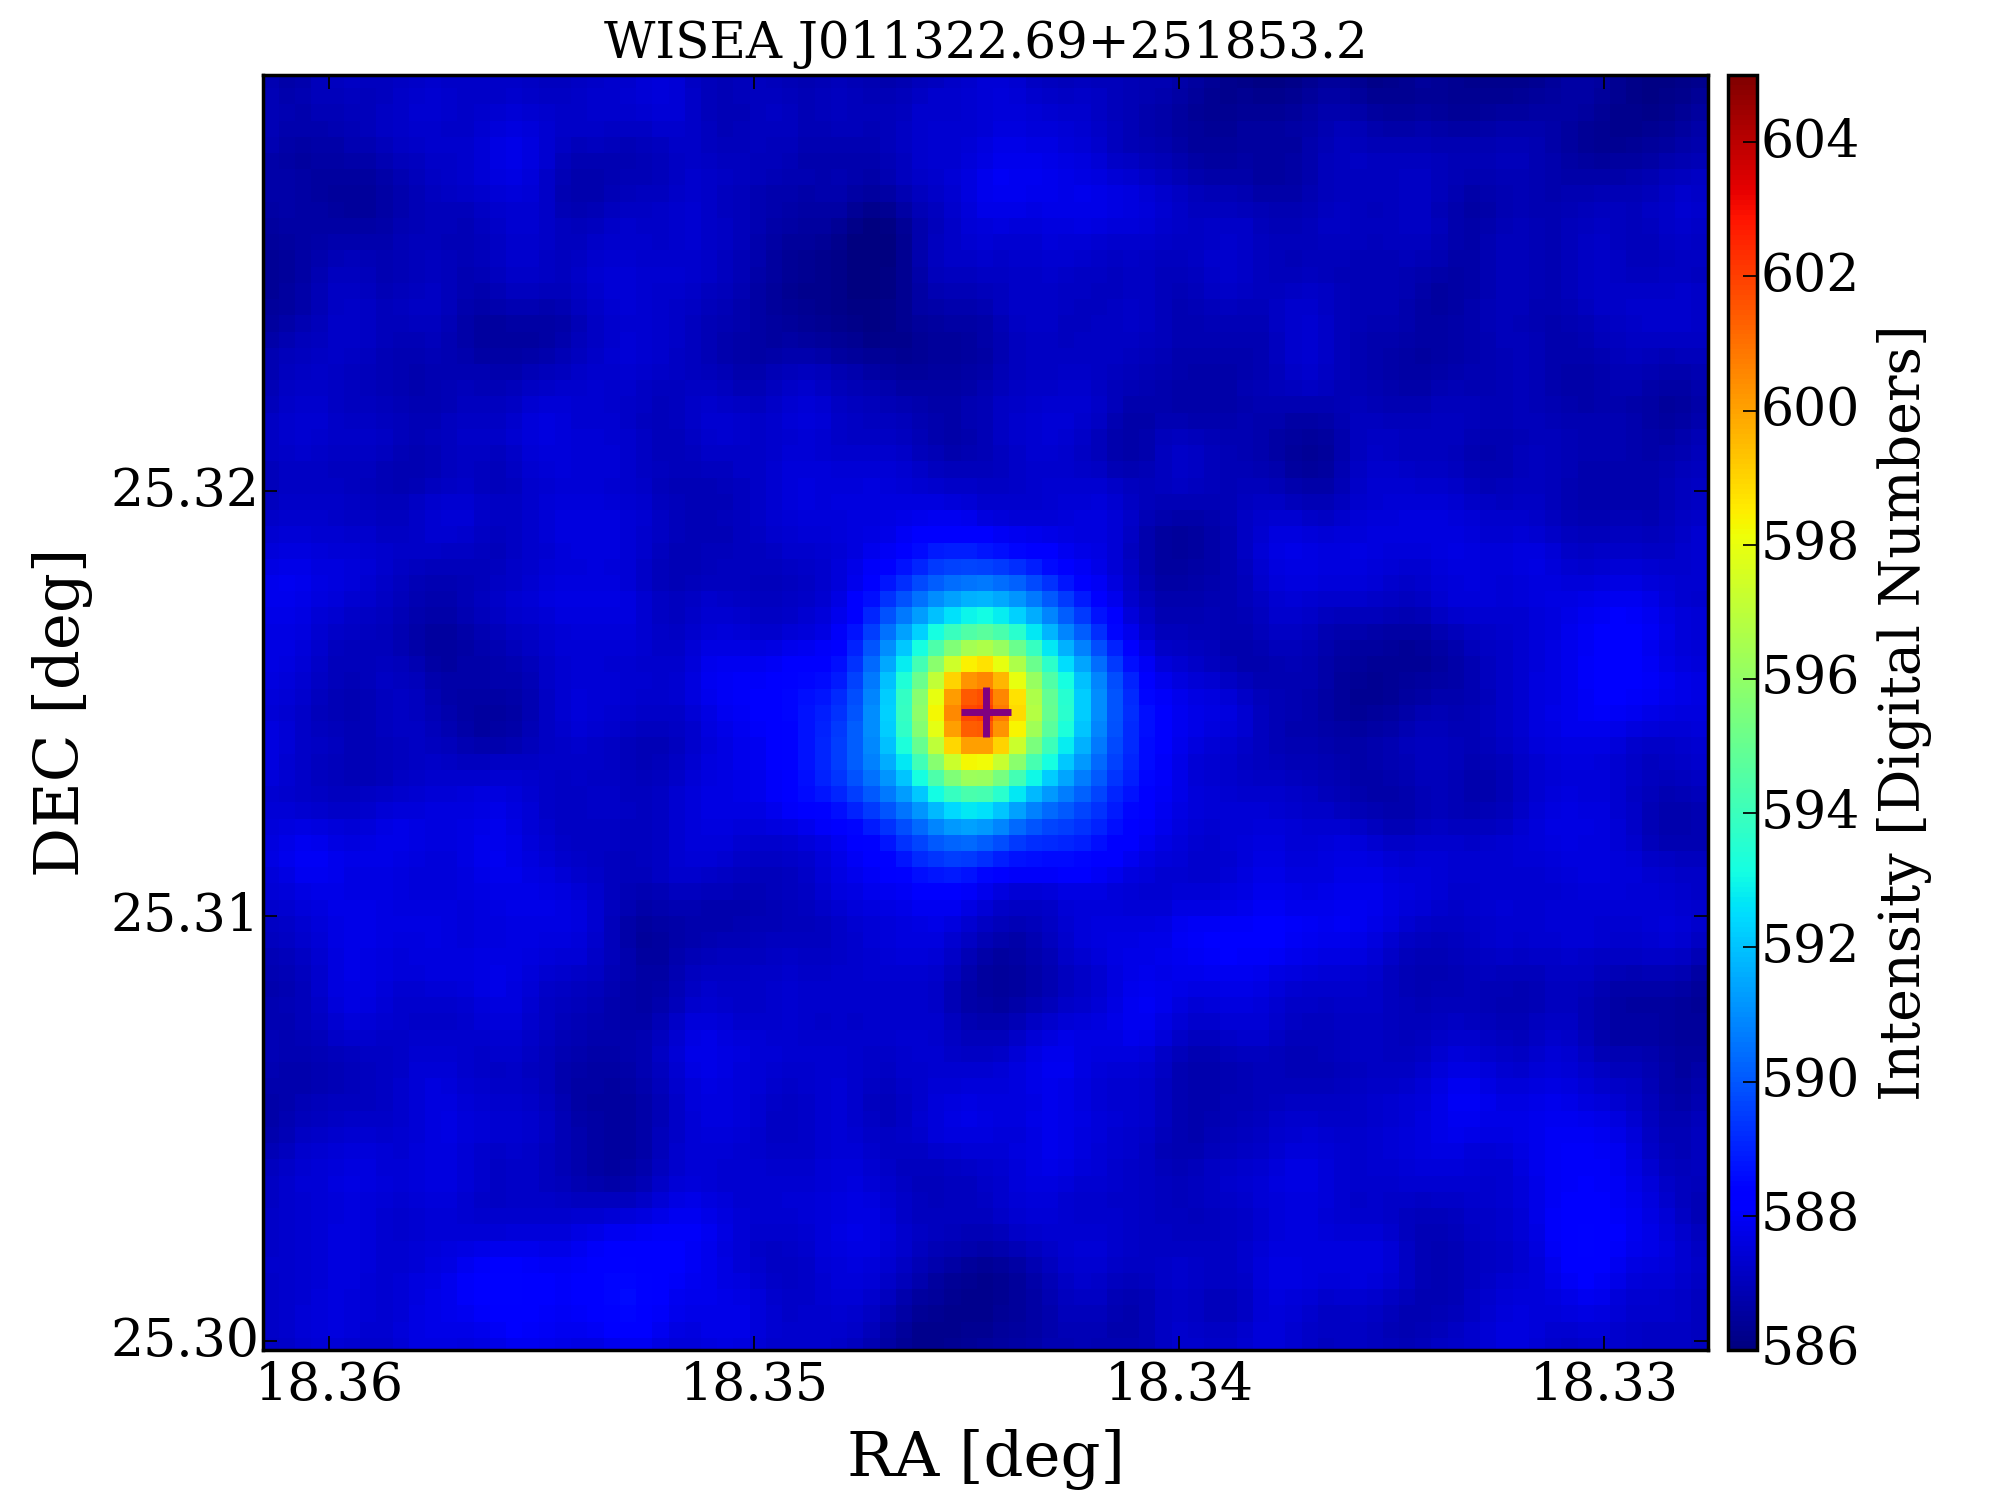
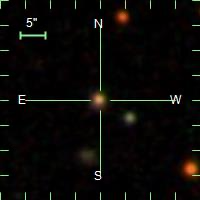
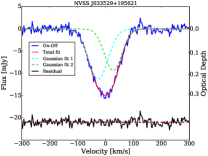
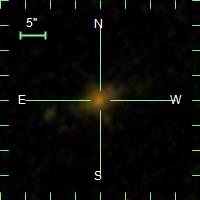
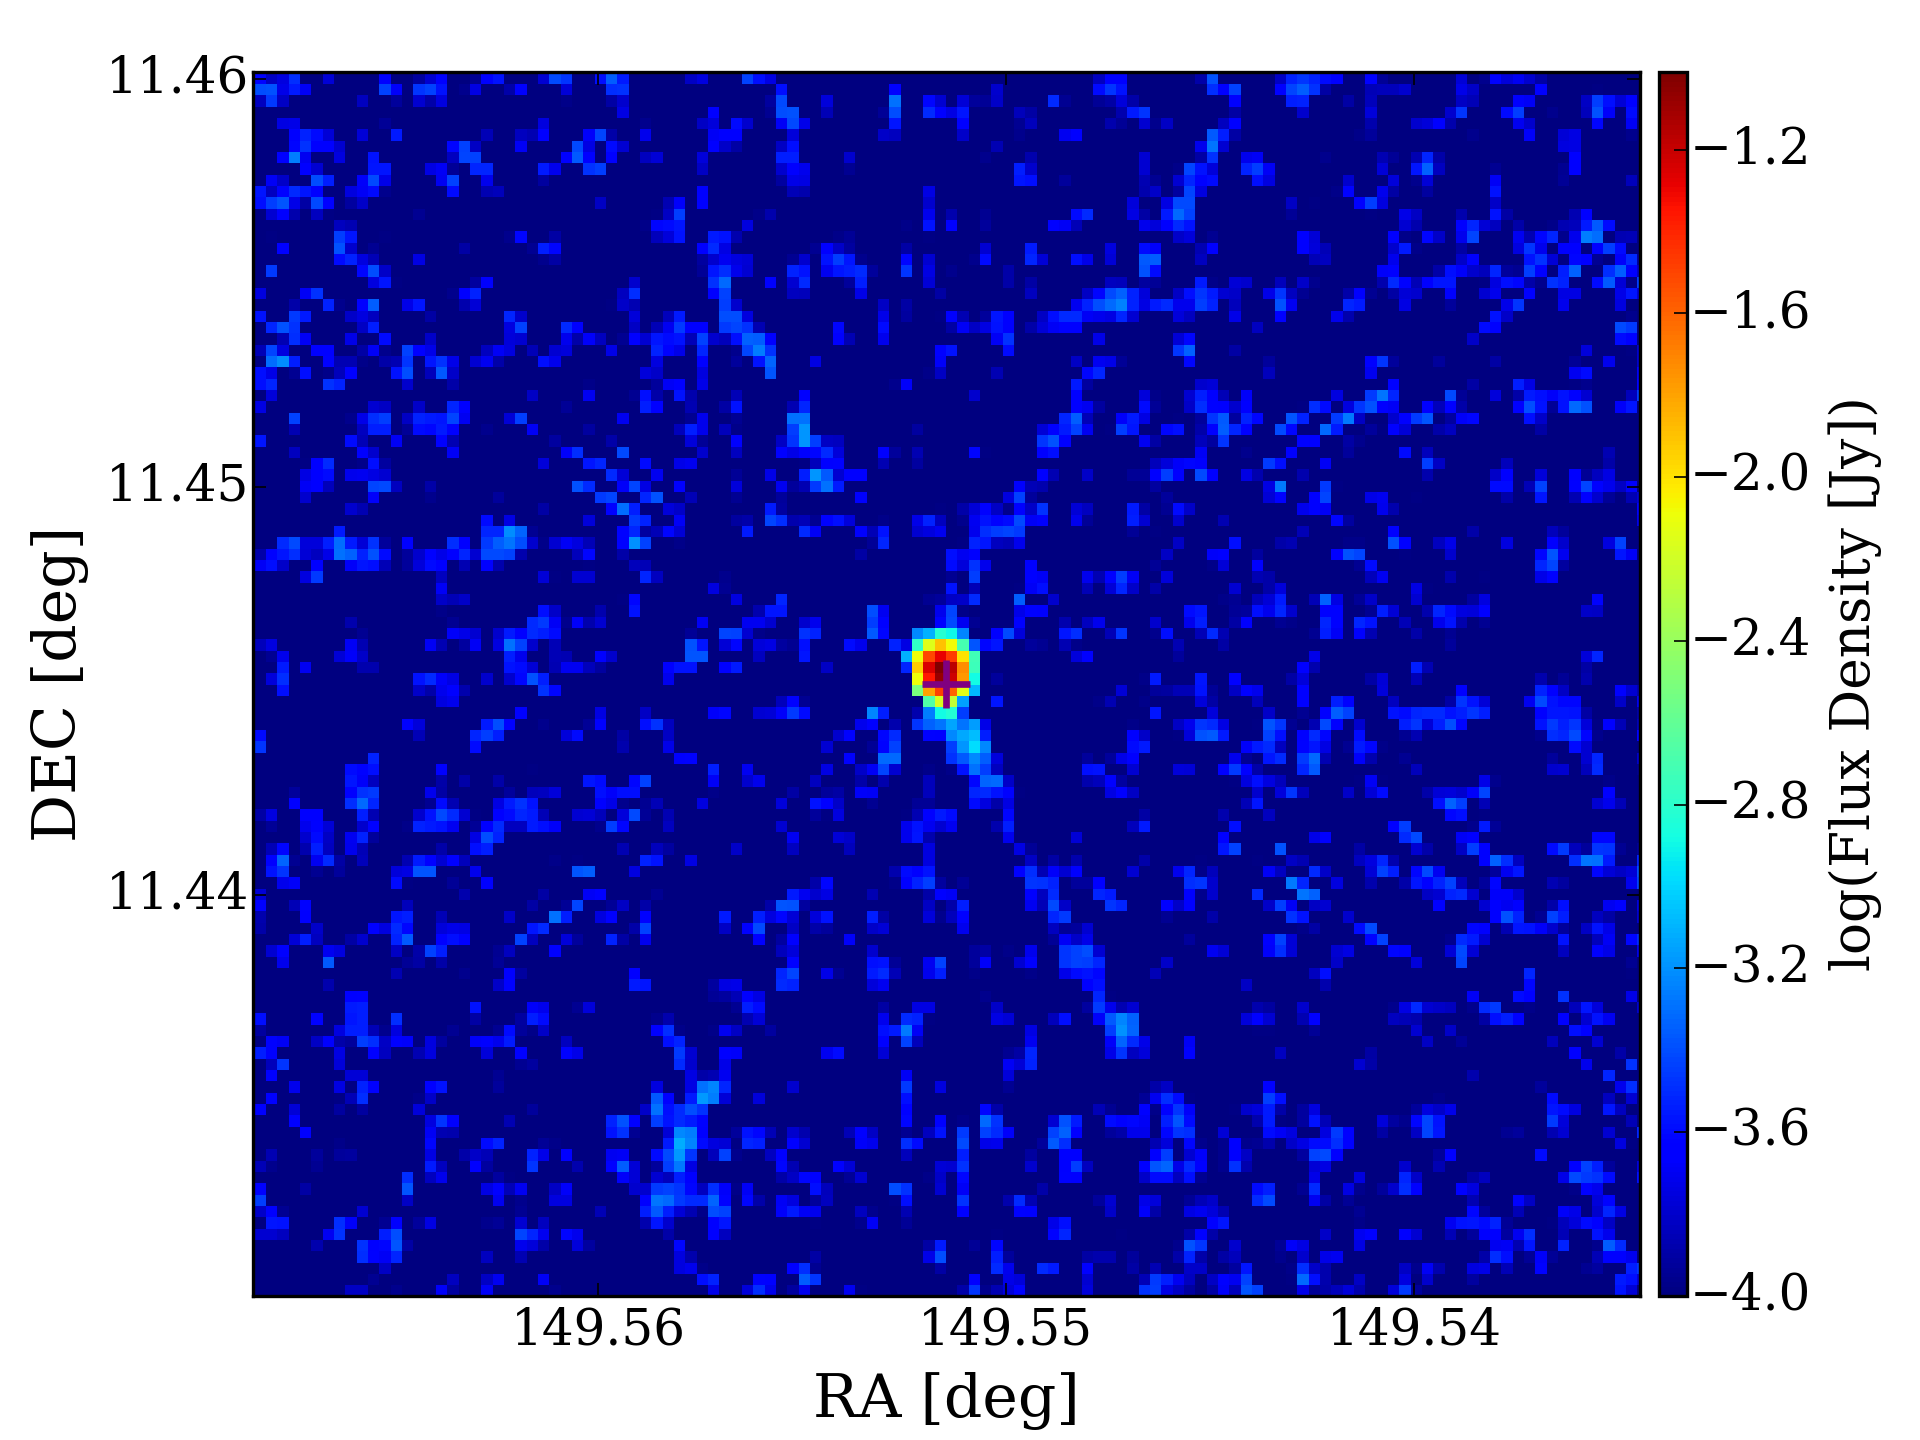
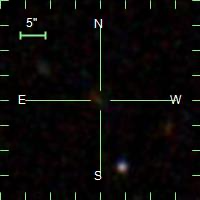
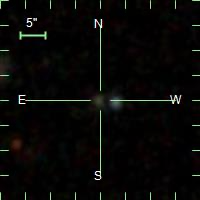
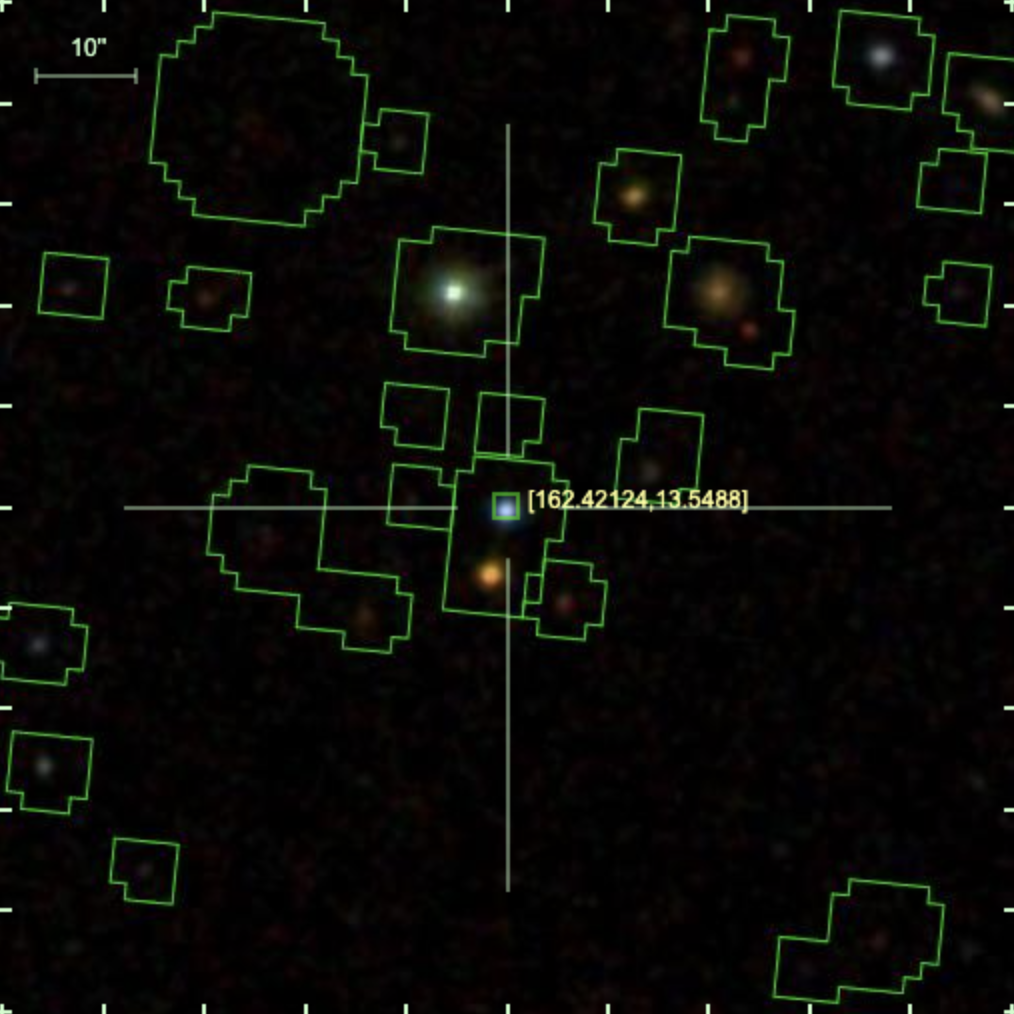
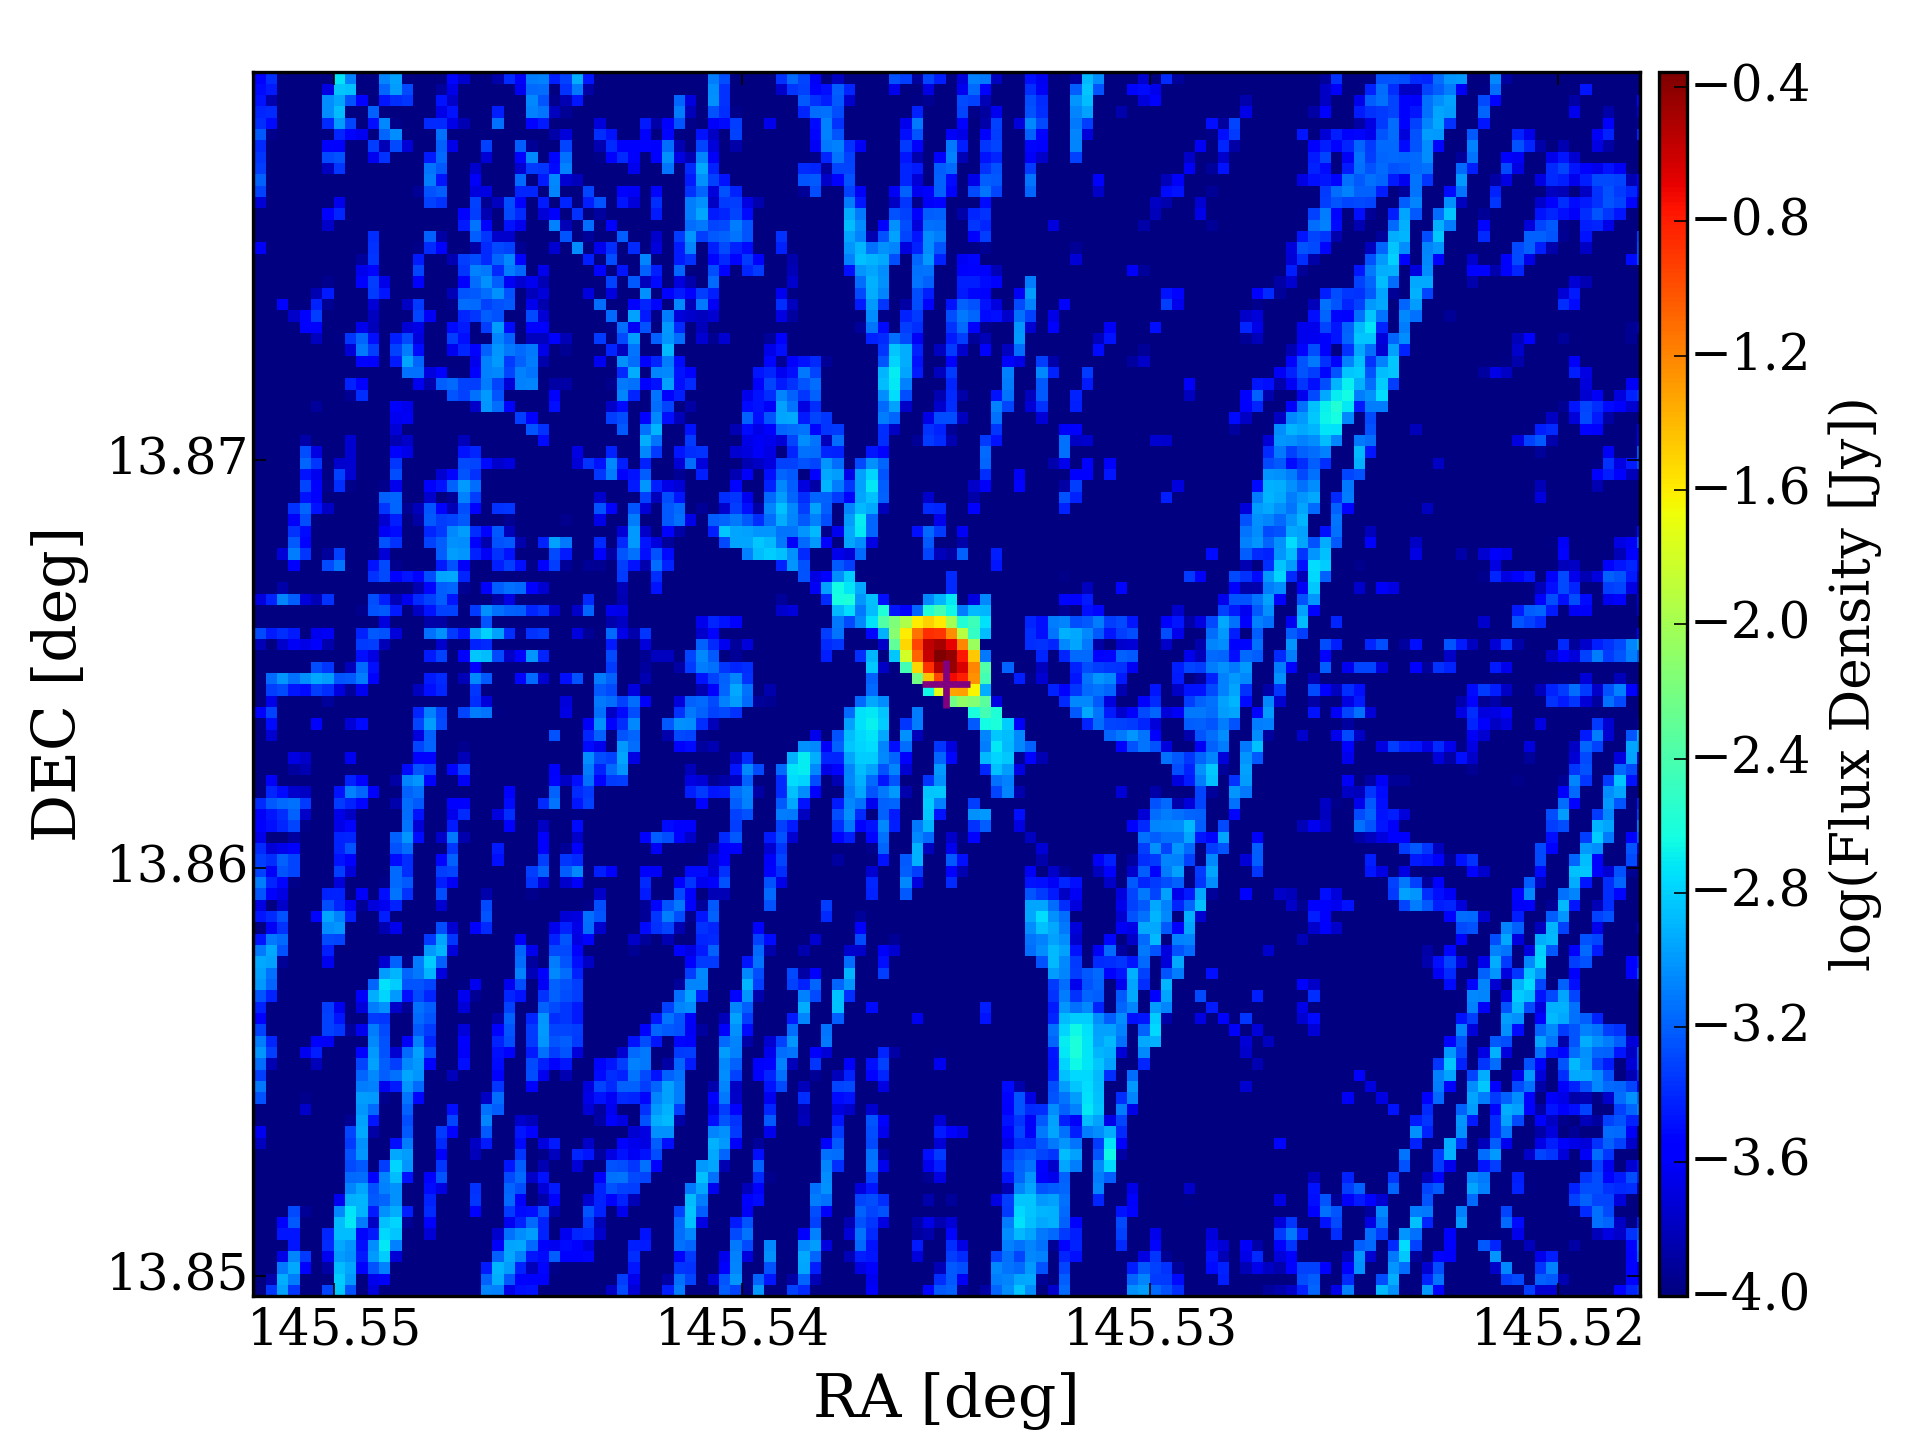
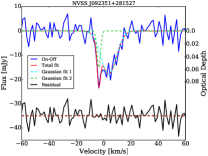
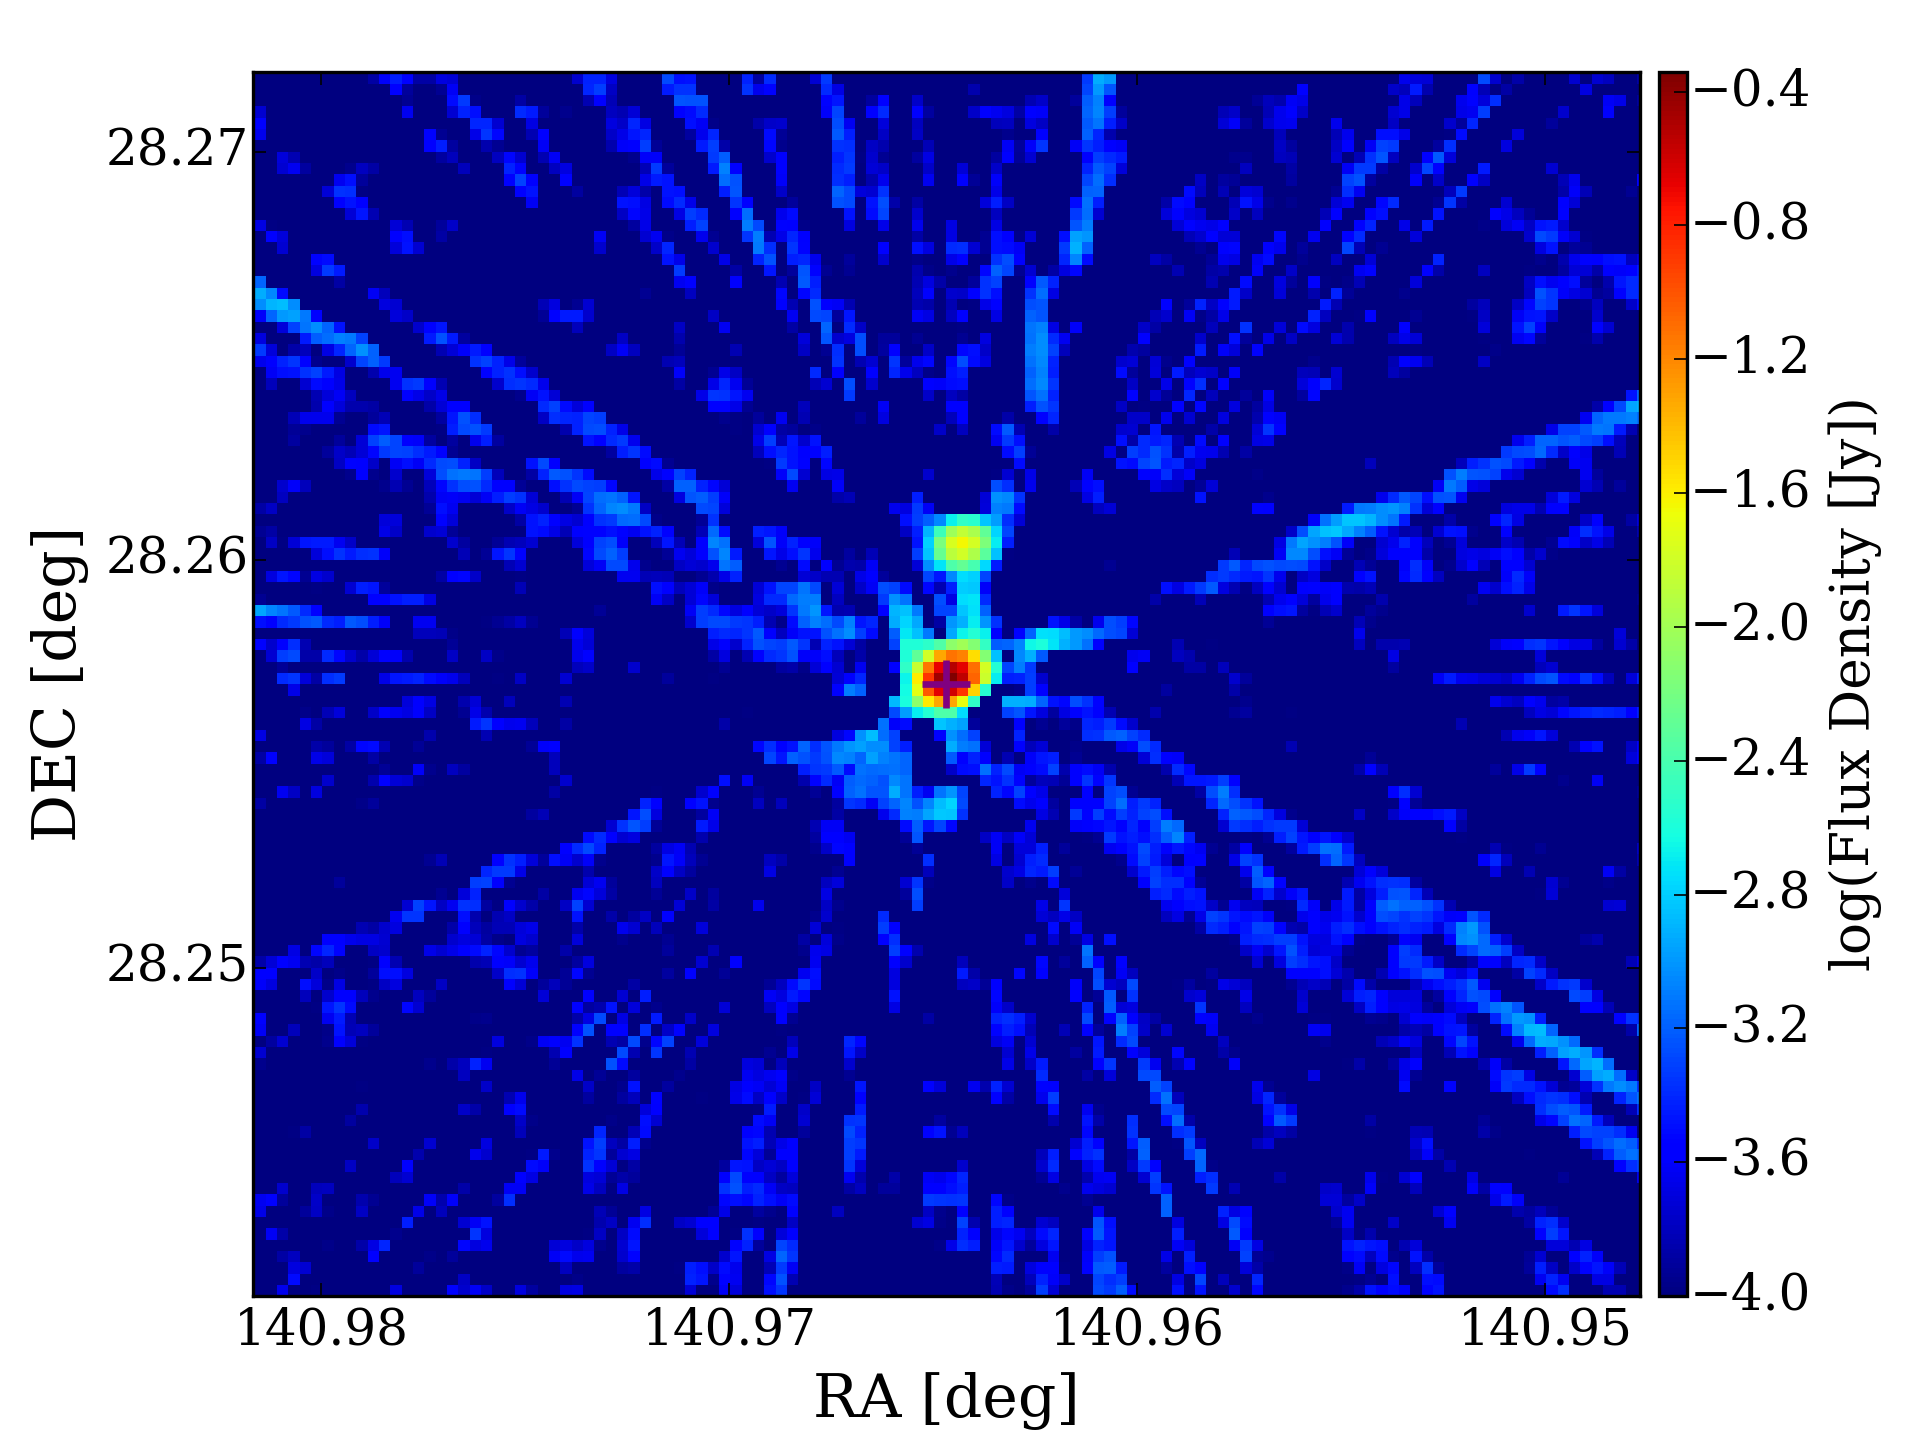
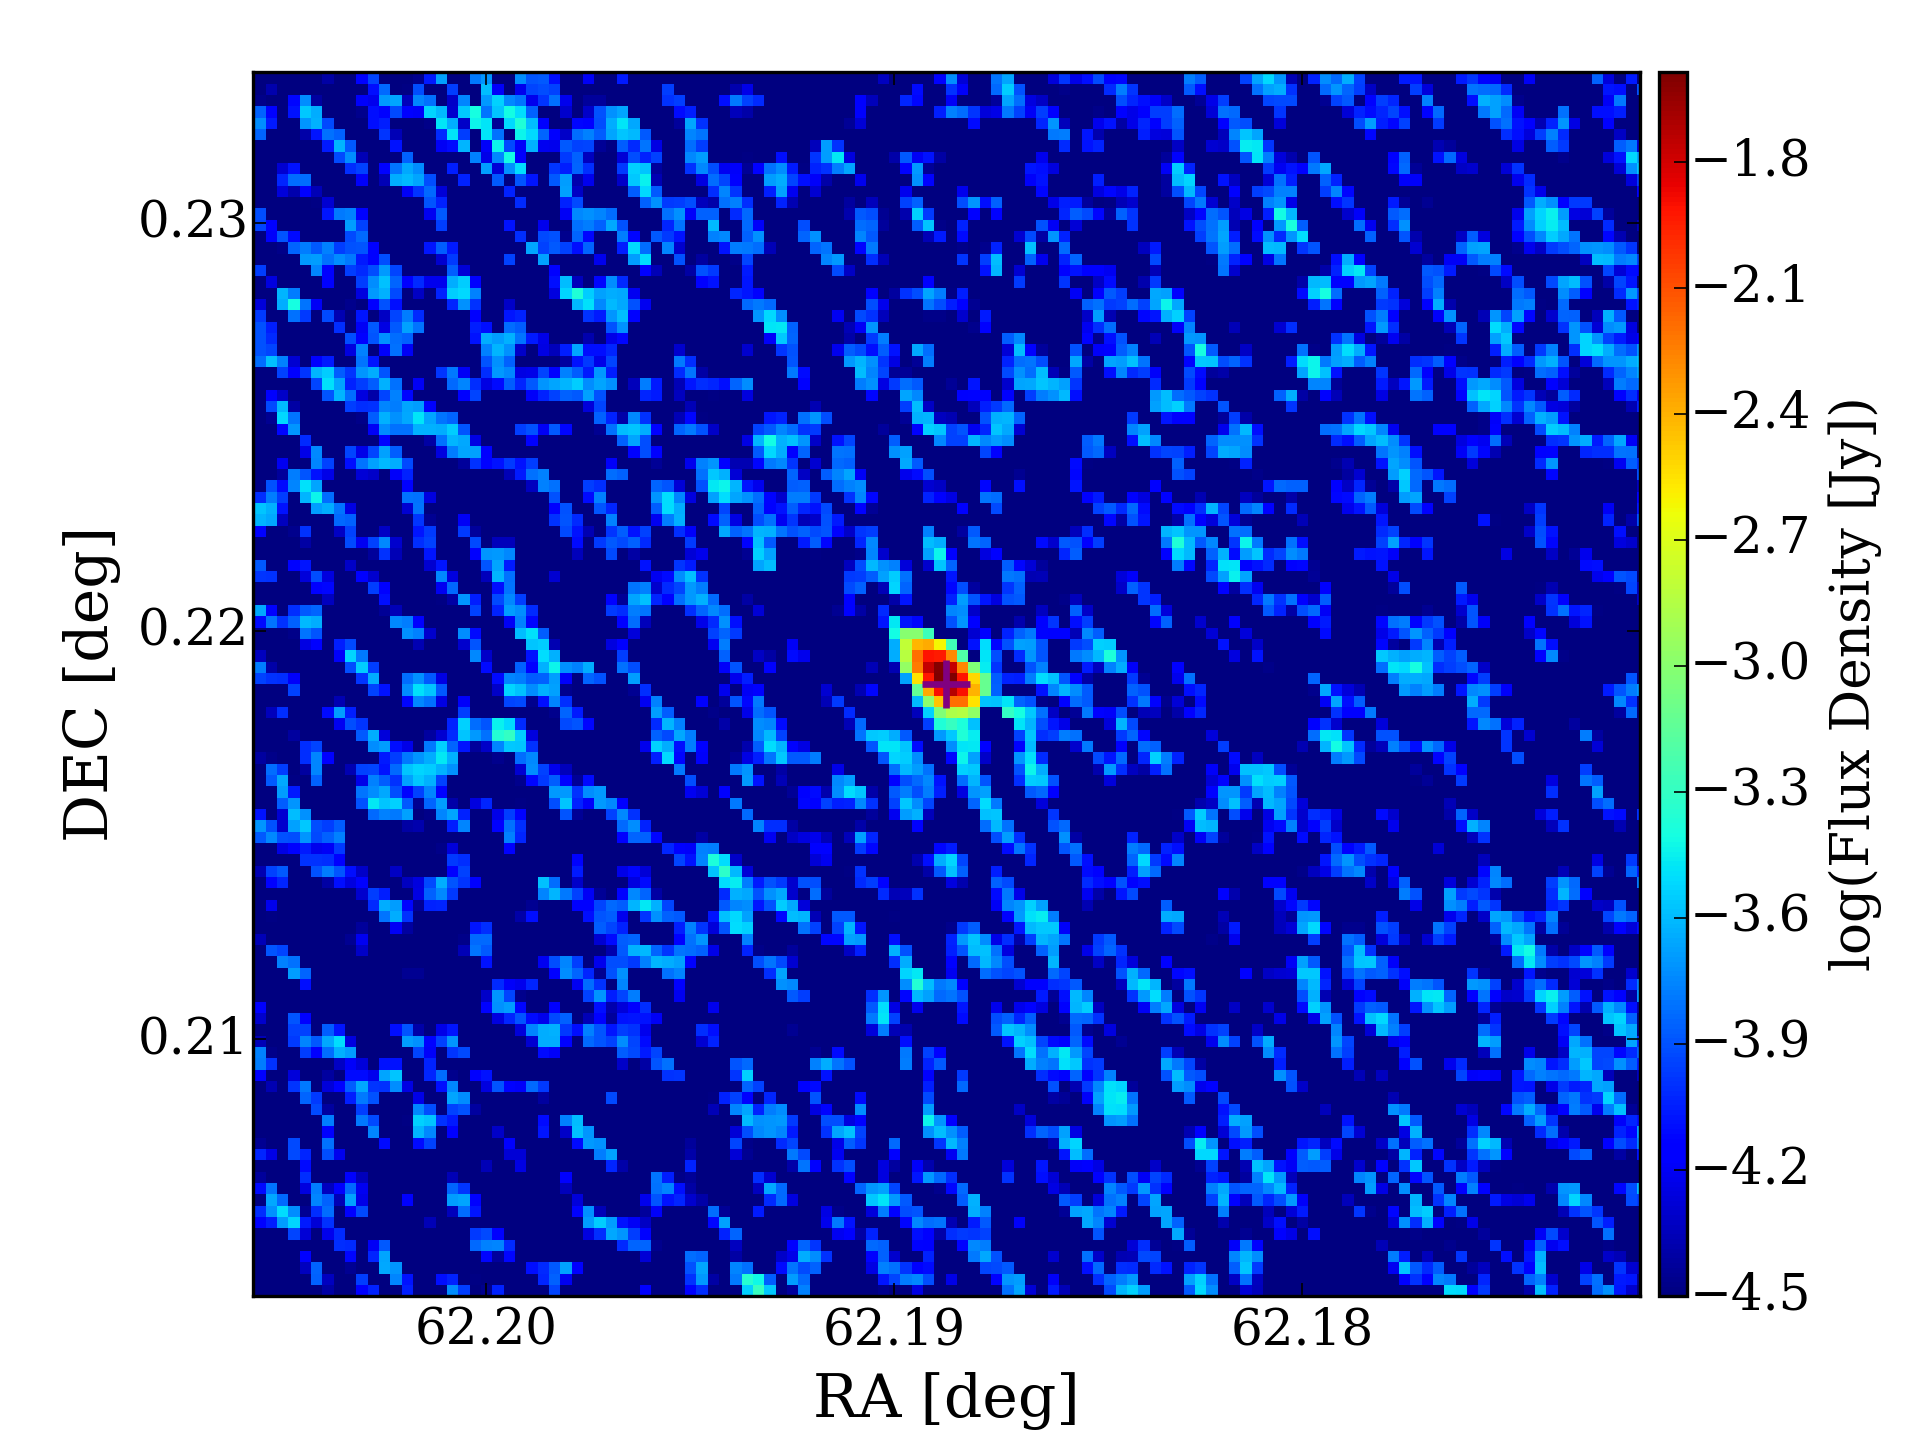
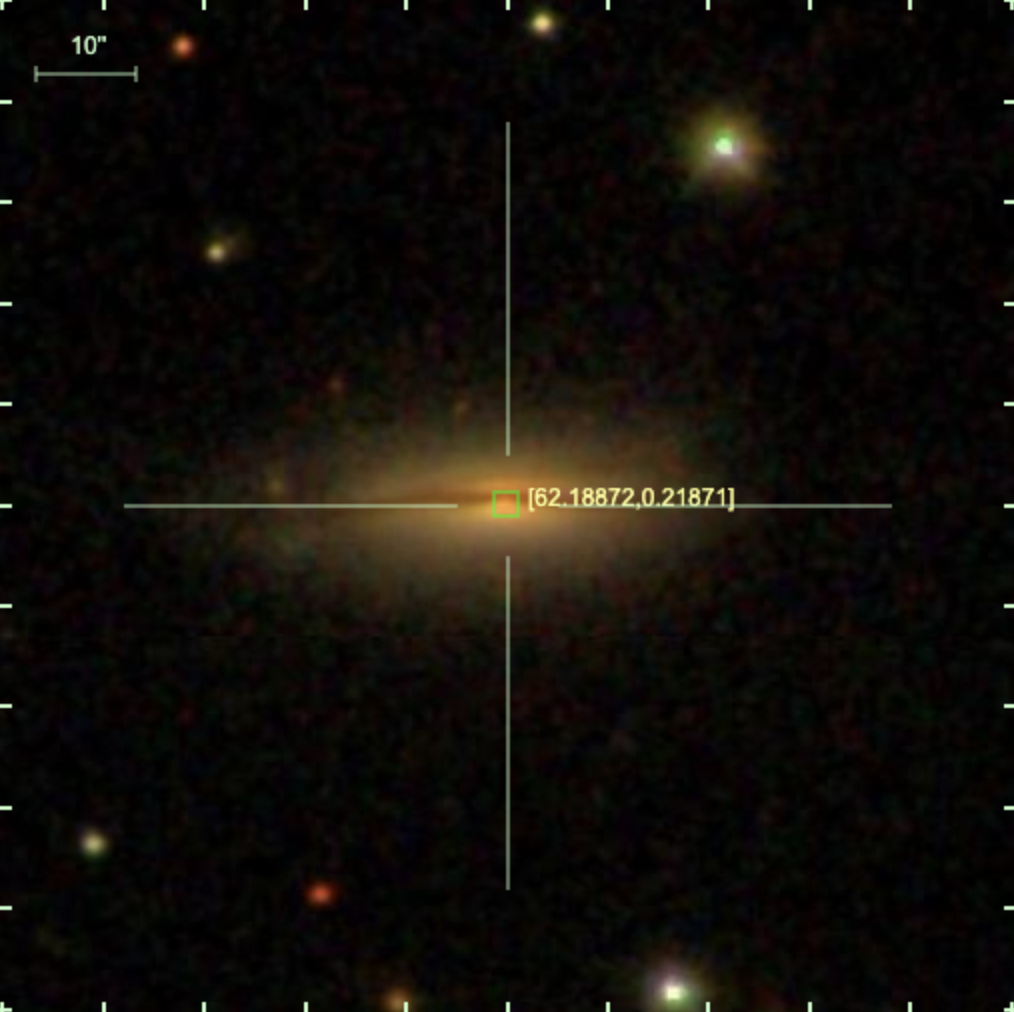
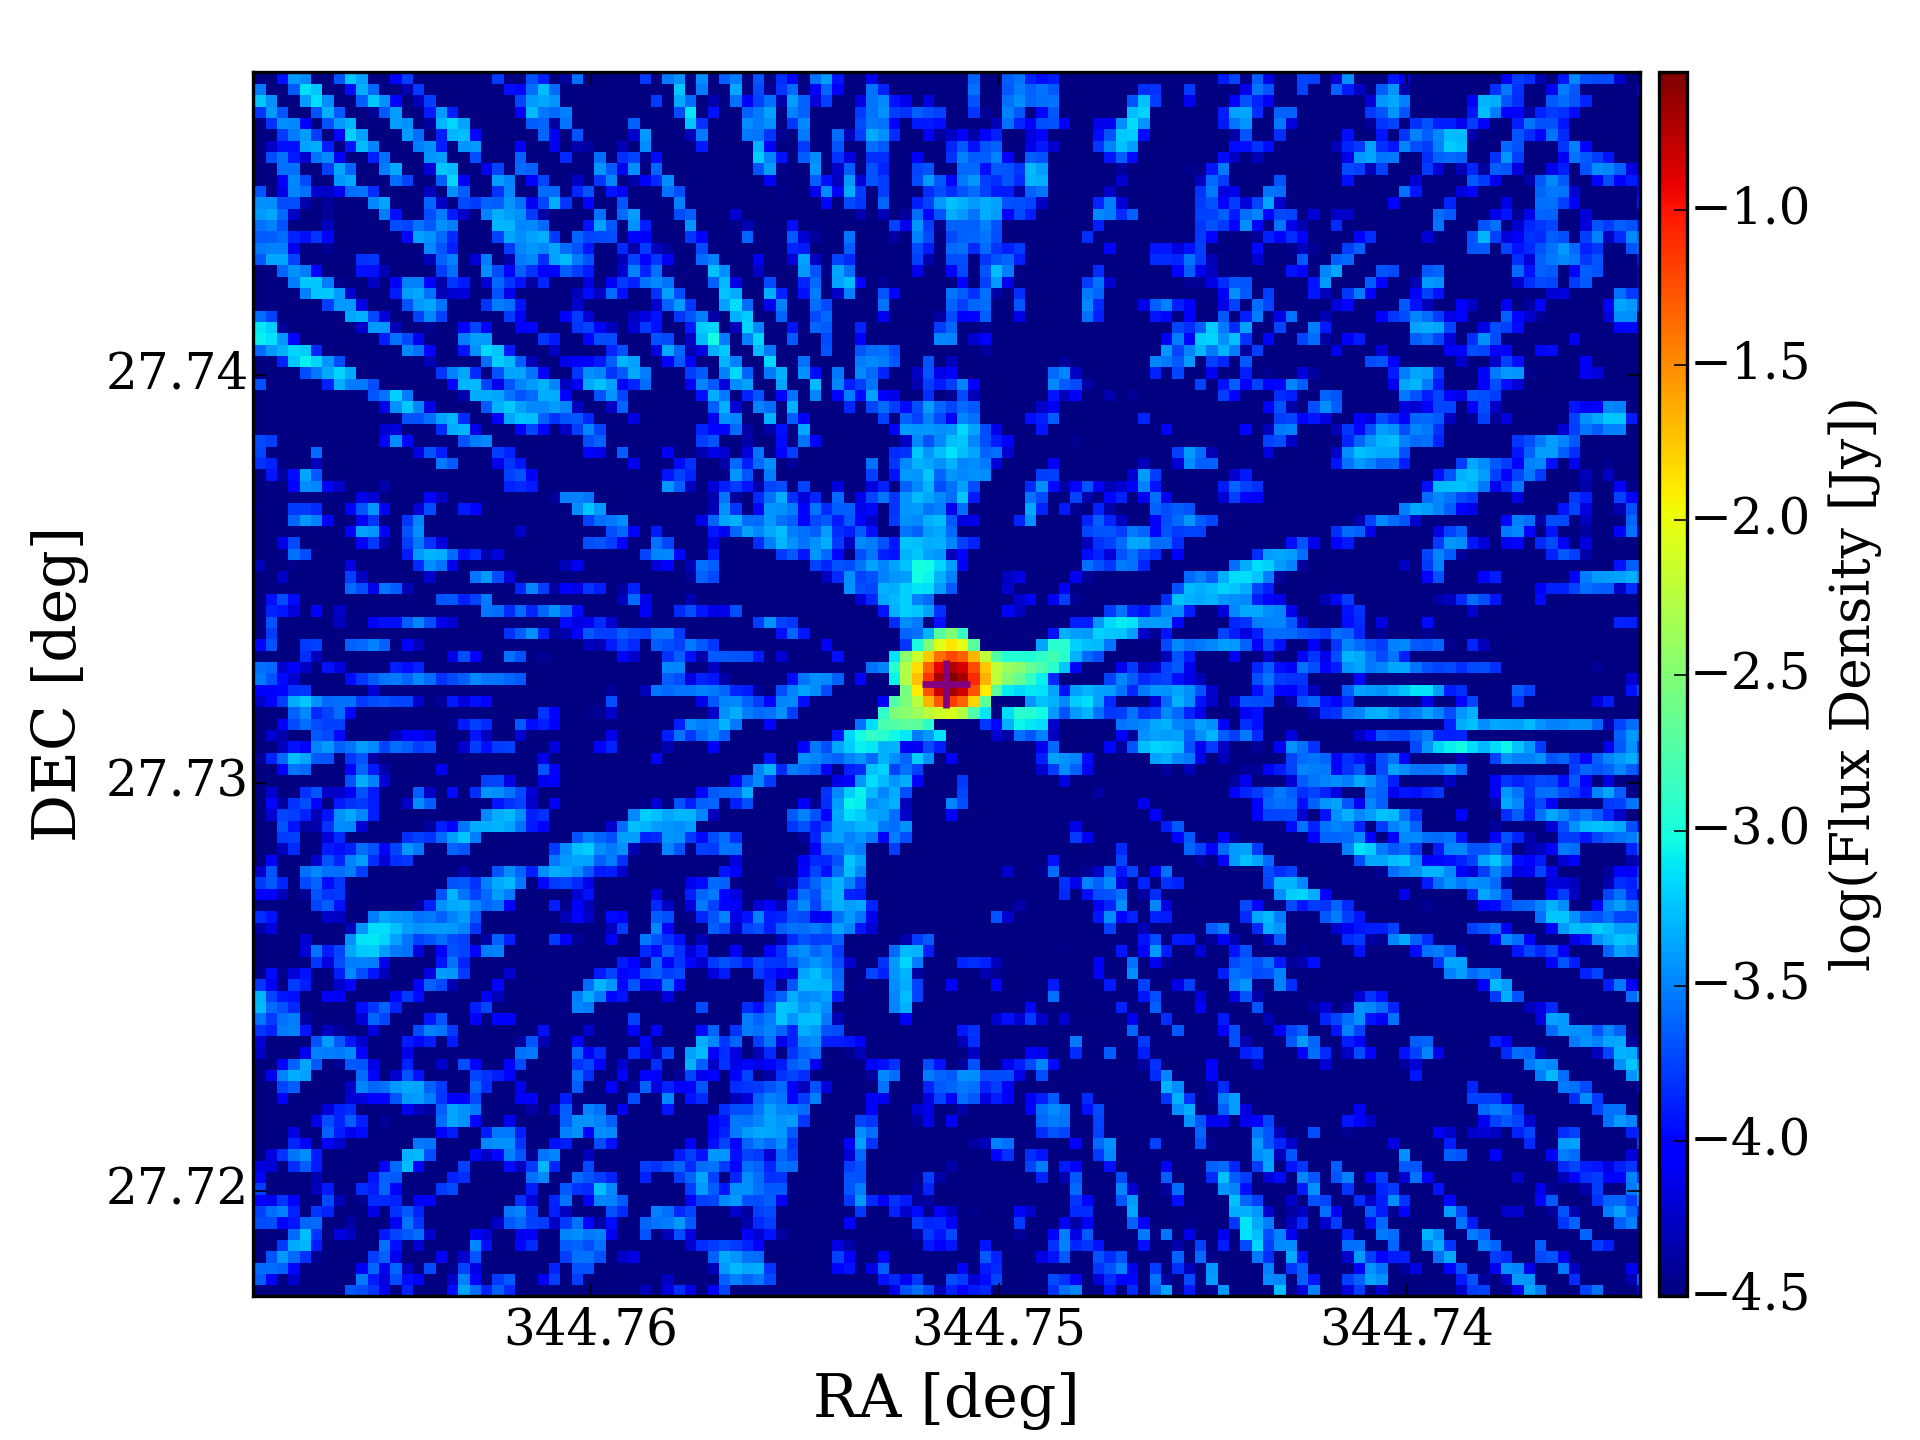
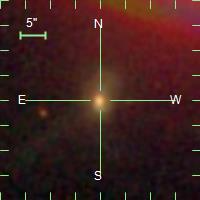
For each source, we display the absorption spectrum along with its Gaussian fitting. Additionally, we present an image centered on the radio source, created by using radio data at S-band from the Karl G. Jansky Very Large Array Sky Survey (VLASS, Lacy et al. (2020)), along with infrared data from WISE and optical data from SDSS (when available).
We document the fundamental physical information for each radio source in Table 1. Tables 2 and 3 display infrared and optical magnitudes corresponding to the WISE and SDSS counterparts of the radio sources, respectively. Table 4 shows the measurements of Hi absorption signals and the corresponding Hi column densities for previously identified absorption. Additionally, Tables 5 provides the same information for the newly detected absorbers.
4.1 Previously Known Absorbers
4.1.1 4C +31.04
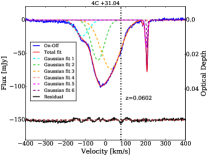
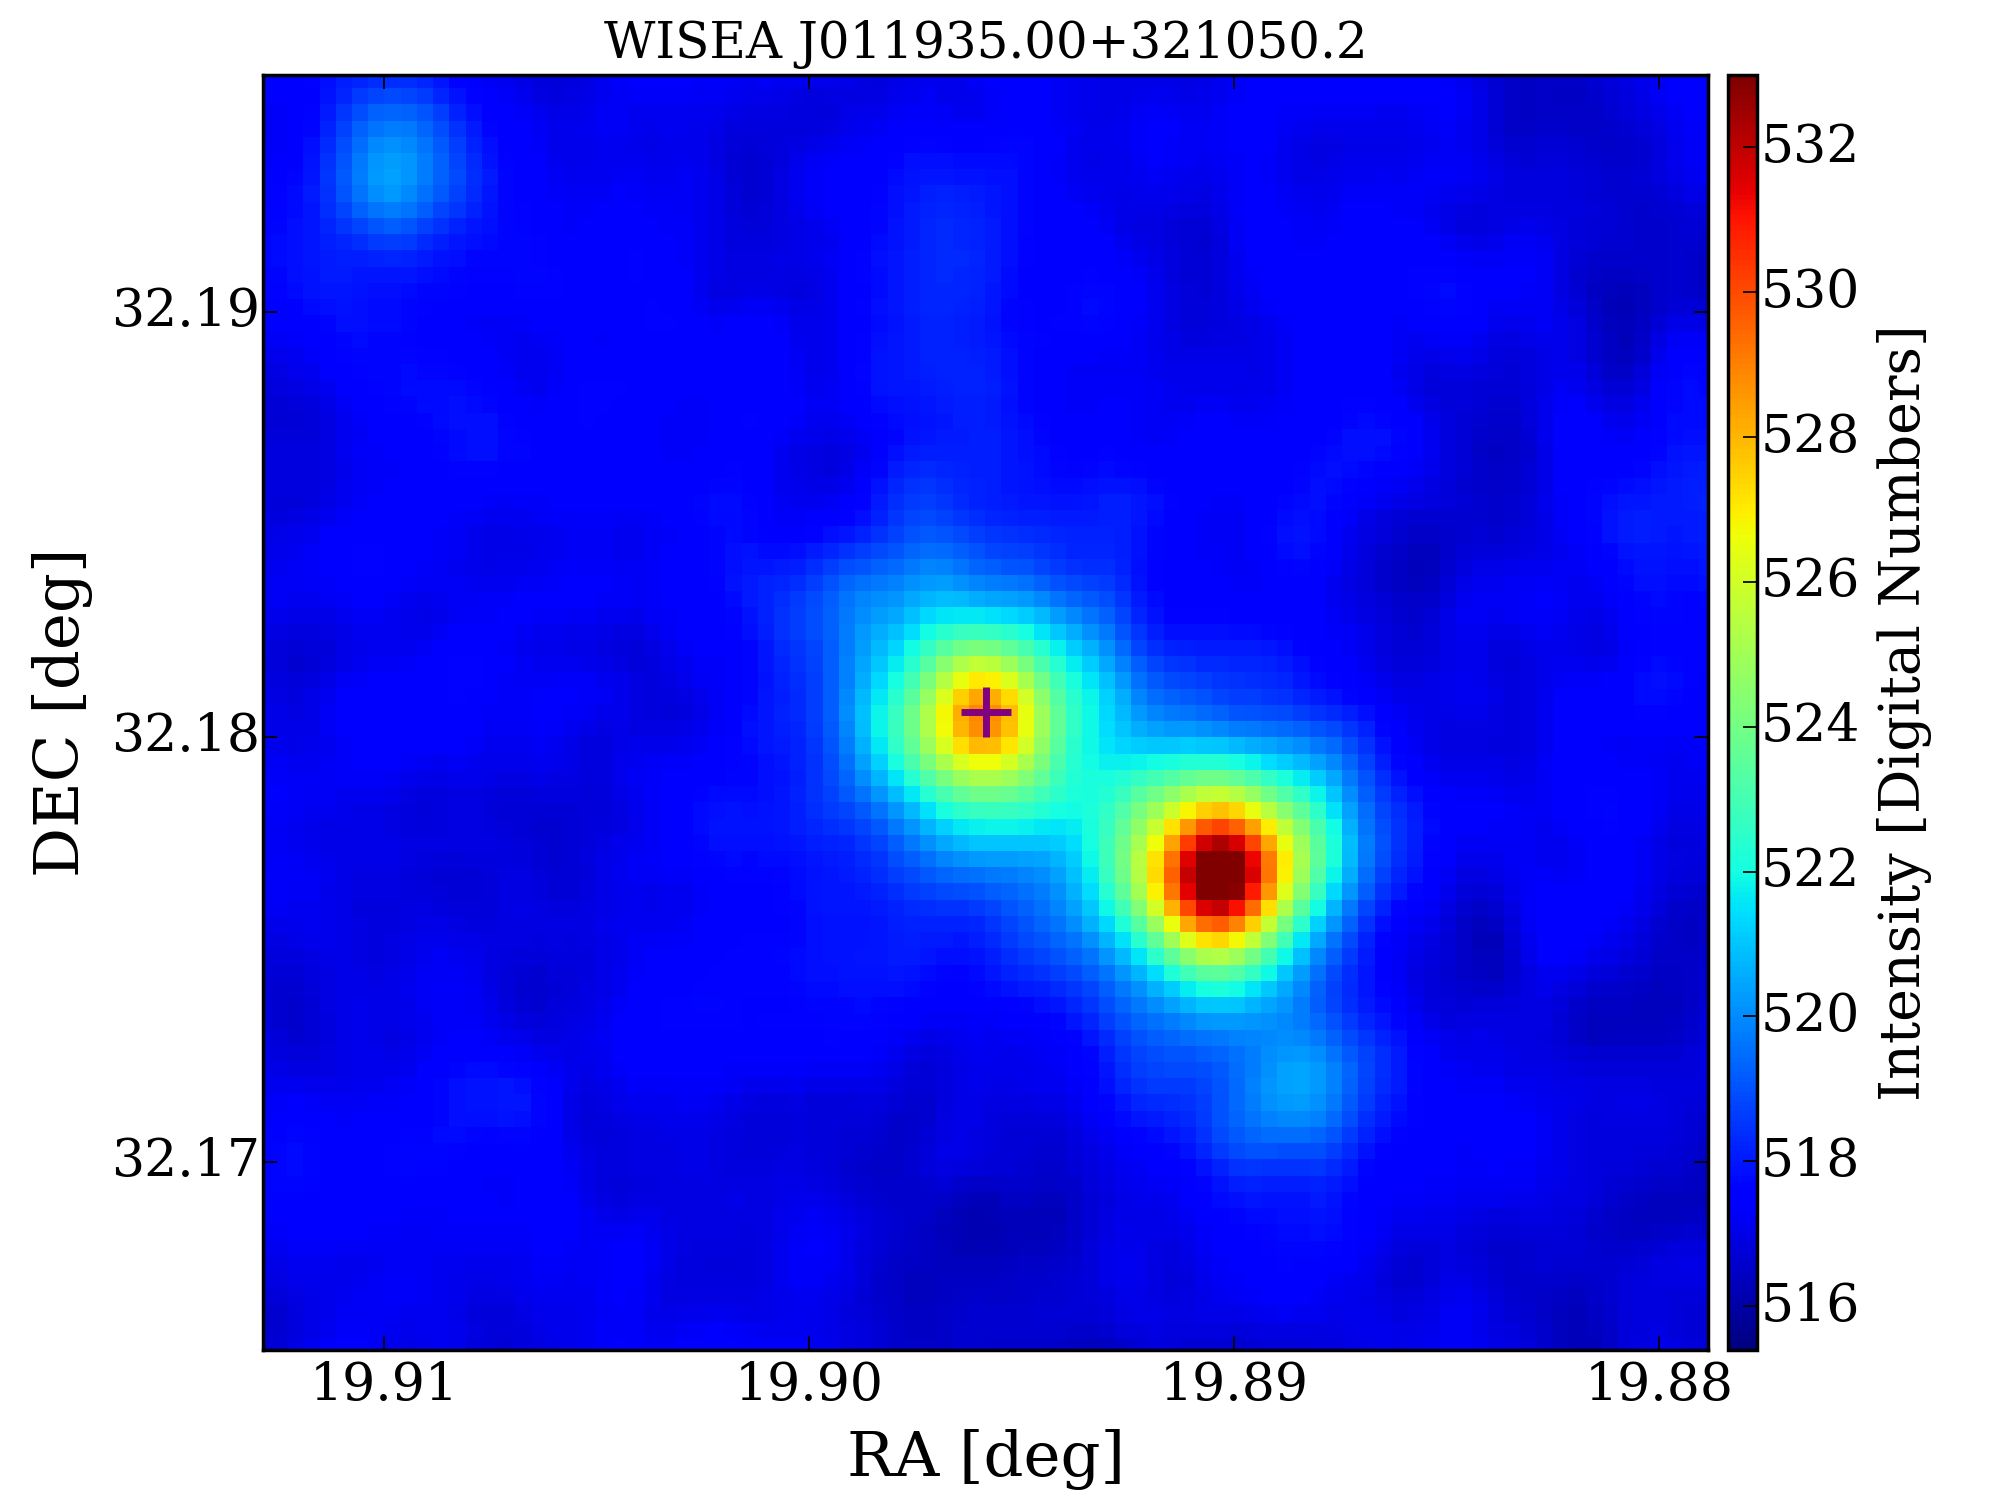
4C +31.04 (Figure 2) is a GHz-peaked spectrum (GPS) and Compact Steep Spectrum (CSS) source with compact-symmetric-object (CSO) morphology (Giroletti et al., 2003; Ostorero et al., 2017). The host galaxy of 4C 31.04 is MCG 5-4-18, a giant elliptical galaxy with a Seyfert 2-like optical spectrum. 4C +31.04 has two asymmetric lobes, suggesting strong interactions between the jets and a dense ISM (Giovannini et al., 2001). Shocked molecular and ionized gas resulting from jet-driven feedback in 4C +31.04 was observed and reported by Zovaro et al. (2019). The jet-blown bubble pushes a forward shock into ambient ISM, giving rise to [Fe II] emission. The H2 emission, arising from the shock-excited molecular gas, is also detected. 4C 31.04 has a close companion, MCG 5-4-17, which is a spiral galaxy at a projected distance of 20 kpc and a velocity offset of 1560 .
The WISE counterpart to 4C 31.04 given by NED is WISEA J011935.00+321050.2. The W1[]-W2[] color difference of value 0.8 is often used as a simple mid-infrared color criterion for AGN candidates (Stern et al., 2012). WISEA J011935.00+321050.2 has a W1-W2 of 0.021, indicating that the mid-IR emission comes mainly from stars.
The Hi absorption associated with 4C +31.04 was firstly reported in van Gorkom et al. (1989) with a velocity of 17391 3 , a FWHM of 153 6 , peak optical depth and 1020cm-2K-1. Gupta et al. (2006) presented the results of Hi and OH absorption measurements towards 4C +31.04 using the Arecibo 305-m telescope, giving the peak optical depth and 1020cm-2K-1. Struve & Conway (2012) presented Very Long Baseline Array (VLBA) Hi absorption observations of the circumnuclear environments of 4C +31.04, and absorption was detected against the core and both lobes.
We blindly re-detected its associated absorbing profile and updated its parameter by use of the data from the follow-up observation. We present the up-to-date finest structure of its absorption profile in Figure 2, which is fitted by the six-components Gaussian function. Our measurements of the Hi absorption associated with 4C +31.04 give a flux density depth of , an FWHM of , and 1020cm-2K-1, which is consistent with van Gorkom et al. (1989) and Gupta et al. (2006).
Besides the broad absorption centered at 17941.50 , a narrow absorption component at 18151.46 is also detected in the CRAFTS data. Our detection of the sub-absorption is consistent with the absorption profile presented in van Gorkom et al. (1989) and Struve & Conway (2012). 4C +31.04 does not show any sign of recent interaction such as tidal tails (Perlman et al., 2001). On the other hand, the velocity offset between 4C +31.04 and its companion far exceeds the measured velocity difference between broad and narrow absorption ( 200 ). The narrow absorption may come from another un-discovered optical-faint but gas-rich companion galaxy (Struve & Conway, 2012).
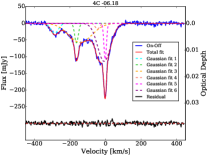
4.1.2 4C -06.18
4C -06.18 (Figure 3) is a little-studied bright radio source, its redshift information is unavailable, leaving the counterpart to the foreground in an uncertain state. It necessitates additional high-resolution follow-up observations. The absorption towards 4C -06.18 was firstly and exclusively reported by Roger et al. (1978), the reported the absorption parameters are peak optical depth , , spin temperature K and 1020cm-2K-1, which are close to our measurements. We blindly re-detected its absorbing profile and obtained its fine structure in the follow-up observation. Its absorption spectrum is well-fitted using the six-components Gaussian function and is shown in the left panel of Figure 3. The strongest Hi absorption profile exhibits a nearly symmetric and narrow profile, likely originating from a gas disk. Additionally, there is a broader wing with two shallower peaks at lower redshifts, indicating the existence of unsettled gas structures and a potential jet of gas.
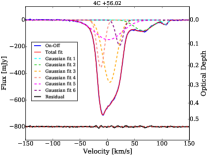
4.1.3 4C +56.02
4C +56.02 is also a little-studied bright compact radio source. The absence of redshift data for 4C +56.02 has left the identification of the foreground counterpart in an uncertain state, emphasizing the need for further high-resolution follow-up observations to attain clarity. Dickey & Benson (1982) used the 91m- and 43m- single-dish telescopes as an interferometer to observe its 21-cm line, and reported the parameter of absorption as peak optical depth and 1020cm-2K-1.
We blindly re-detected its absorbing profile We present its absorption spectrum in the left panel of Figure 4. Its absorption spectrum is well-fitted using the six-components Gaussian function. Our measurements of the Hi absorption towards 4C +56.02 give a flux density depth of and FWHM of , peak optical depth and .
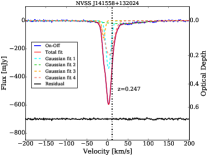
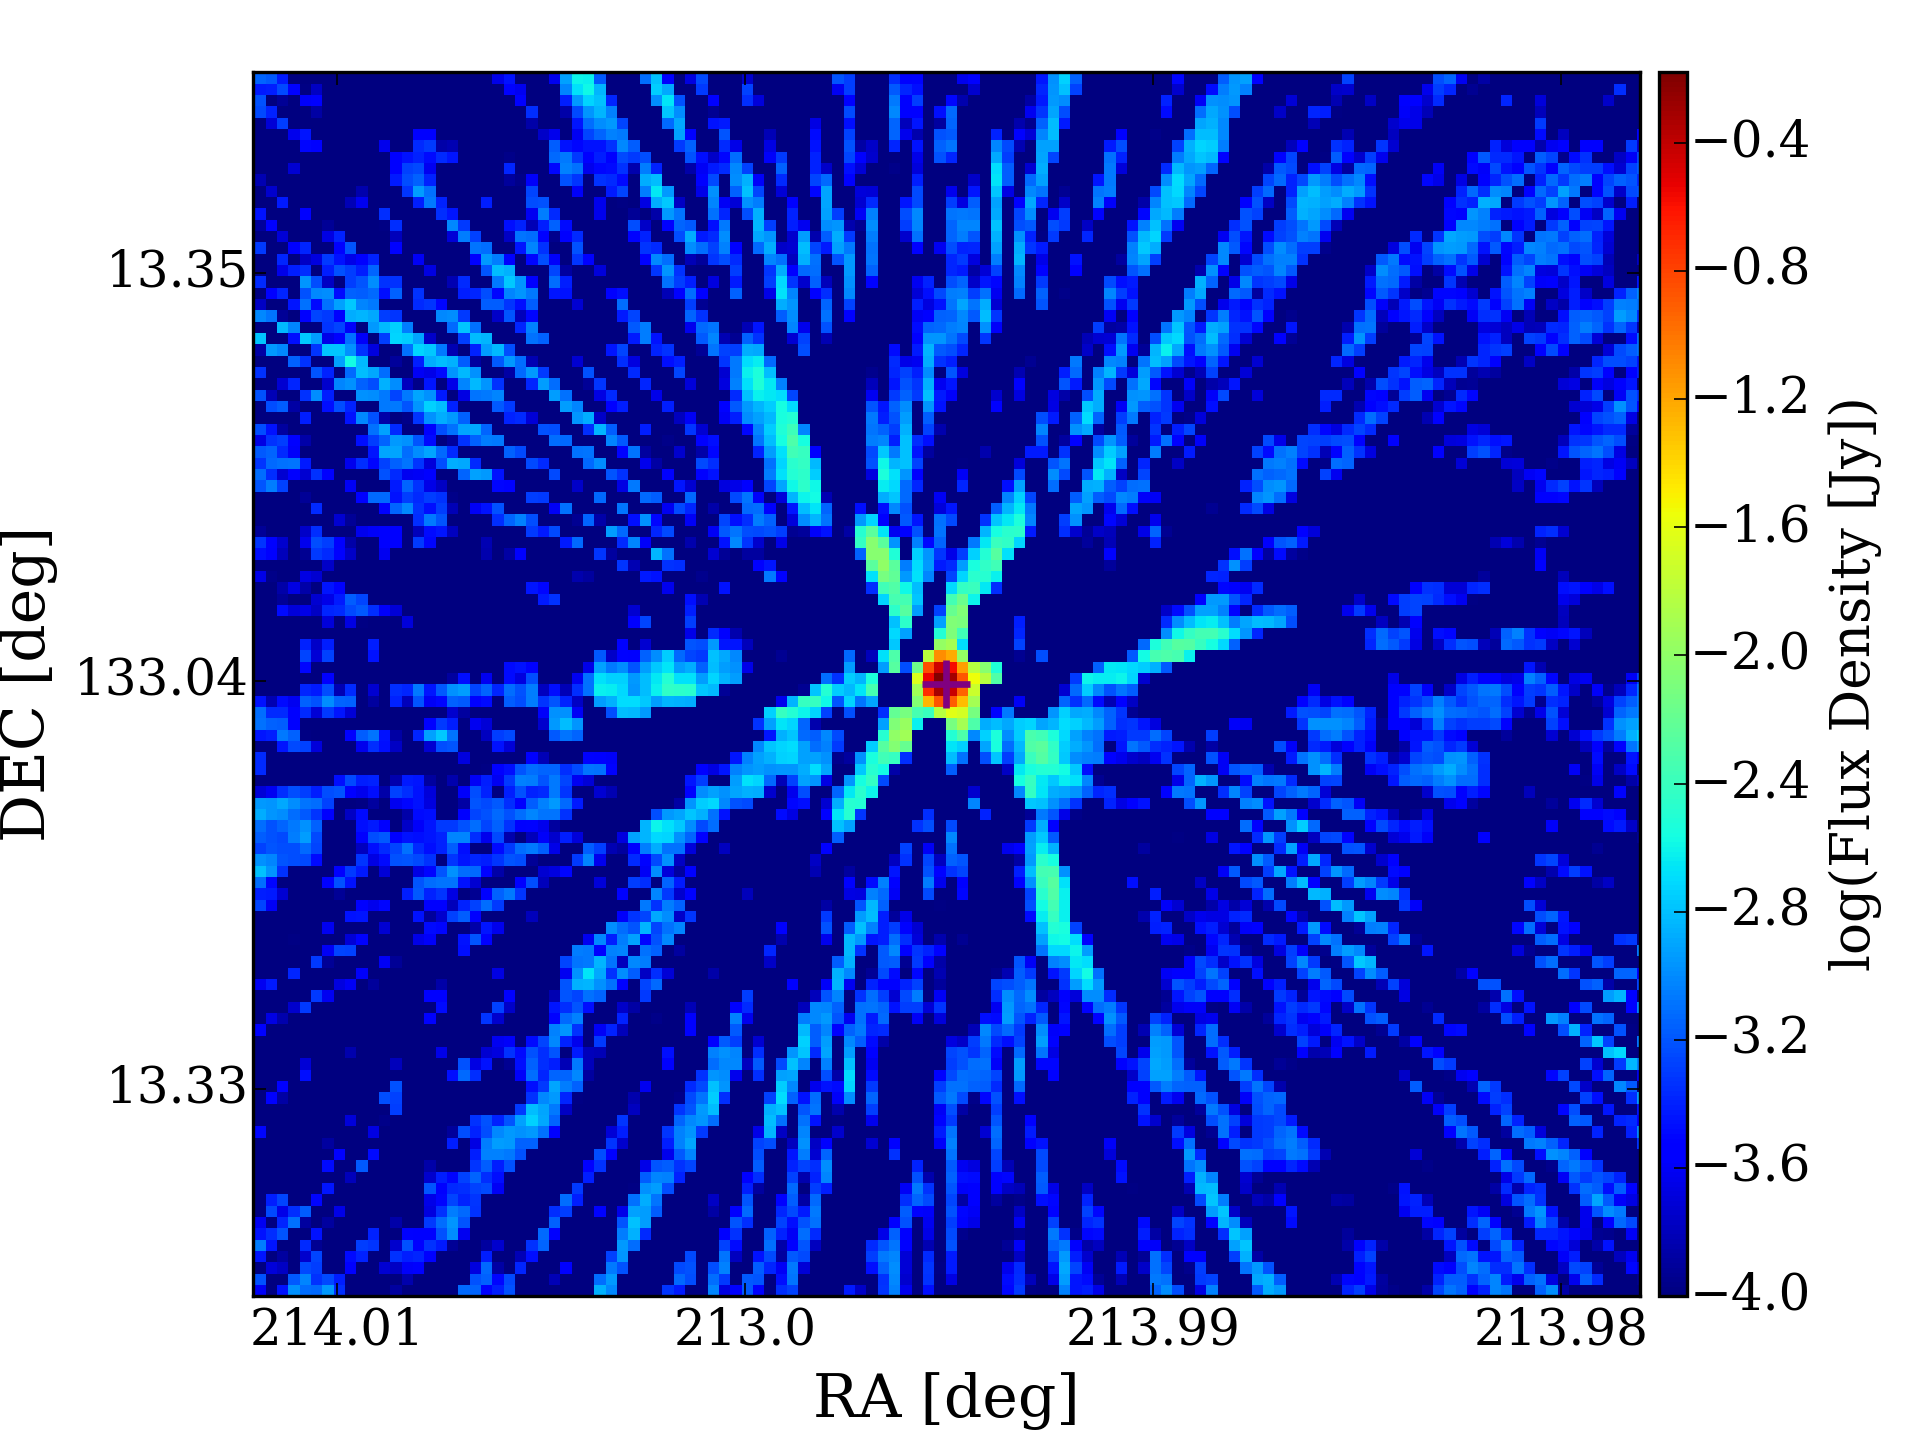
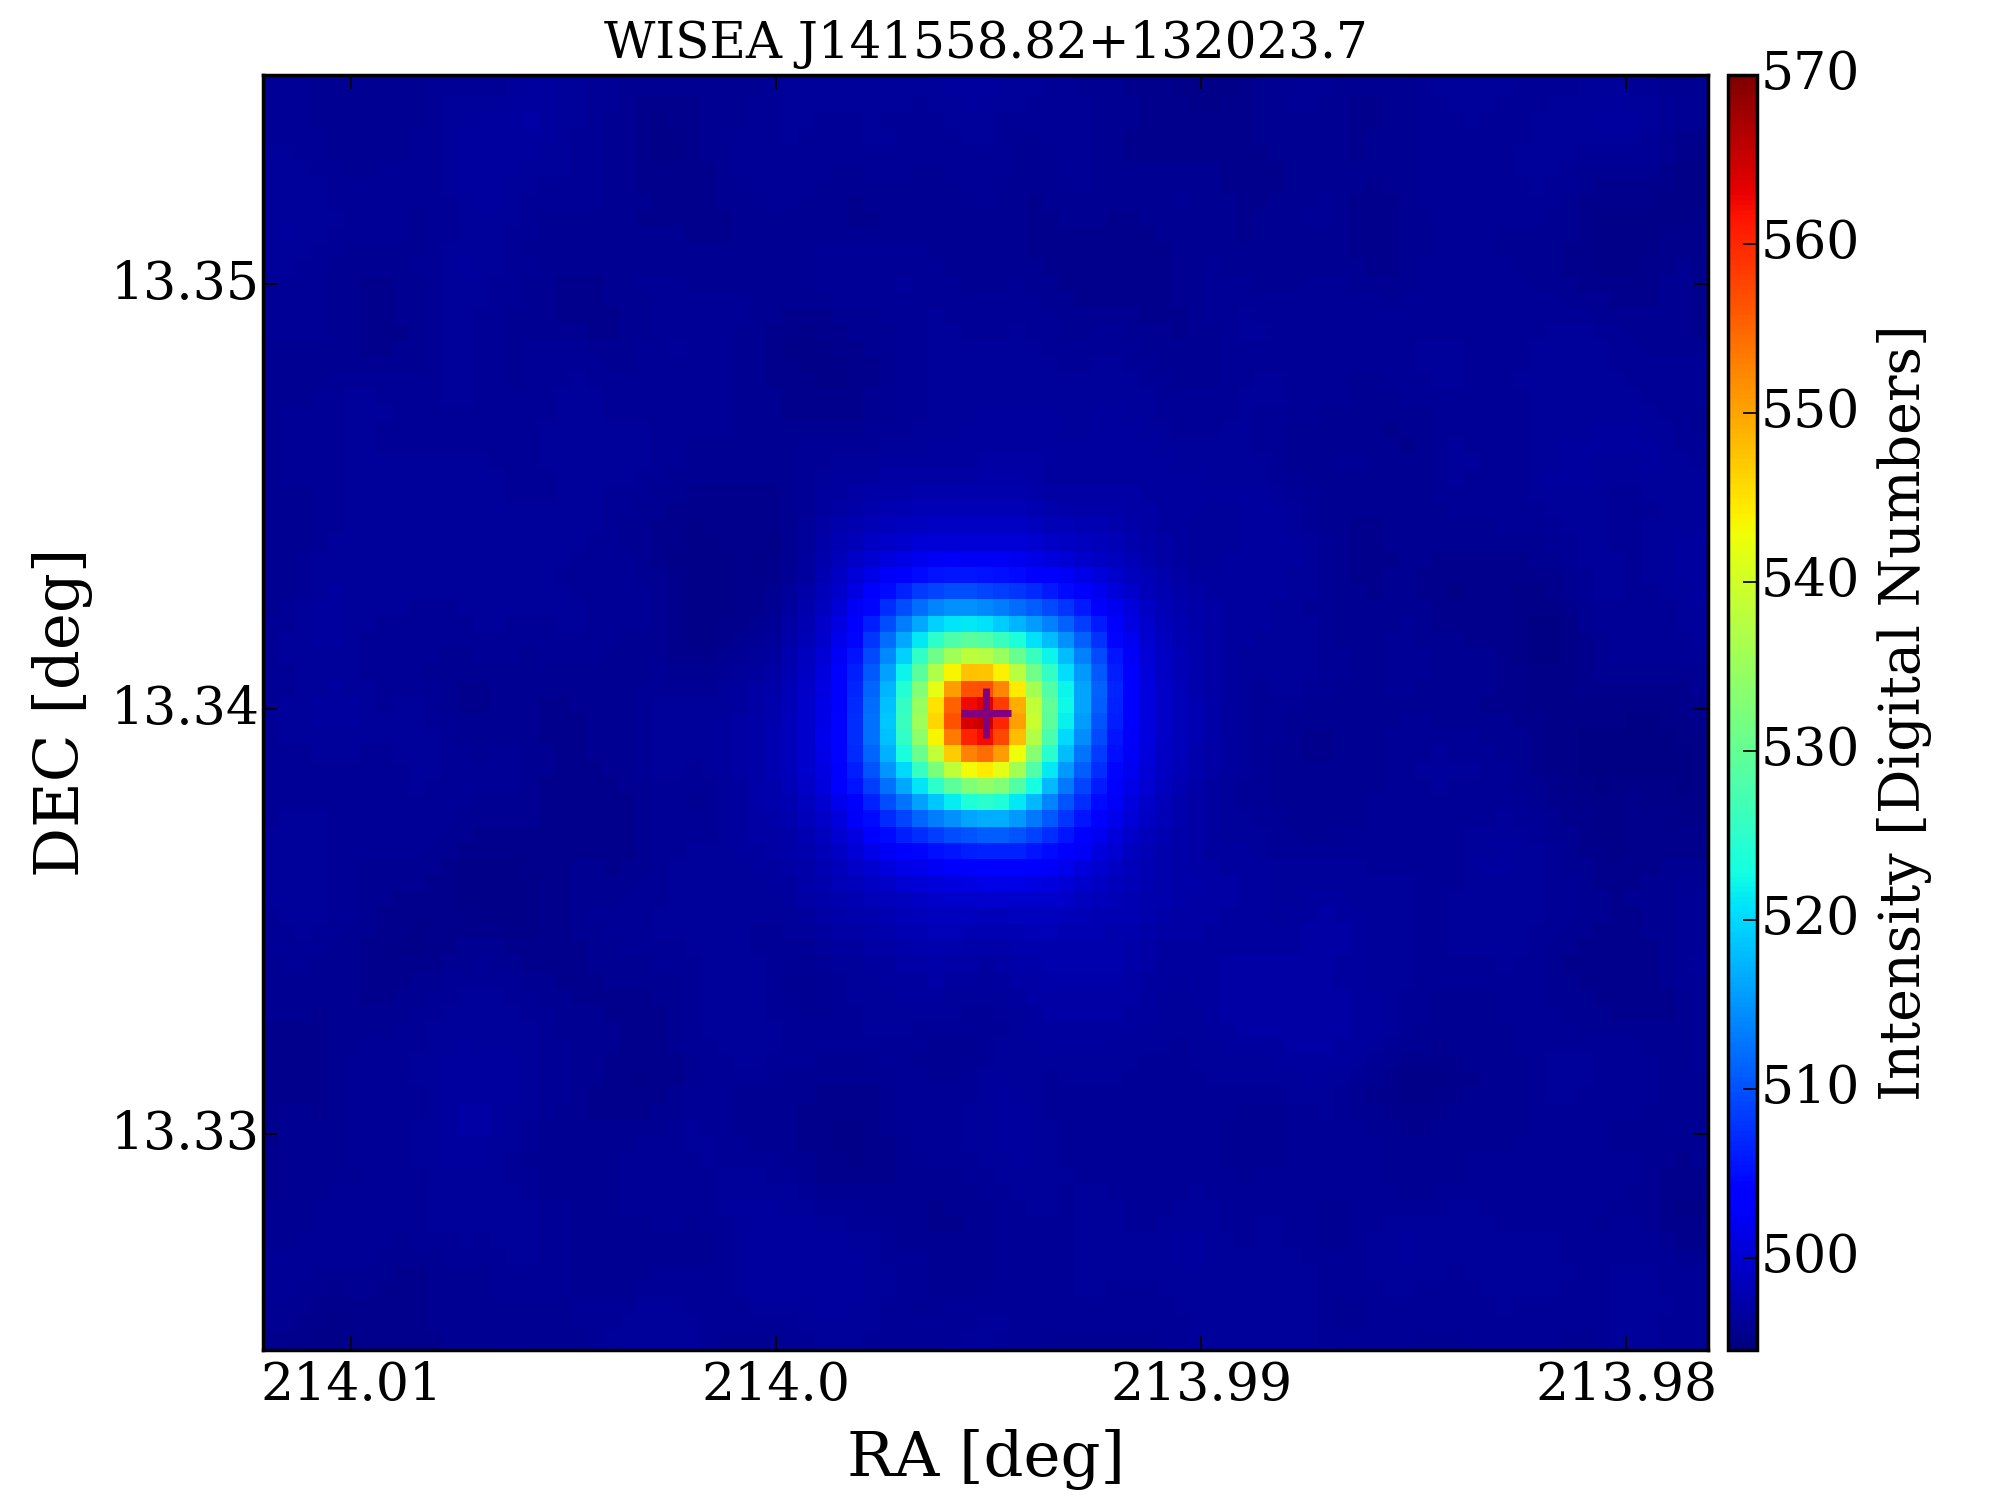
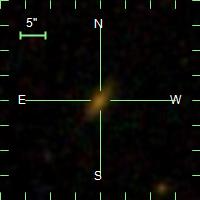
4.1.4 NVSS J141558+132024 (PKS 1413+135)
The radio source PKS 1413+135 (Figure 5) stands out as one of the most puzzling blazars. Despite being categorized as a BL Lac object (Beichman et al., 1981; Bregman et al., 1981), PKS 1413+135 appears to be linked to a disk galaxy at a redshift of 0.25 (McHardy et al., 1991). This is intriguing given that the majority of BL Lac objects and radio-loud quasars are typically associated with elliptical galaxies rather than spiral galaxies. Furthermore, while BL Lac objects usually exhibit jet axes aligned closely with the line of sight, PKS 1413+135 has also been identified as a CSO (Perlman et al., 1996). These objects have jet axes that are not aligned closely with the line of sight.
Employing multi-epoch very long baseline interferometry (VLBI), radio monitoring observations, and analyzing the infrared spectrum of PKS 1413+135, Readhead et al. (2021) demonstrated that the orientation of the jet axis closely aligns with the line of sight. The jetted AGN is highly likely to be a background source at , rather than being situated in the spiral galaxy at z=0.247. The intervening spiral galaxy at z=0.247 is identified as a Seyfert II early-type spiral galaxy, observed in an edge-on perspective.
The initial identification of Hi 21 cm absorption in PKS 1413+135 was made by Carilli et al. (1992) and recently revisited with Meerkat by Combes et al. (2023). We re-detected Hi absorption toward PKS 1413+135 in a blind survey and showcase its highest-resolution spectrum here. Our measurements closely align with those of Combes et al. (2023), who documented a peak optical depth of and . The Hi spectrum stands out due to its distinct narrow central component and a redshifted wing that extends up to 110 . This redshifted wing is presumably associated with an outer gaseous ring orbiting the galaxy. Additionally, it has been observed that Hi absorption is absent towards the radio core but is predominantly observed from a counterjet knot located 100 pc northeast of the core along the minor axis of the galaxy (Perlman et al., 2002).
From the WISE and optical image, only one source is resolved. According to the color of the WISE counterpart, this source is classified as QSOs, indicating the WISE map is dominated by the background source PKS 1413+135.
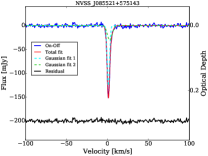
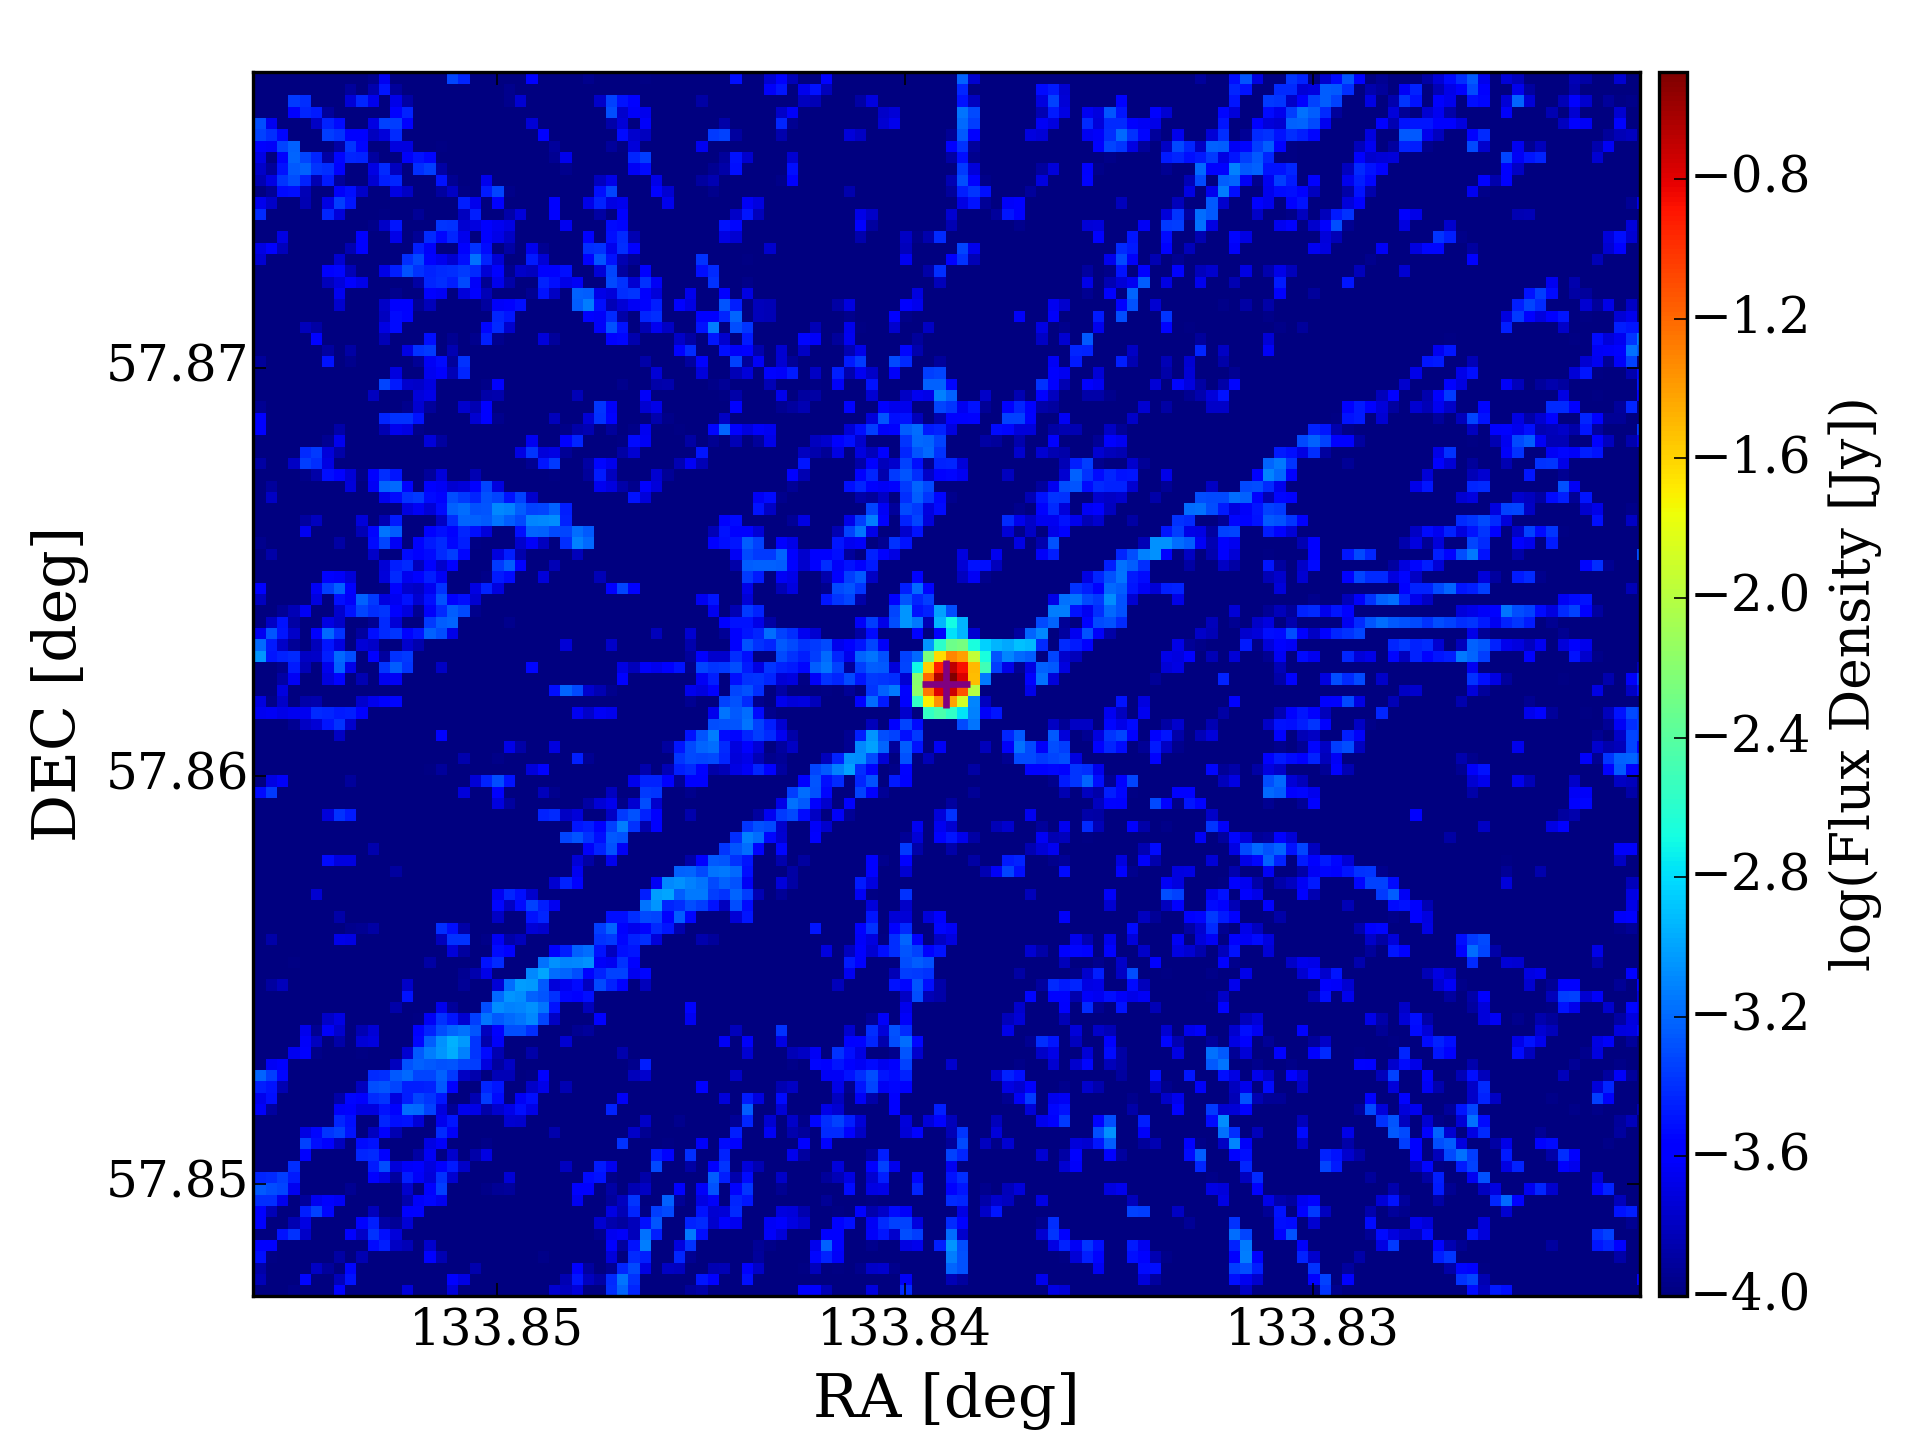
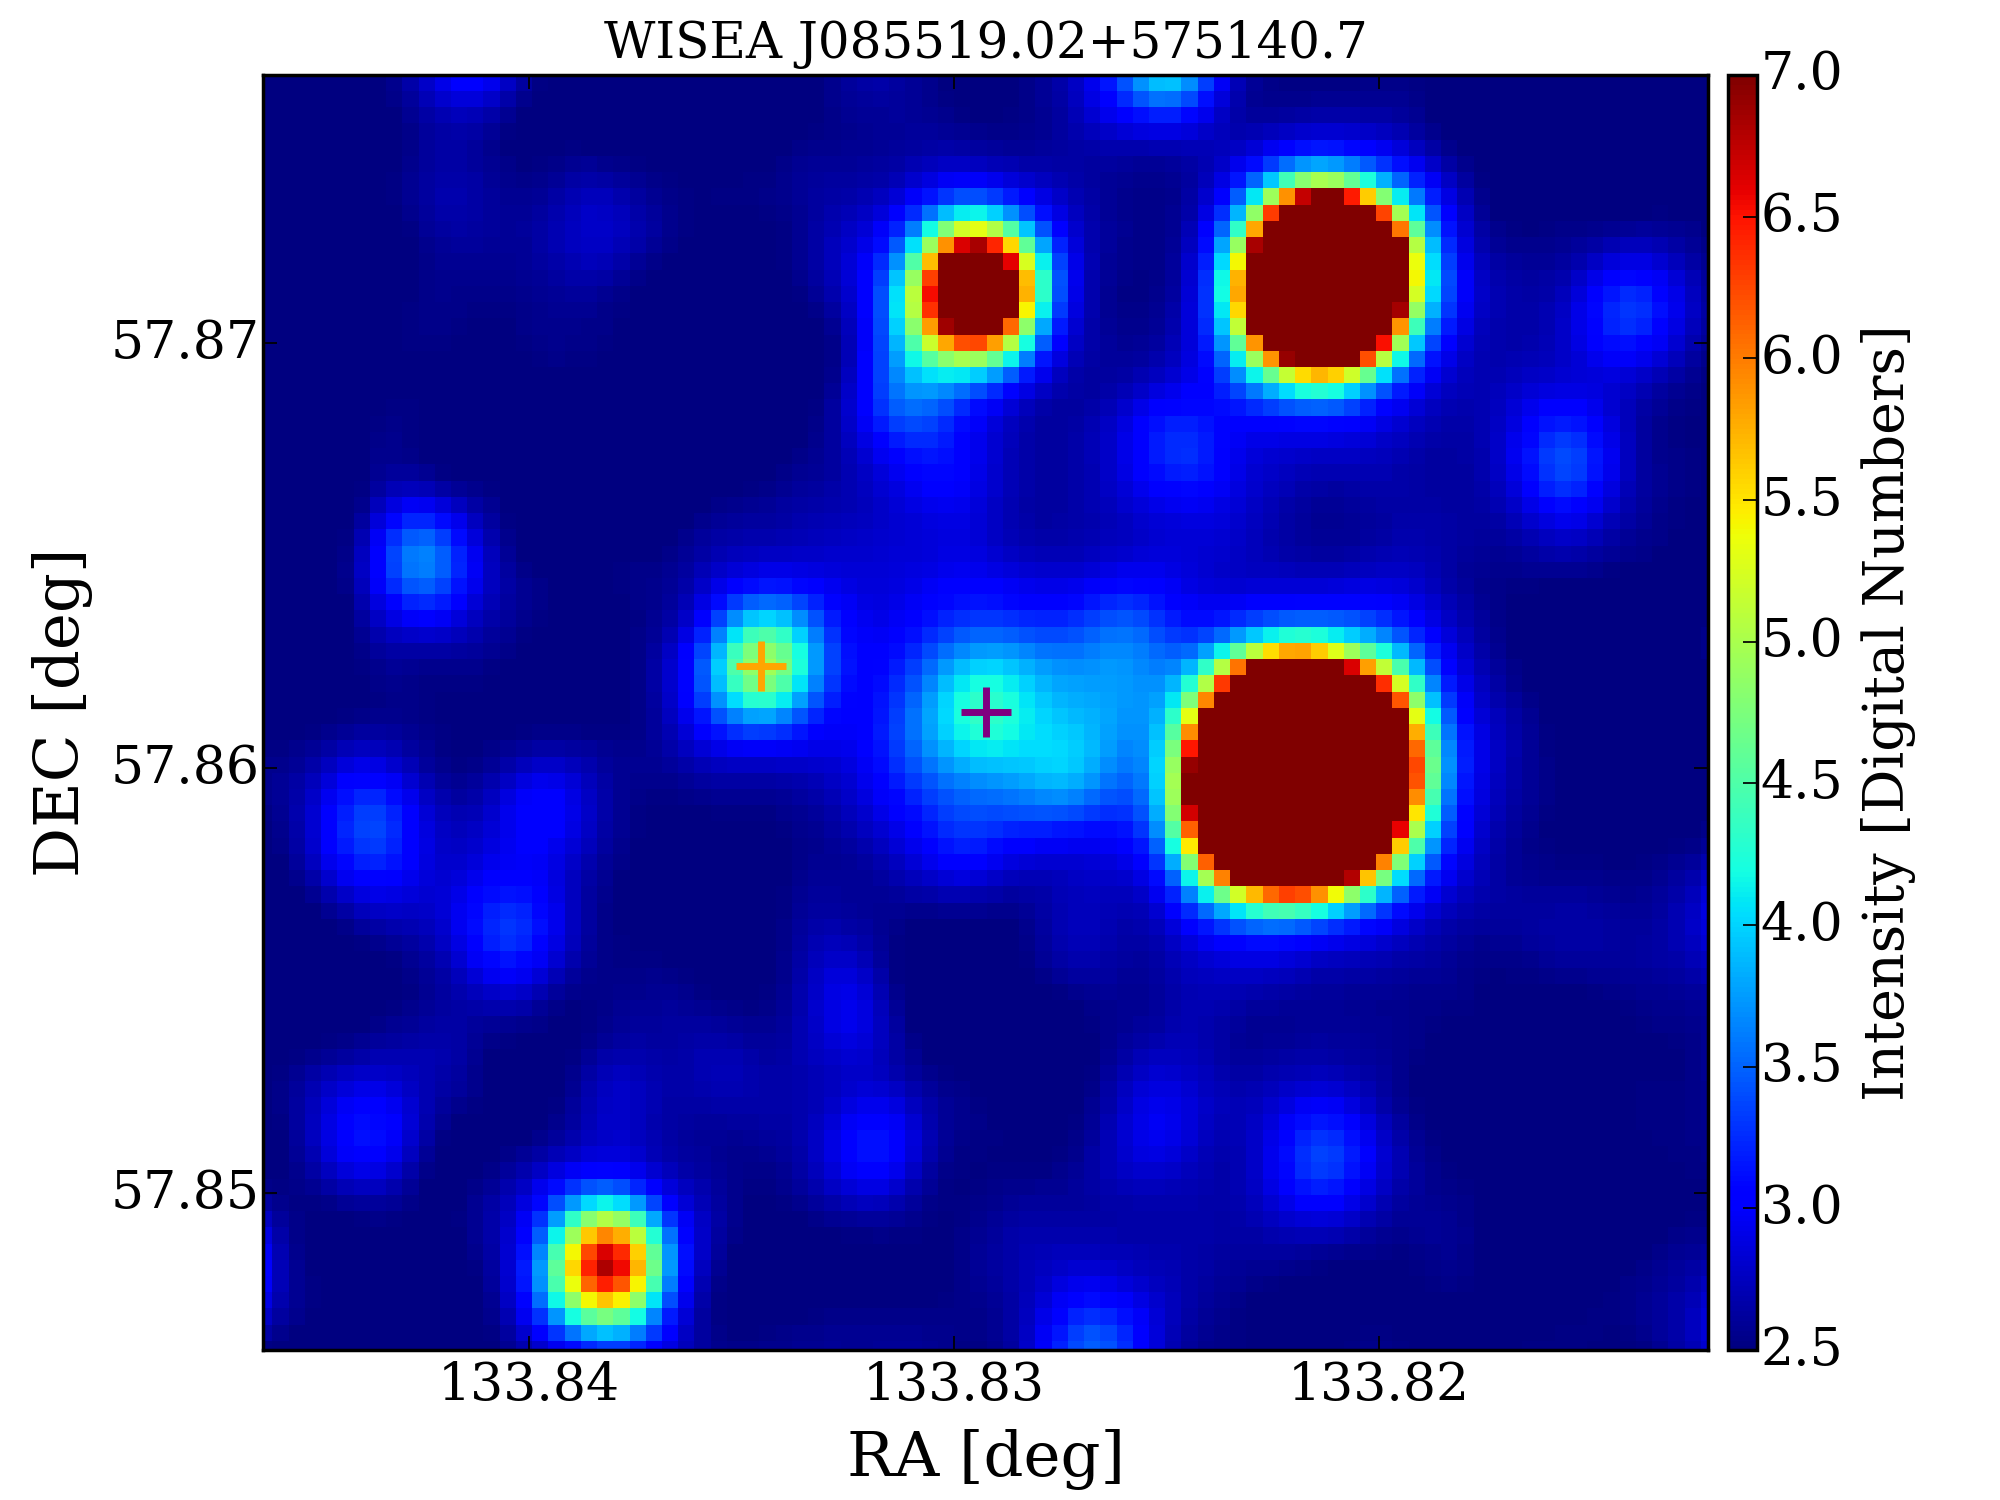
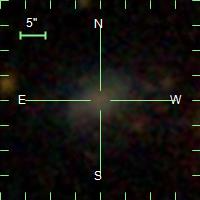
4.1.5 NVSS J085521+575143
Intervening absorption is found towards NVSS J085521+575143, the background source is identified as an FR II radio source (Biggs et al., 2016) and a CSO with two lobes separated by approximately 55 mas (Helmboldt et al., 2007) (Figure 6). The distorted appearance of the background radio source suggests a strong jet–cloud interaction in its host galaxy (Biggs et al., 2016). The absorption towards NVSS J085521+575143 was initially reported by Zwaan et al. (2015), the absorption parameters were reported as peak optical depth and 1.02, which closely aligns with our findings.
The SDSS counterpart to the foreground galaxy is SDSS J085519.05+575140.7, whose magnitudes are u=19.437, g=17.765, r=17.265, i=17.043 and z=16.834. The WISE counterpart to SDSS J085519.05+575140.7 given by NED is WISEA J085519.02+575140.7. The WISE W1[], W2[], W3[] and W4[] magnitudes for WISEA J085519.02+575140.7 are 15.535 0.047, 15.288 0.105, 11.935 0.214 and 8.706, respectively. The W1-W2 color of WISEA J085519.02+575140.7 is 0.247, which indicates that the mid-IR emission comes mainly from stars. According to the W2-W3 value of 3.353 mag, WISEA J085519.02+575140.7 is located in the intersection of the Spirals region and the LIRGs region in the WISE colour–color diagram.
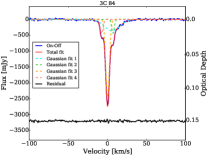
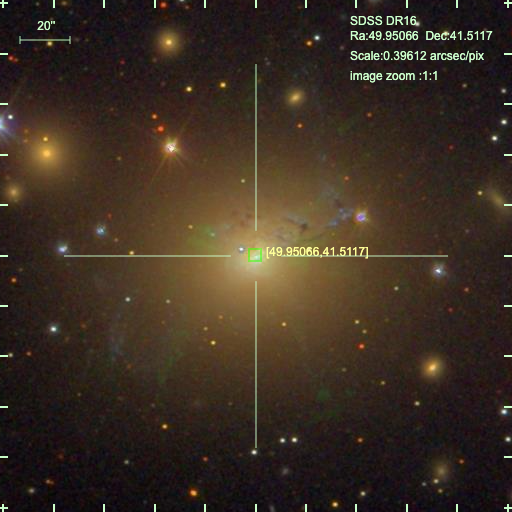
4.1.6 3C 84 (NGC 1275)
NGC 1275 (Figure 7) is a giant cD elliptical galaxy situated close to the center of the Perseus cluster, stands out as the nearest cool-core cluster Brightest Cluster Galaxy (BCG) detected with Hi , showcasing a rich cluster environment (Saraf et al., 2023). The galaxy hosts an active nucleus, evident through the presence of the powerful compact radio source 3C 84. Positioned in front of NGC 1275 is another high-velocity system at around 8200 km/s, observable in both H emission (Caulet et al., 1992) and Hi absorption (De Young et al., 1973). Through comprehensive global VLBI observations, Momjian et al. (2002) presented a high dynamic range image of this Hi absorption feature, detecting six distinct absorption peaks that suggest the presence of multiple Hi clouds. The likely nature of the foreground object is a gas-rich galaxy.
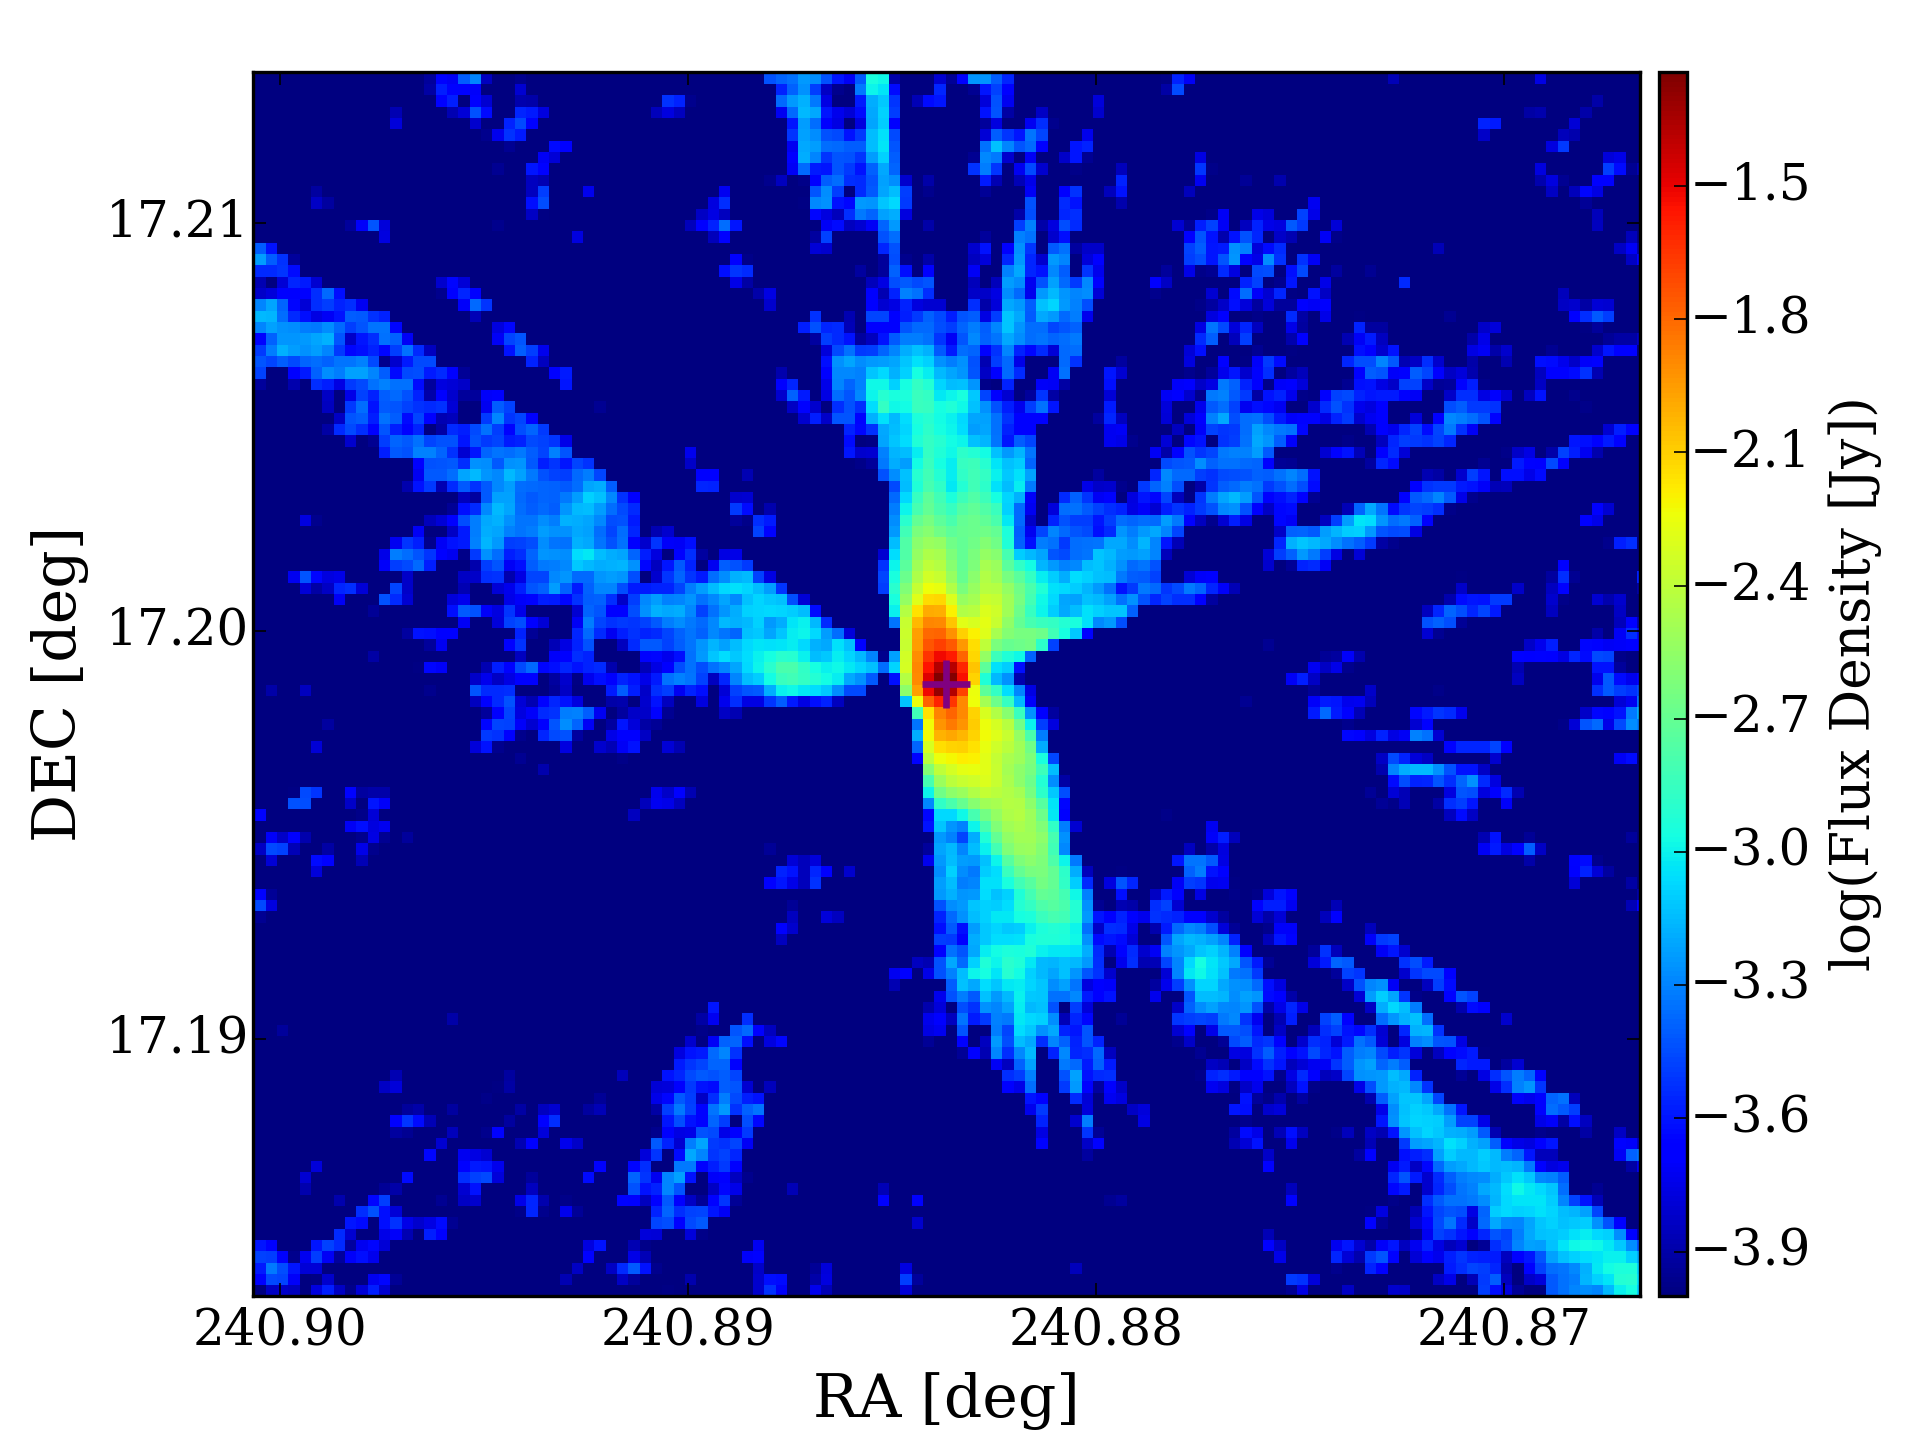
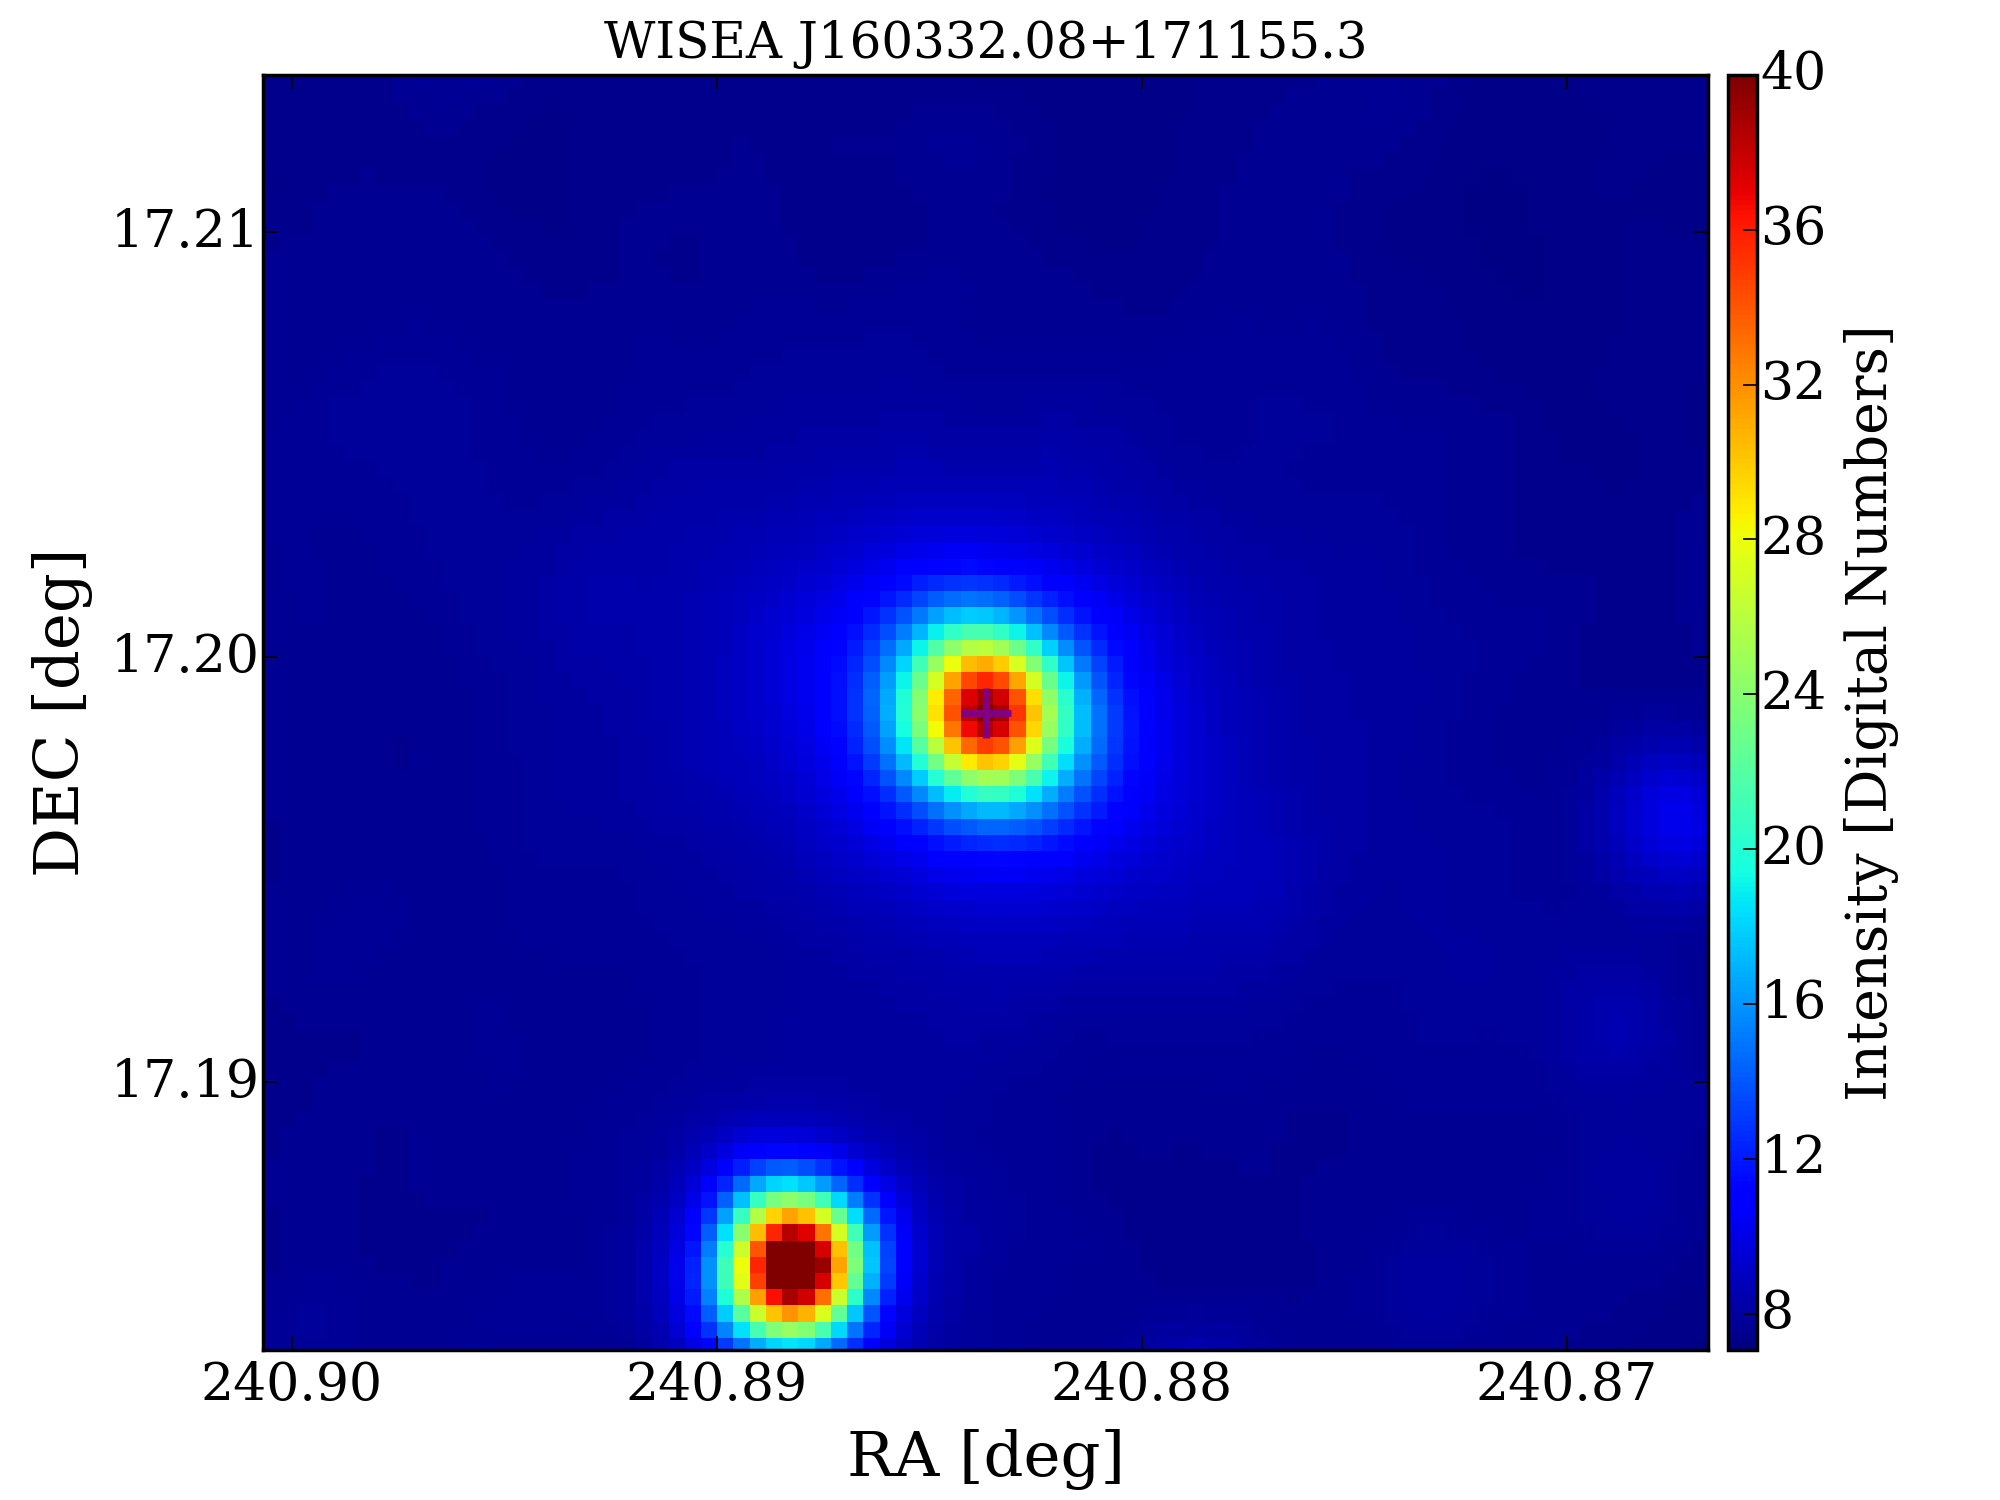
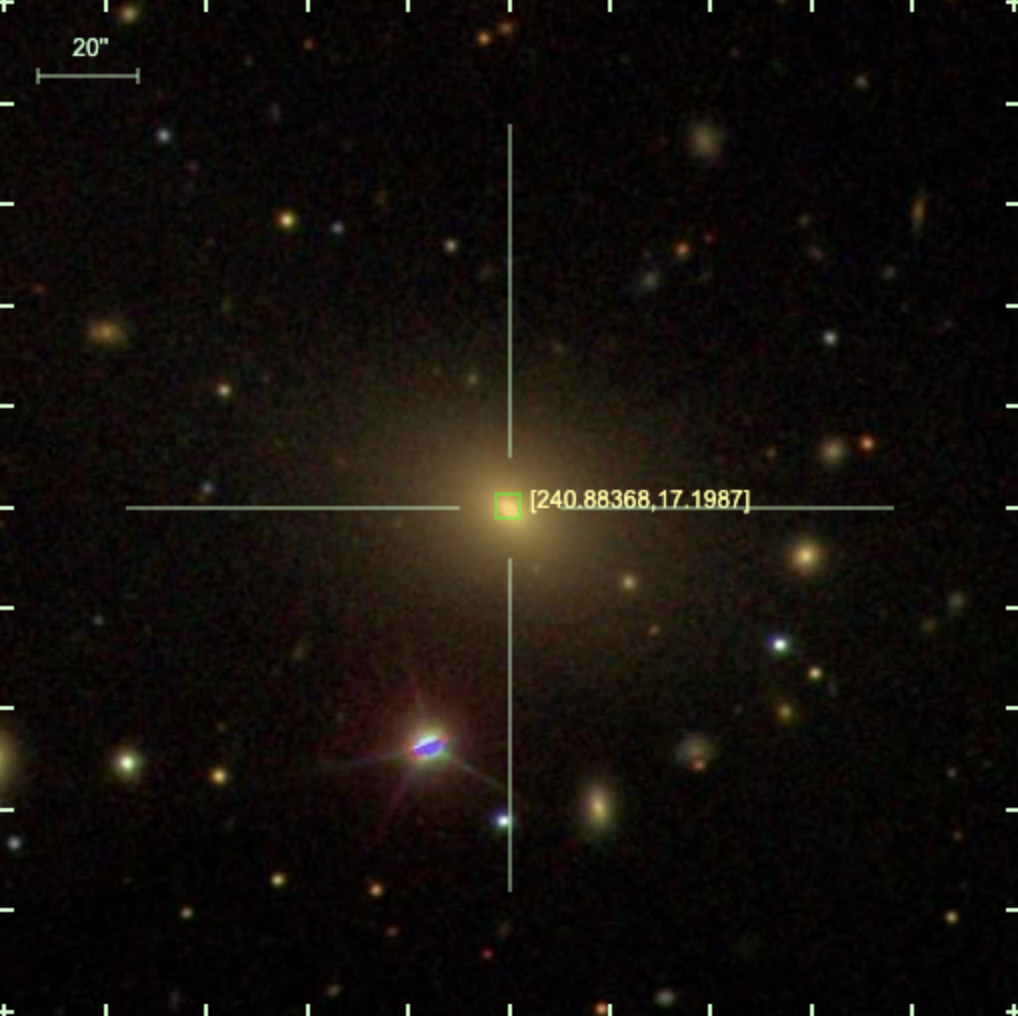
4.1.7 NVSS J160332+171158 (NGC 6034)
NGC 6034 (Figure 8) is identified as a luminous E/S0 radio galaxy within Abell 2151, which is part of the Hercules supercluster. This radio source is extended, featuring two jets emerging in the northern and southern directions. The absorption line observed in this galaxy is narrow and precisely centered at the velocity of the system, suggesting a potential Hi rotating disk within the host galaxy. The presence of neutral hydrogen in NGC 6034 was initially detected through VLA observations conducted by Dickey (1997) and subsequently confirmed by WSRT observations (Geréb et al., 2015). Our independent blind detection of the Hi absorption line yielded a consistent line profile, aligning with previous observations. Notably, the optical depth we obtain differs from that given in Geréb et al. (2015), mainly due to their reliance on the continuum flux measured by WSRT, which is 278 mJy, while we utilize flux provided by NVSS, amounting to 693 mJy.
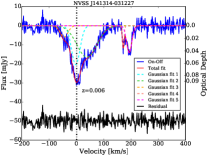
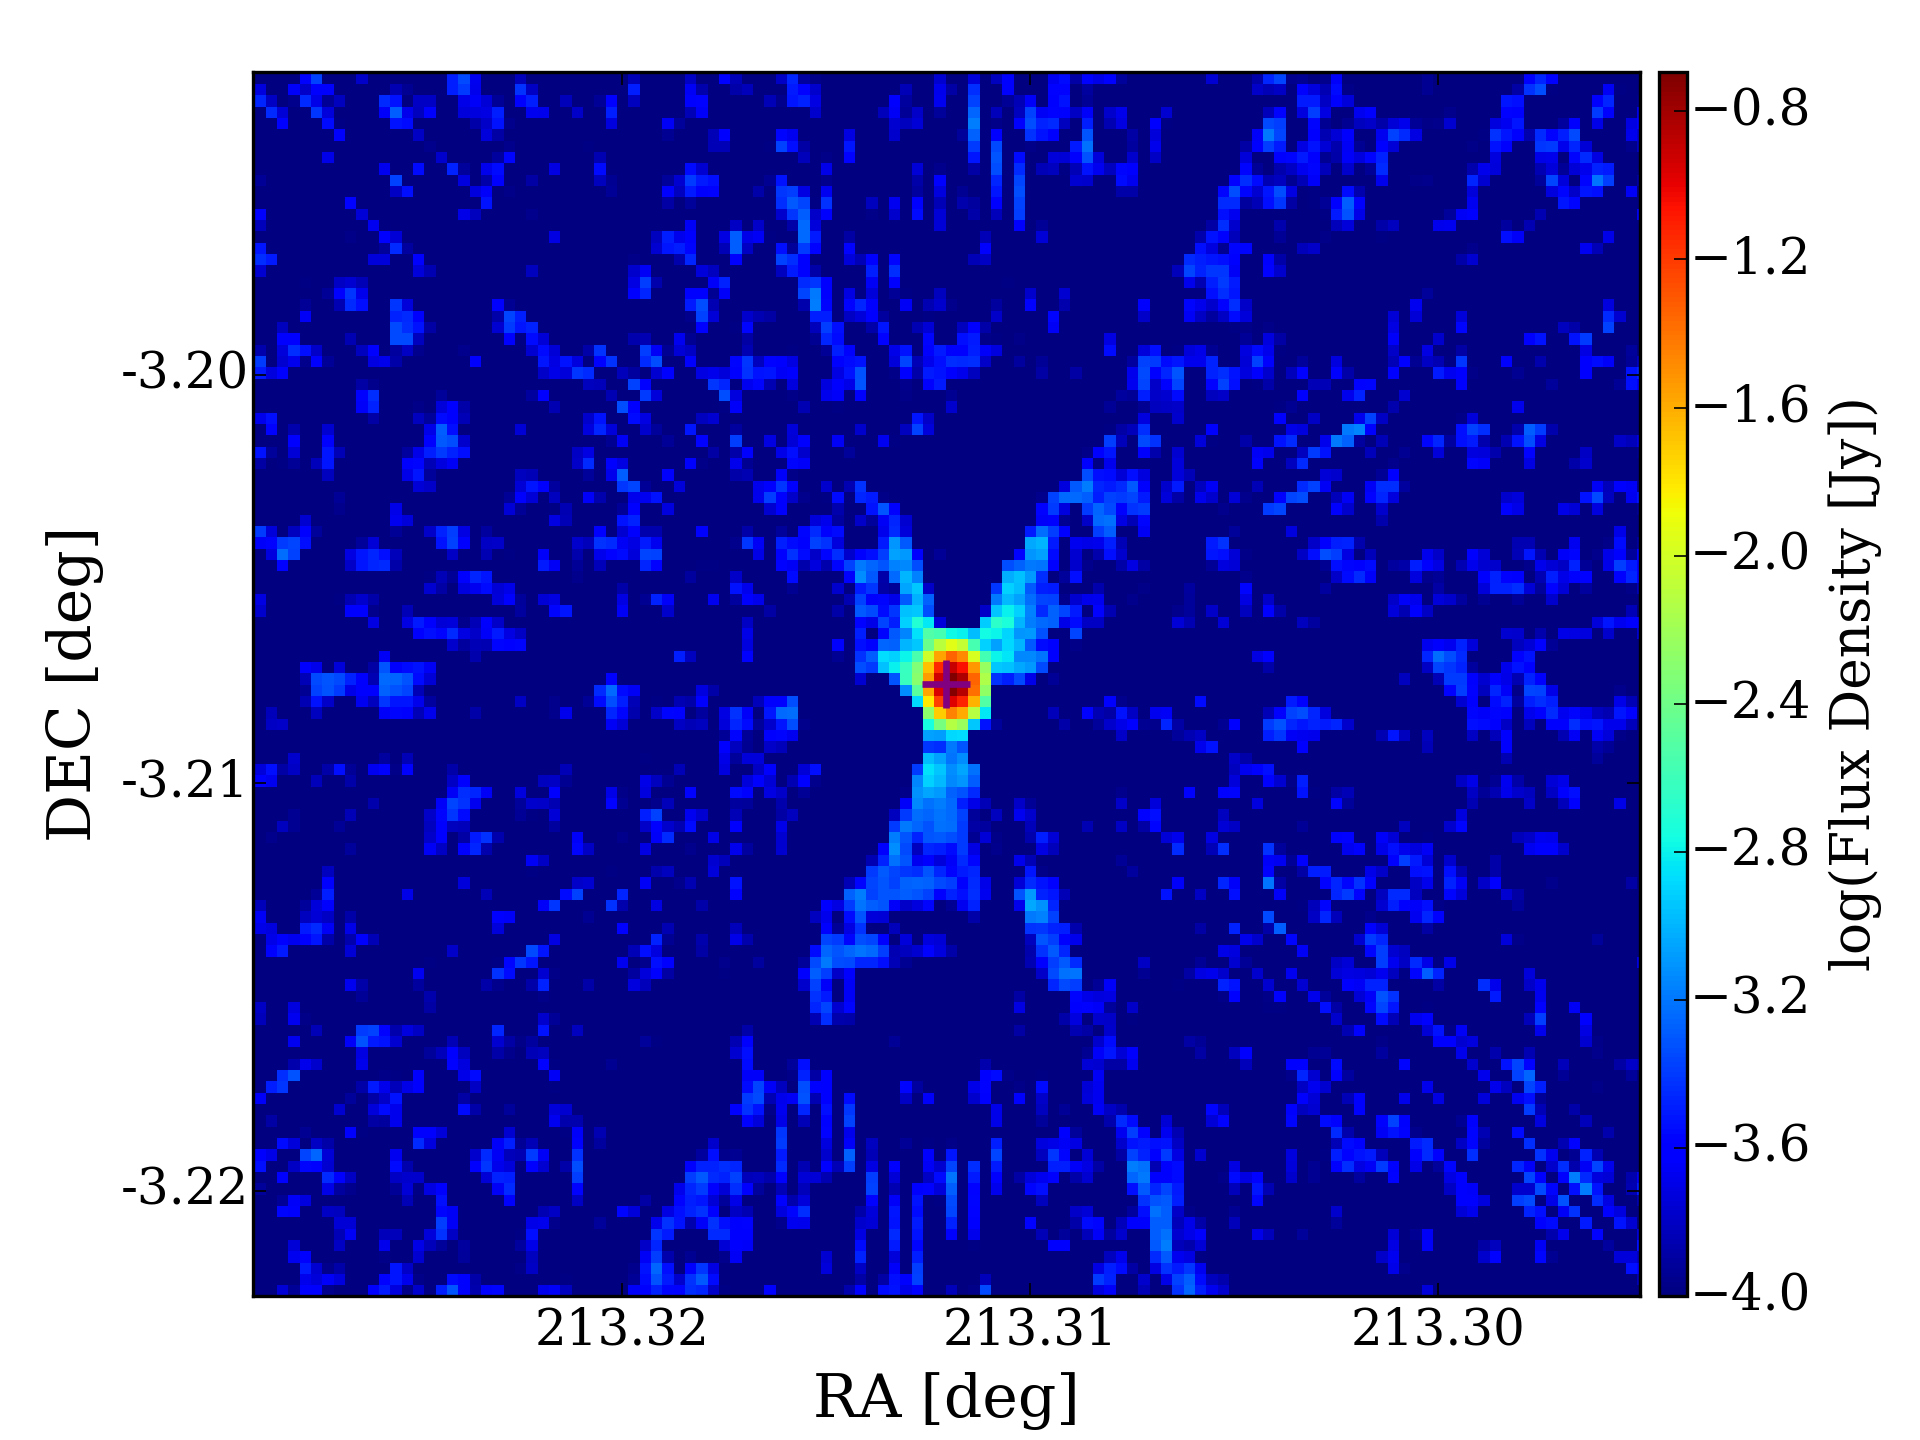
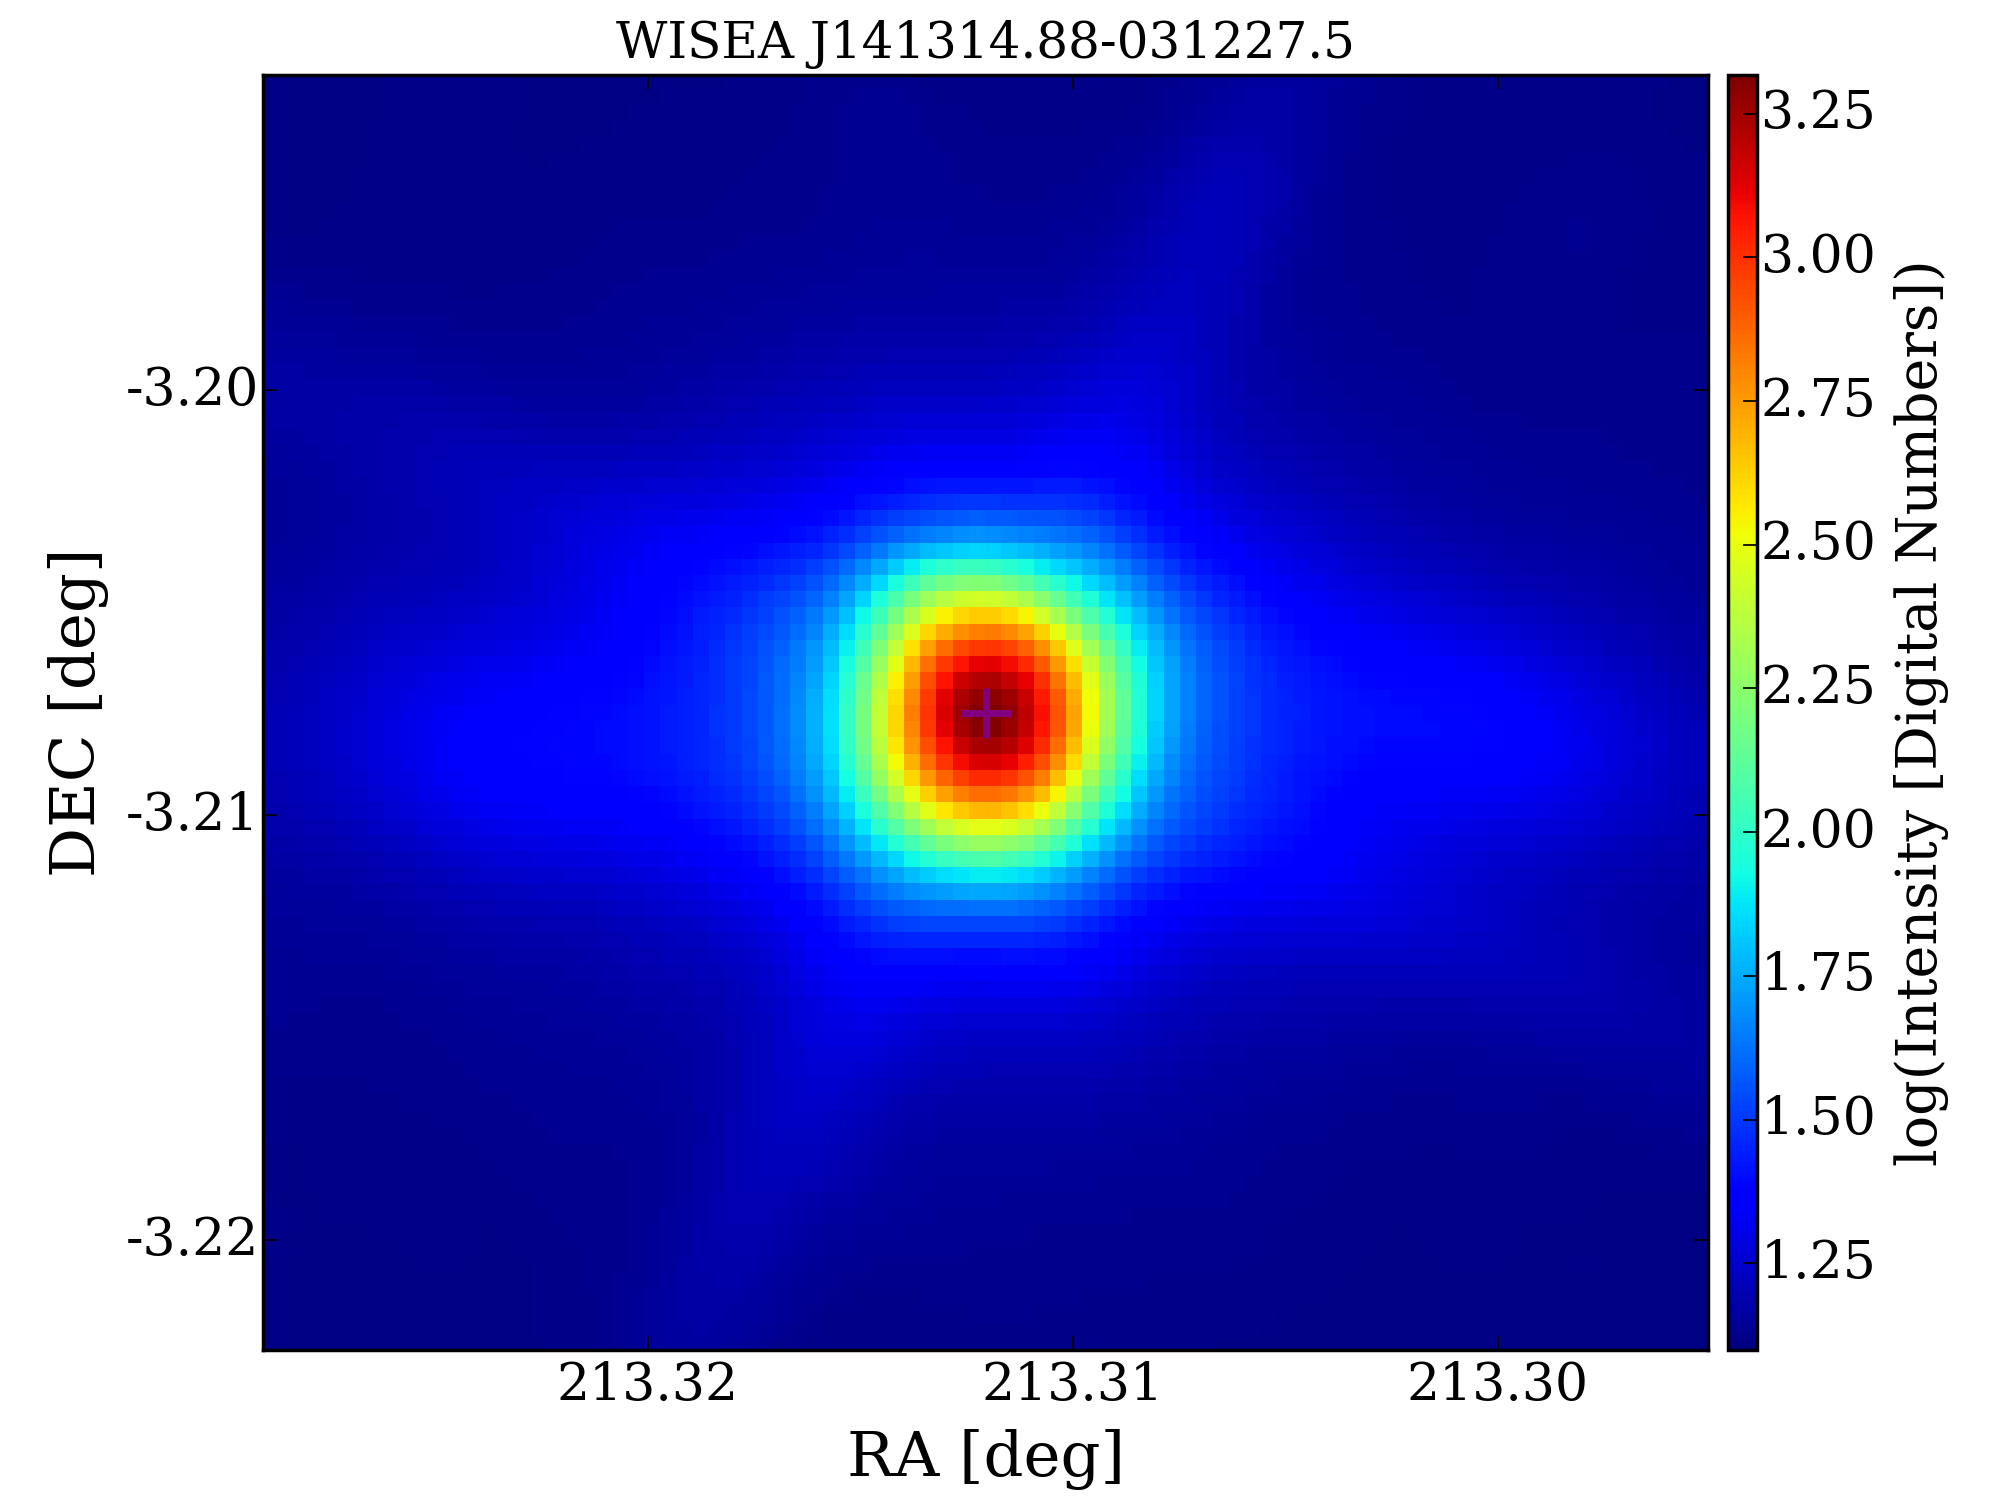
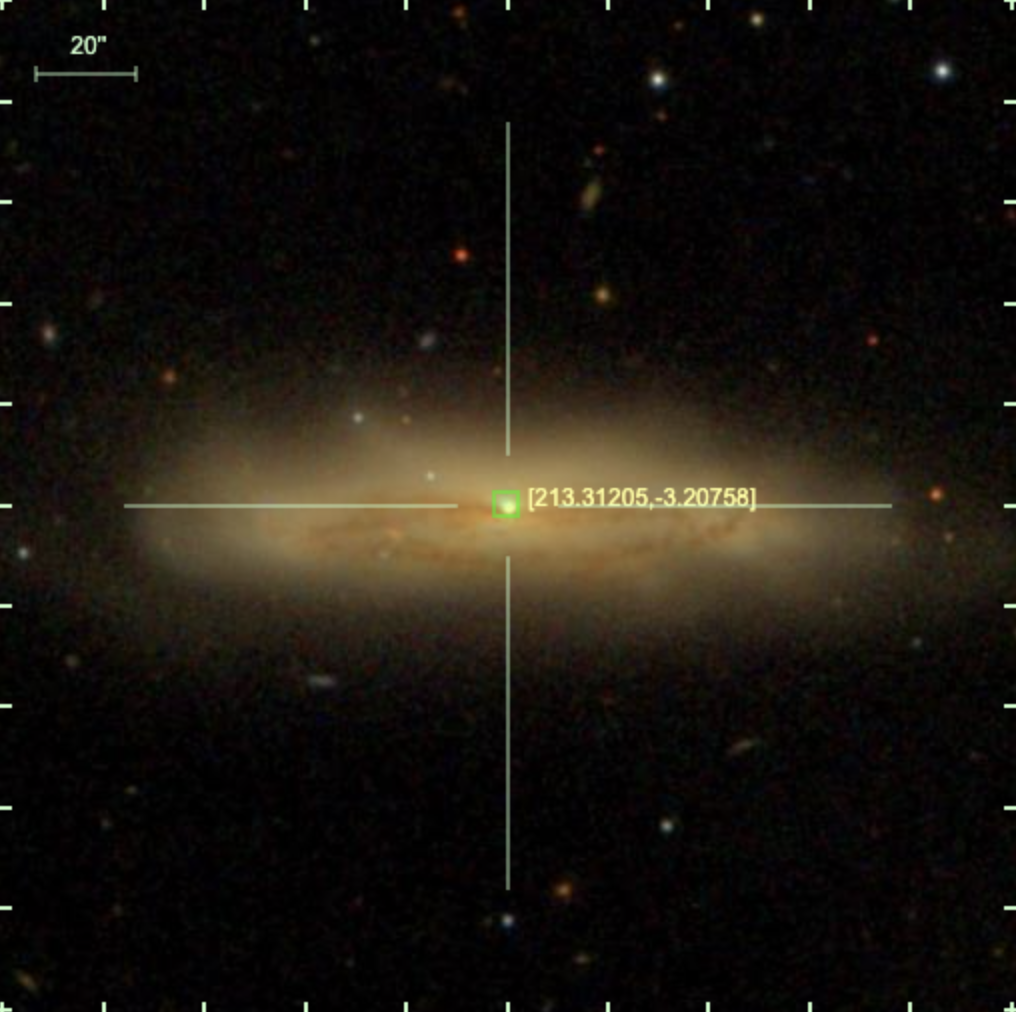
4.1.8 NVSS J141314-031227 (NGC 5506)
NGC 5506 (Figure 9), identified as an X-ray bright Seyfert II galaxy (Wilson et al., 1976; Rubin, 1978) within the local Virgo supercluster, hosts an AGN classified as a radio-quiet narrow-line Seyfert I (Nagar et al., 2002). The galaxy shows a smooth underlying stellar distribution without any apparent HII regions. Initial reports of Hi absorption linked to NGC 5506 were presented by Thuan & Wadiak (1982) and subsequently mapped through a VLA imaging survey by Gallimore et al. (1999). We blindly re-detected the Hi absorption associated with NGC 5506, the discerned Hi profile exhibits two components: a deeper one at 1796 and a shallower one at 1989 .
The optical image in Figure 9 reveals NGC 5506’s nearly edge-on orientation, characterized by a conspicuous east-west dust lane that bisects the galaxy and a luminous, resolved nucleus, partly concealed by the dust lane. It is plausible that the predominant absorption arises from foreground disk gas, while the shallower component may originate from an in-falling object.
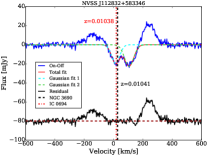
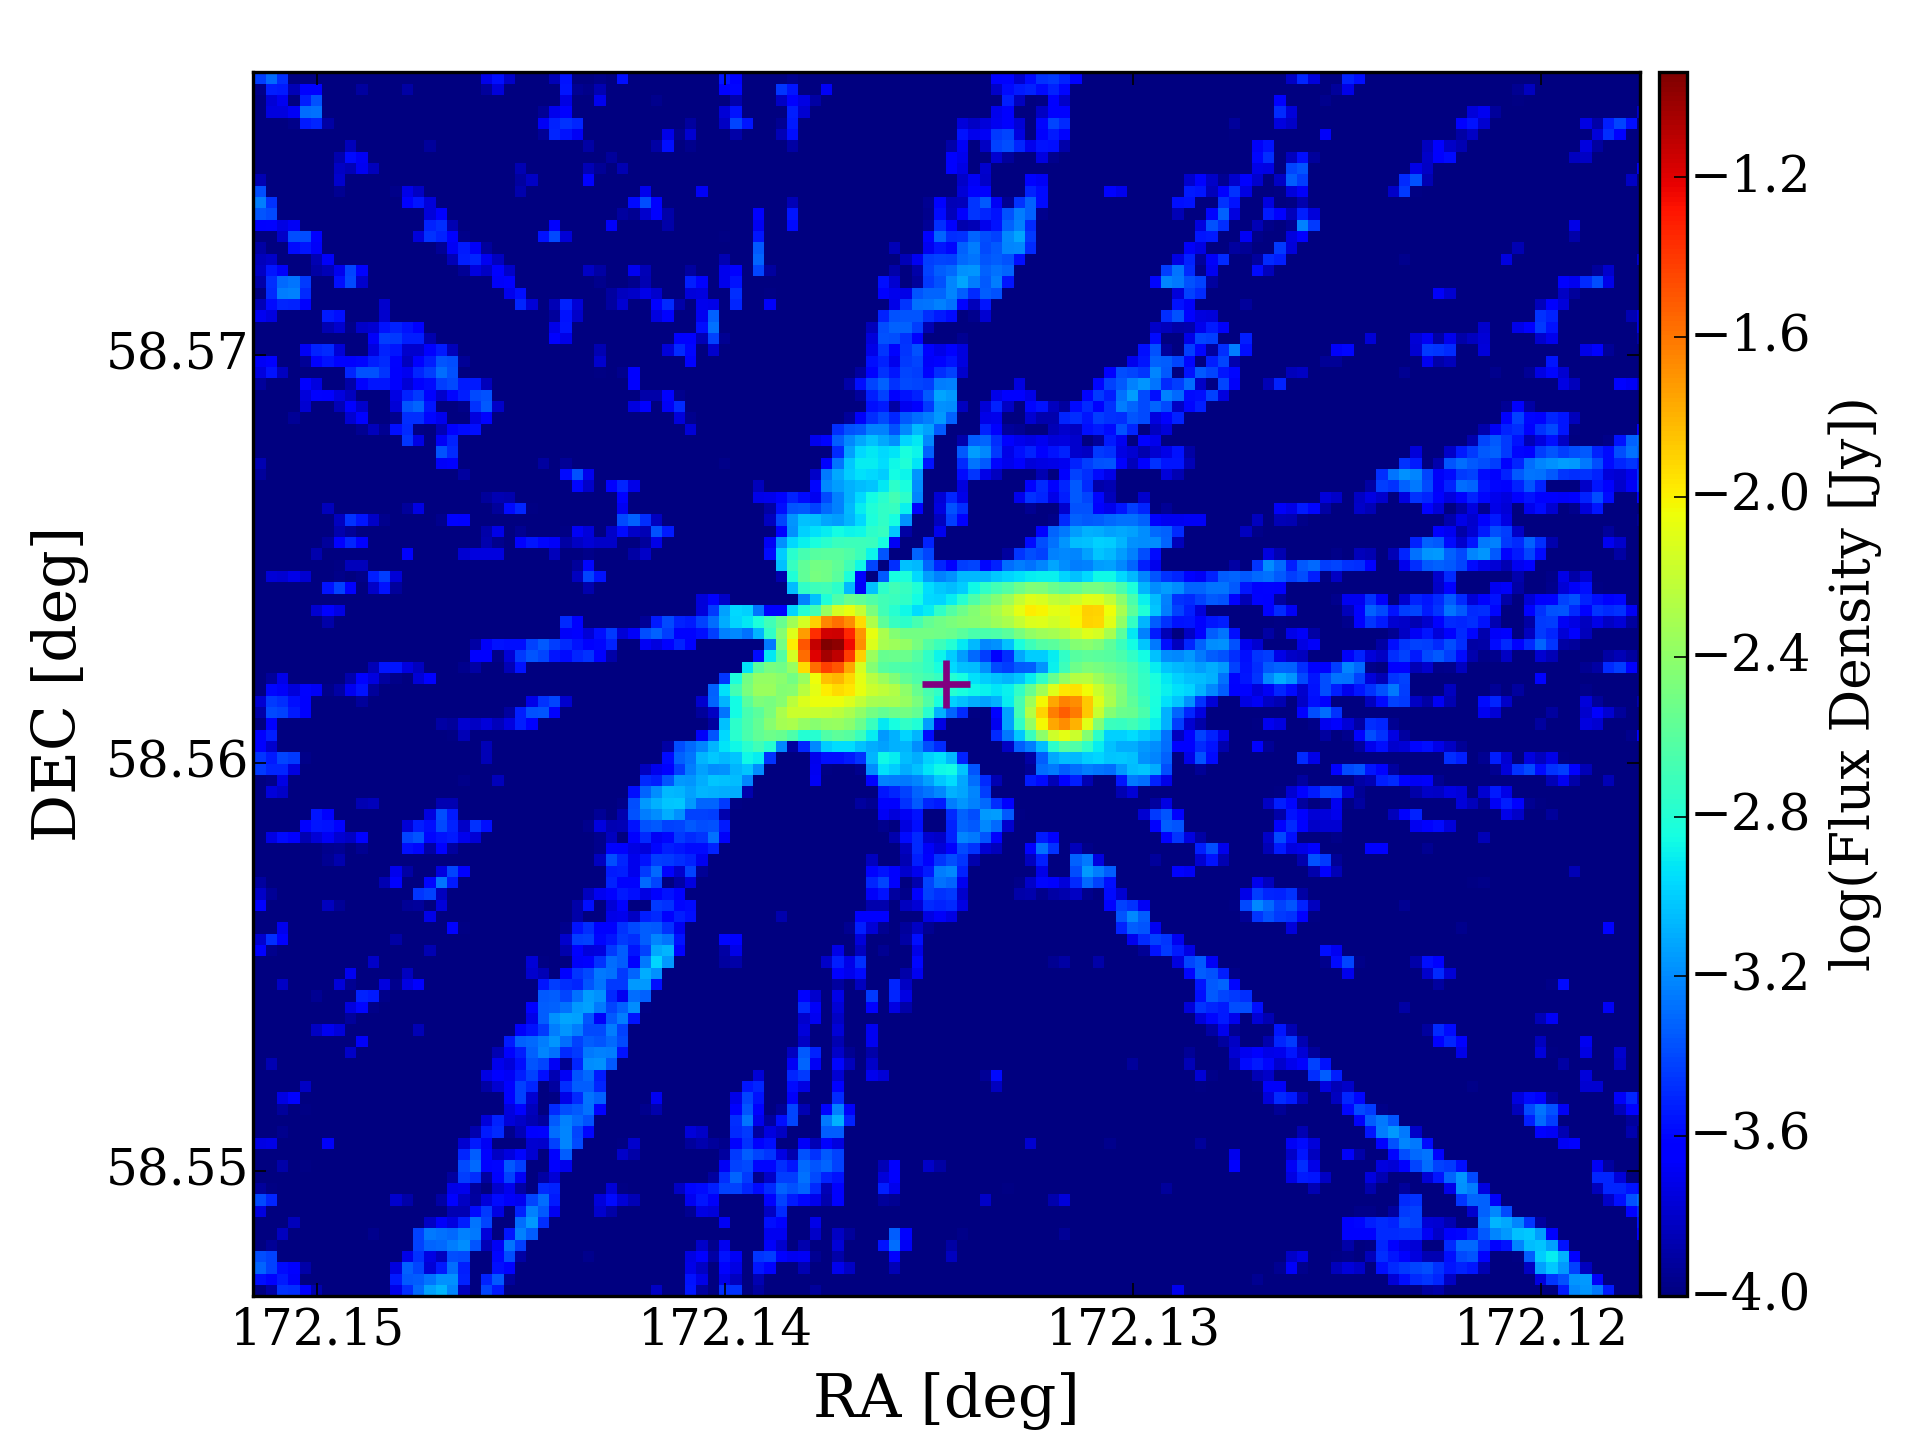
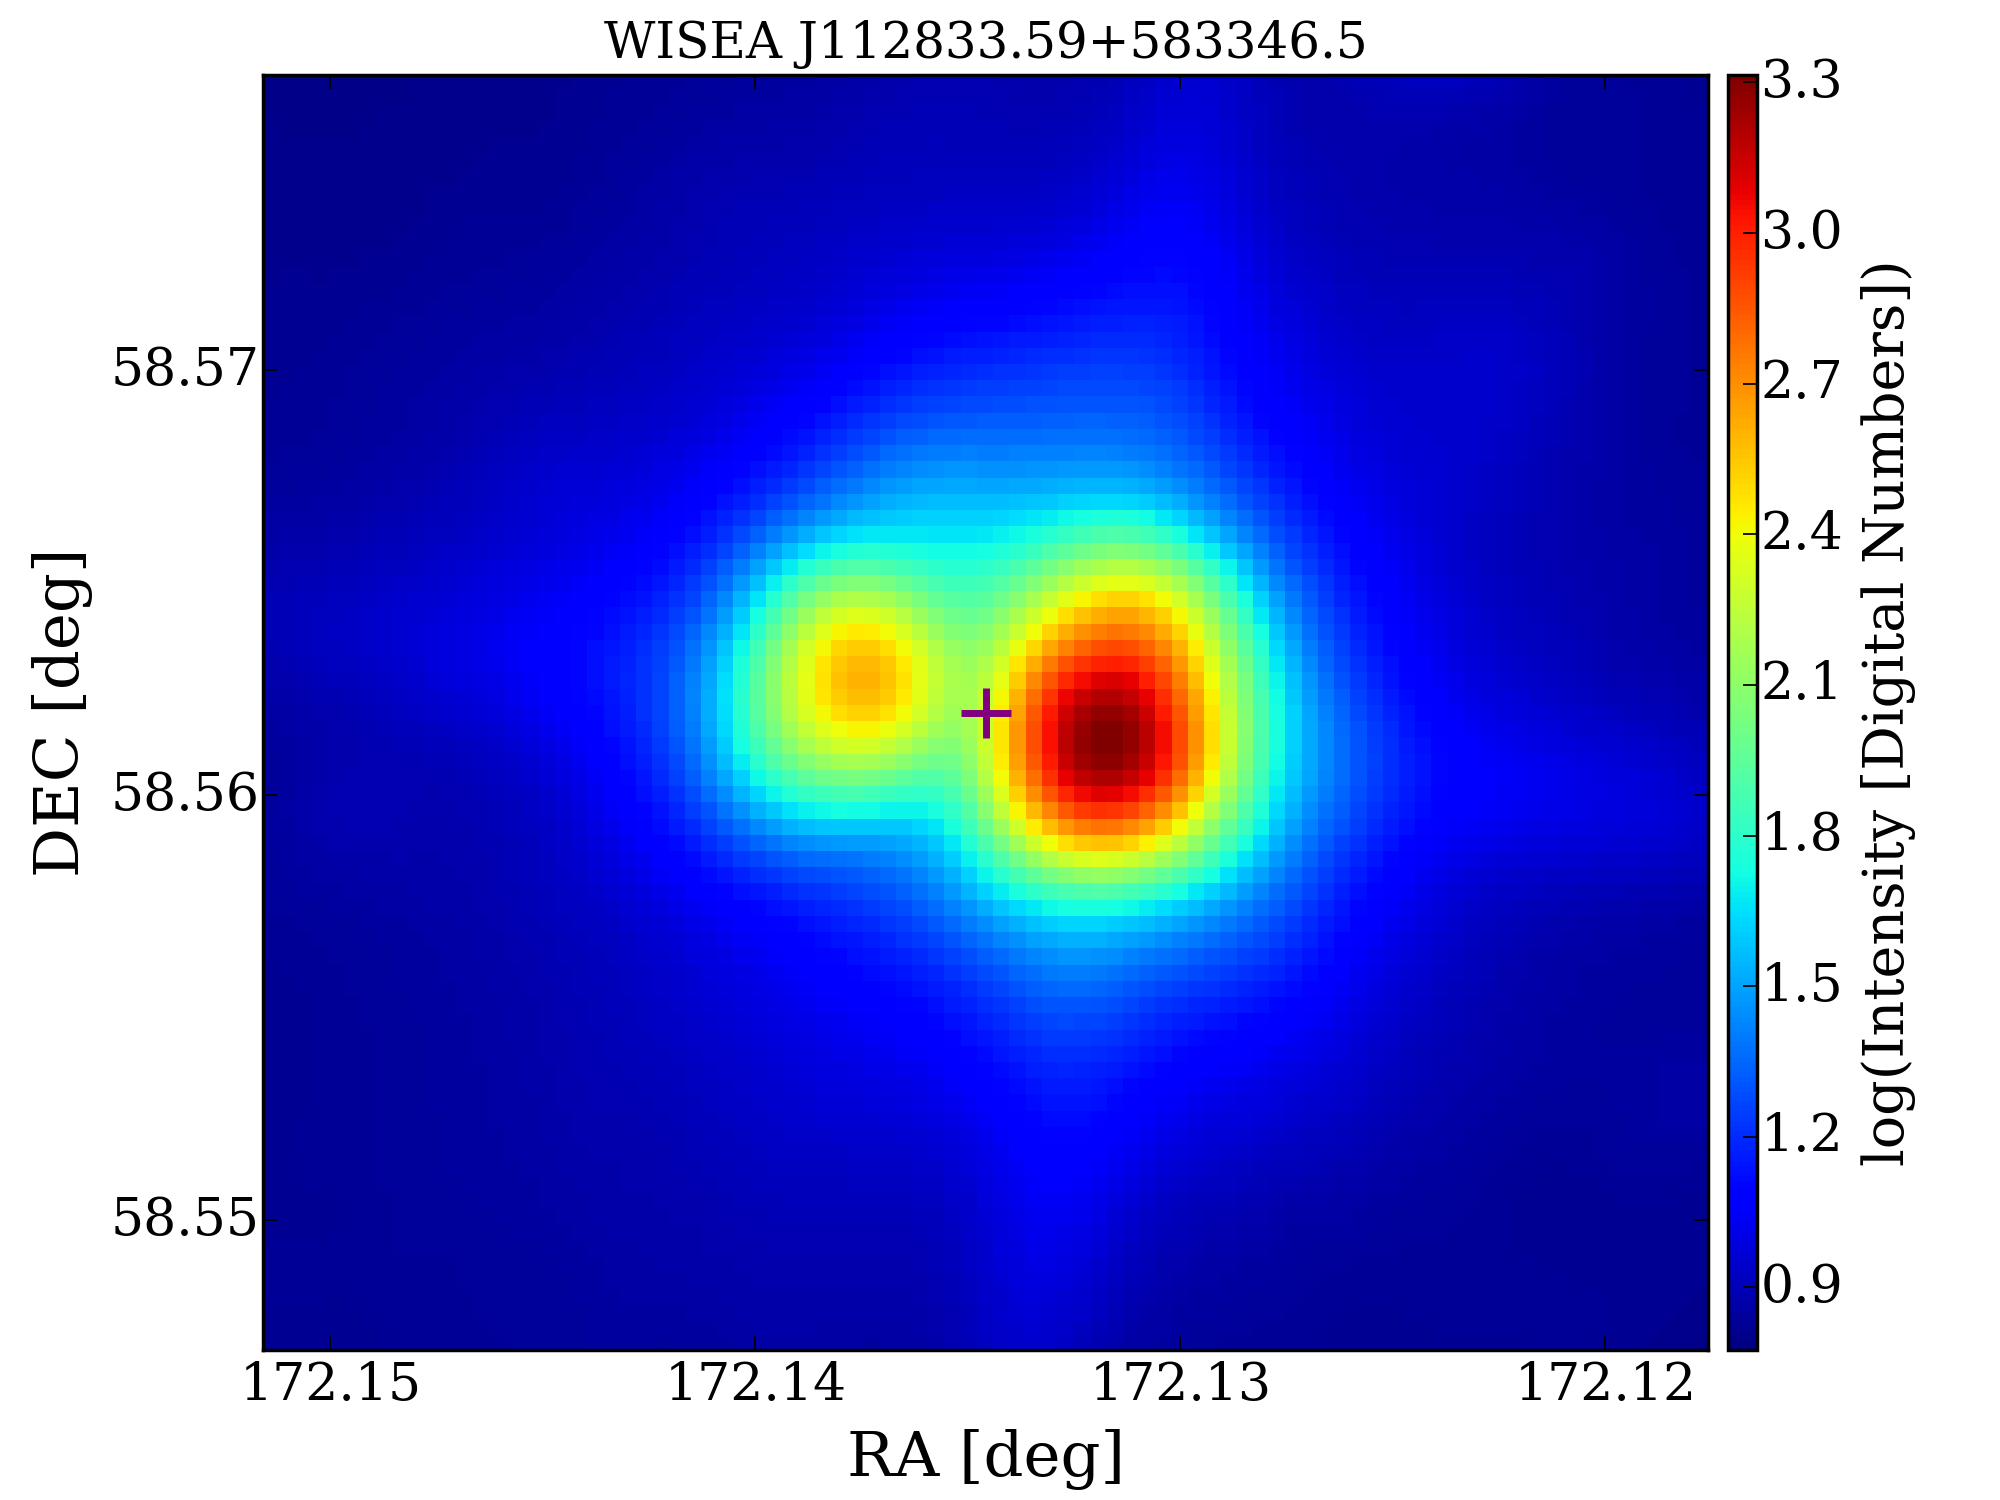
4.1.9 NVSS J112832+583346 (NGC 3690)
NGC 3690 (Figure 10) is within the nearby (cz = 3121 ) merging system recognized as Arp 299 or Mrk 171. Positioned in the early stages of a merger, this system comprises NGC 3690, constituting the western portion of the merger, and IC 694, serving as the eastern component. The exceptional burst of star formation in Arp 299 is evidenced by strong 10 m emission (Gehrz et al., 1983), extended H2 features (Fischer et al., 1983), and optical emission fluxes (Weedman, 1972; Augarde & Lequeux, 1985). The total molecular gas mass (M) derived for Arp 299 is 6 109 M⊙, with M exceeding 6 109 M⊙ (Casoli et al., 1989). The system exhibits a high infrared luminosity, LIR = 5 1011 L⊙, attributed to re-radiation of dust heated by remarkable starburst activity, with no discernible evidence of an AGN within the system.
The detection of Hi absorption linked to NGC 3690 was initially documented by Dickey & Benson (1982); Dickey (1986). Subsequently, employing the VLA, Baan & Haschick (1990) identified Hi absorption across all locations within Arp 299, revealing sixteen distinct velocity components. The Hi gas originating from IC 694 is observed in absorption at the nucleus of NGC 3690, and vice versa.
We blindly detected Hi absorption in Arp 299 in the FAST survey. The FAST beam, with a size of 3 arcmins, covers the entire merging system and captures emissions and absorption in front of the extended continuum sources (depicted in Figure 10). Our spectra align with those of Casoli et al. (1989), who presented Hi spectra obtained using the Nançay telescope (with a beam size of 4 arcminutes 20 arcminutes).
In our observed absorption profile, two components are discernible. Given that NGC 3690 is nearly face-on and IC 694 is almost edge-on, it is reasonable to infer that the velocity component around 3184 corresponds to gas from IC 694, while the component at 3094 belongs to NGC 3690 (Baan & Haschick, 1990). However, due to the limitations of our single-dish observation, which can not differentiate Hi absorption in each object within Arp 299, we cannot provide accurate estimates for optical depth and column density.

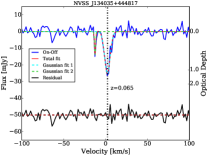
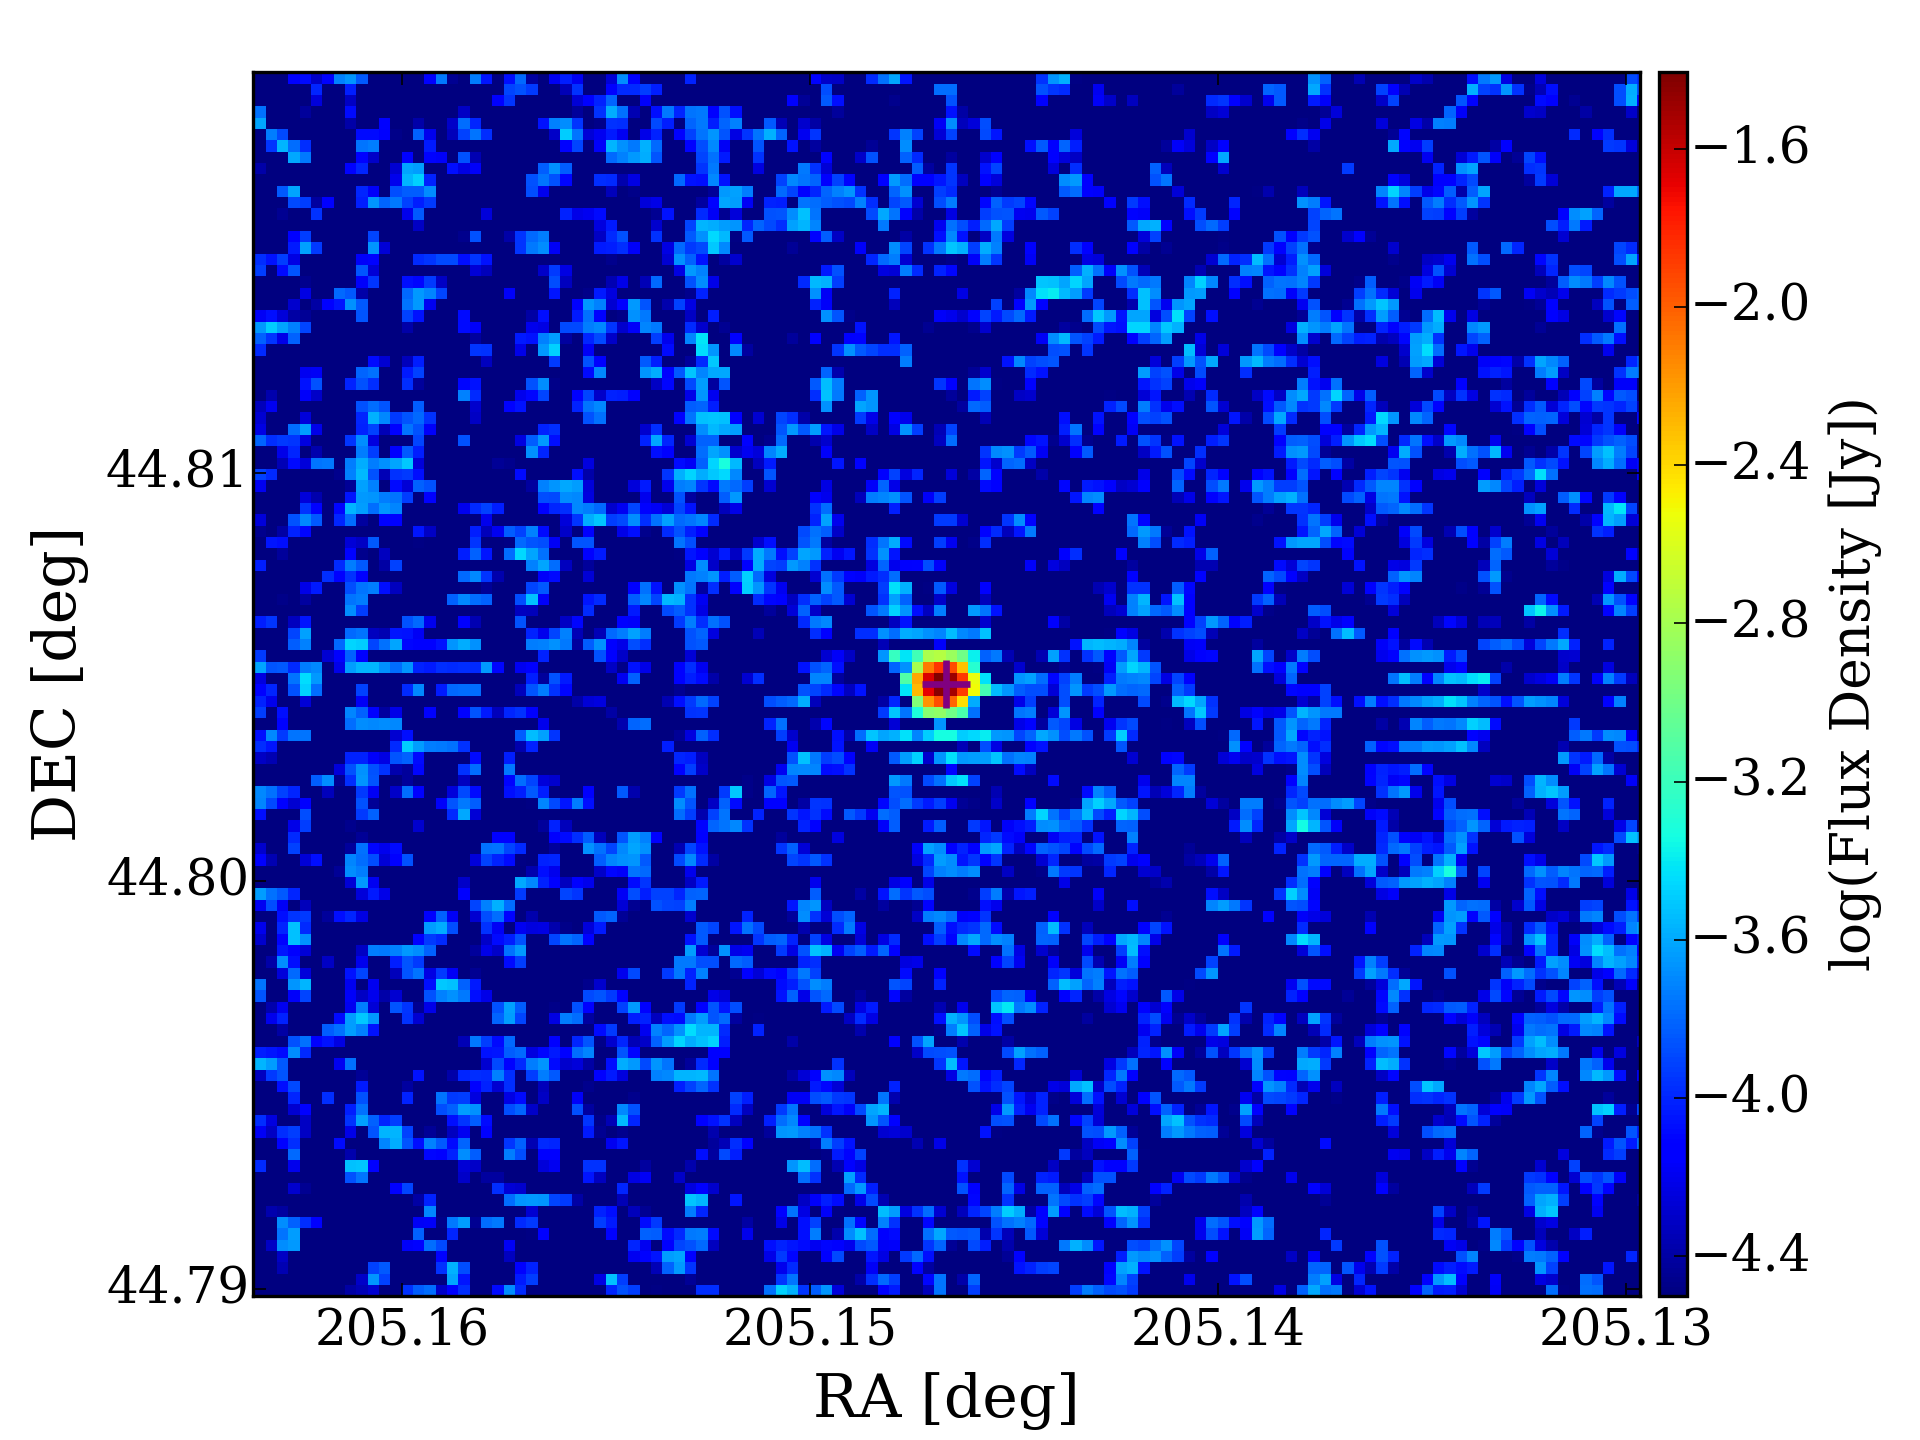
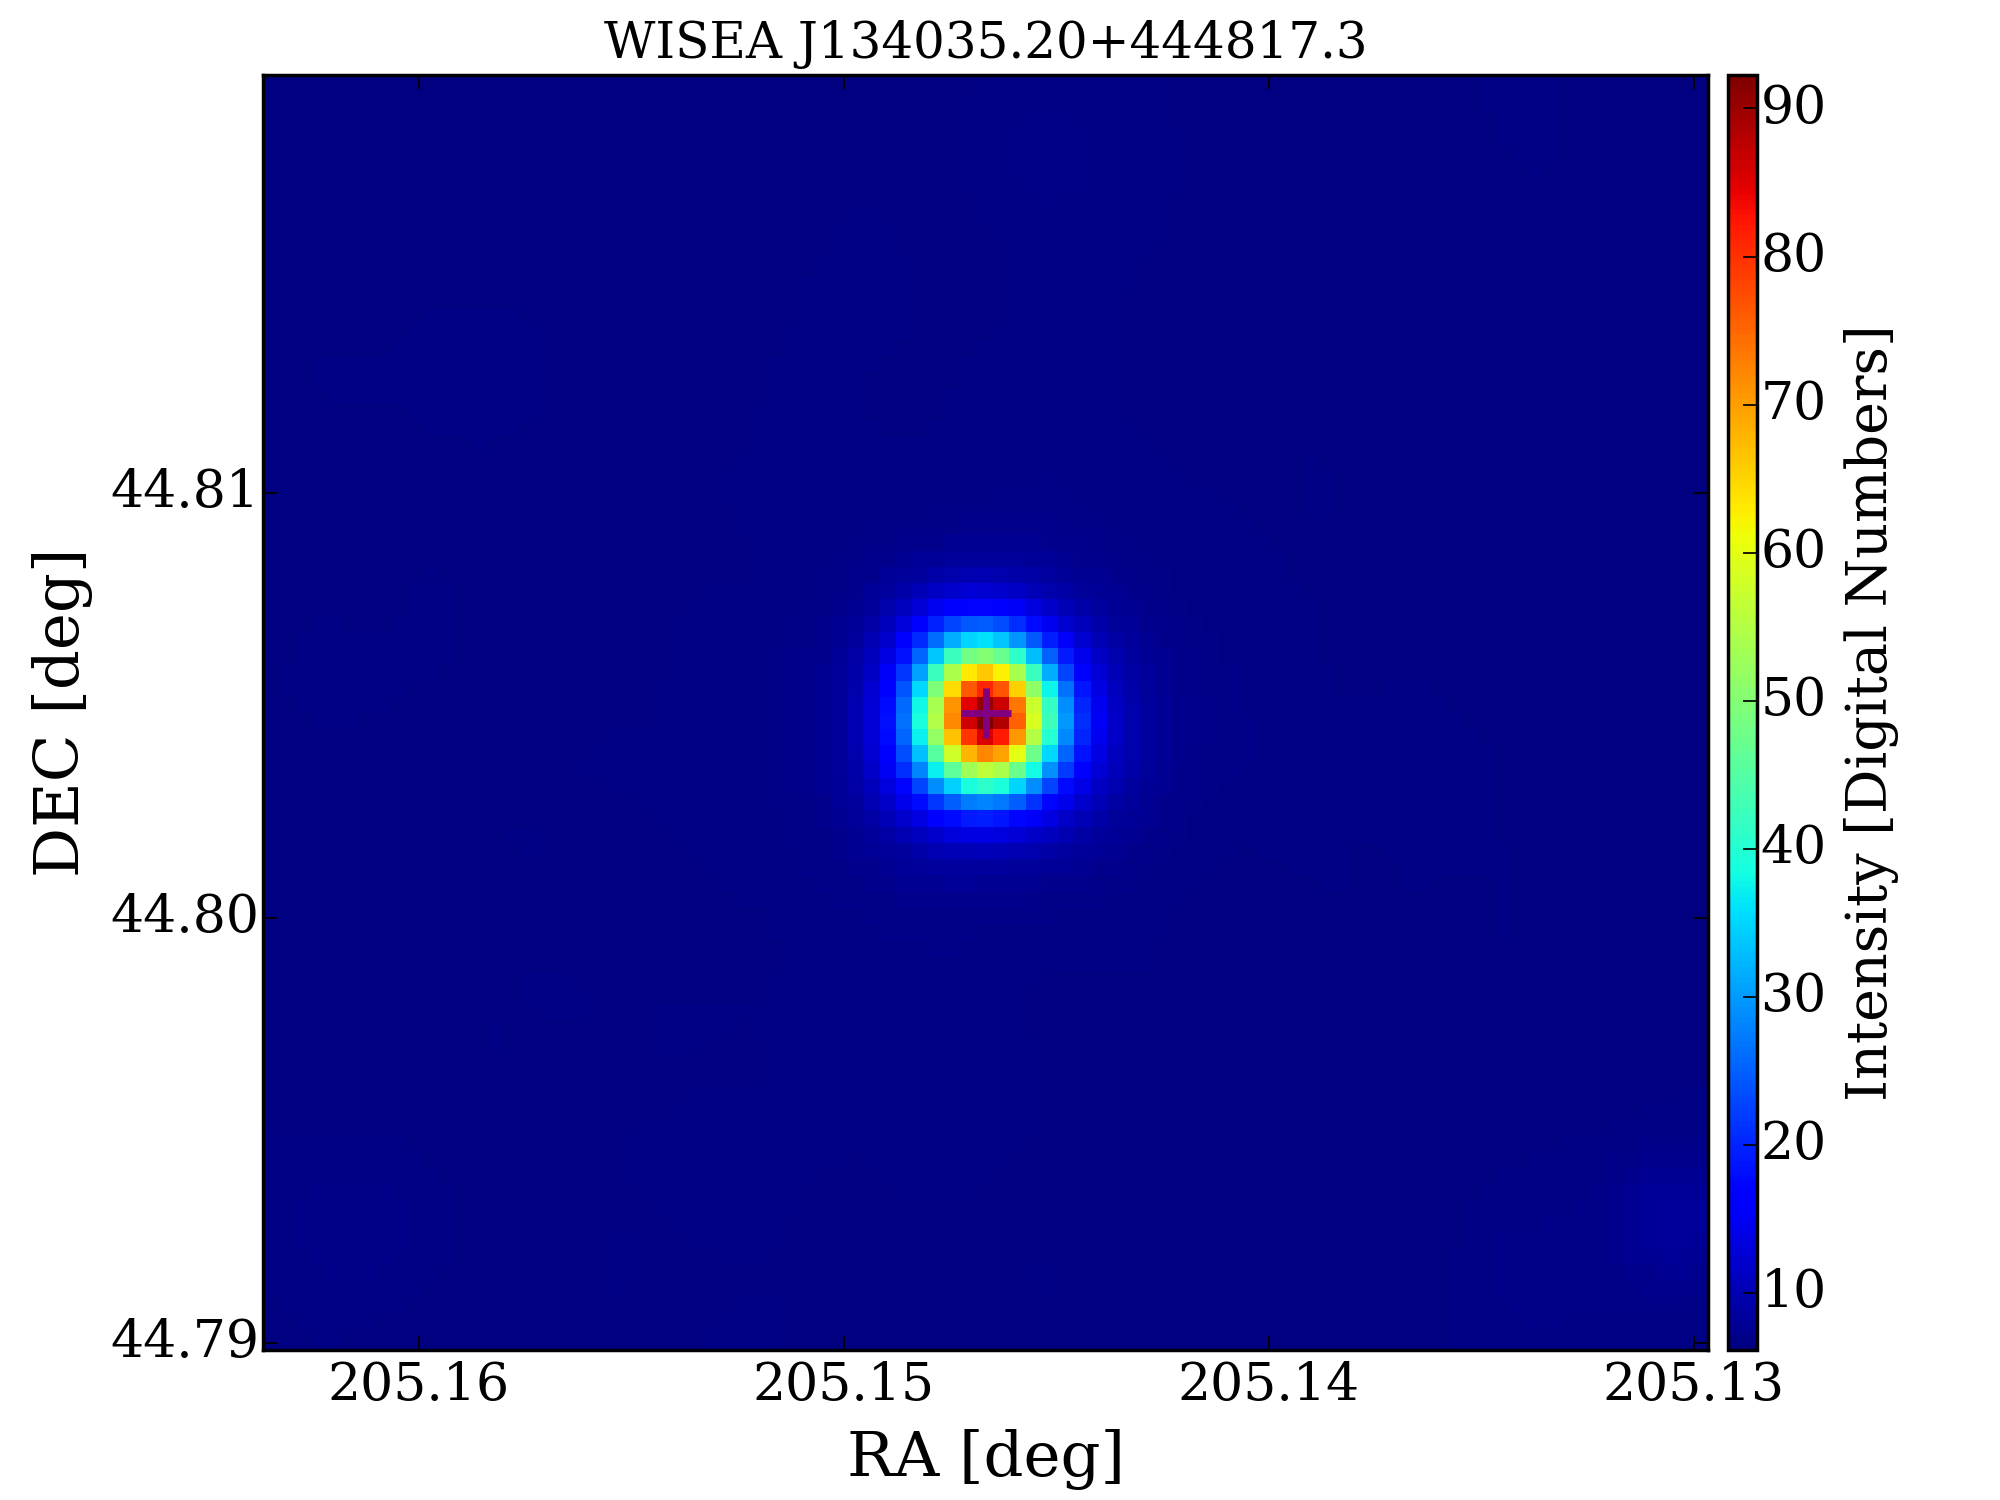
4.1.10 NVSS J134035+444817
NVSS J134035+444817 (Figure 11) is categorized as a Flat-Spectrum Radio Source in Healey et al. (2007). Within the CORALZ sample, this radio source is identified as a potential compact core-jet (CJ) source (de Vries et al., 2009). The linked Hi absorption was initially documented by Geréb et al. (2015). A slender Hi absorption profile is observed at the velocity of NVSS J134035+444817, suggesting the presence of a gas disk.
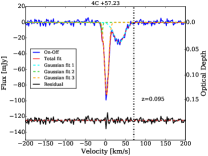
4.1.11 4C +57.23
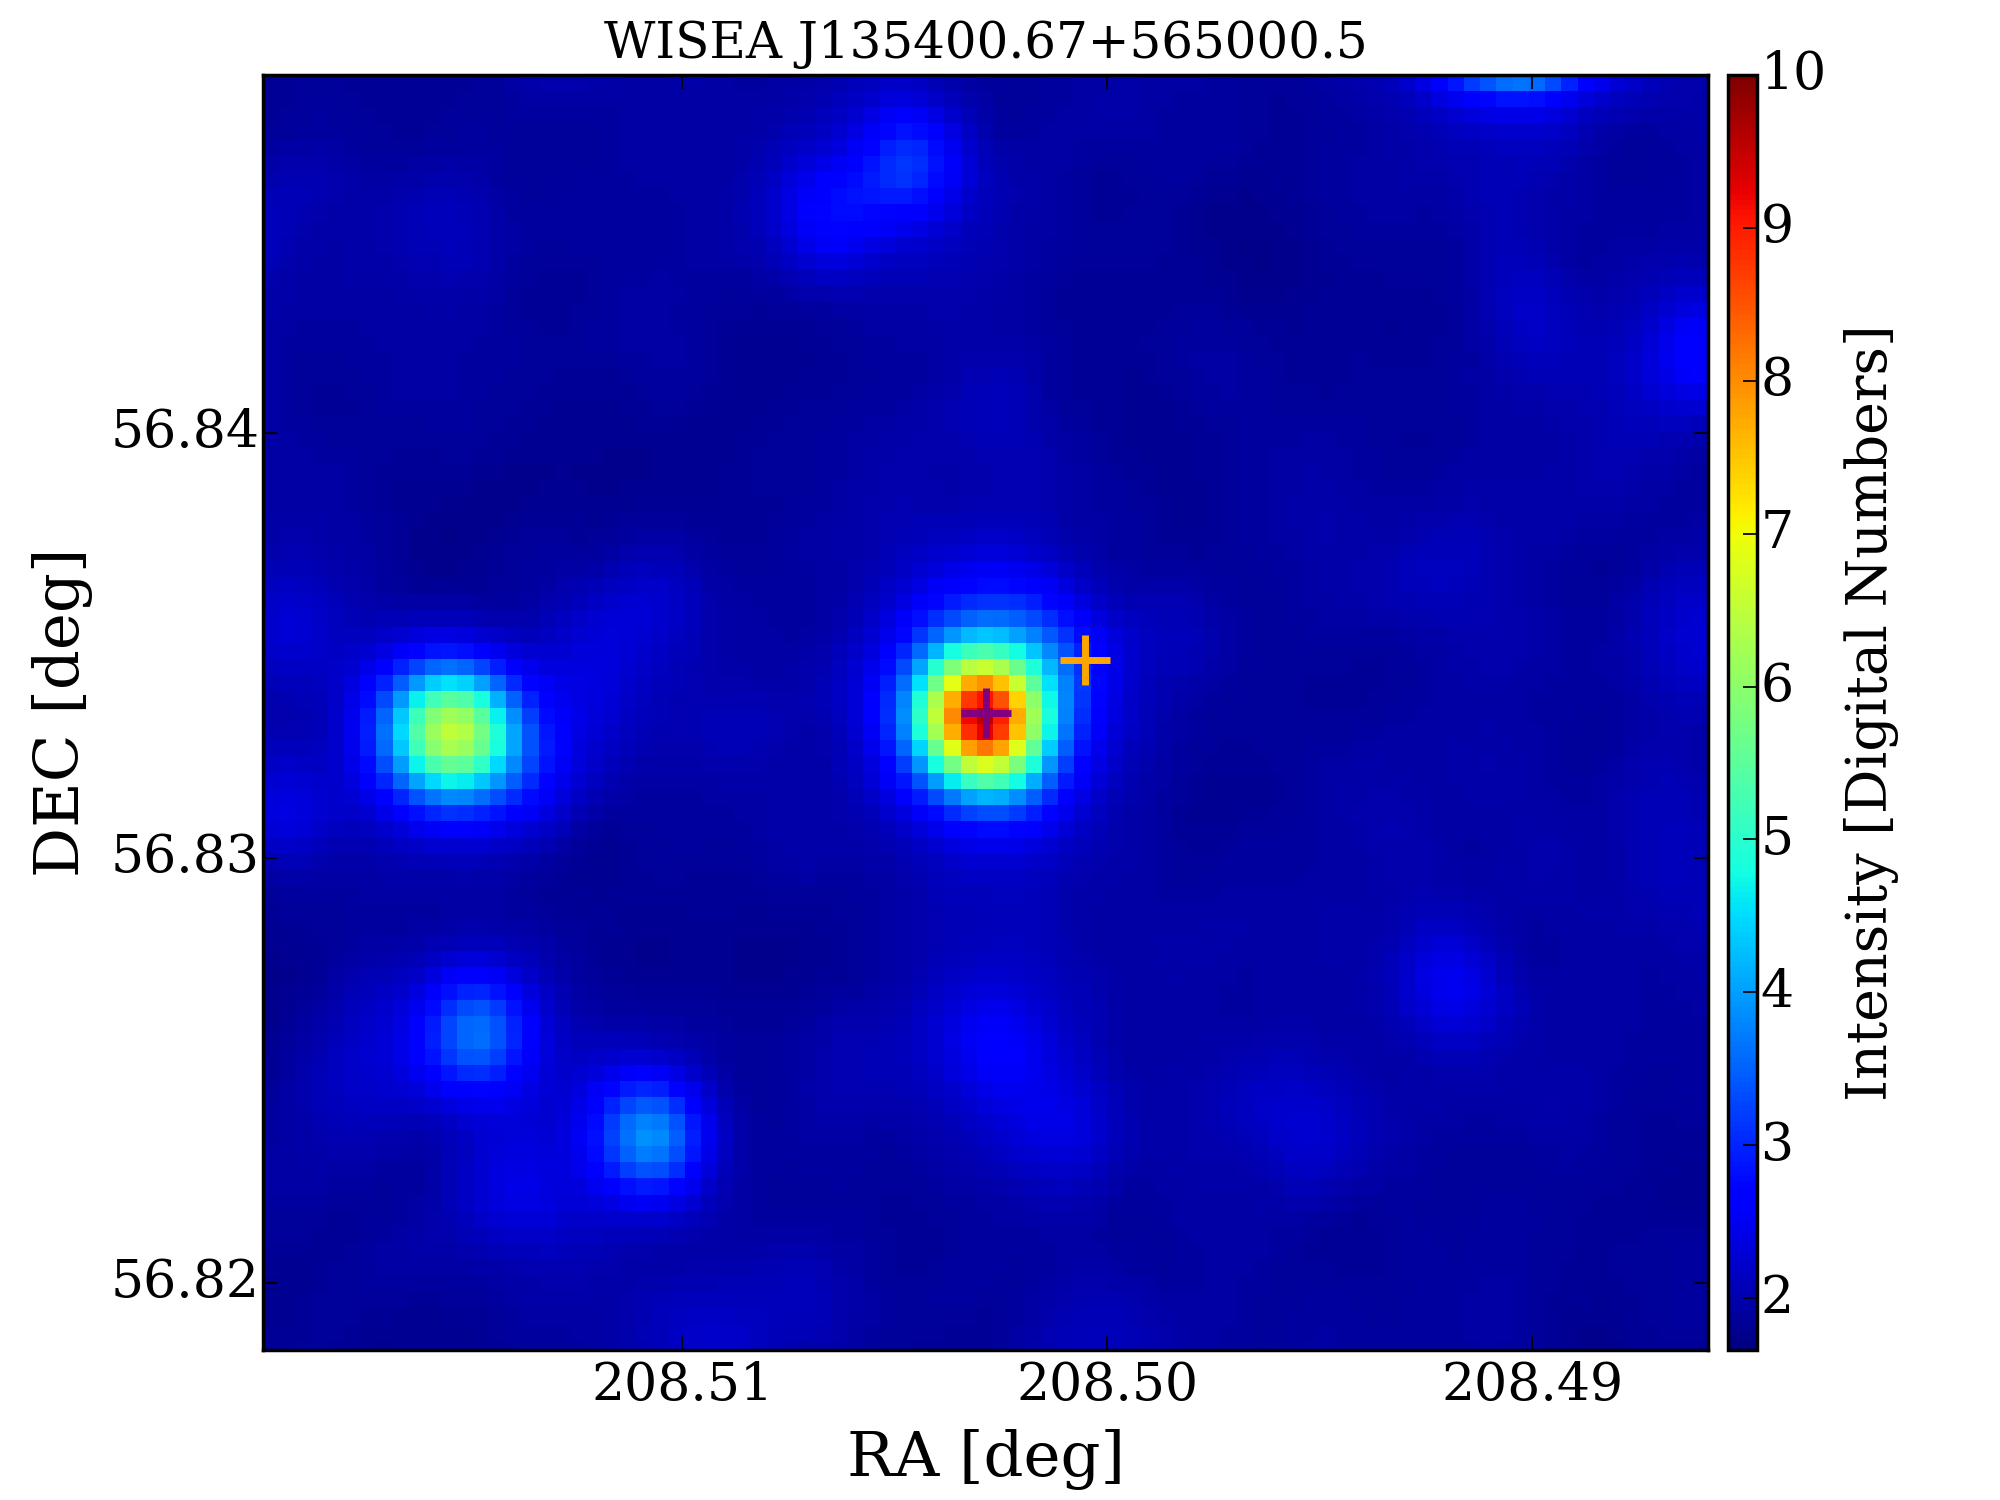
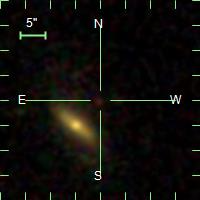
The Hi absorption observed toward 4C +57.23 (Figure 12) is identified as intervening absorption. The SDSS counterpart linked to the foreground galaxy is SDSS J135400.68+565000.3. Its magnitudes are u=19.783, g=17.964, r=16.976, i=16.546 and z=16.200. Based on the SDSS image, this galaxy appears to be an edge-on spiral galaxy, likely of morphological type Sa. The presence of Hi absorption in SDSS J135400.68+565000.3 toward 4C+57.23 was initially documented by Zwaan et al. (2015). In our blind detection, we reconfirmed this absorption and obtained measurements closely aligned with Zwaan et al. (2015), who reported a peak optical depth of and .
The WISE counterpart to the foreground SDSS J135400.68+565000.3 is WISEA J135400.67+565000.5 according to NED. WISE W1[], W2[], W3[] and W4[] magnitudes for WISEA J135400.67+565000.5 are 13.901 0.026, 13.803 0.035, 12.464 0.278 and 9.192, respectively. W1-W2 color of WISEA J135400.67+565000.5 is 0.098, which suggests that the mid-IR emission comes mainly from stars. According to the W2-W3 value of 1.339 mag, WISEA J135400.67+565000.5 is located in the intersection of the Spirals region and the Ellipticals region in the WISE color-color diagram.
4.2 New Absorbers
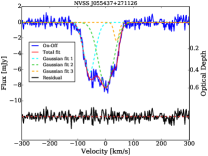
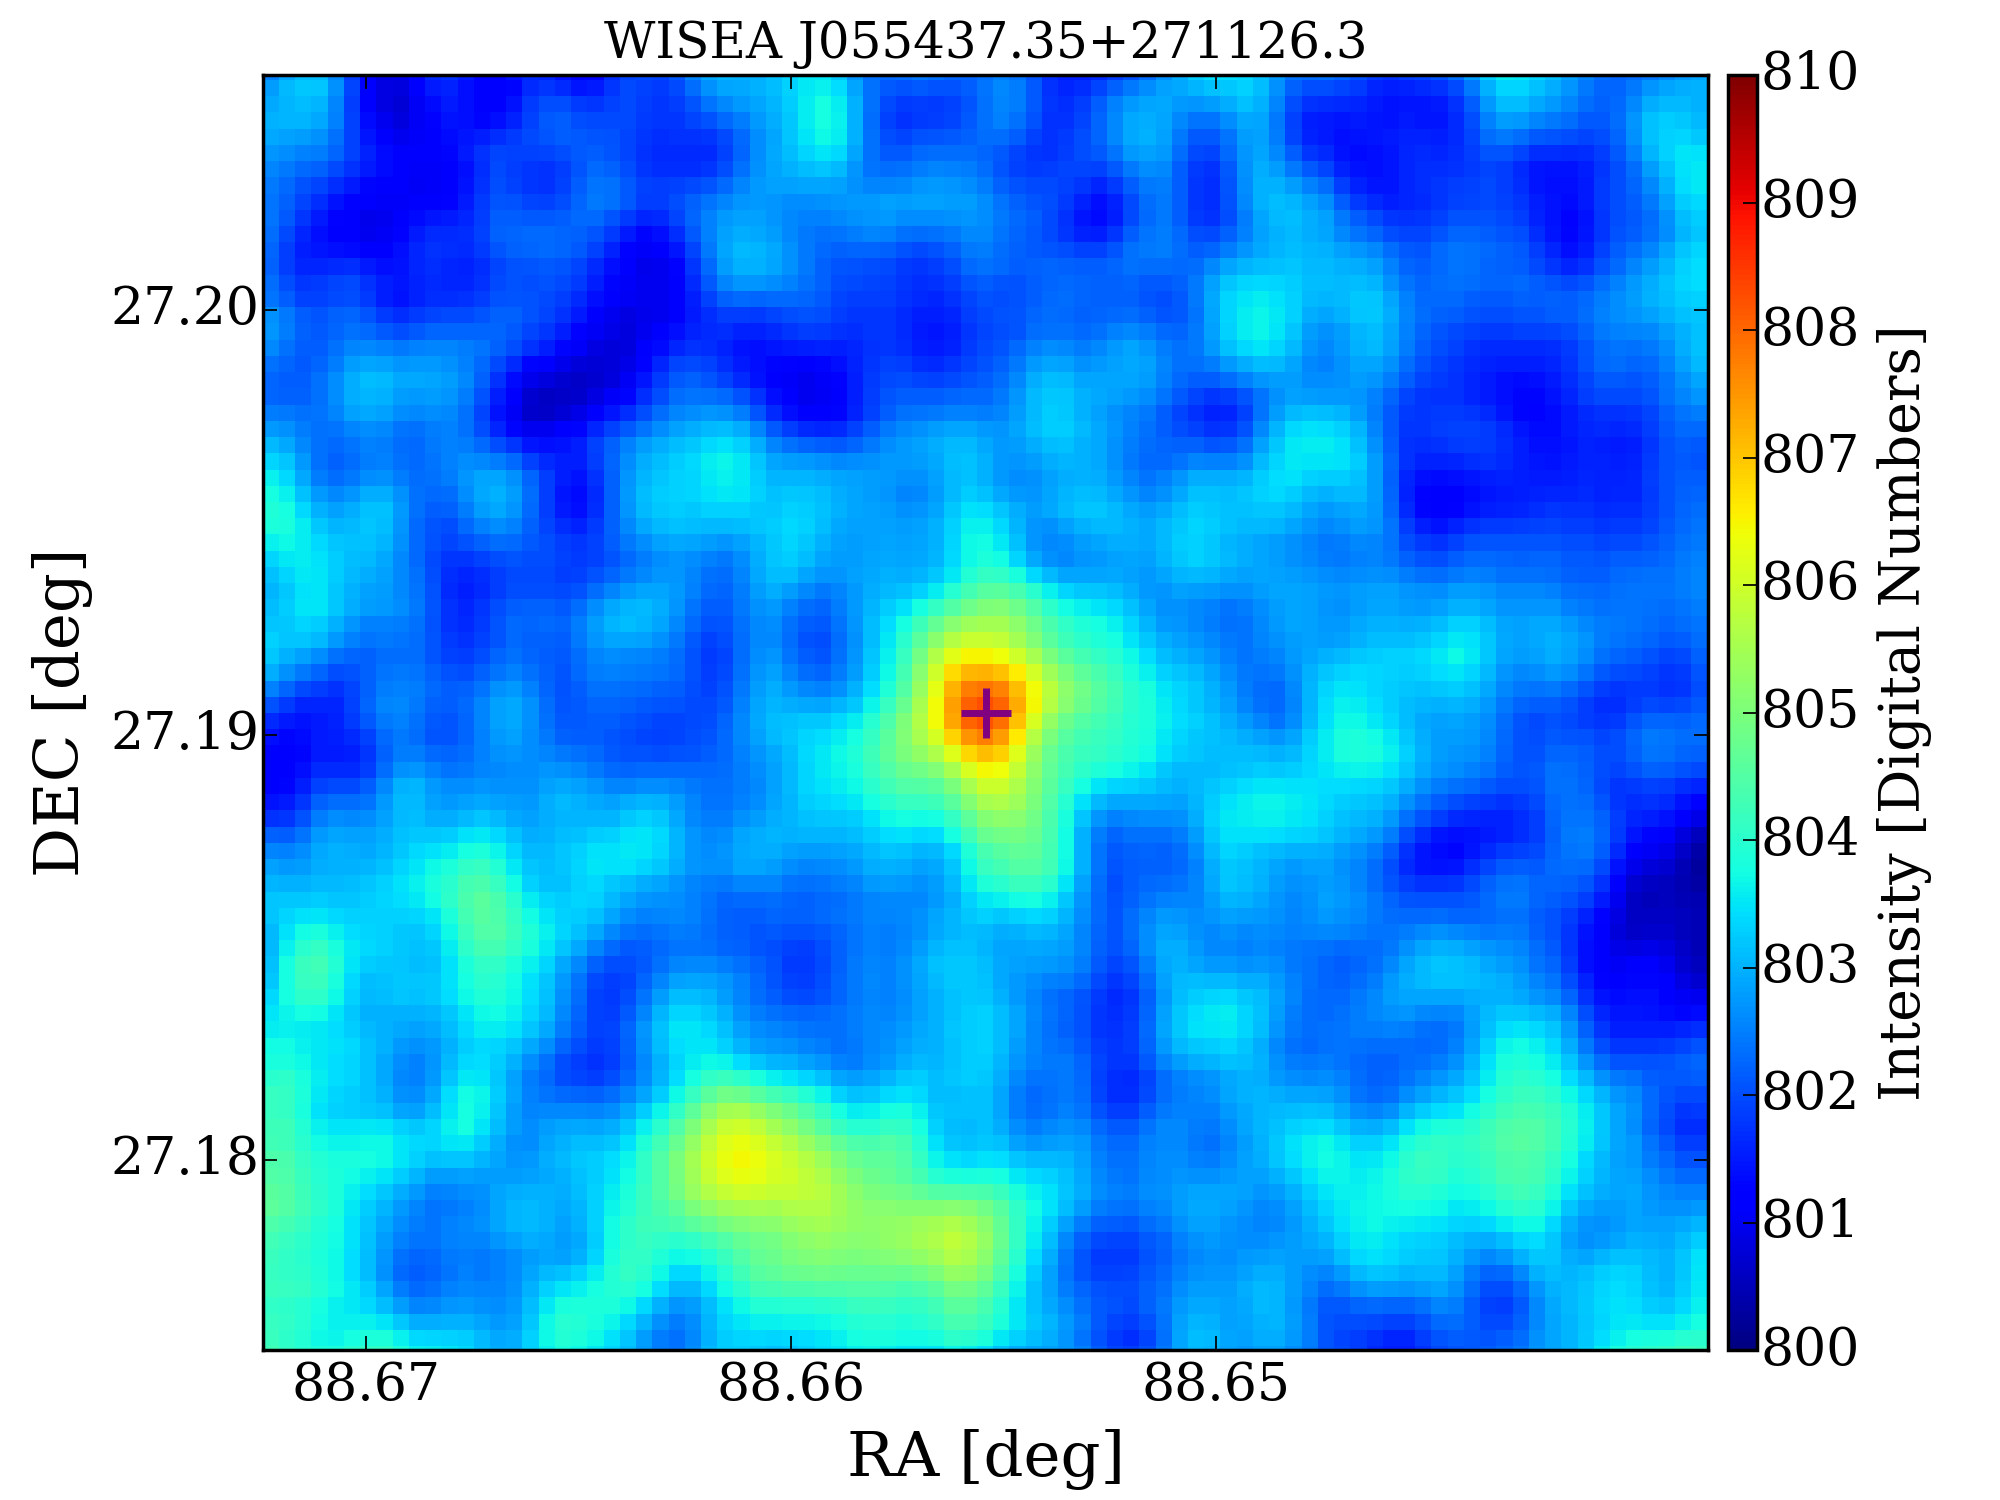
4.2.1 NVSS J055437+271126
NVSS J055437+271126 (Figure 13) is a radio source, detected in NRAO VLA Sky Survey and re-detected in mid-infrared band in WISE Survey and Two Micron All Sky Survey (2MASS, Skrutskie et al. 2006). Only photometric redshift is available. The Hi absorption profile is wide and symmetrical, which can be properly modeled using a three-component Gaussian function.
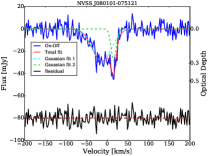
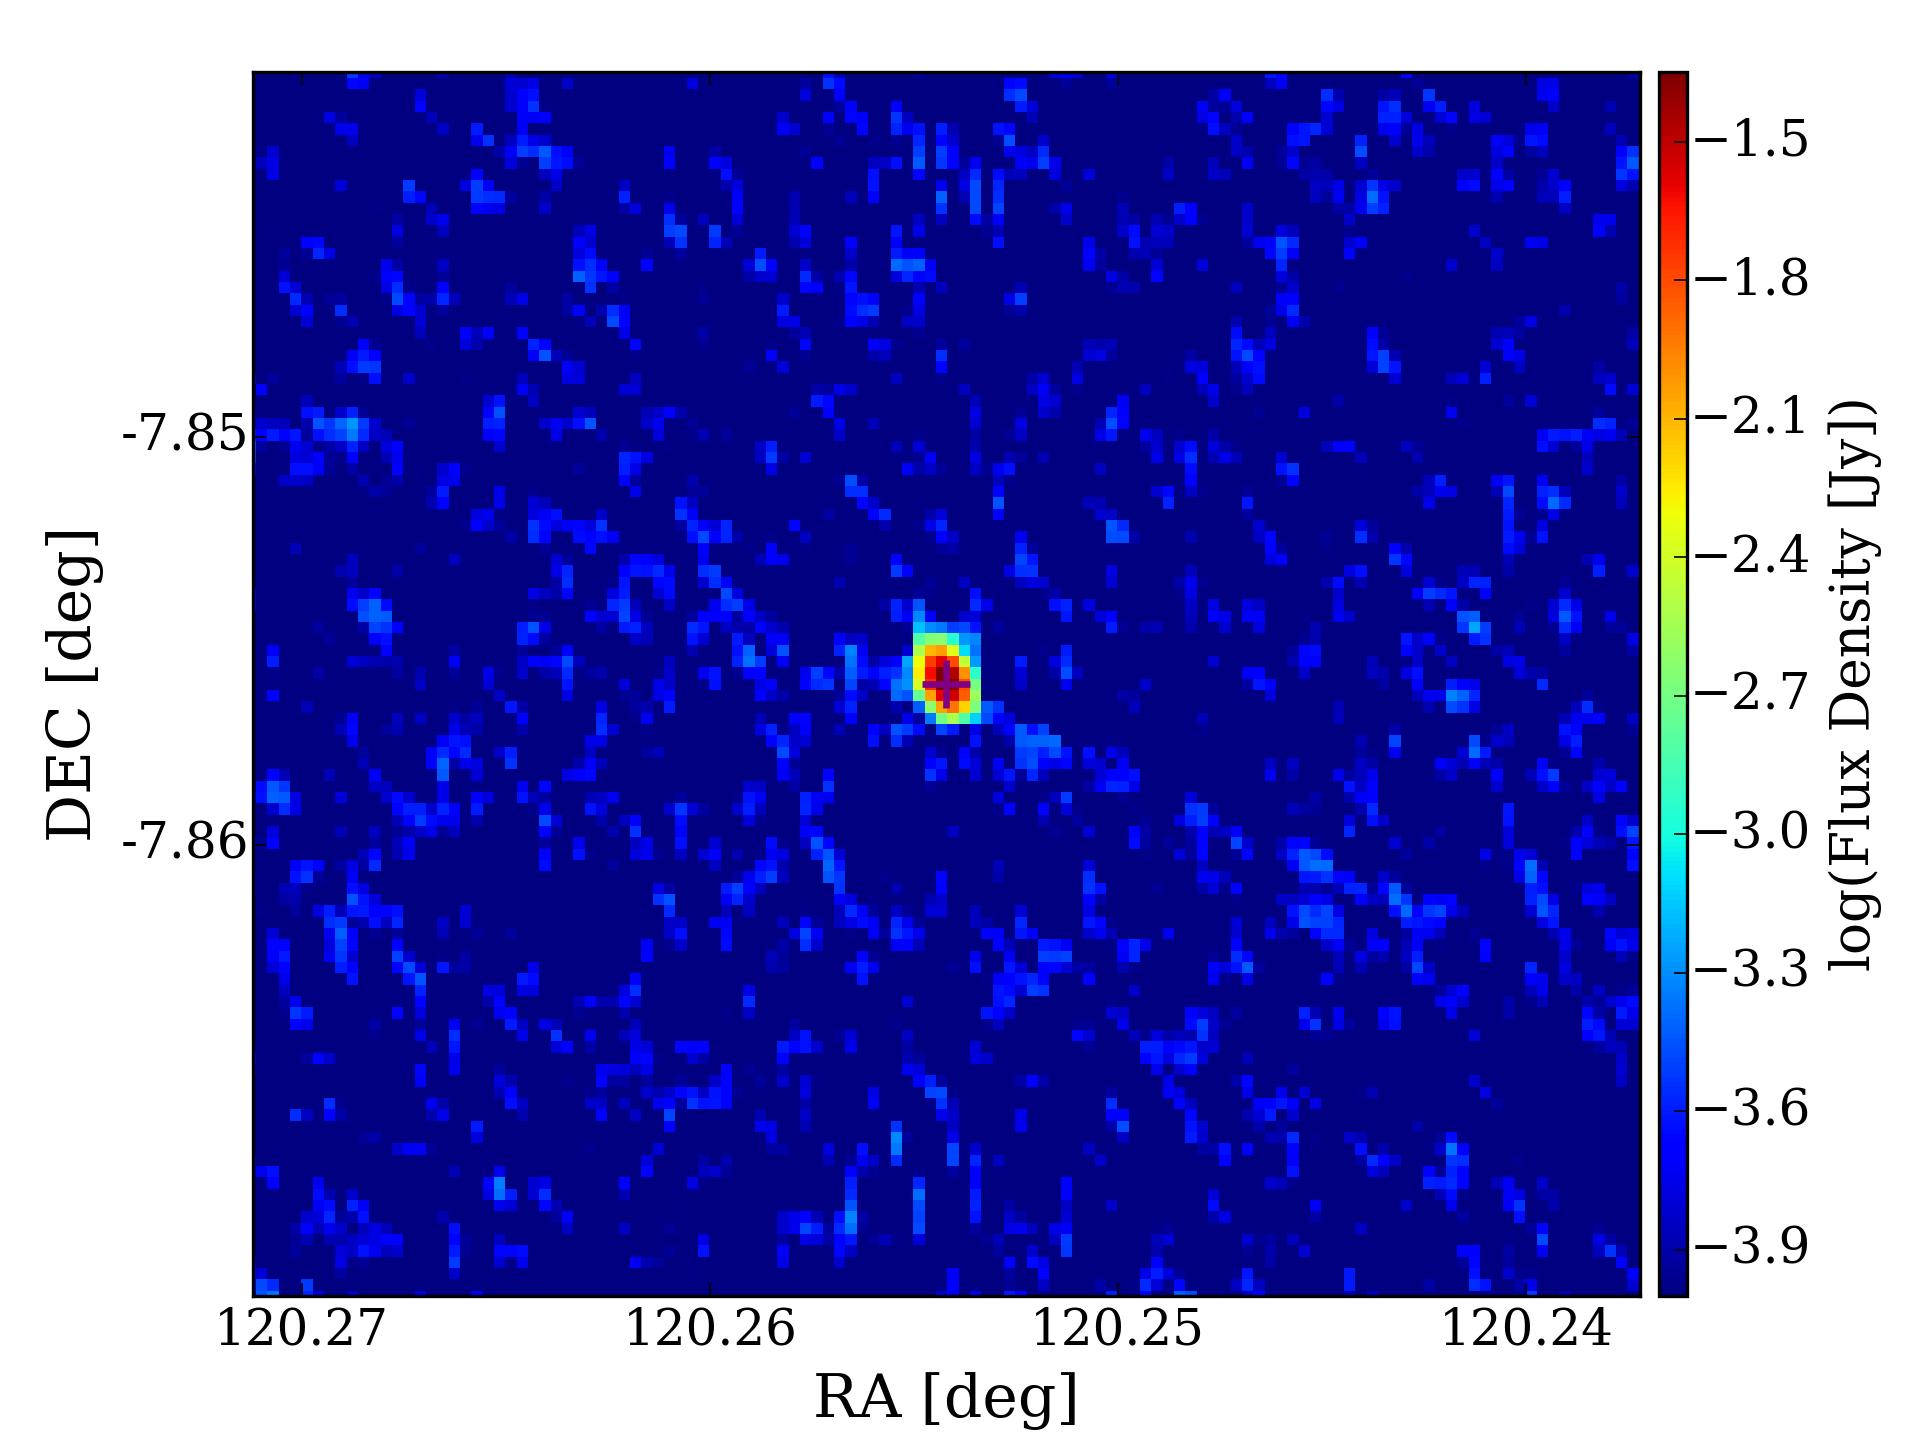
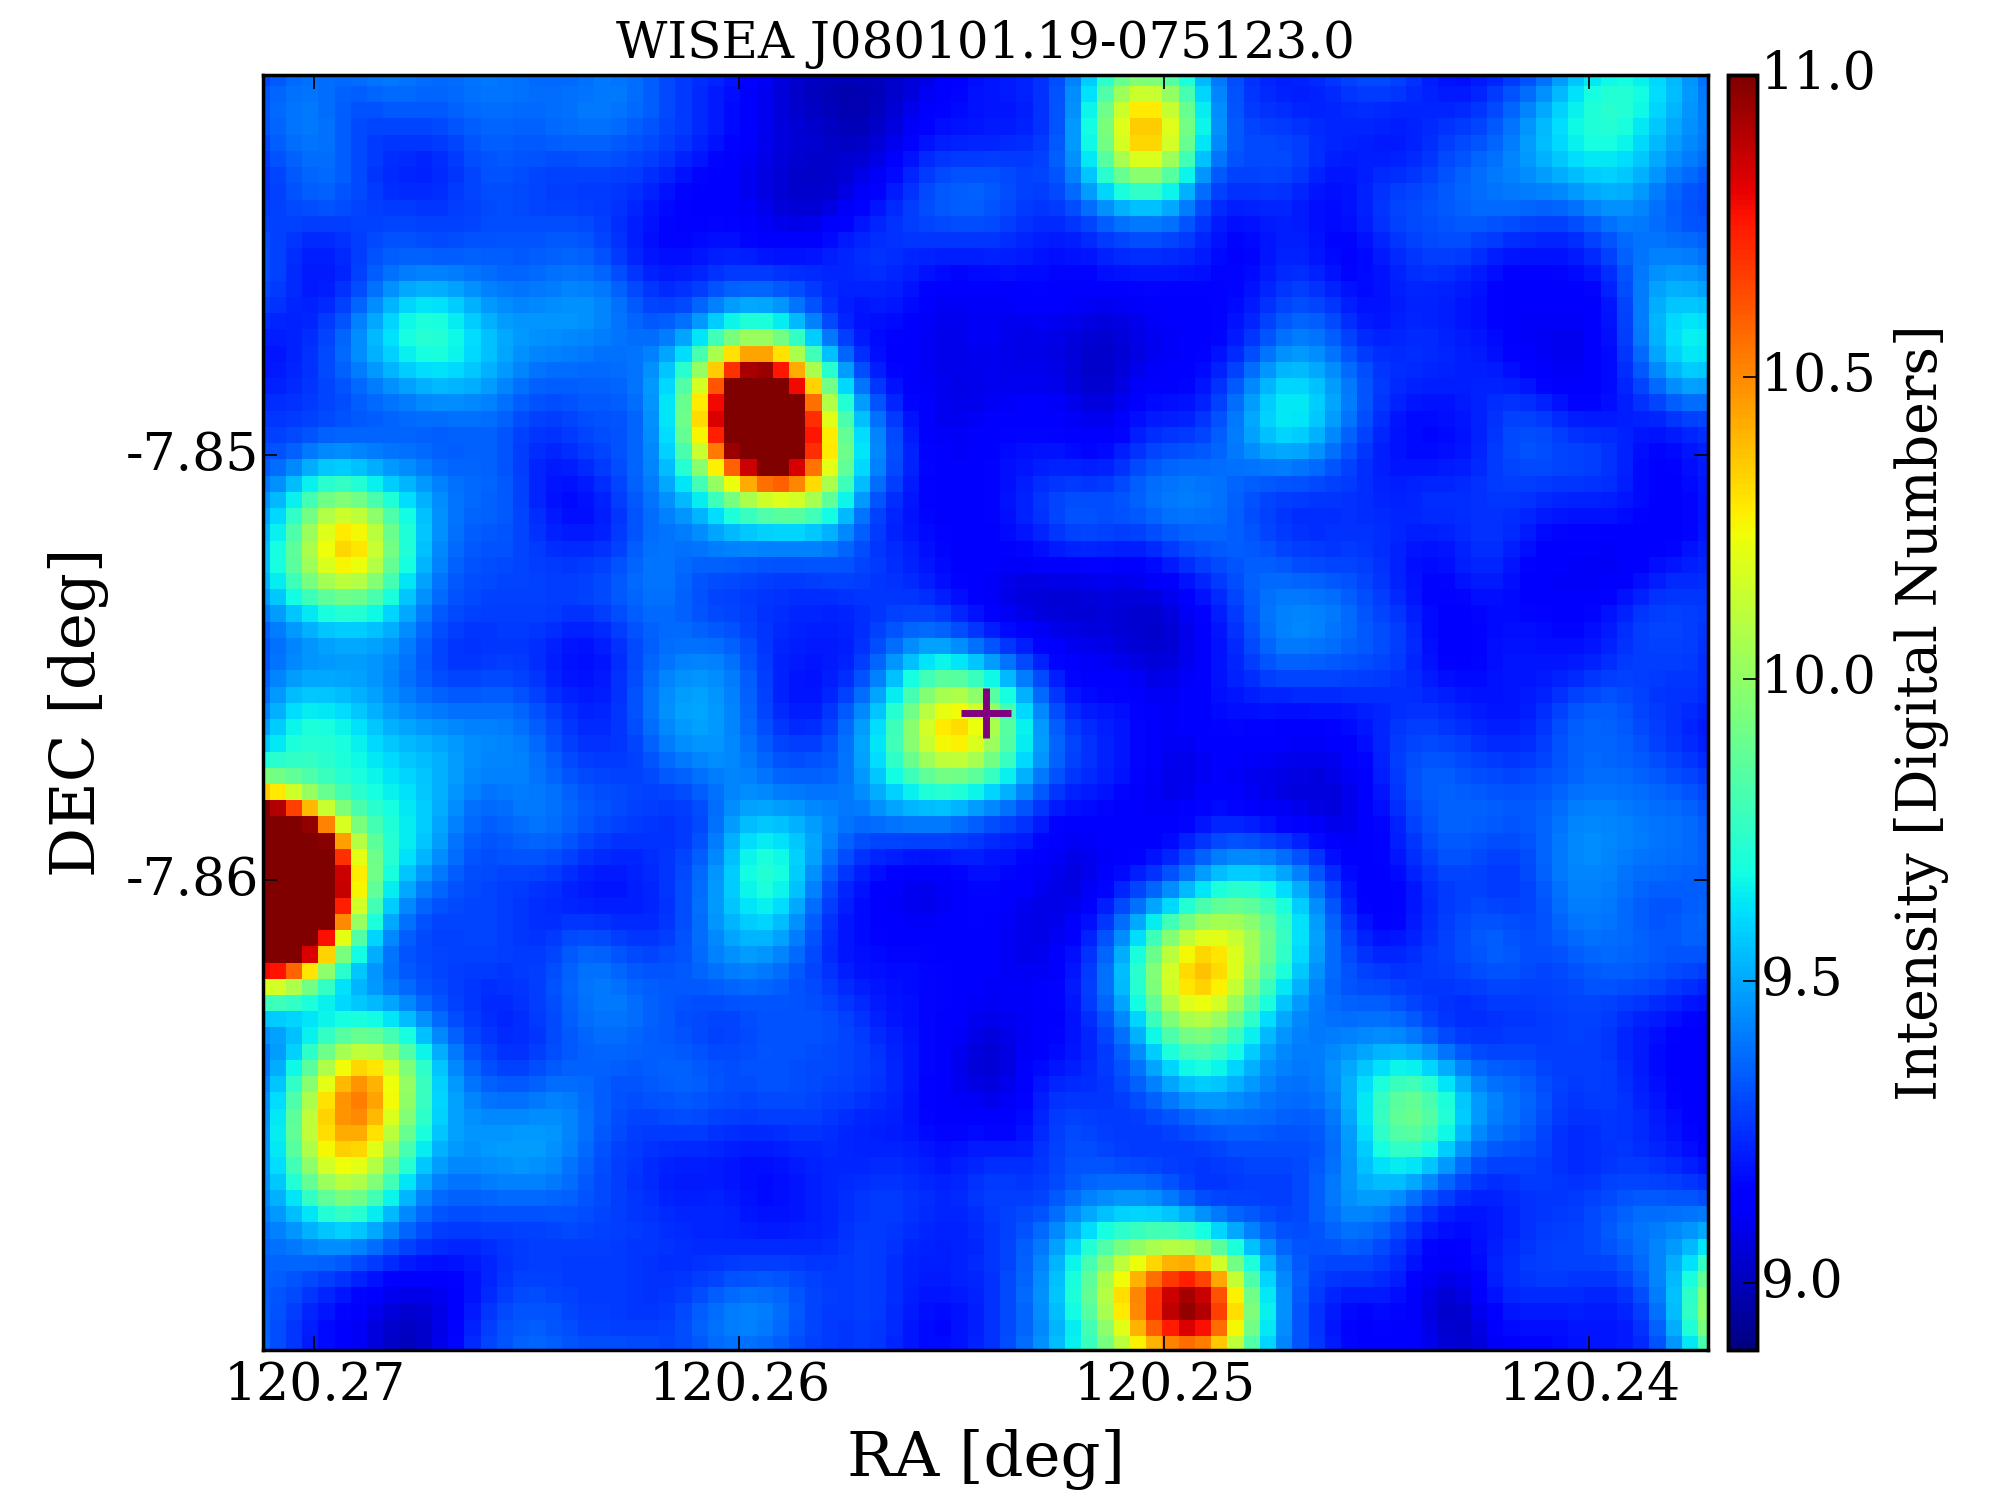
4.2.2 NVSS J080101-075121
NVSS J080101-075121 (Figure 14) has been detected at 365 MHz in the Texas Survey of Radio Sources (Douglas et al., 1996) and at 1.4 GHz in NVSS, and it is detected in the mid-infrared band by WISE. The absence of redshift for the radio source NVSS J080101-075121 introduces uncertainty in identifying the counterpart in the foreground/background. The W1-W2 color of NVSS J080101-075121 is 0.135, which is lower than the value of 0.8 often used to select AGN candidates, and implies that the mid-IR emission comes mainly from stars. Combined with the W2-W3 value of 2.617 mag, NVSS J080101-075121 lies in the region of spiral galaxies in the WISE color-color diagram.
The Hi absorption profile reveals a symmetric, broader component, likely associated with the gas disk, and a narrower, deeper peak, suggesting the presence of distinct, unsettled gas structures.
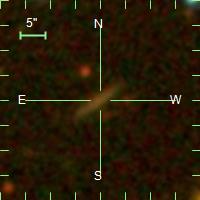
4.2.3 NVSS J100755+405519
NVSS J100755+405519 (Figure 15) is a radio source, detected in the Faint Images of the Radio Sky at Twenty Centimeters Survey (FIRST, Becker et al. 1995) and NVSS. WISE and SDSS measured its flux density in the mid-infrared band and optical band, respectively. Precise redshift details for NVSS J100755+405519 are currently unavailable, resulting in uncertainty regarding the foreground counterpart. The WISE counterpart to NVSS J100755+405519 is WISEA J100755.72+405517.7 according to the NED. The W1-W2 color of WISEA J100755.72+405517.7 is 1.005, indicating WISEA J100755.72+405517.7 is an AGN candidate. Combined with the W2-W3 value of 3.074 mag, WISEA J100755.72+405517.7 is located in the region of QSOs in the WISE color-color diagram.
The intricate absorption profile suggests an unsettled system. To characterize this profile, a six-component Gaussian function is employed. Apart from dominant components at the center, three components exhibit blueshifts with velocity separations of -73 km/s, -45 km/s, and -36 km/s, suggesting a potential gas outflow or the presence of a satellite galaxy. Additionally, a redshifted component implies the possibility of gas accretion.
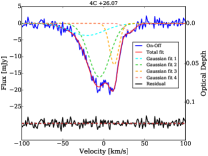
4.2.4 4C +26.07
4C +26.07 (Figure 16) is a radio source which has been detected in the VLA Low-Frequency Sky Survey (VLSS, Cohen et al. 2007) and NVSS. Precise redshift details for 4C +26.07 are currently unavailable, resulting in uncertainty in the identification of the counterpart. A four-component Gaussian function can effectively model the Hi absorption profile. It comprises two prominent components at the center, accompanied by a blueshifted wing signifying a possible gas outflow and a less pronounced redshifted component hinting at gas accretion.
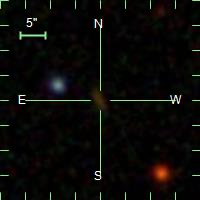
4.2.5 NVSS J004219+570836
NVSS J004219+570836 (Figure 17) is a blazar-like source located at z=1.141 and has been measured in K, Q and L band. The Hi absorption profile can be modeled using a two-component Gaussian function. This function comprises a more pronounced, narrower, and symmetric component, possibly originating from the gas disk. Additionally, there is a less pronounced, broader, and redshifted component, indicating the existence of unsettled gas structures and suggesting a potential gas accretion.
4.2.6 NVSS J011322+251852
NVSS J011322+251852 (Figure 18) is a blazar-like source located at z=1.589 and has been measured in X-ray (Burst Alert Telescope, Oh et al. 2018), ultraviolet (GALEX, Martin et al. 2005), infrared (WISE and 2MASS) and radio band (NVSS). Optical spectroscopic data is available from the SDSS-IV Extended Baryon Oscillation Spectroscopic Survey (eBOSS Myers et al. 2015). The Hi absorption profile displays a more intense and symmetric component, likely stemming from the gas disk. Furthermore, a shallower redshifted wing is present, suggesting the presence of unsettled gas structures and hinting at a potential accretion of gas.

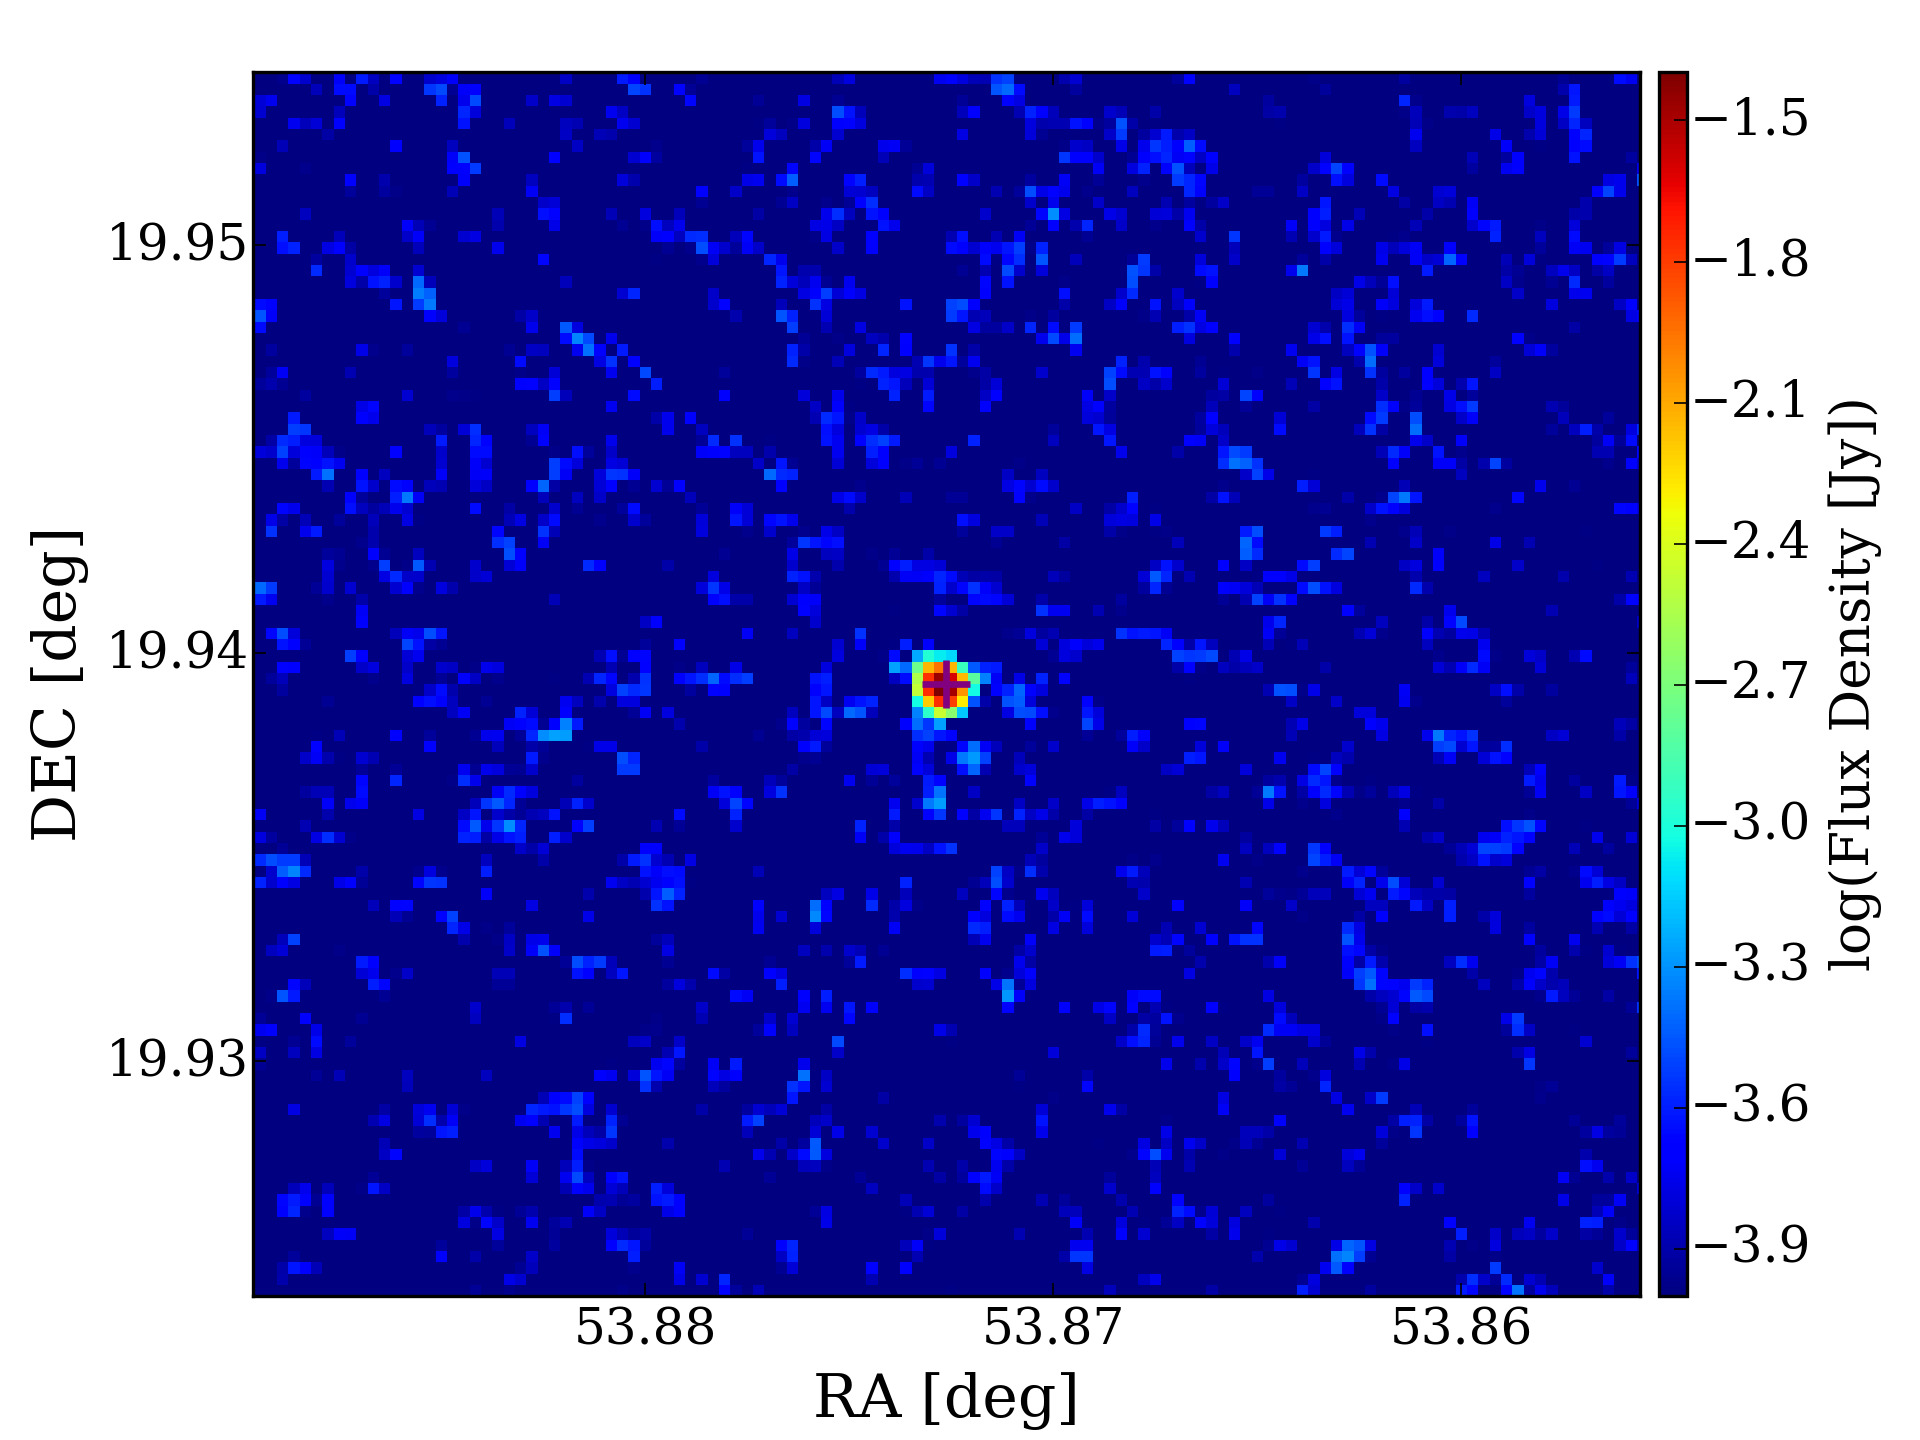
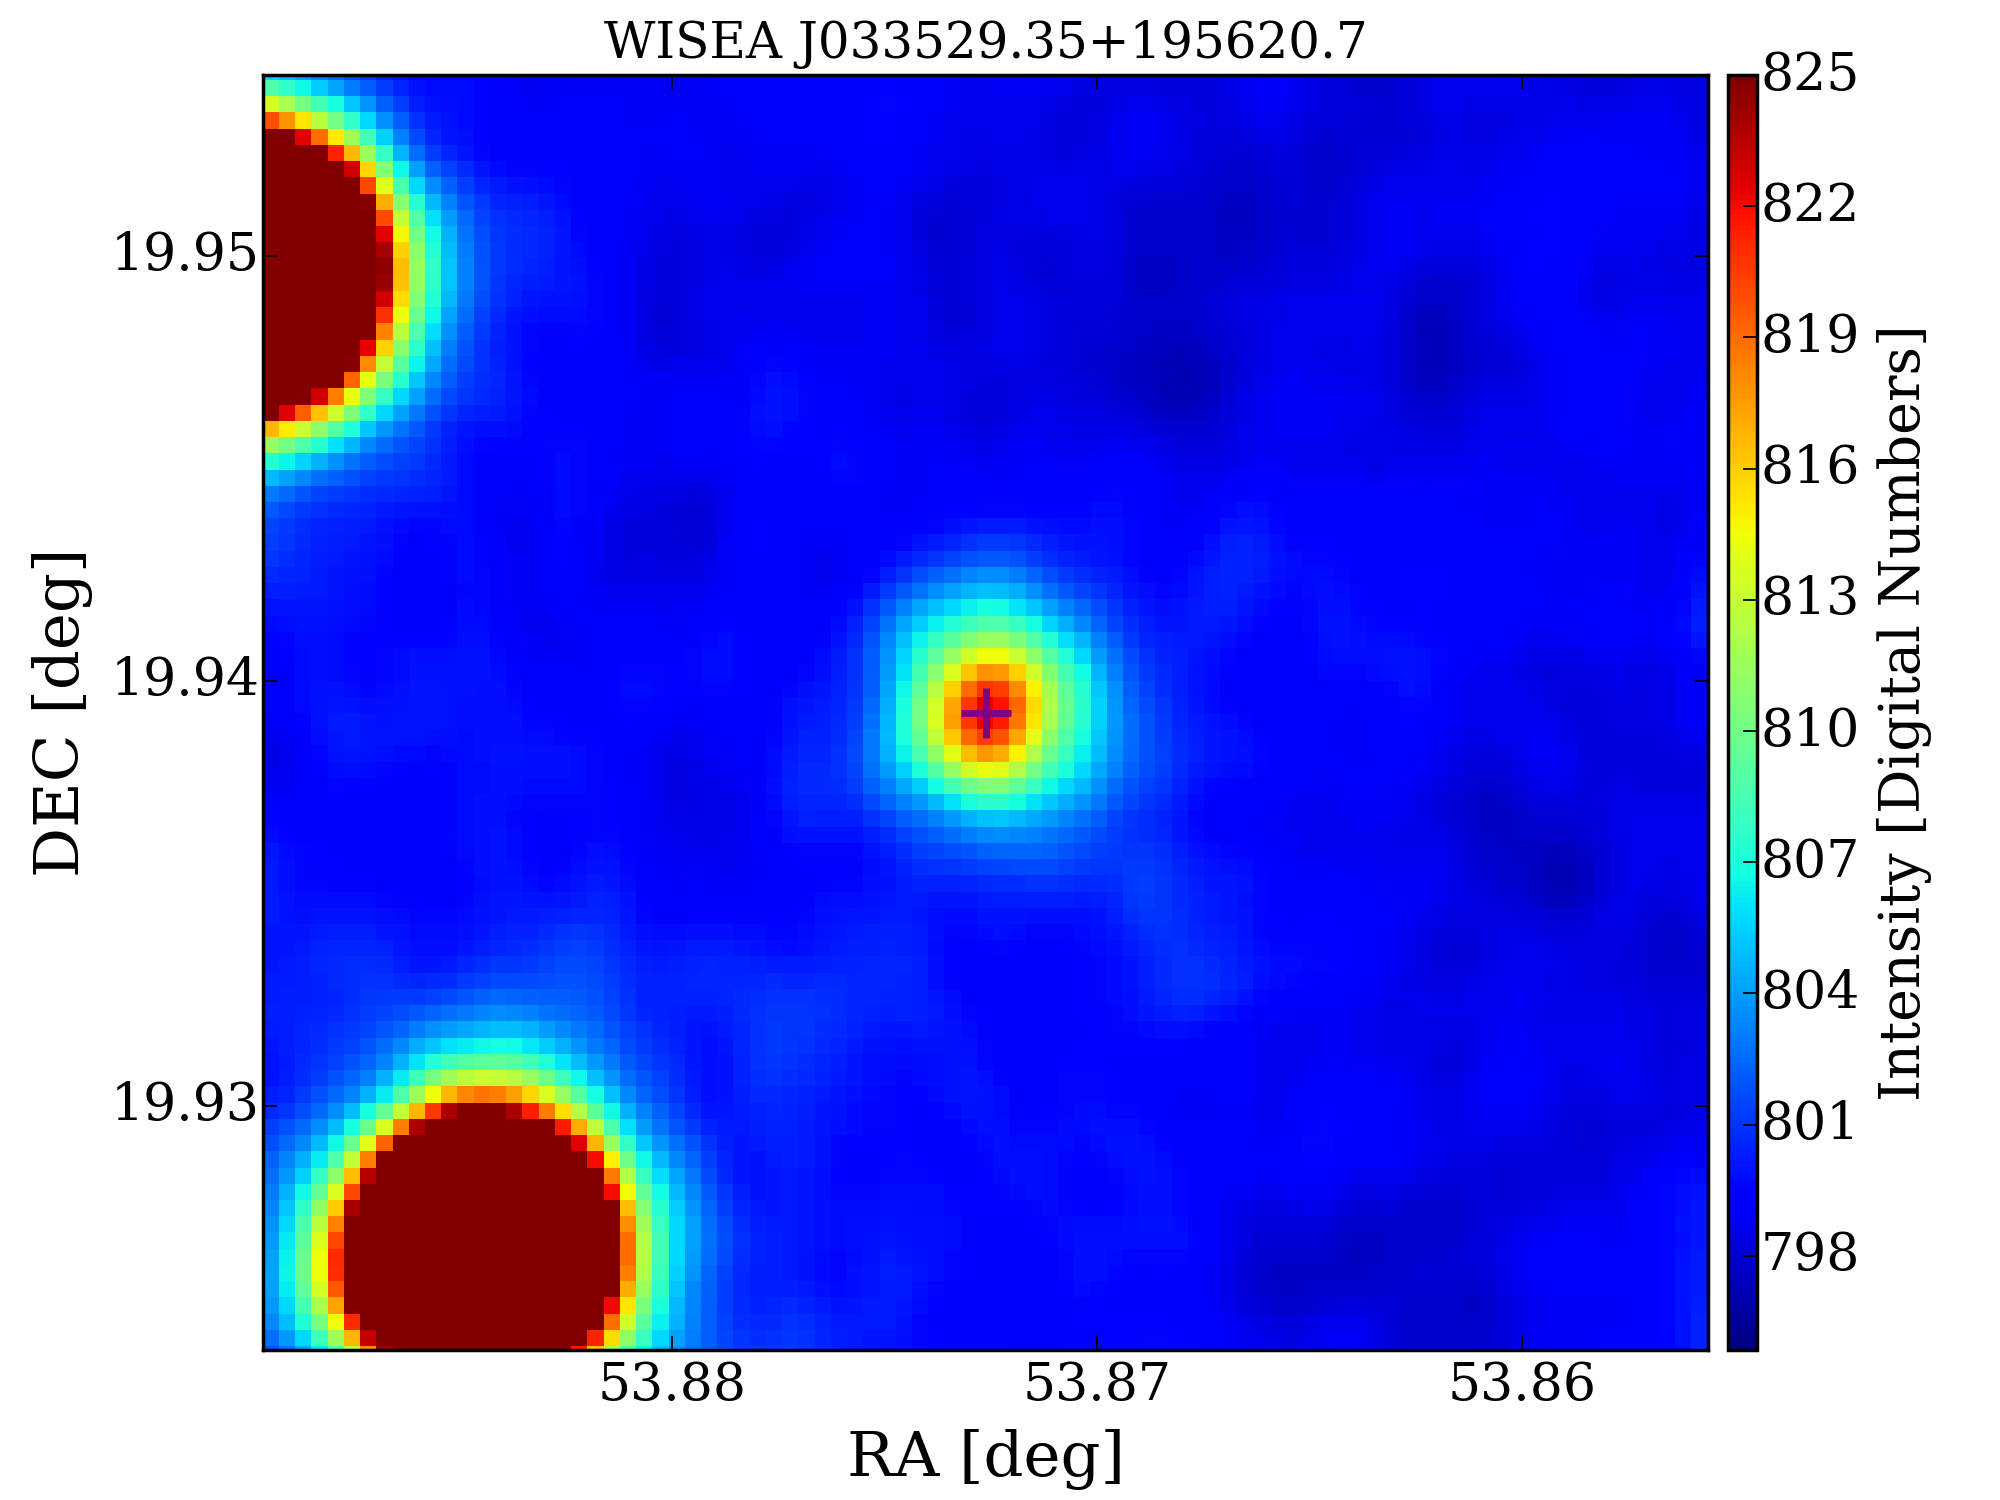
4.2.7 NVSS J033529+195621
NVSS J033529+195621 (Figure 19) is a radio source which is relatively little studied. Its infrared and radio signals have been observed by WISE and NVSS. The Hi absorption profile, characterized by its broad and symmetric nature, can be accurately modeled using a two-component Gaussian function.
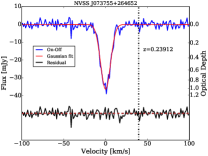
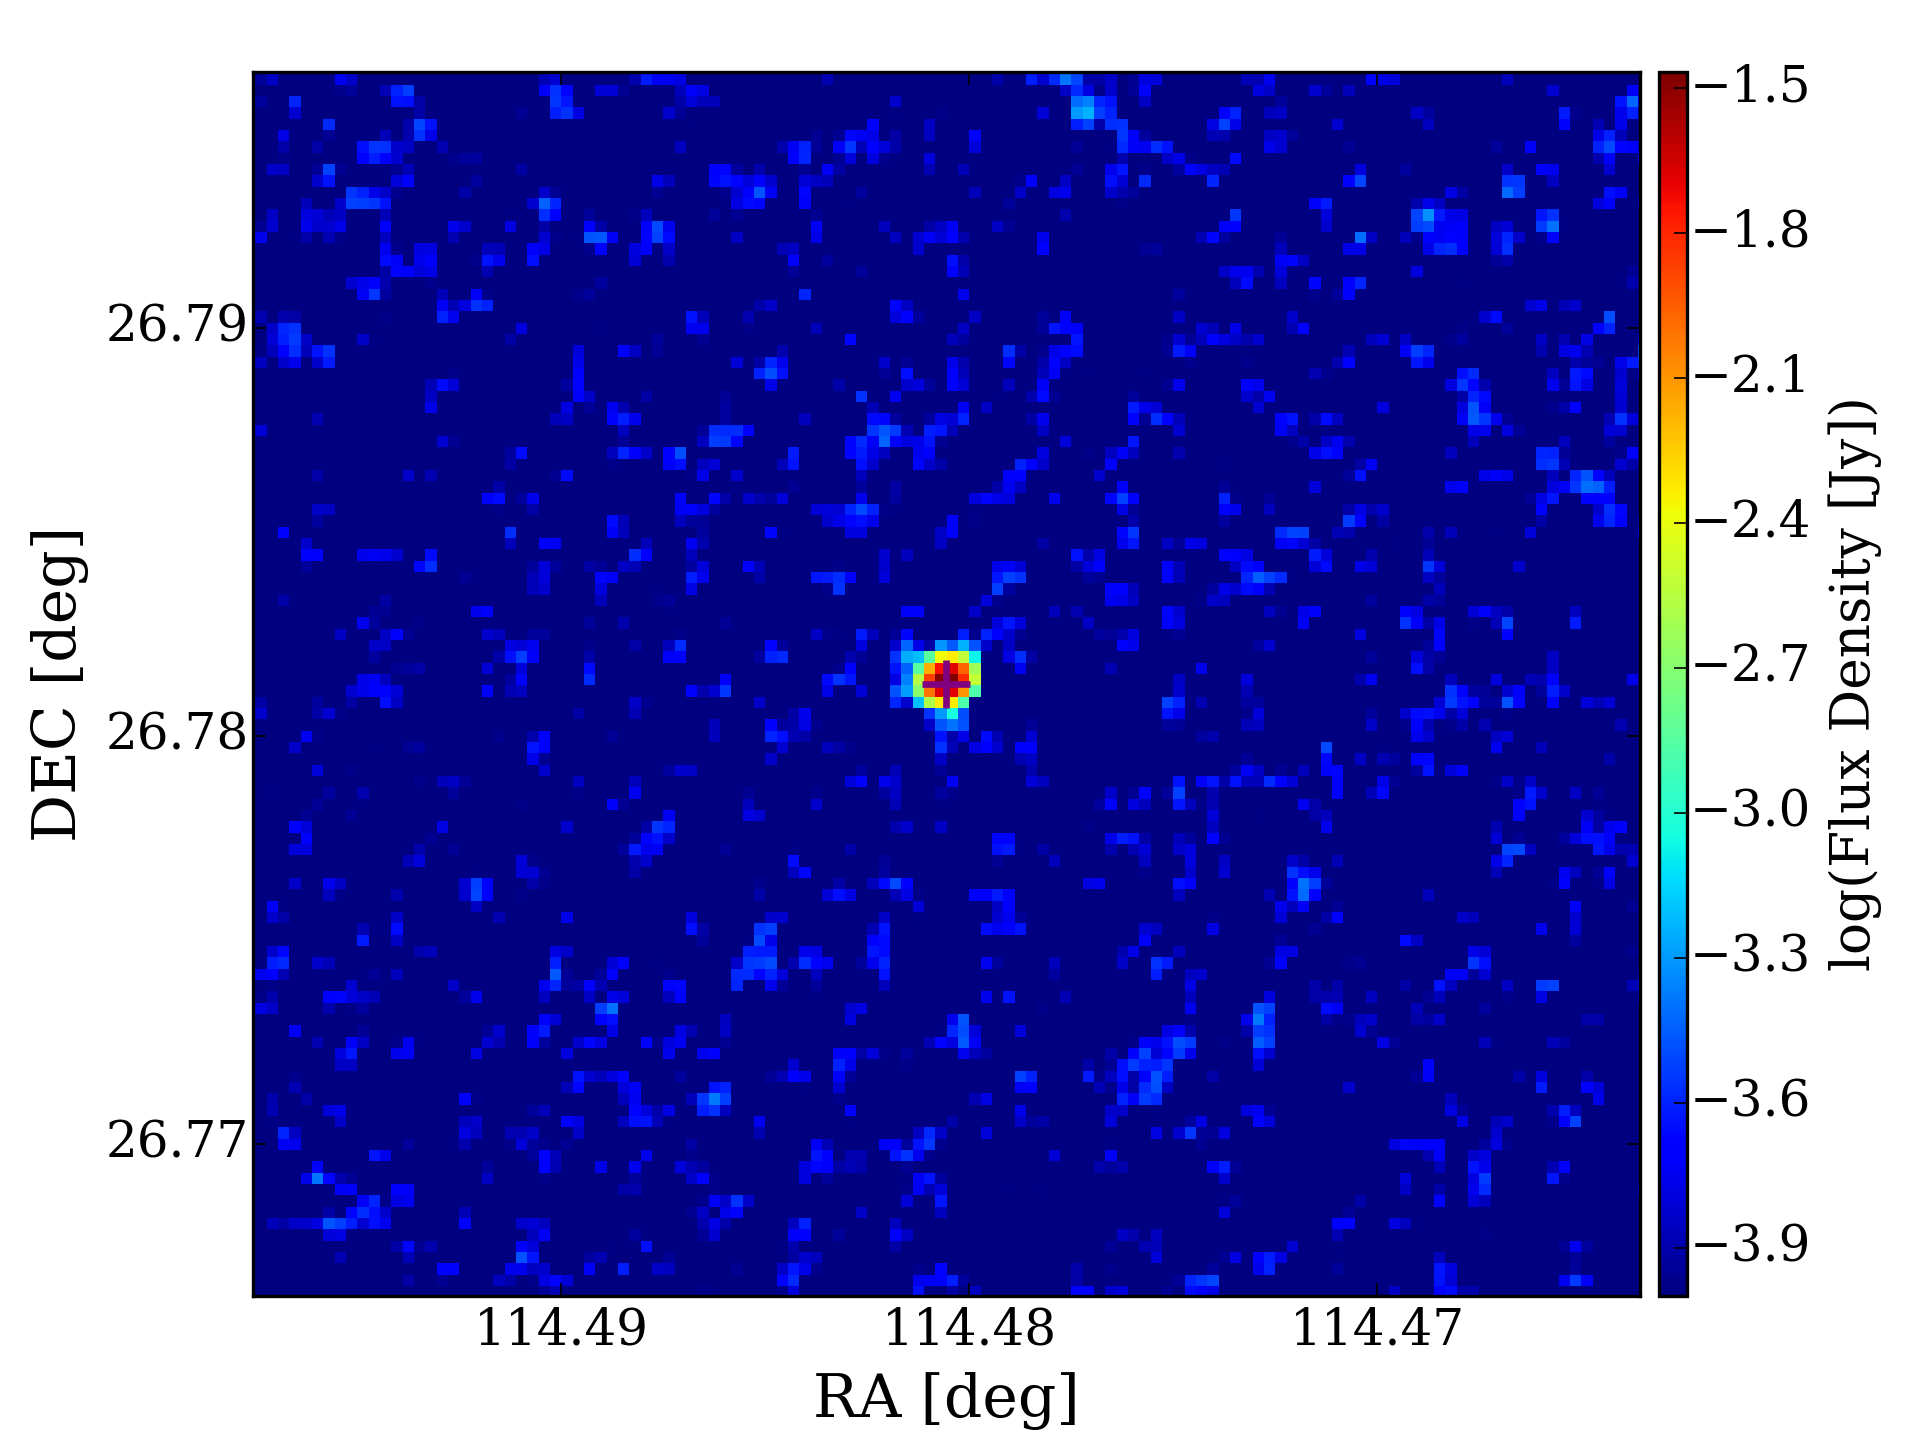
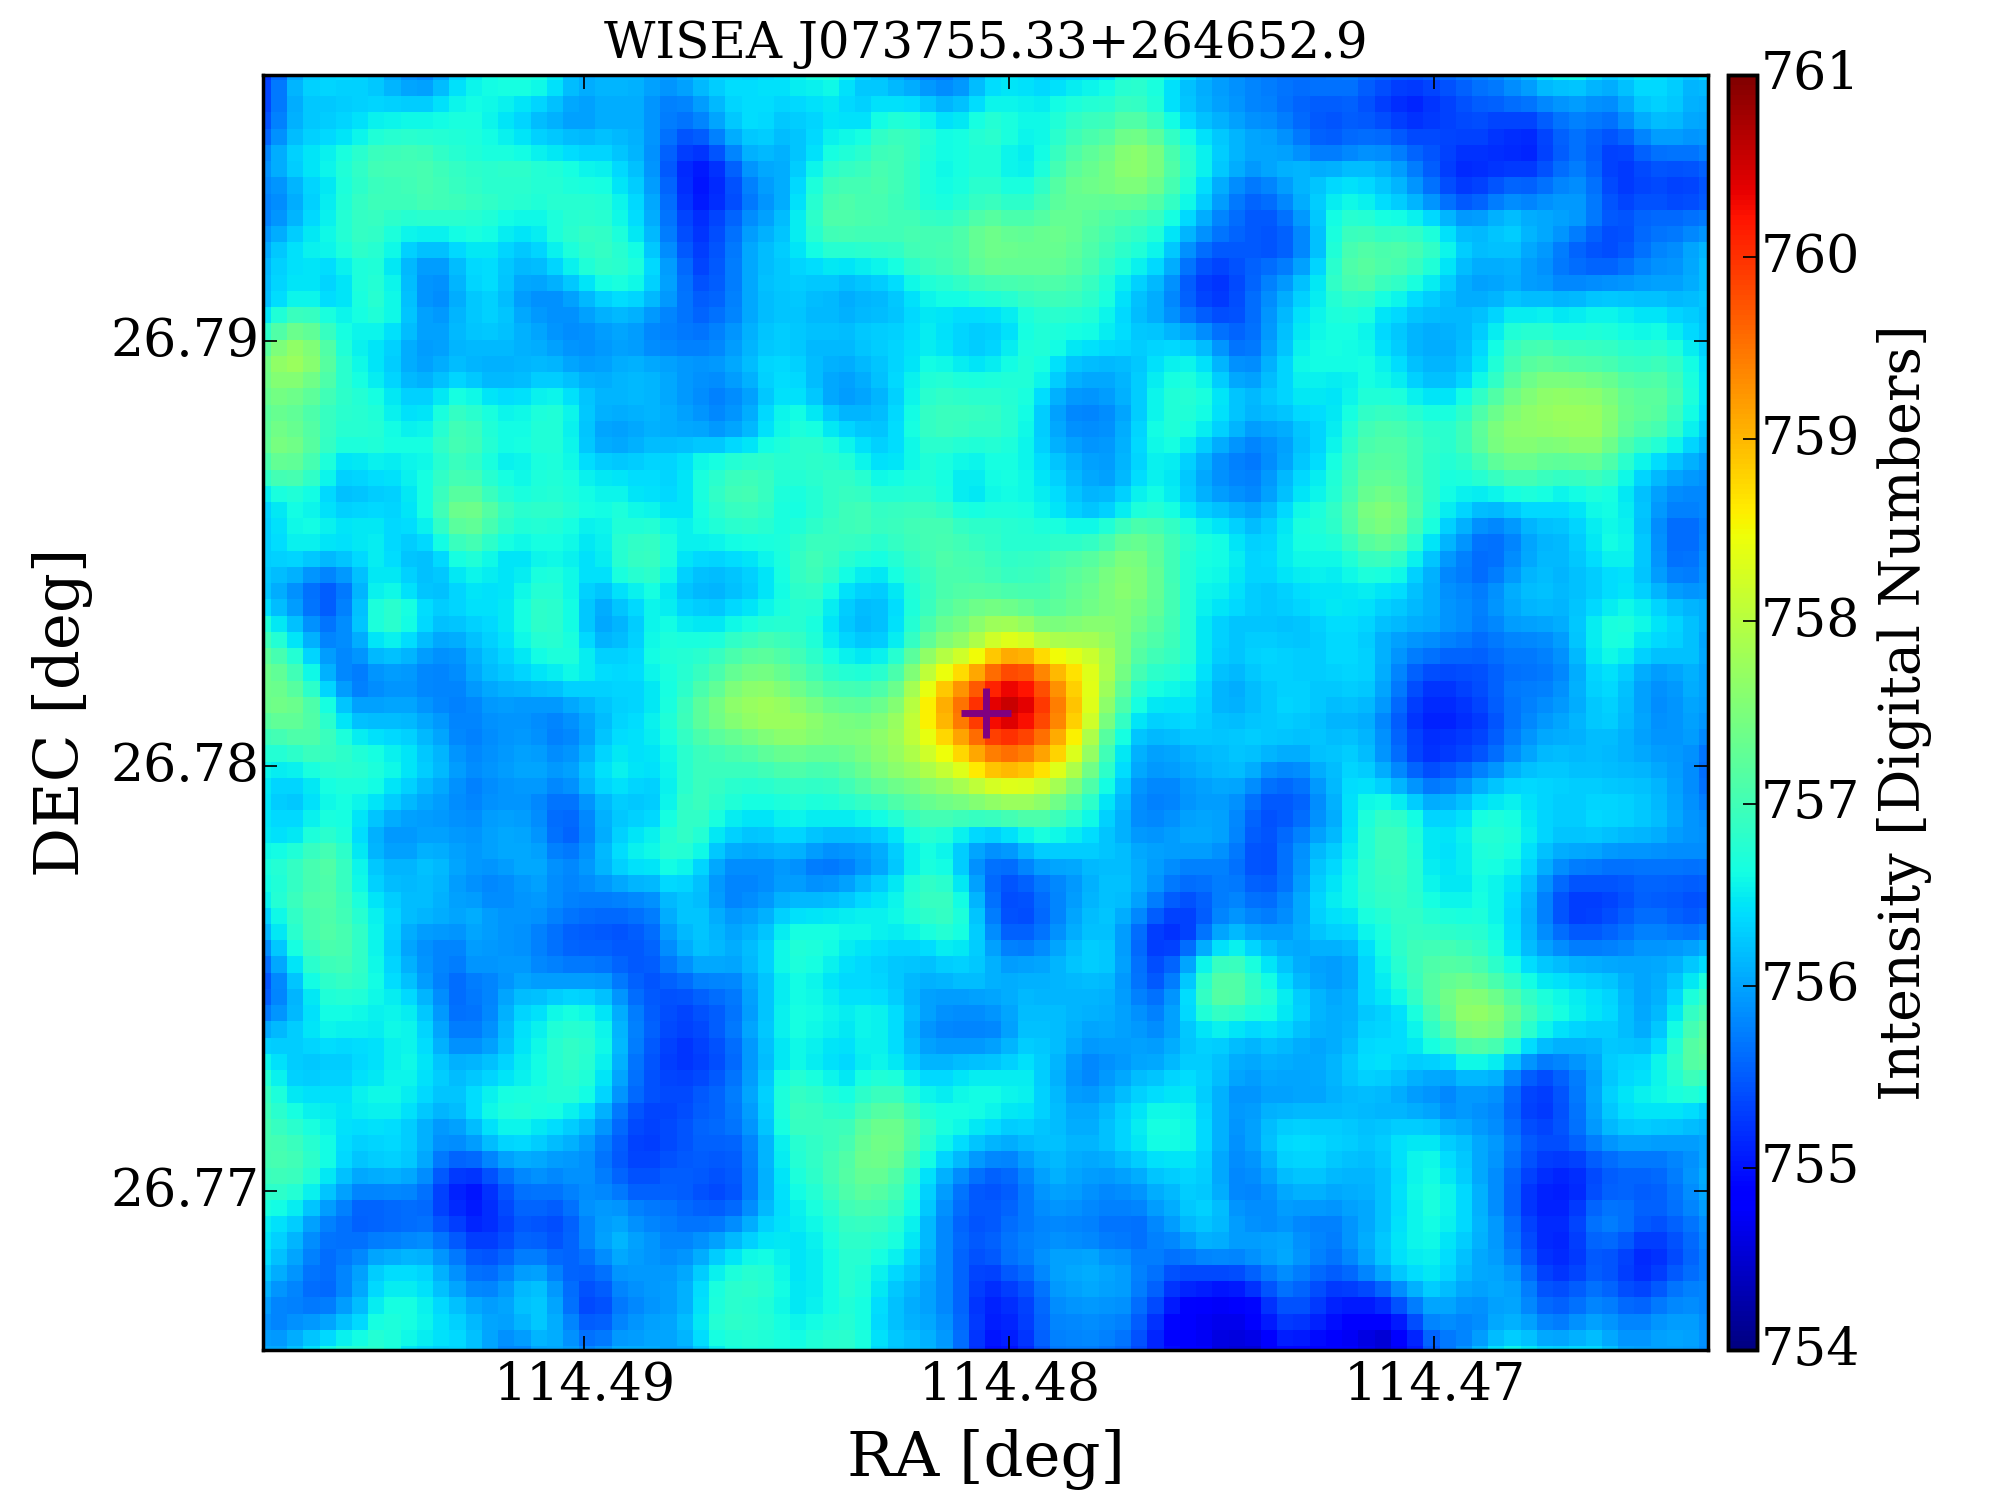
4.2.8 NVSS J073755+264652
NVSS J073755+264652 (Figure 20) is a blue radio galaxy that has been observed in ultraviolet (GALEX), optical (SDSS), infrared (WISE and 2MASS) and radio band (NVSS). The Hi absorption profile demonstrates straightforward symmetry and can be precisely represented by a one-component Gaussian function. This suggests the existence of a settled system with a gas disk.
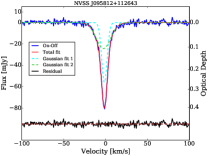
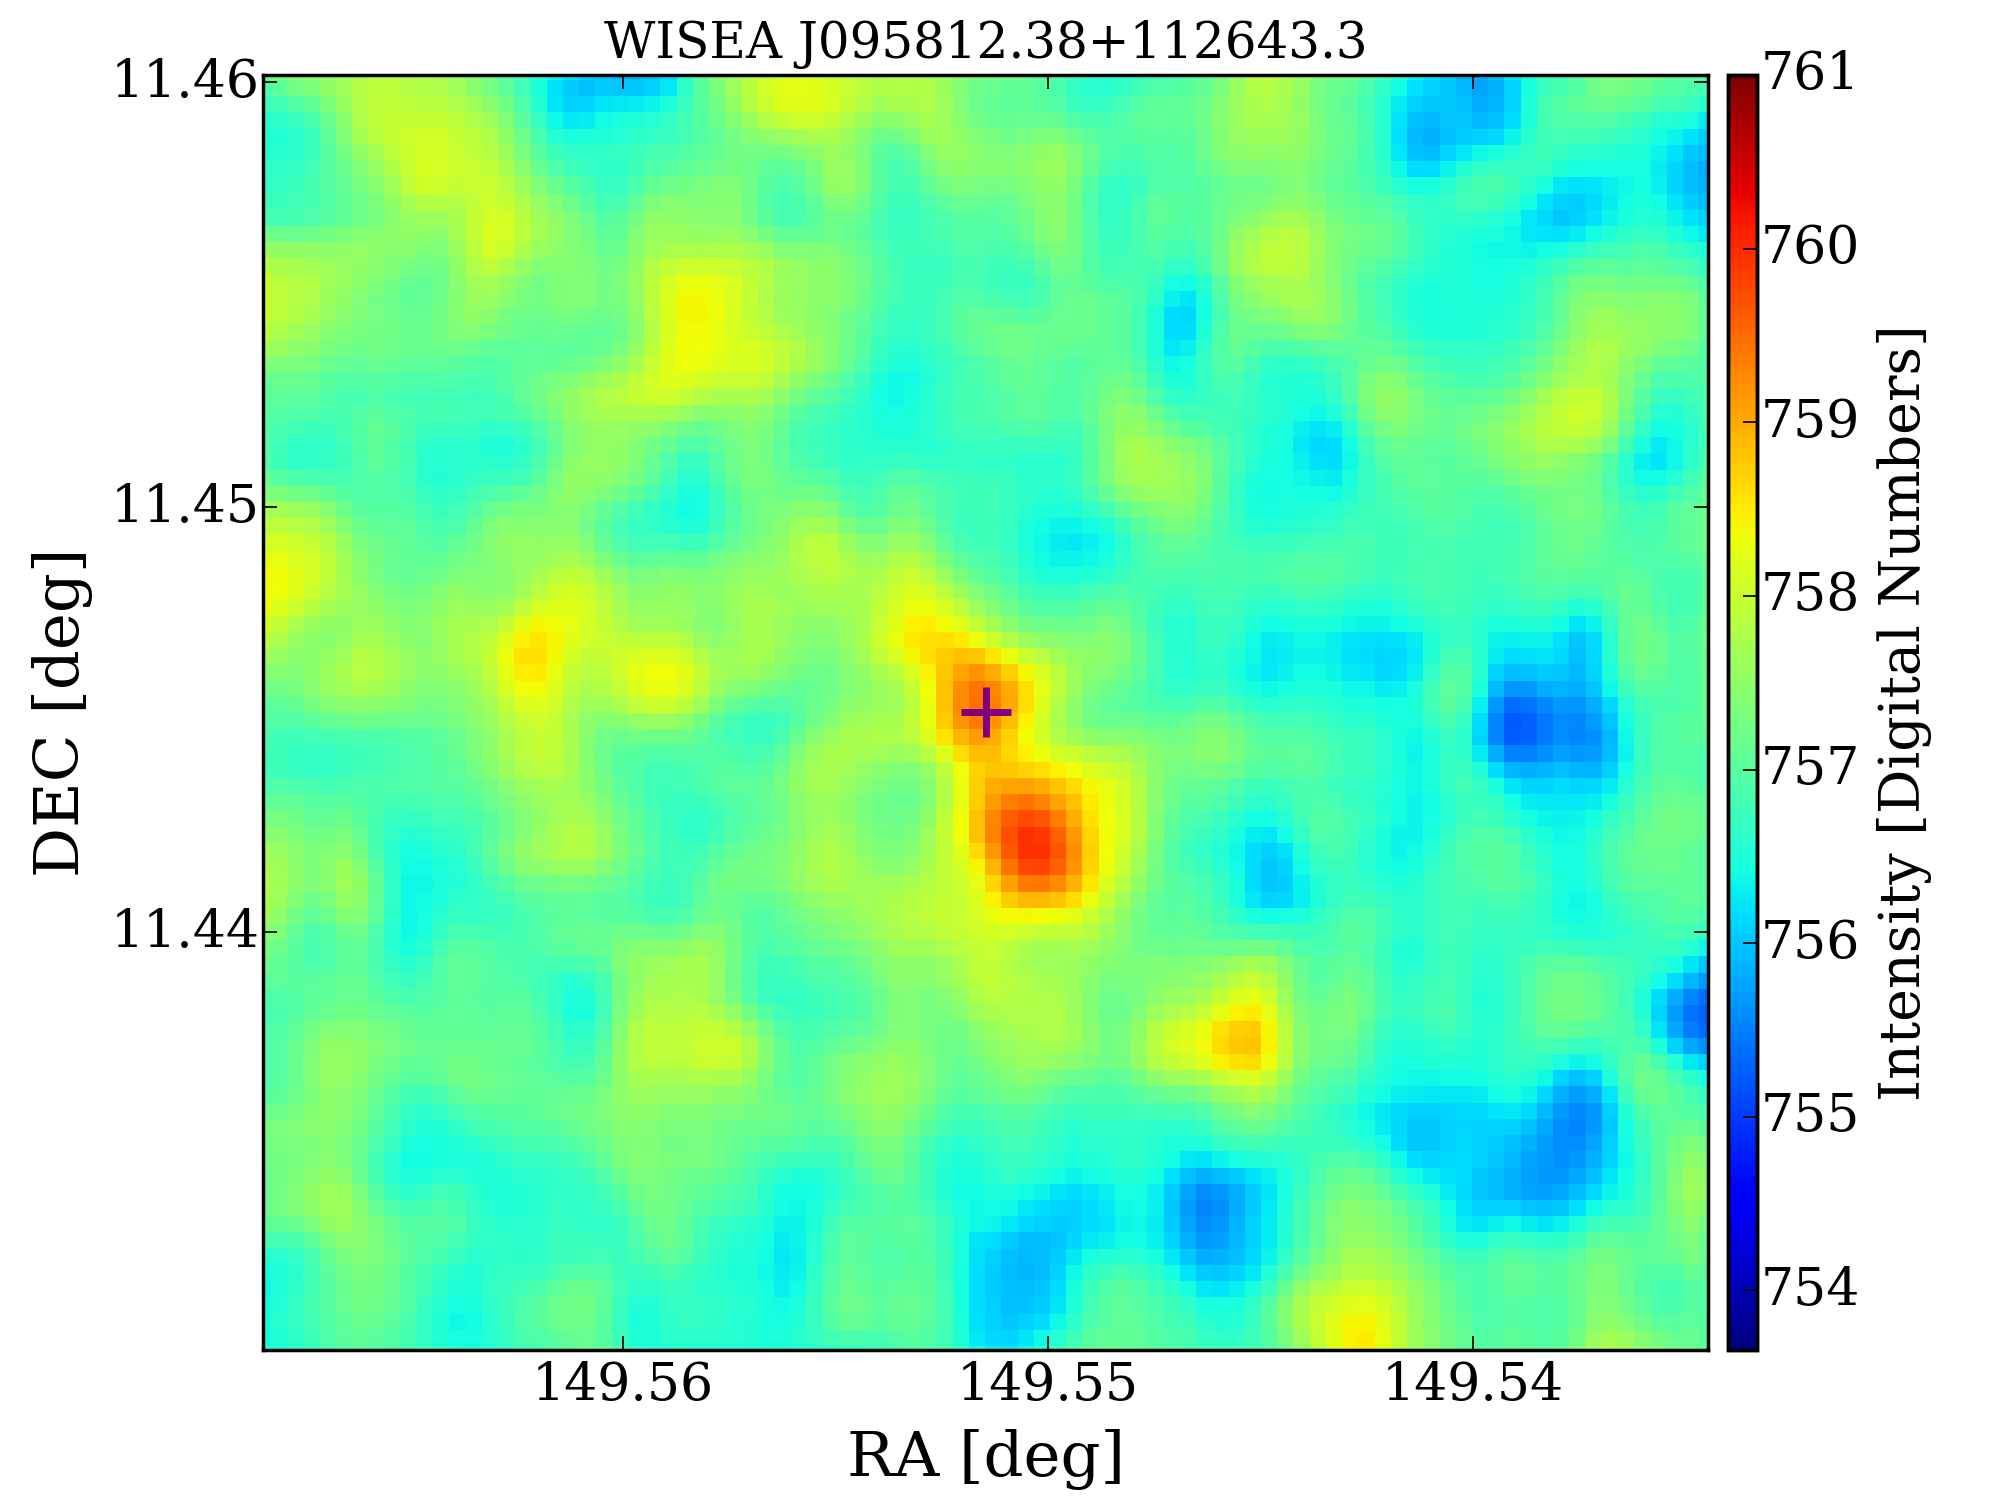
4.2.9 NVSS J095812+112643
NVSS J095812+112643 (Figure 21) is a radio galaxy that has been observed in optical (SDSS), infrared (WISE) and radio band (NVSS, VLSS, and Texas (Douglas et al., 1996)). The lack of precise redshift information for NVSS J095812+112643 gives rise to uncertainty regarding its status in the foreground or background. The Hi absorption profile observed in this system displays a slim and symmetrical shape, indicating the likely presence of a gas disk.
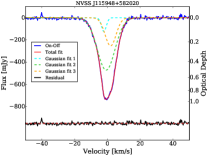
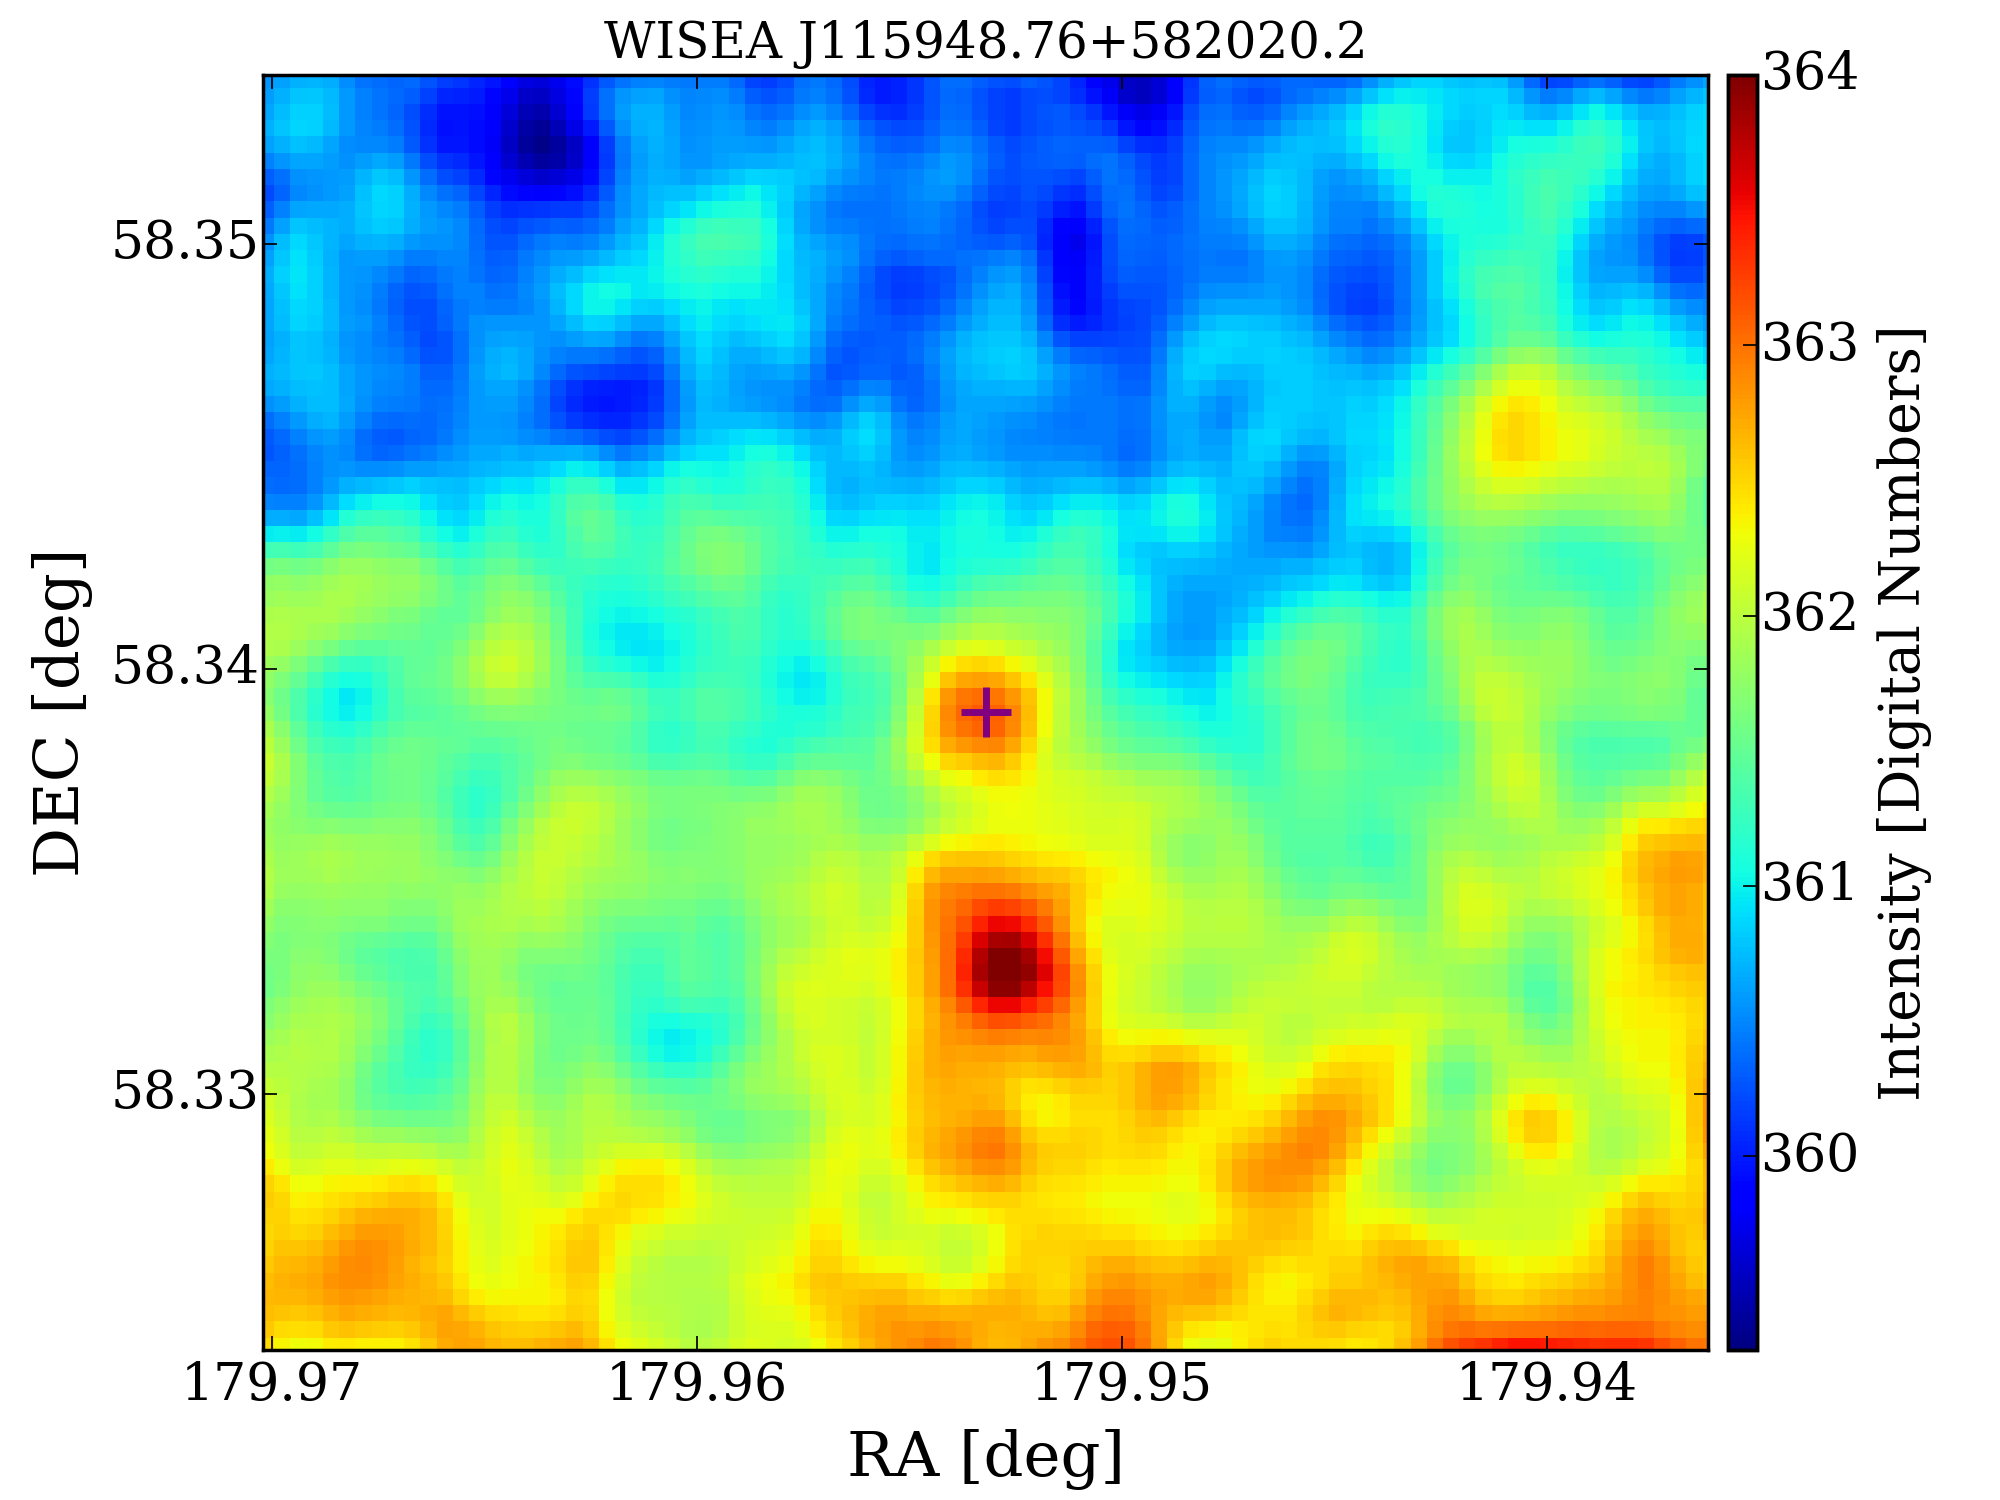
4.2.10 NVSS J115948+582020
NVSS J115948+582020 (Figure 22) is a quasar located at z=0.629 and has been observed in optical (eBOSS), infrared (WISE), and radio bands (NVSS, VLBA and Texas Survey). The Hi absorption signal in this intervening system is robust, displaying an almost symmetrical shape that can be effectively modeled using a three-component Gaussian function.
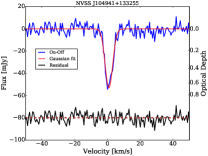
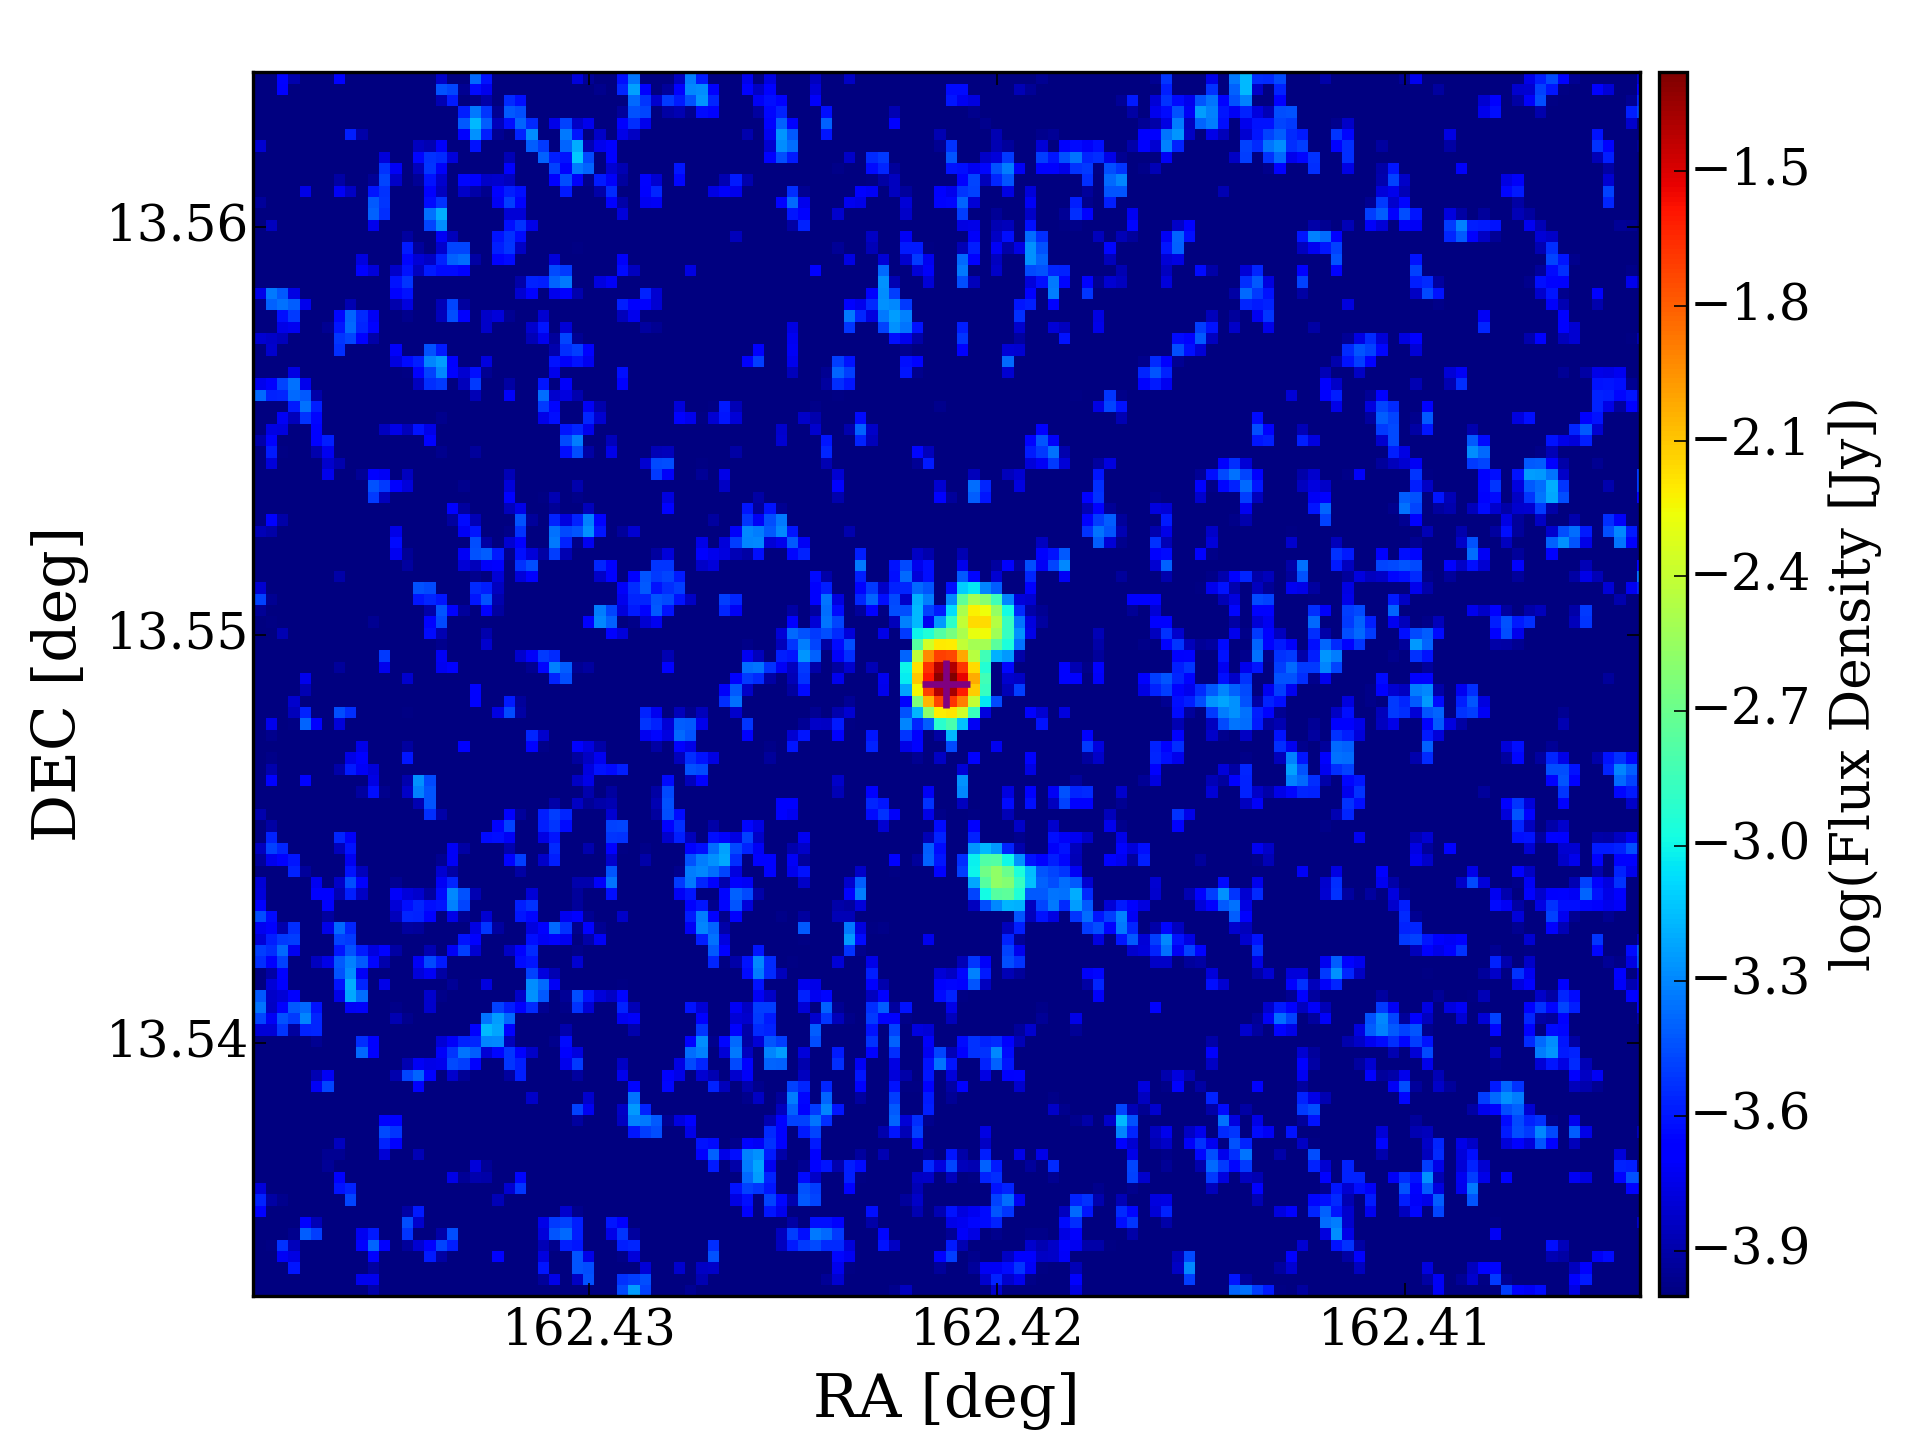
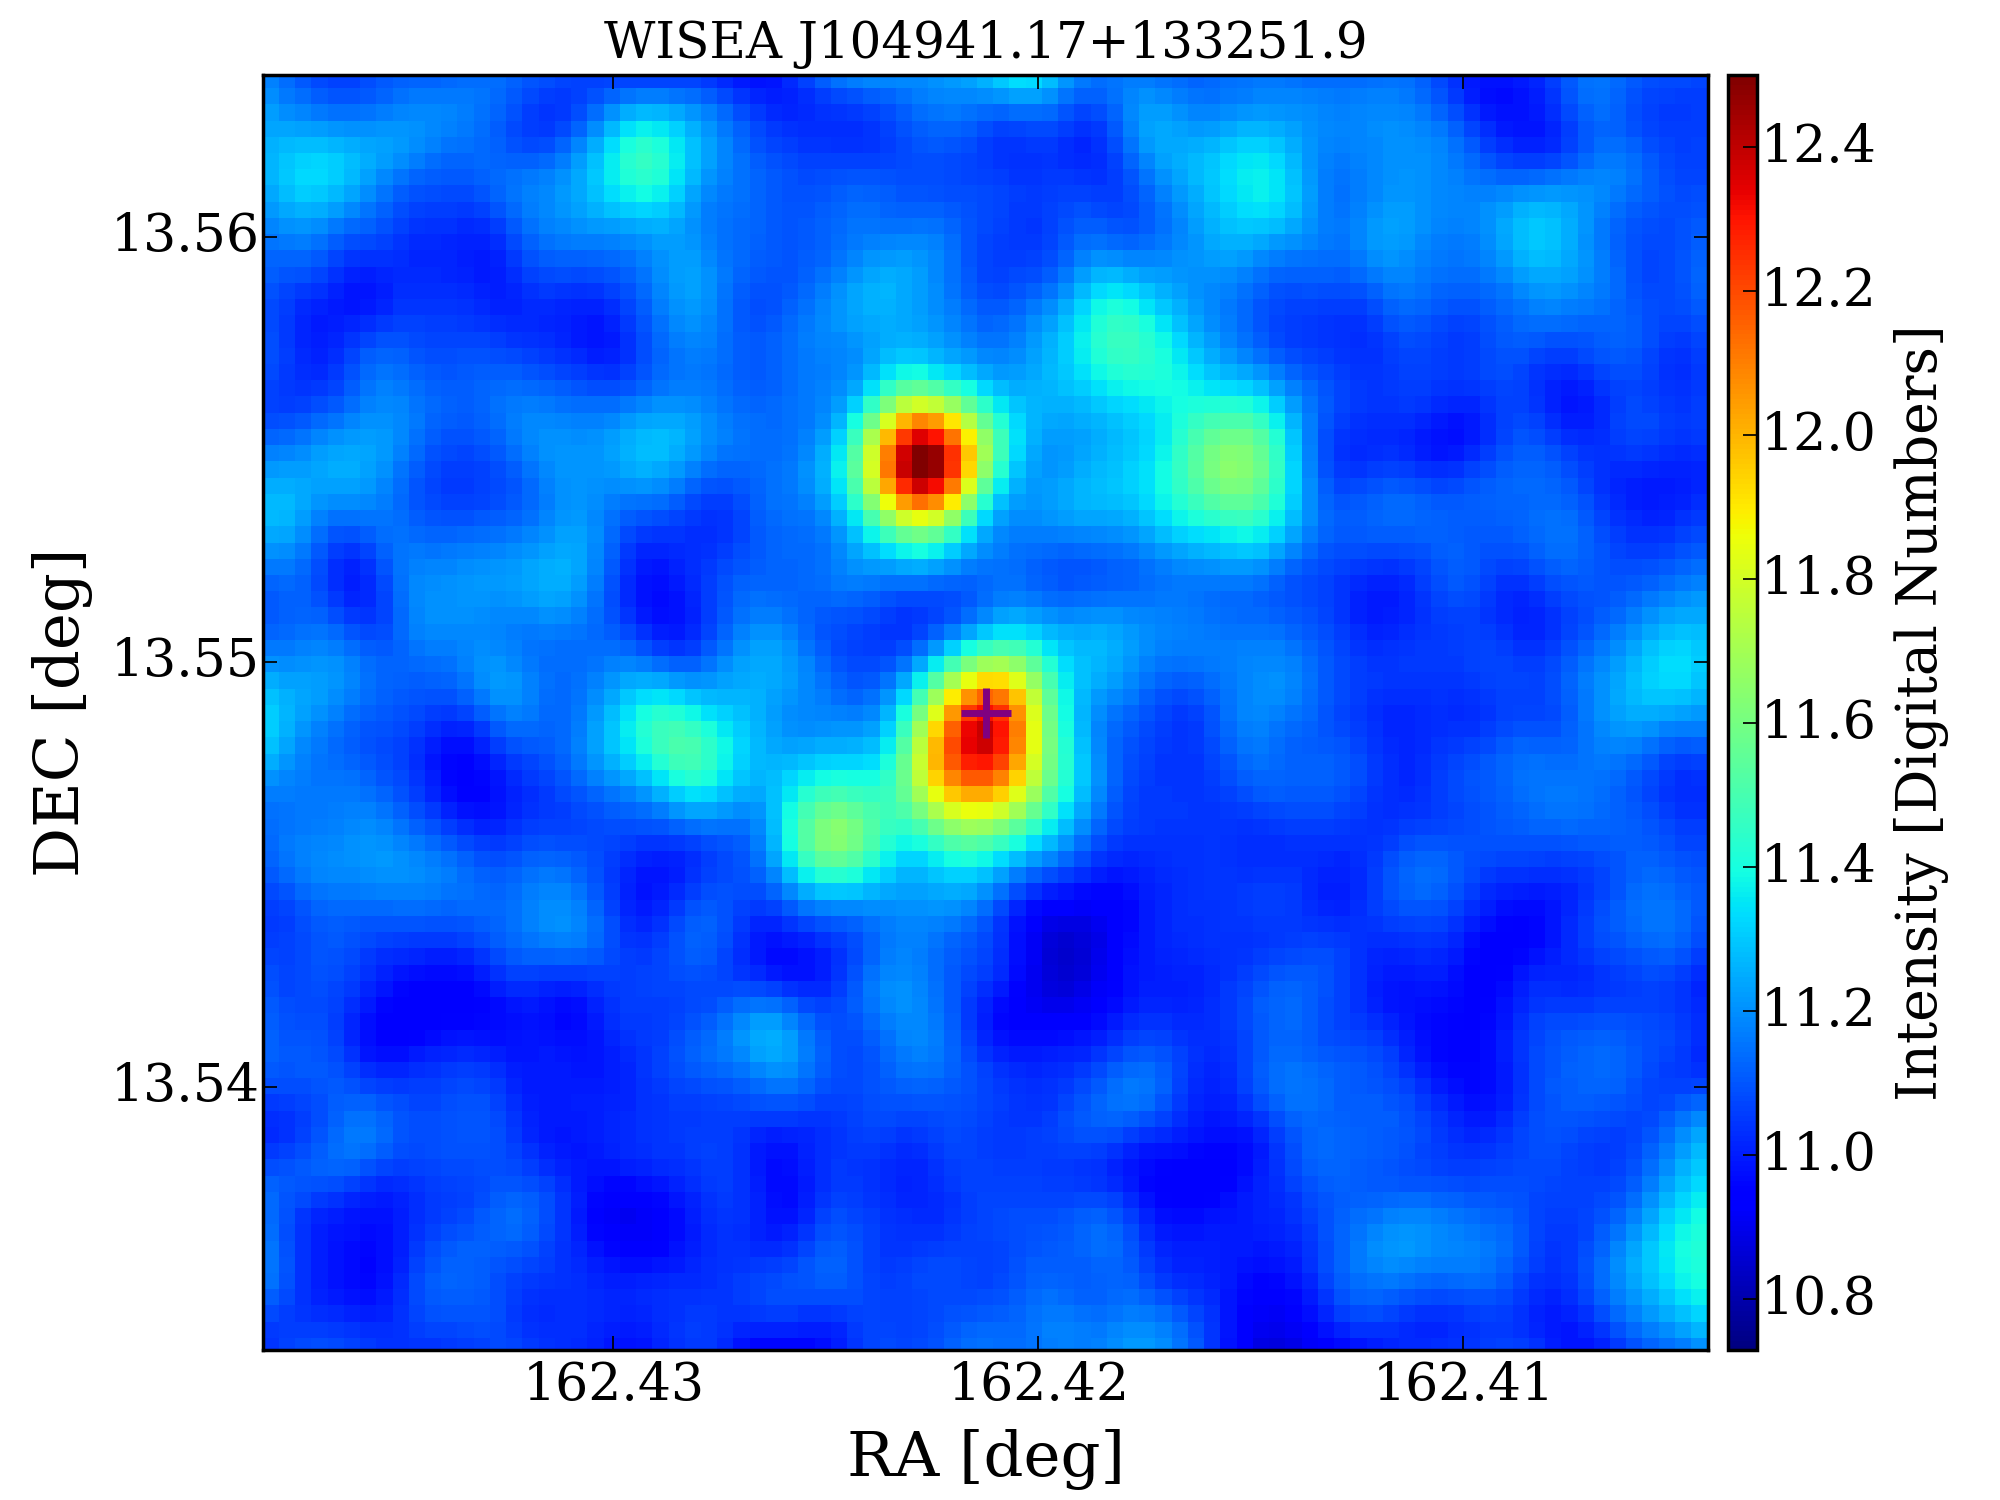
4.2.11 NVSS J104941+133255
NVSS J104941+133255 (Figure 23) is a quasar located at a redshift of 2.764, it has been observed in optical and Ultraviolet (SDSS), and radio bands (NVSS and Texas Survey). The foreground object remains ambiguous and requires a thorough high-resolution follow-up observation for confirmation. The Hi absorption profile exhibits symmetry and can be accurately modeled using a one-component Gaussian function.
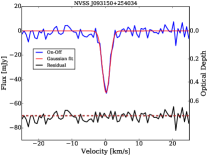
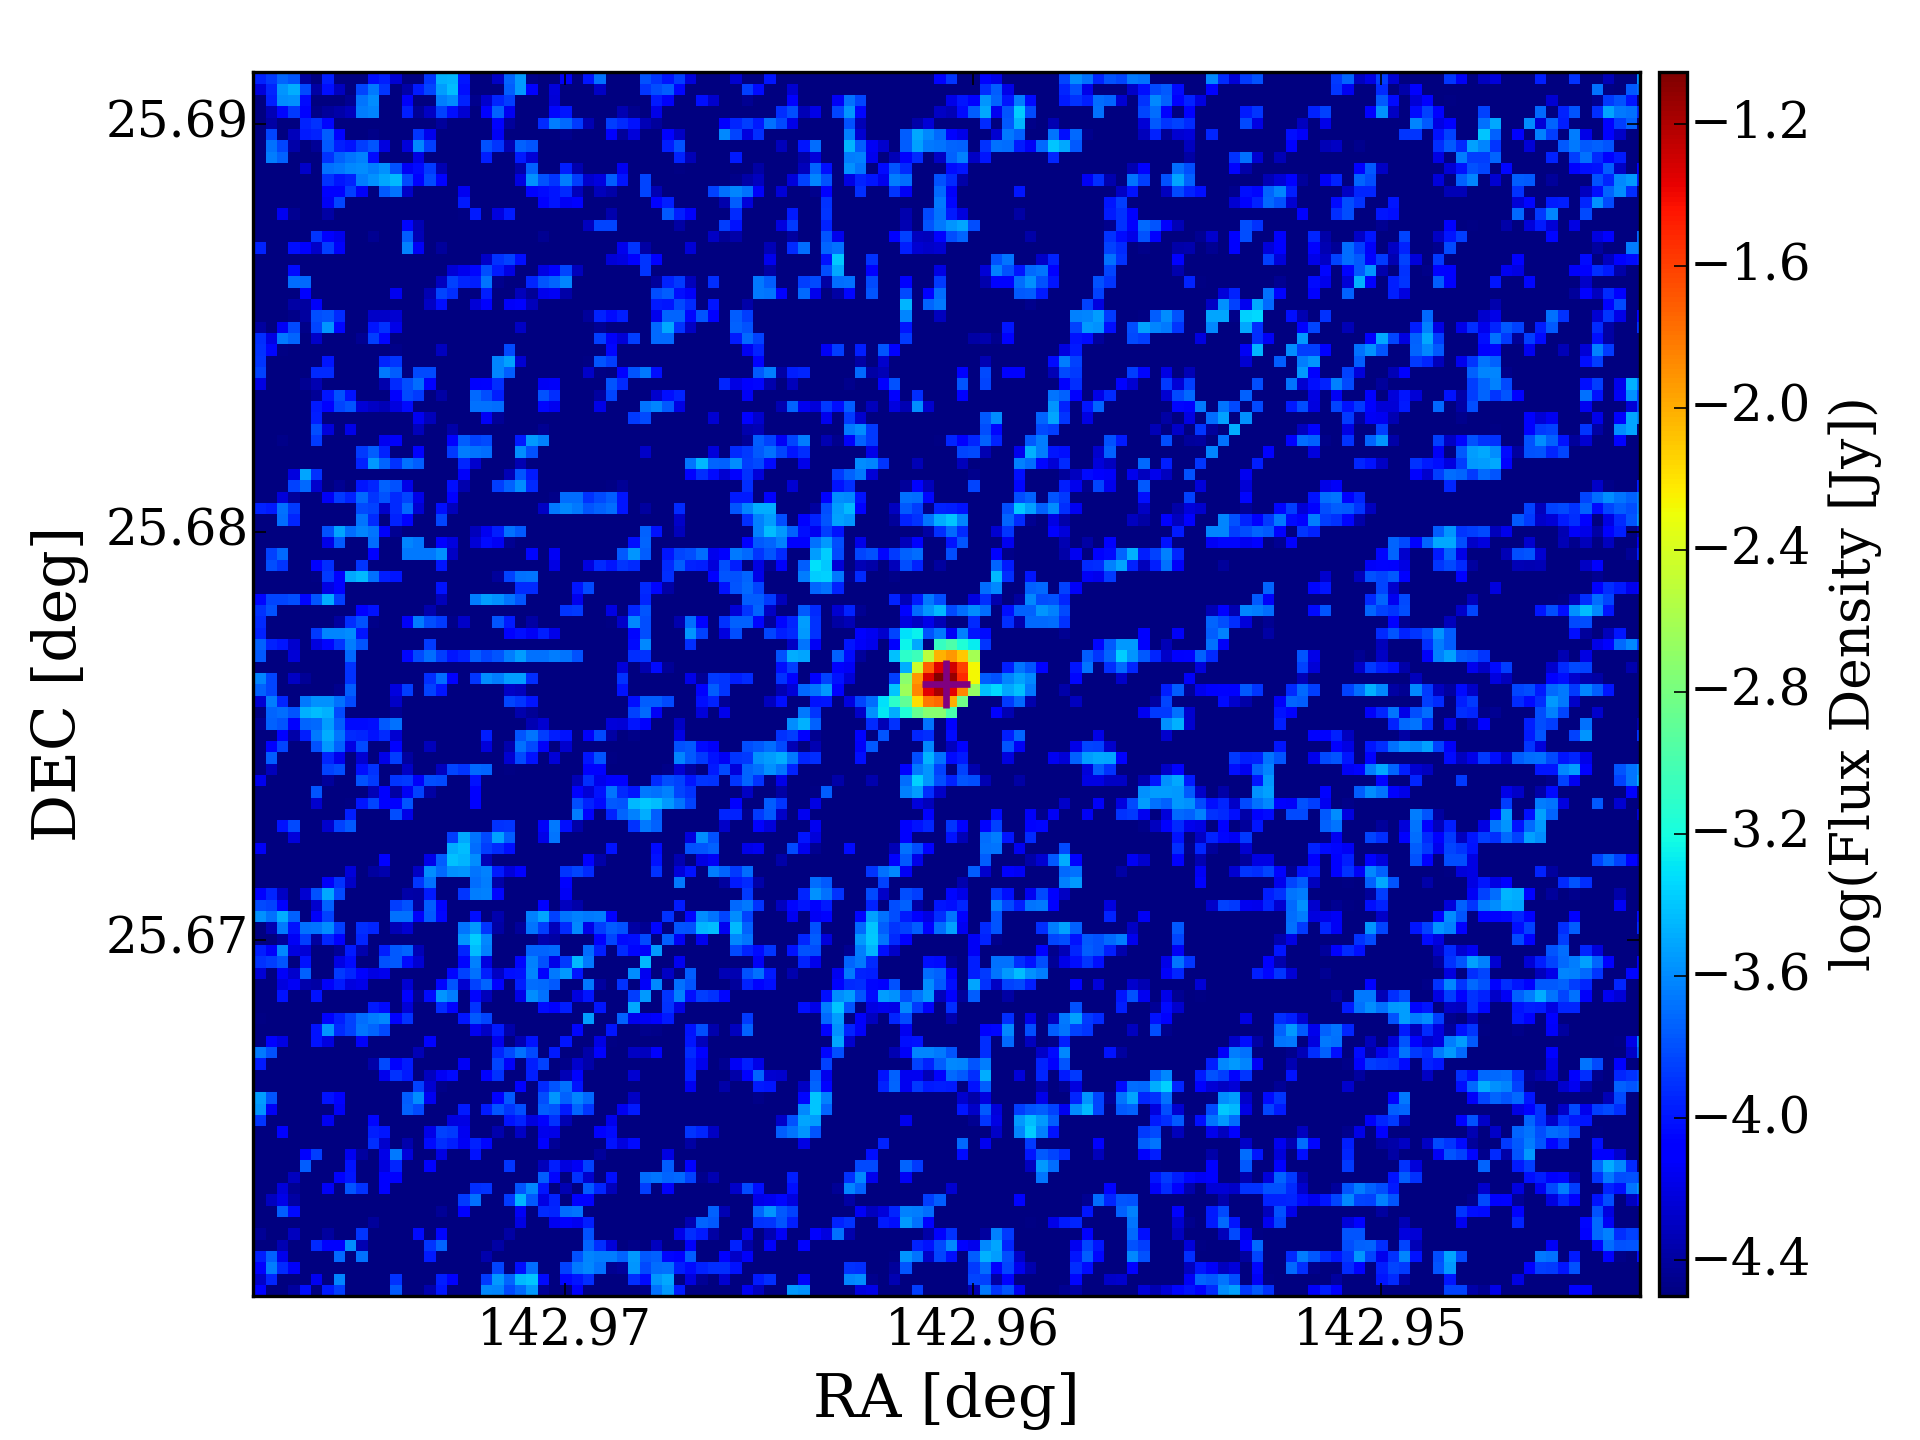
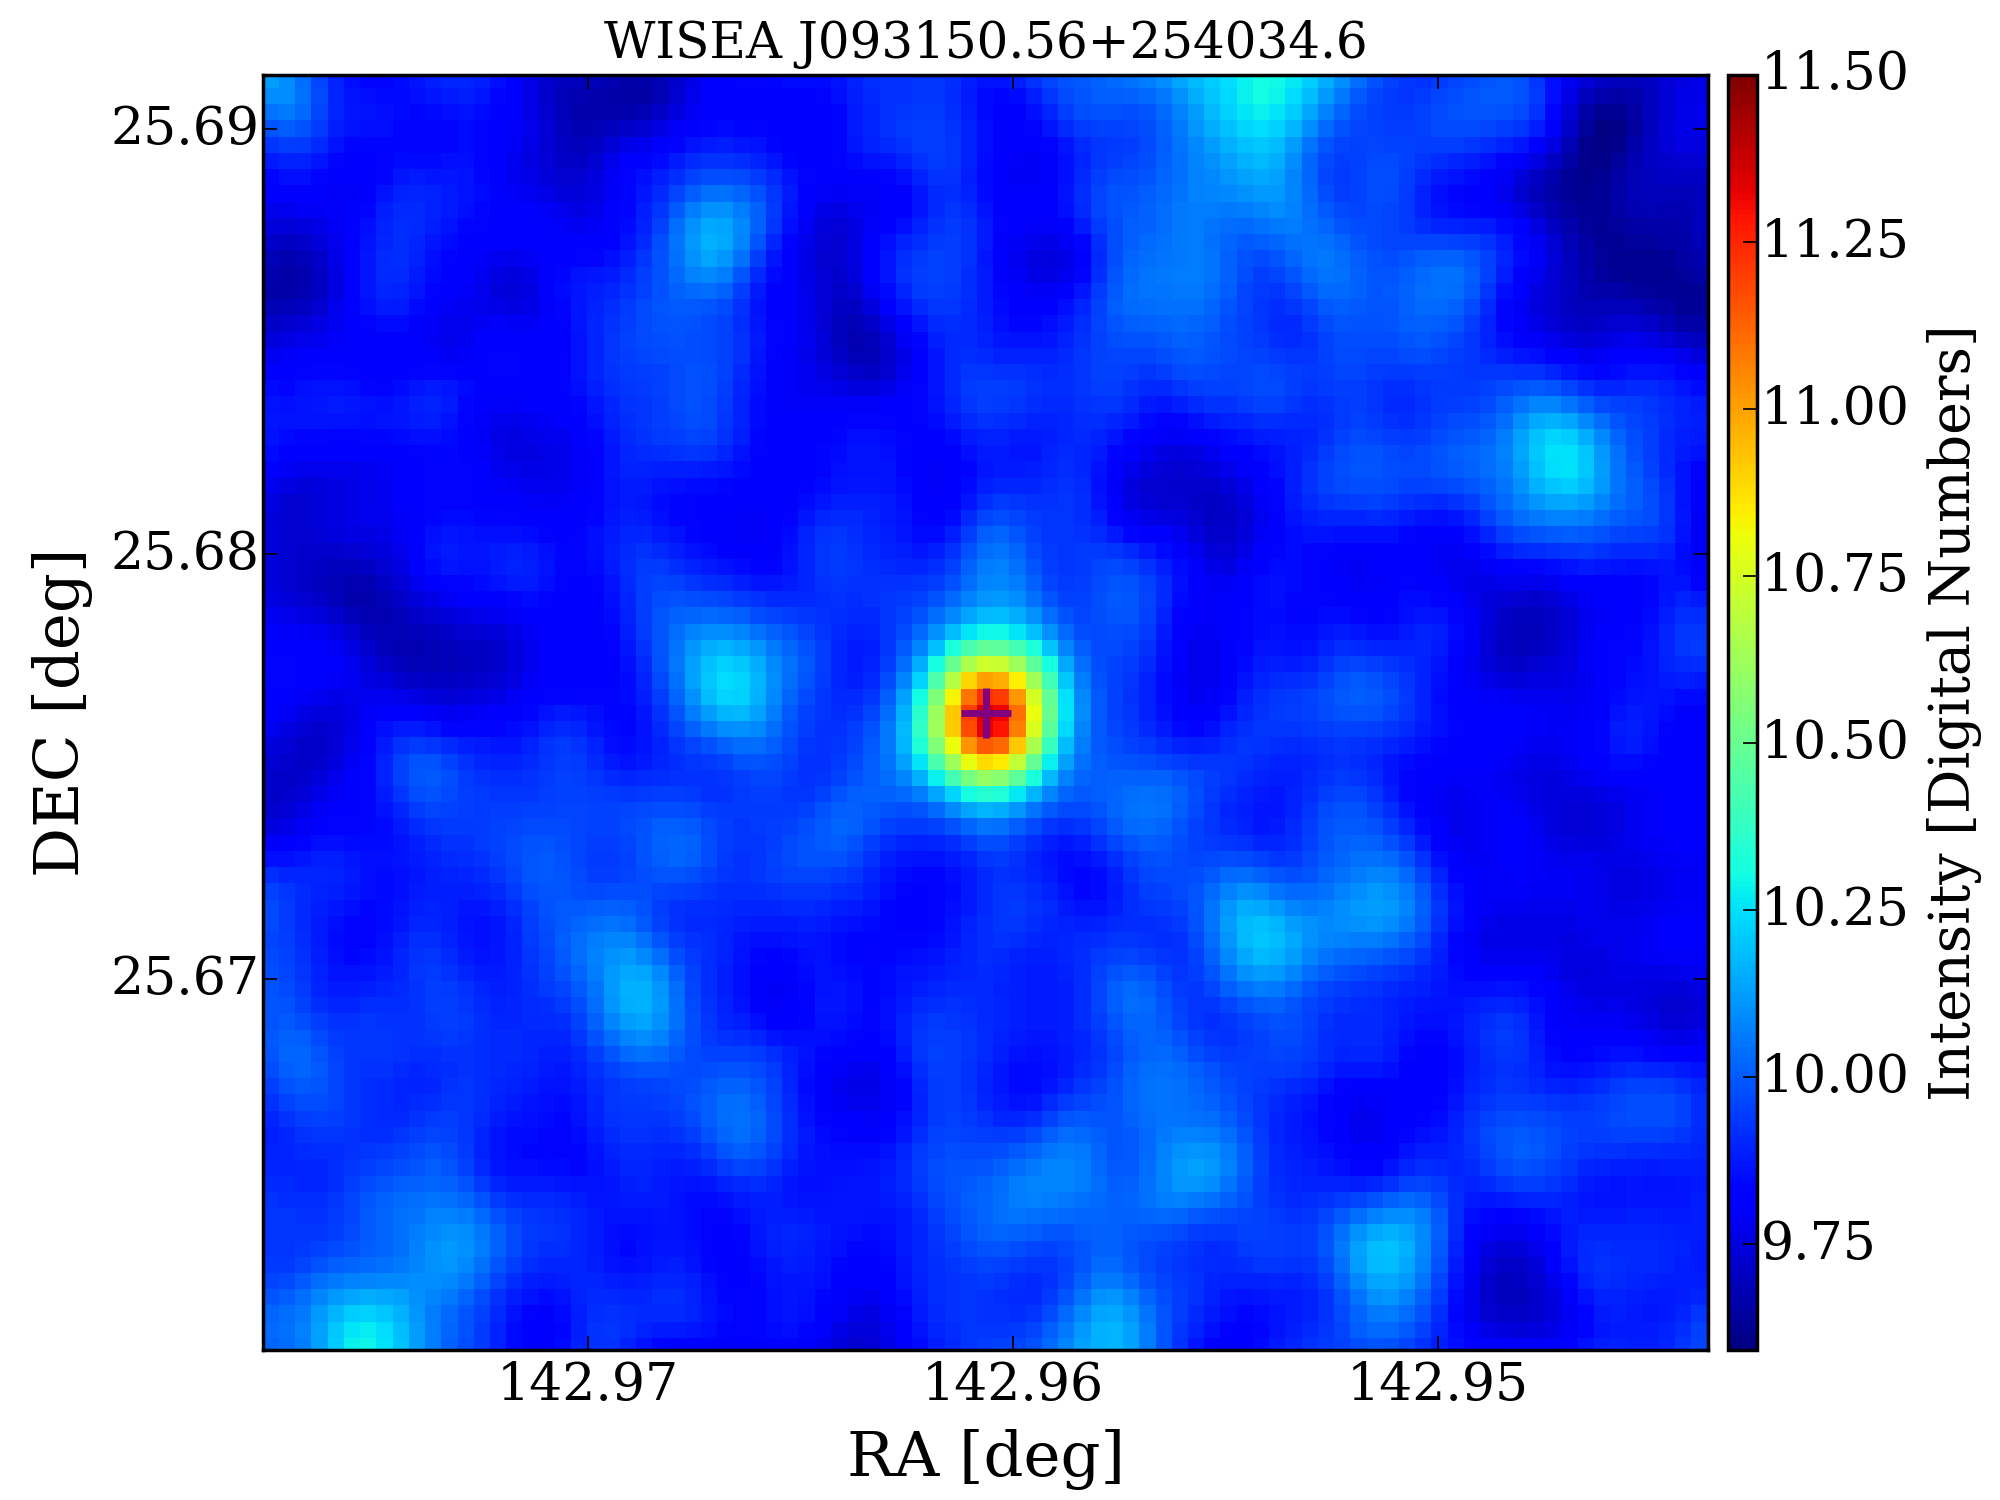
4.2.12 NVSS J093150+254034
NVSS J093150+254034 (Figure 24) is a galaxy located at a redshift of 0.812, which has been observed in infrared (WISE) and radio bands (NVSS). The counterpart to the foreground is currently uncertain. The Hi absorption profile from this intervening system exhibits a slender and symmetrical shape, suggesting the presence of a gas disk.
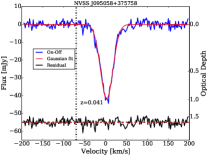
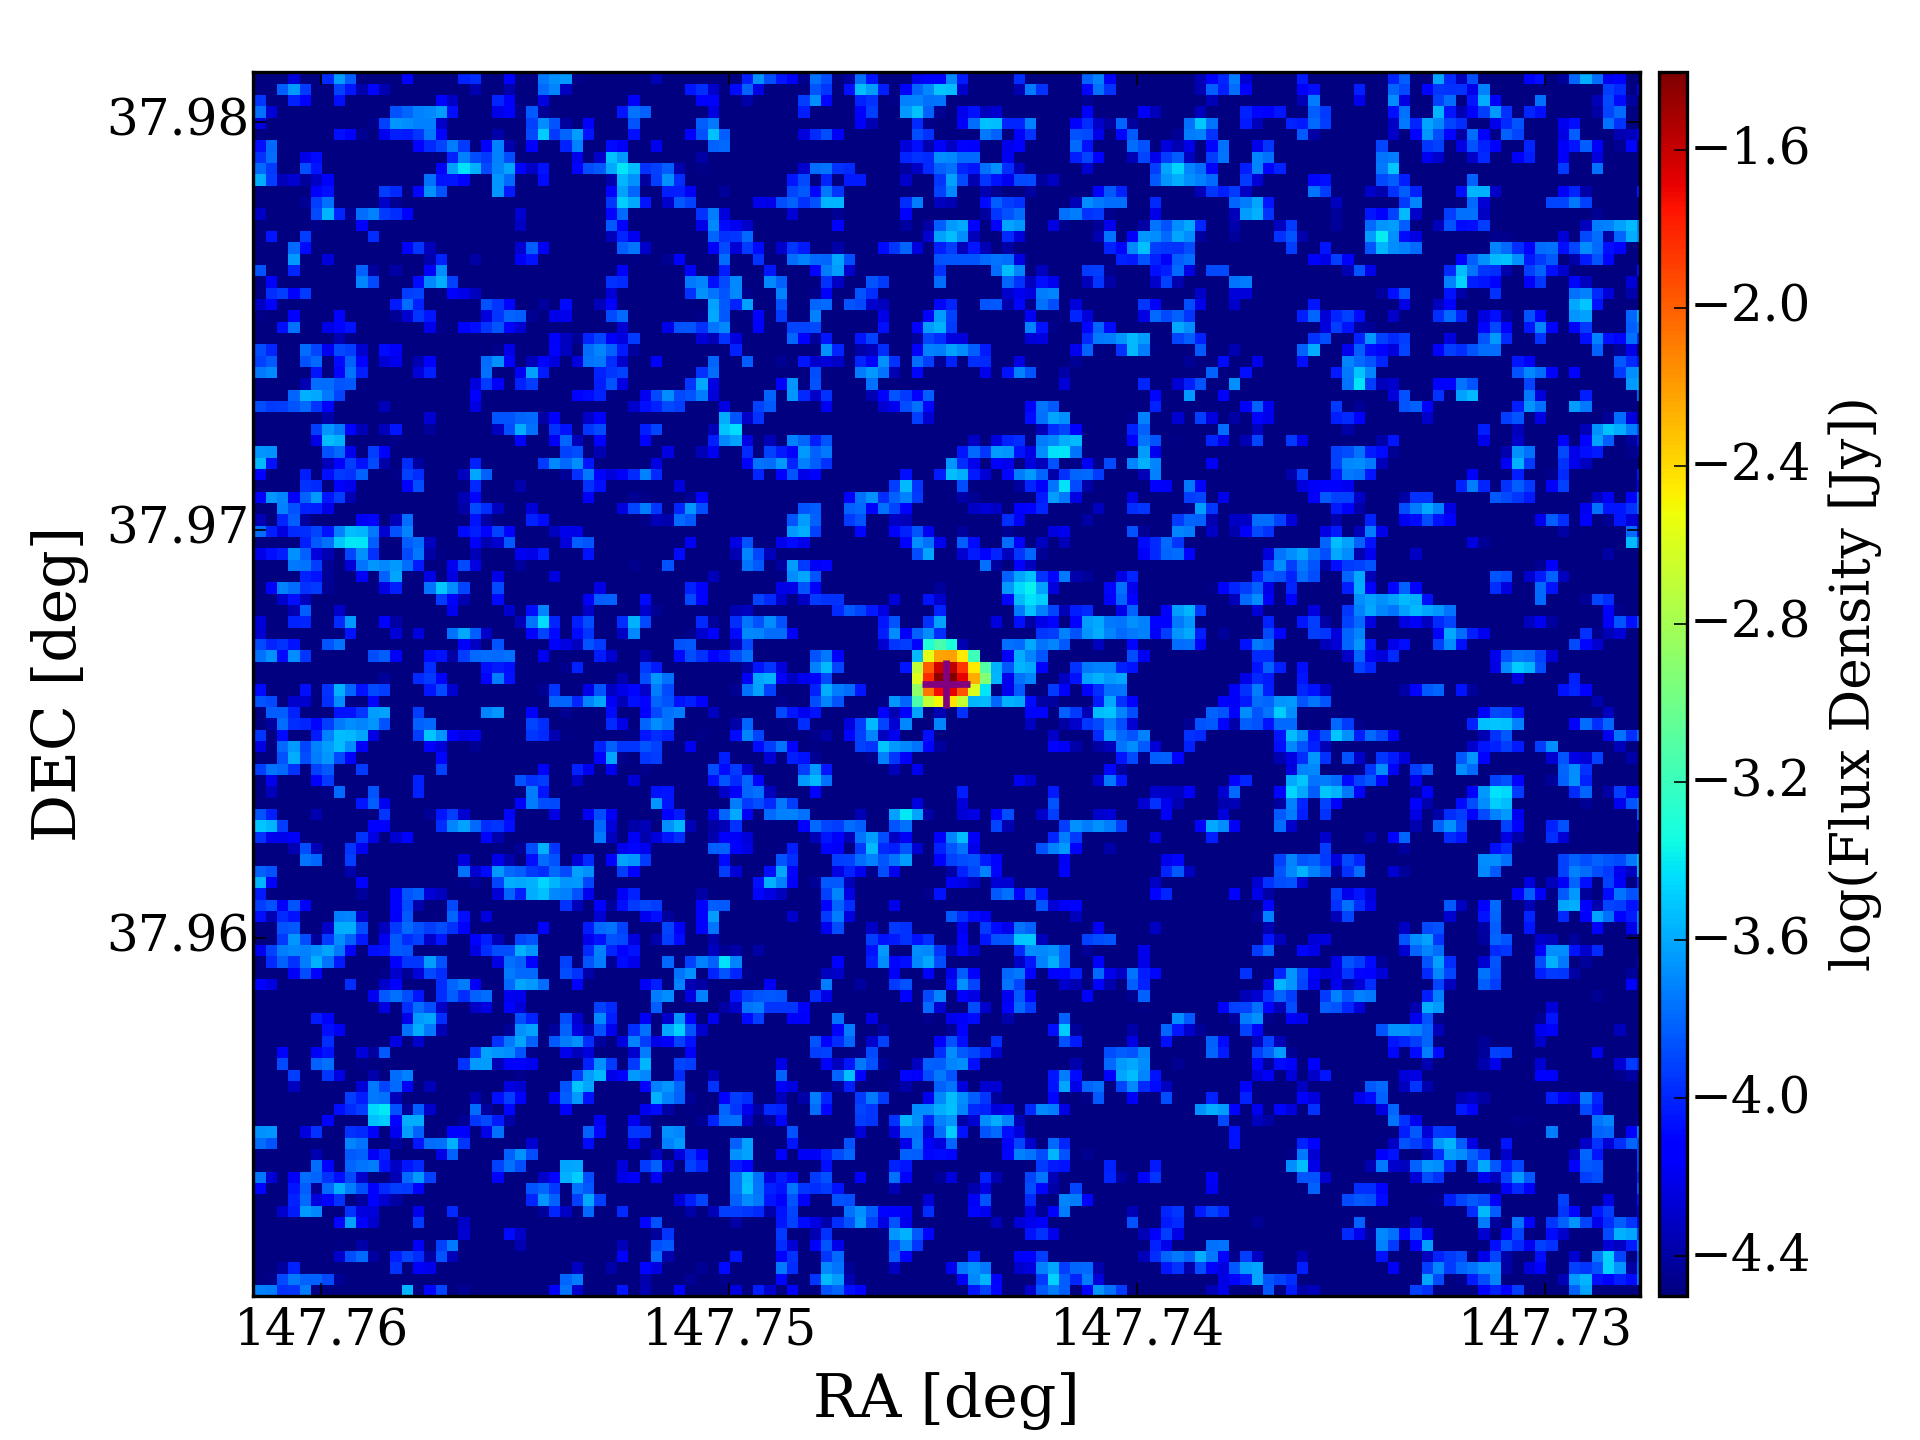
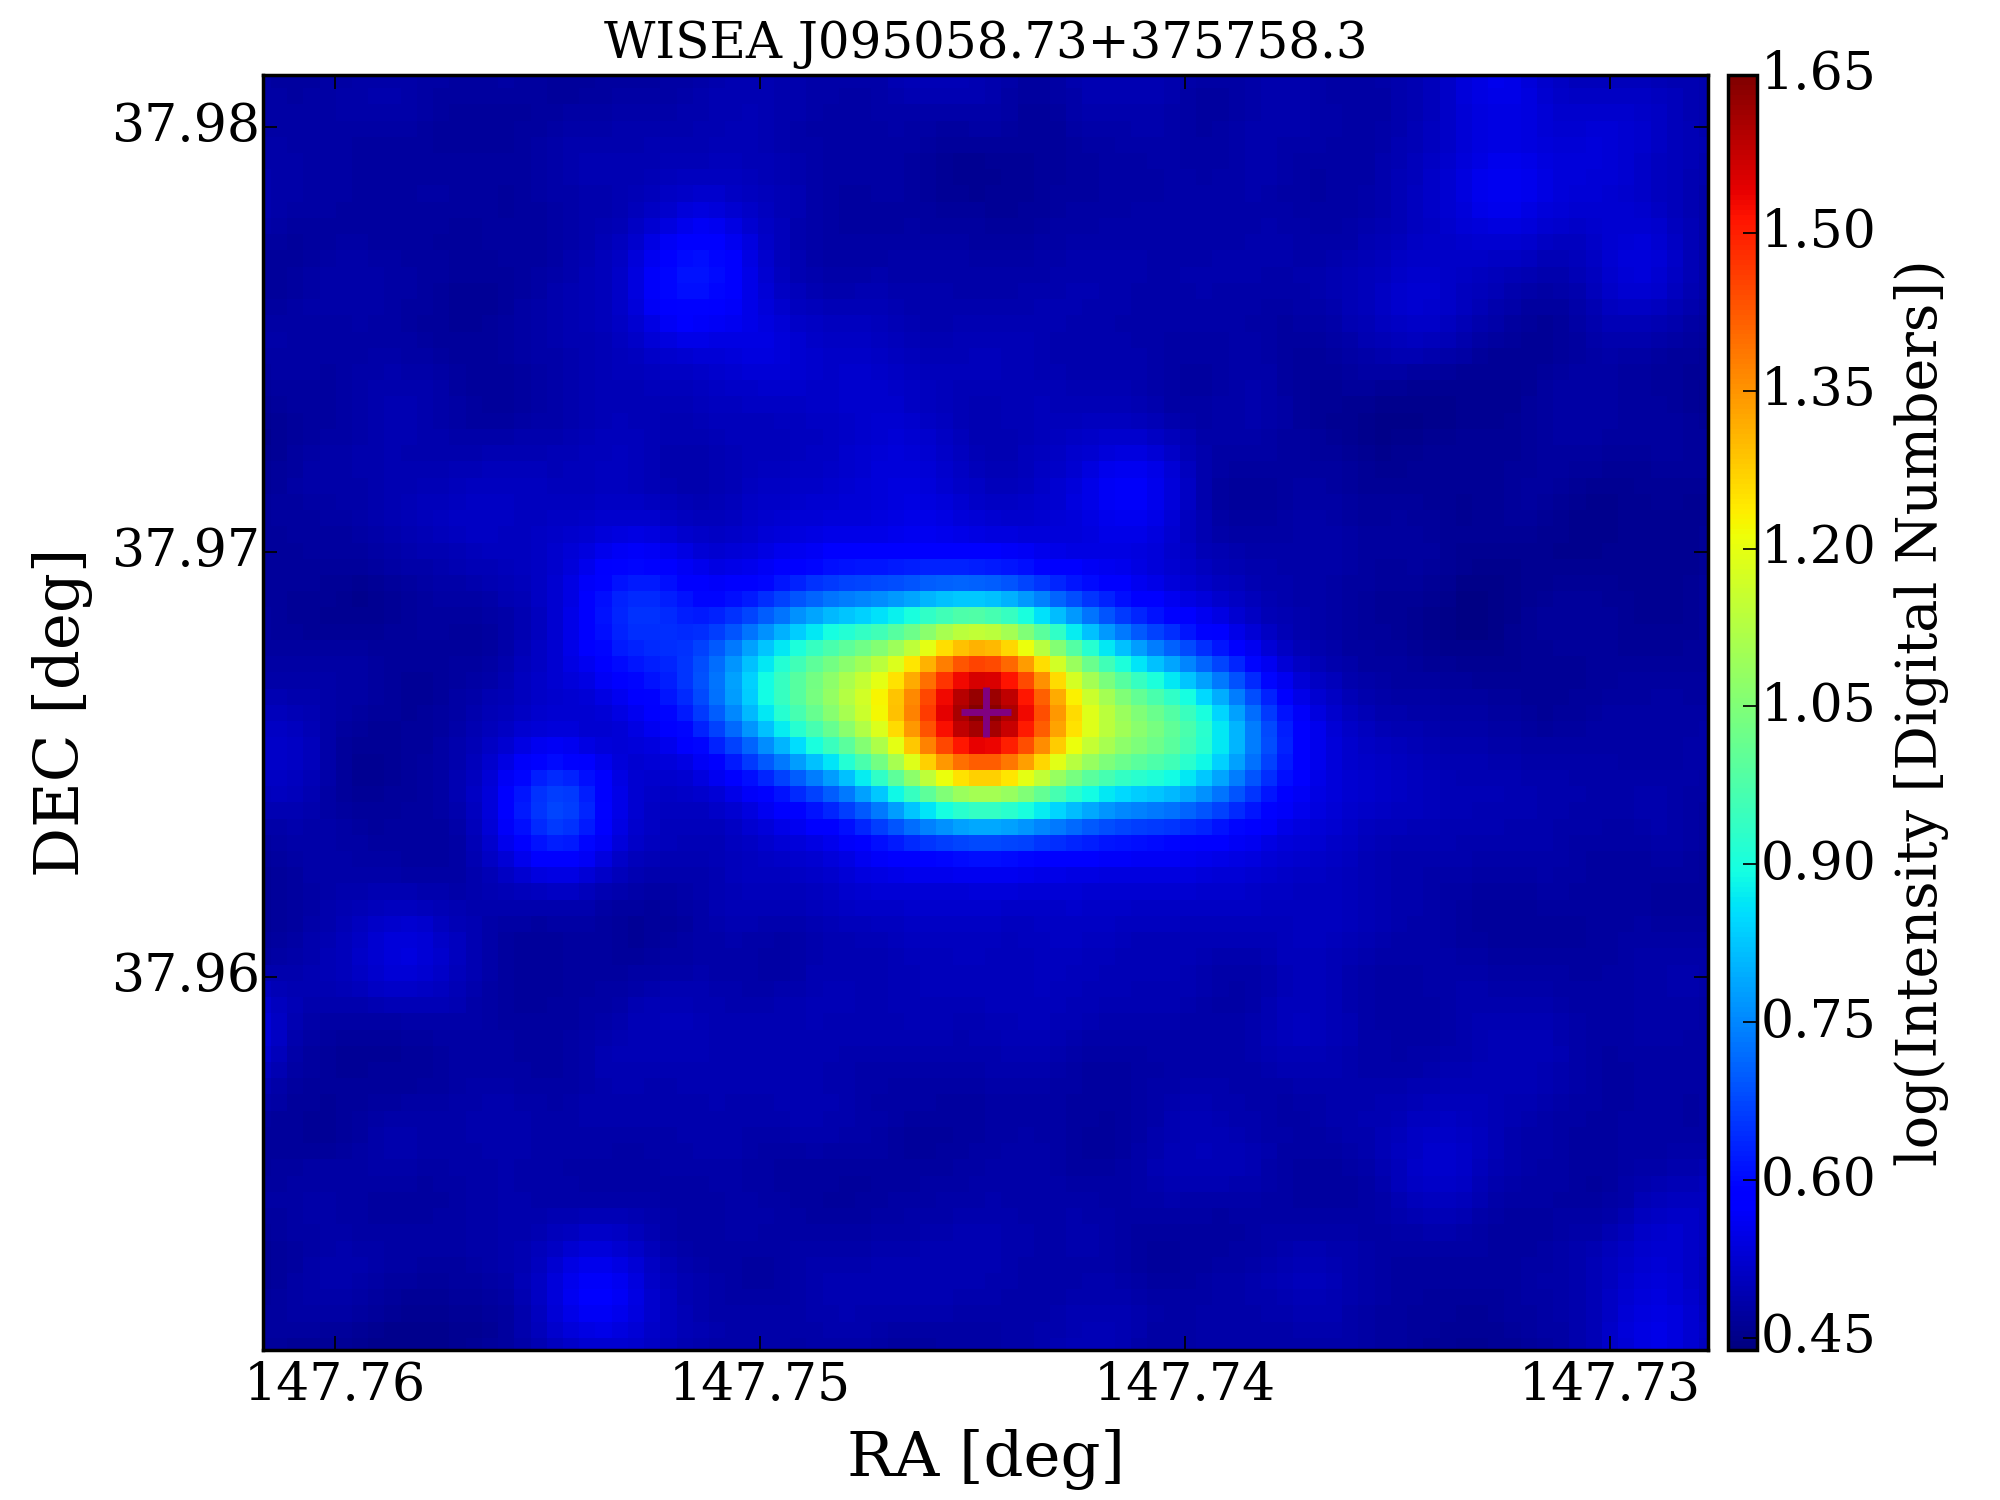
4.2.13 NVSS J095058+375758
NVSS J095058+375758 (Figure 25) is a nearby galaxy hosting AGN. Morphologically, it is classified as an edge-on FR0 galaxy (Ma et al., 2019). The associated Hi absorption profile shows symmetry, indicating a gas disk.
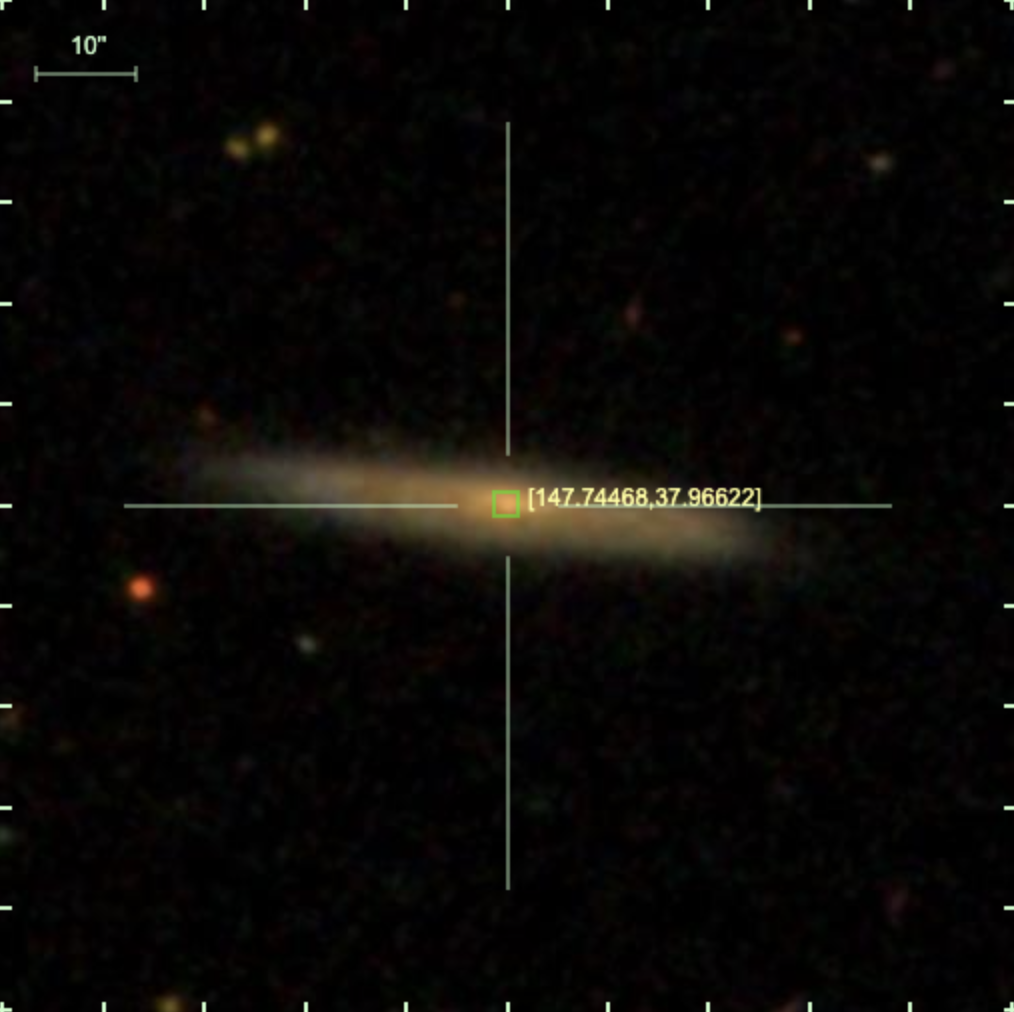
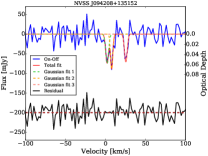
4.2.14 NVSS J094208+135152
NVSS J094208+135152 (Figure 26) is categorized as a radio source, close to 3C 225A (located at z = 1.565), with a mere 0.039 arcmin separation. Since only one radio source is identified in the same region by VLASS, NVSS J094208+135152 likely corresponds to 3C 225A. In the HUBBLE SPACE TELESCOPE snapshot survey presented by McCarthy et al. (1997), the identification of 3C 225A is faint, causing confusion with a foreground spiral in ground-based images. The SDSS counterpart to the foreground galaxy is SDSS J094208.05+135154.9, its magnitudes are u=20.724, g=19.471, r=18.889, i=18.614 and z=18.536.
The Hi absorption exhibits a double-horn component and a sub-component with a velocity separation of approximately 20 . It is plausible that the double-horn profile originates from gas surrounding the foreground galaxy, while the sub-component may be attributed to either a companion galaxy or infalling gas.
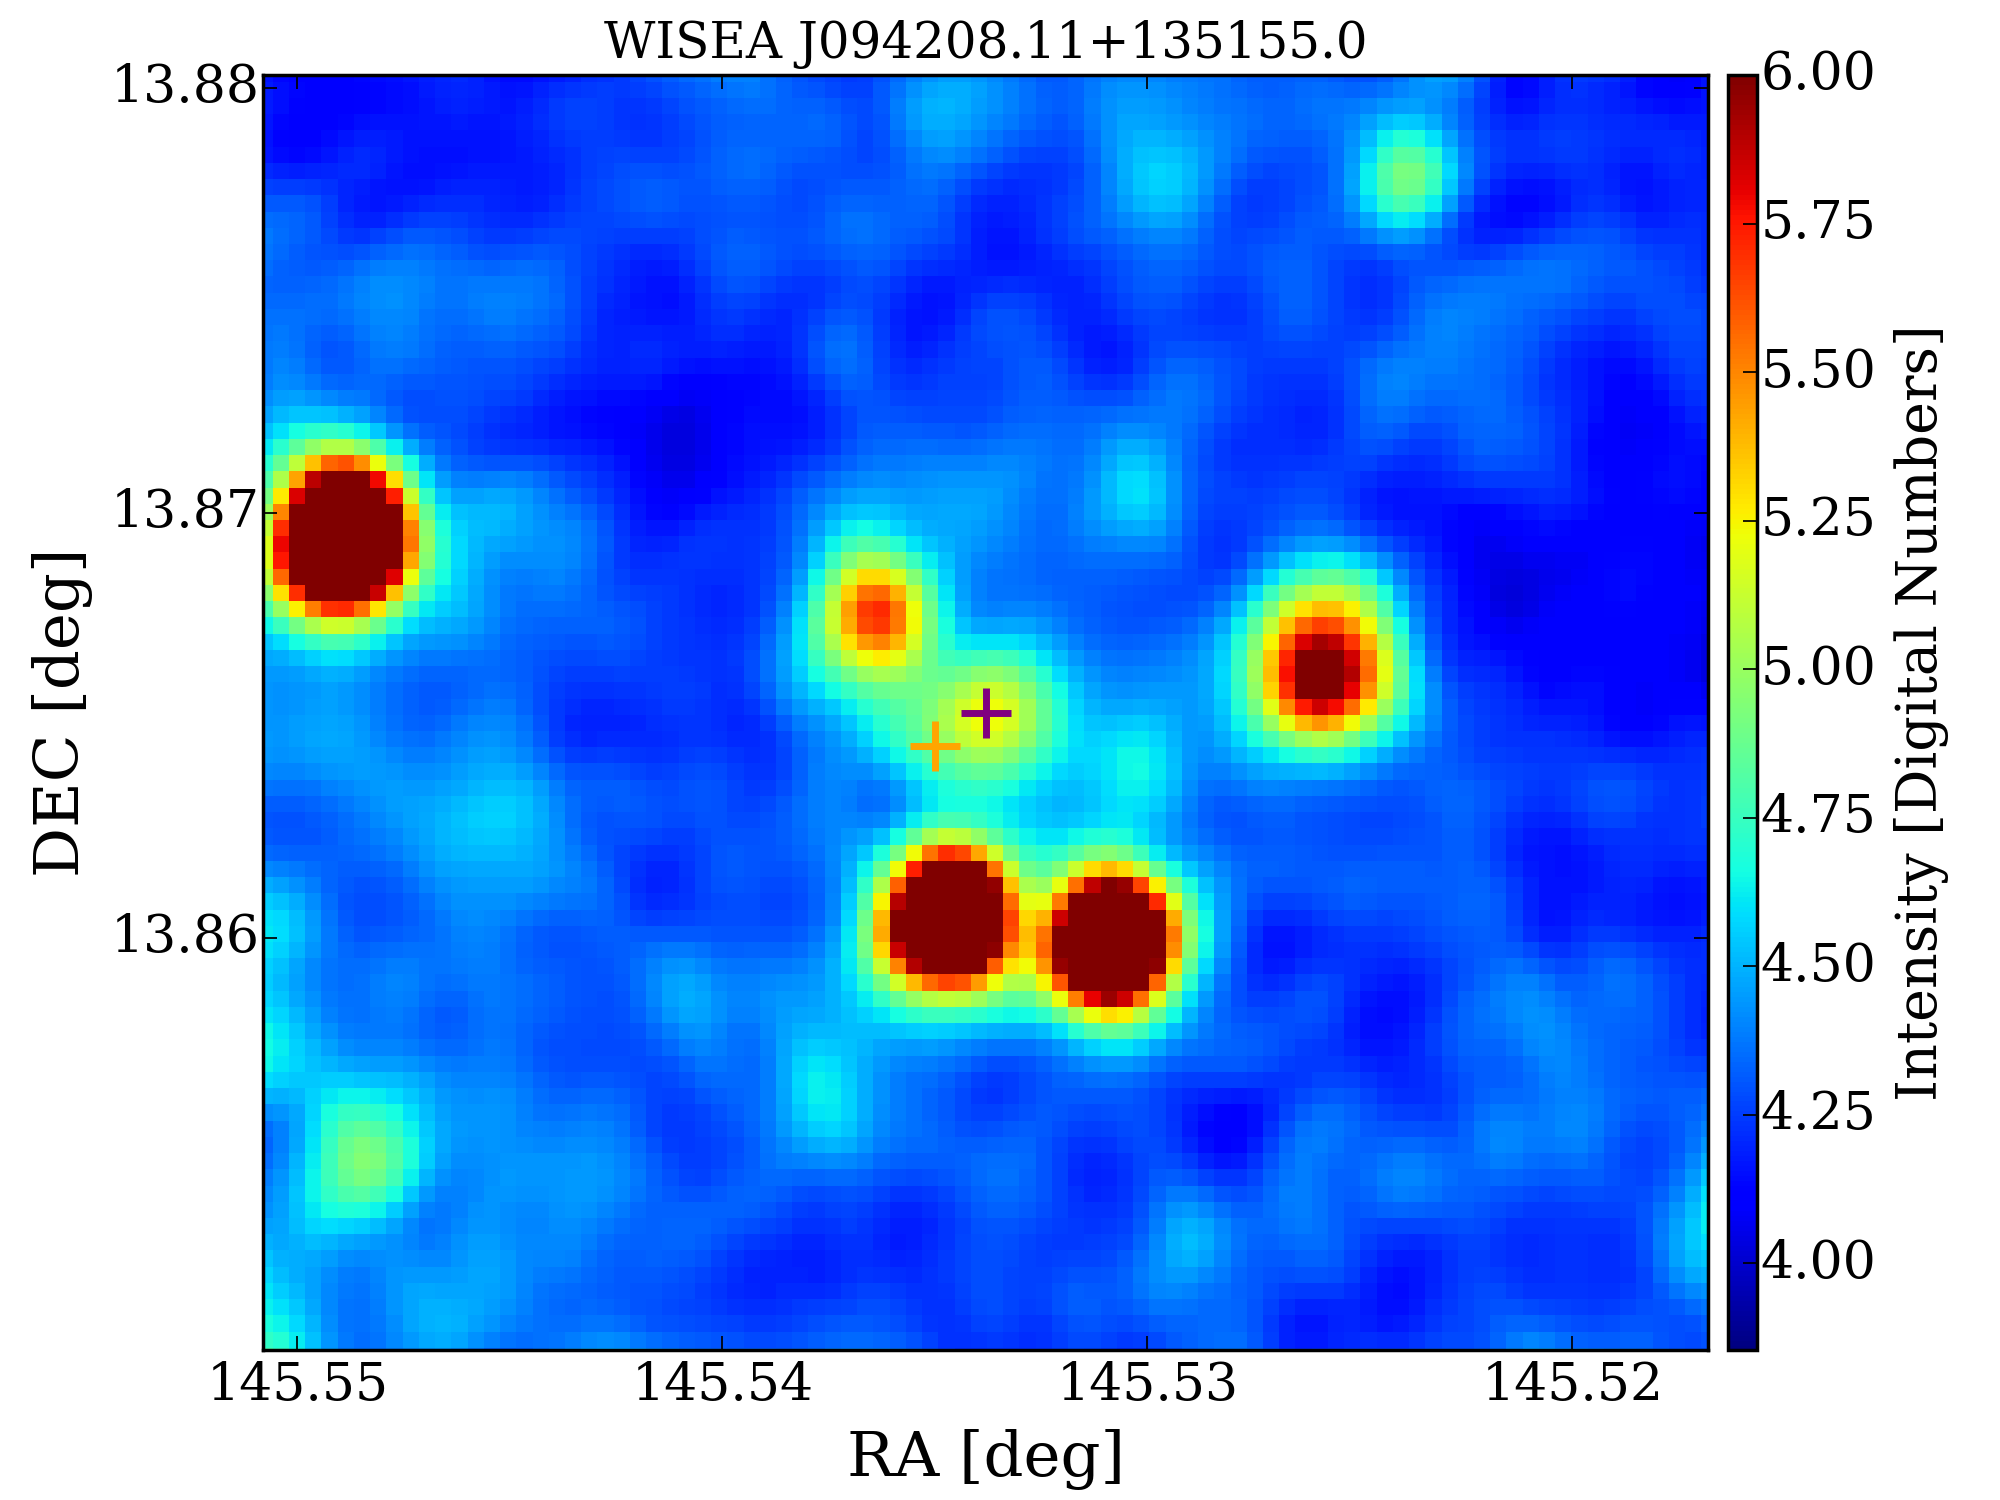
The WISE counterpart to foreground galaxy SDSS J094208.05+135154.9 is WISEA J094208.11+135155.0 as shown in the NED. The WISE W1[], W2[], W3[] and W4[] magnitudes for WISEA J094208.11+135155.0 are 16.307 0.101, 15.839 0.225, 11.331 0.173 and 8.316, respectively. The W1-W2 color of WISEA J094208.11+135155.0 is 0.468, which means that the mid-IR emission comes mainly from the stars. According to the W2-W3 value of 4.508 mag, WISEA J094208.11+135155.0 is located in the ULIRGs/LINERs region in the WISE color-color diagram.
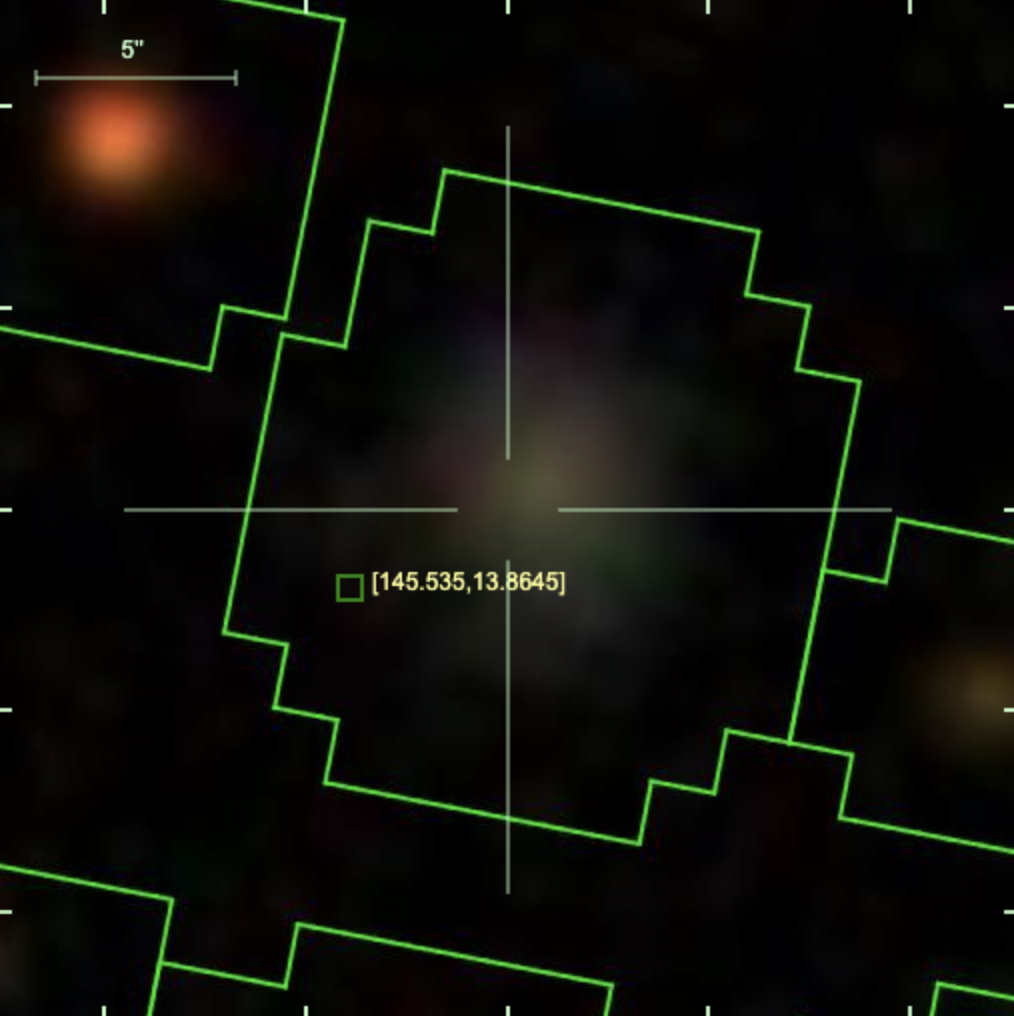
4.2.15 NVSS J092351+281527
Positioned at a redshift of 0.745, NVSS J092351+281527 (Figure 27), identified as a quasar, has undergone observations across various spectra, including ultraviolet (GALEX), optical (SDSS), Infrared/Submillimeter (WISE and Planck), and radio bands (Texas, FIRST, and NVSS). Additionally, NVSS J092351+281527 is categorized as a Flat-Spectrum Radio Source in Healey et al. (2007). The counterpart to the foreground is currently ambiguous, necessitating high-resolution follow-up observations for verification.
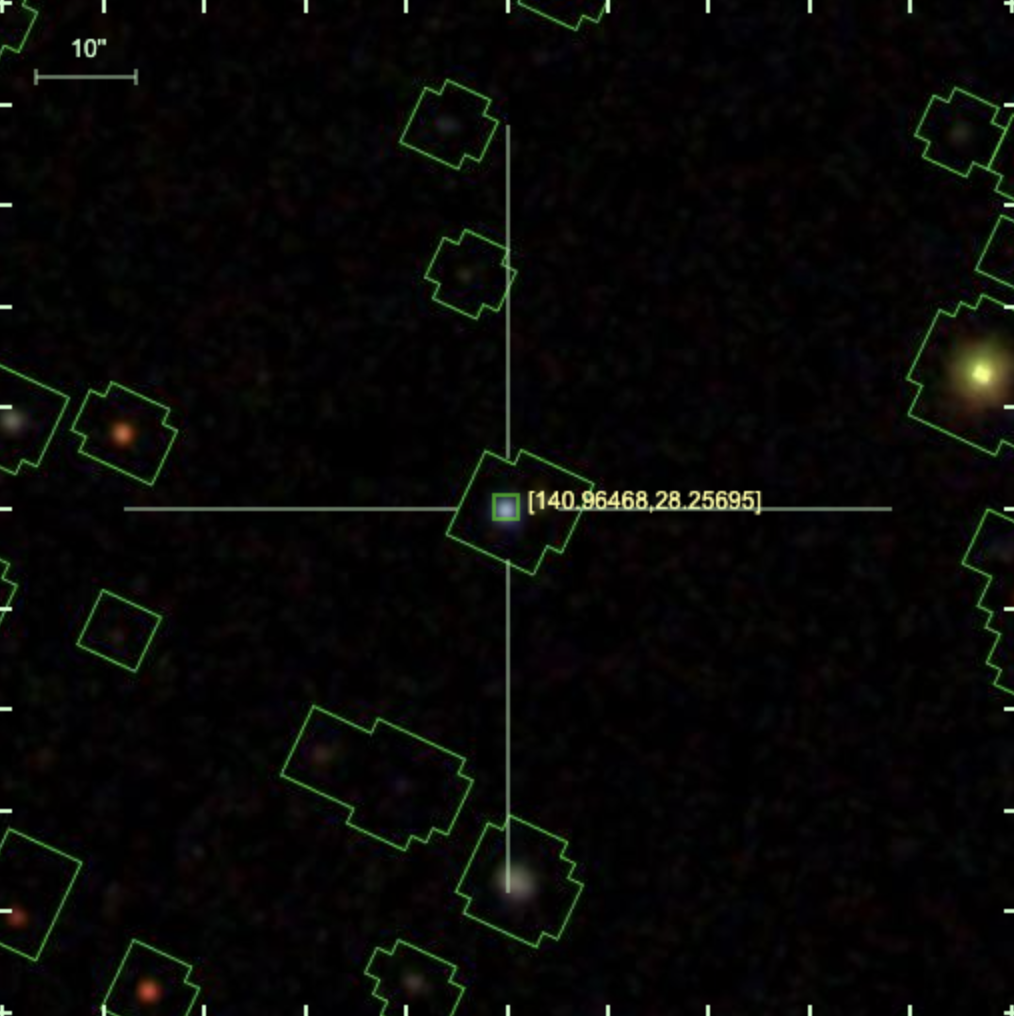
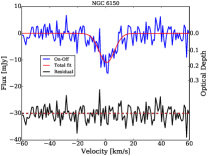
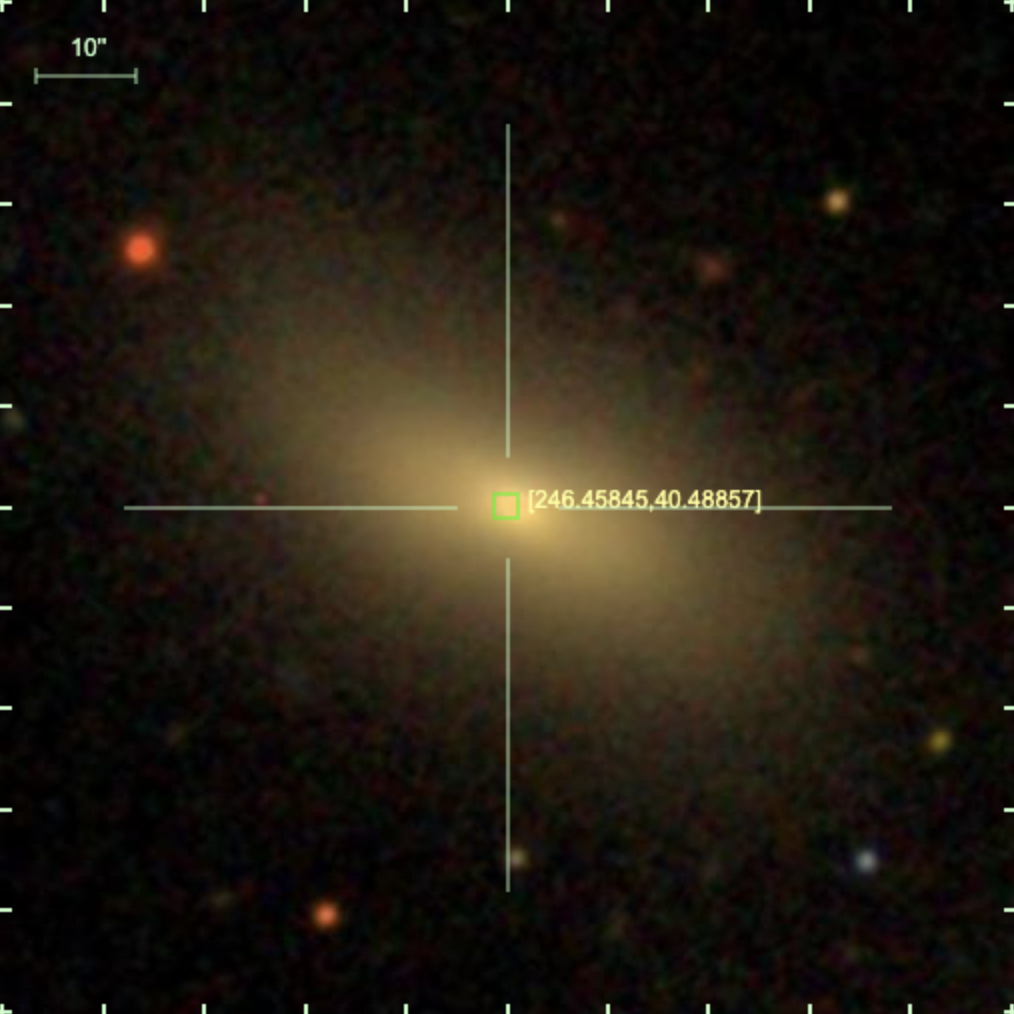
4.2.16 NVSS J162549+402921 (NGC 6150)
NGC 6150 (Figure 28) is situated within the Abell 2197 cluster and is classified as an elliptical galaxy(Nair & Abraham, 2010). As documented by O’Dea et al. (1987), NGC 6150 is identified as a narrow-angle tail (NAT) radio source.

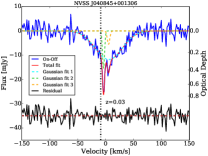
4.2.17 NVSS J040845+001306
NVSS J040845+001306 (Figure 29) is a galaxy divided by a prominent east-west dust lane. The associated Hi absorption profile comprises a broader Gaussian-shaped component and a distinct double-horn feature. The predominant absorption is likely associated with diffuse gas, while the sharp component may stem from gas in rotational motion within the galaxy.
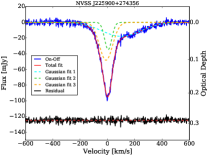
4.2.18 NVSS J225900+274356
NVSS J225900+274356 (Figure 30) is an AGN-host radio galaxy with a photoz=0.110 0.0236, which has been observed in the Infrared/Submillimeter (WISE and 2MASS) and radio bands (Texas and NVSS). The photometric redshift is lower than the redshift of the Hi absorption, suggesting that the Hi gas might originate from an associated infalling object.
The Hi absorption profile exhibits a symmetric, narrower, and more intense component, likely originating from a gas disk. Additionally, there is a broader, shallower redshifted wing, indicating the existence of unsettled gas structures and a potential accretion of gas onto the SMBH.
5 Hi Absorption Properties
5.1 Hi Absorption Statistics
Physical properties of associated and intervening absorption are investigated in this section, to understand the nature of Hi absorption systems.
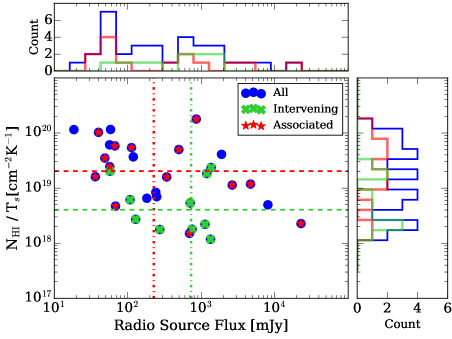
5.1.1 column density versus flux density of radio sources
The relationship between Hi column density and 1.4-GHz flux density of radio sources for Hi absorption systems, along with their histograms, is shown in Figure 31. The flux densities of radio sources for detected Hi absorption systems span a large range, from 20 mJy to 23 Jy. When comparing intervening and associated systems, the flux density of radio sources within associated systems exhibits a wider range in both very low (flux 60 mJy) and high (flux 2 Jy) flux density regions. In terms of Hi column density, associated systems exhibit higher values compared to intervening systems. This suggests that galaxies hosting associated Hi absorption systems contain more Hi gas compared to foreground galaxies of intervening systems.
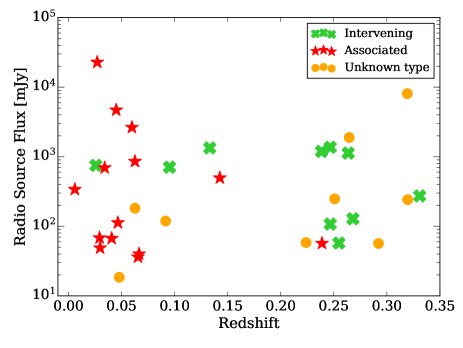
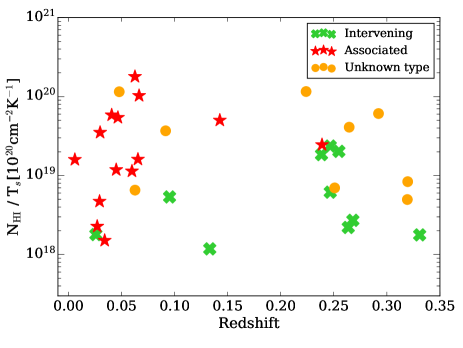
5.1.2 Distribution in Redshift
In Figure 32 we plot the redshift versus 1.4-GHz flux density of the radio sources for Hi absorption systems (upper panel) and Hi column density (lower panel). The scarcity of Hi absorption systems found between redshift 0.136 and 0.235 is attributed to interference caused by RFIs in the frequency range from 1150 MHz to 1250 MHz. For both intervening and associated Hi absorption systems, there are no evident correlations between redshift and flux densities of radio sources for Hi absorption systems, nor between redshift and N. An intriguing result from the distribution of Hi absorption across redshifts reveals a significant dichotomy: the majority of detected associated Hi absorption systems are found at lower redshifts (0.10), whereas detected intervening Hi absorption systems predominantly occur at higher redshifts (0.22). This highlights a clear separation in redshift distribution between associated and intervening systems. This phenomenon can be explained by the lower probability of encountering an intervening absorber at a low redshift and the increased difficulty in identifying an absorber as associated at a higher redshift.
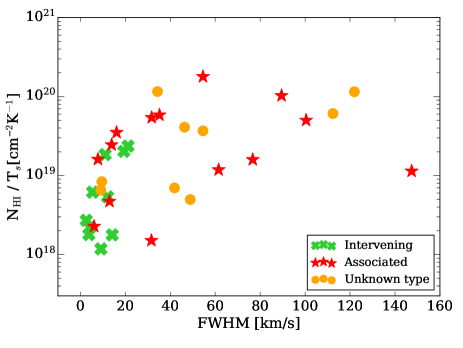
5.1.3 Column Density versus FWHM
Figure 33 illustrates the correlation between Hi column density and FWHM of Hi absorption systems. The FWHM values for intervening systems are significantly lower compared to those of associated systems. Specifically, the median FWHM for intervening systems is 10.09 6.19 , while for associated systems, it is 33.49 40.42 . Furthermore, there is a noticeable trend indicating that Hi column density increases with FWHM, with this pattern being more pronounced for associated systems compared to intervening systems.
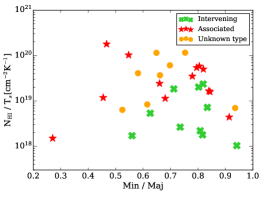
5.1.4 Column Density versus Morphology
Enhancing our comprehension of the gas properties associated with different radio source types, such as compact and extended, is vital for understanding the observed features of AGNs. Furthermore, it is proposed that AGN of different types are encased in different gaseous environments and exhibit divergent Hi detection rates. Geréb et al. (2014) analyzed a sample of 93 AGNs, selected based on a flux criterion (S 50 mJy) and having SDSS redshifts in the range 0.02 0.23, categorizing them into compact and extended radio sources. They discovered that the compact sources (with g r 0.7) exhibit an Hi absorption detection rate of approximately 42, in contrast to just about 16 for extended sources. Through a stacking analysis, it was revealed that the Hi absorption associated with the compact radio sources typically presents higher optical depth, FWHM, and Hi column densities compared to those linked with extended sources (Geréb et al., 2014). Furthermore, Geréb et al. (2015) reported a tendency for Hi absorption features in compact radio sources to display blueshifted and broad/asymmetric line profiles more frequently.
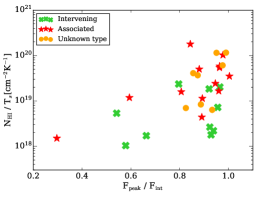
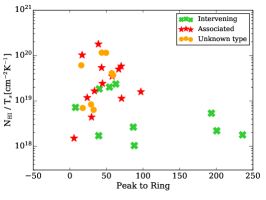
We explore N levels in Hi absorption associated with radio sources of varying morphologies in our sample. The morphology is characterized by metrics such as the minor-to-major axis ratio, the peak-to-integrated flux ratio, and the peak-to-ring flux ratio (defined as the ratio of maximum brightness within 5 arcsecs of the component to the maximum brightness in an annulus centered on the component with inner and outer radii of 5 arcsecs and 10 arcsecs). These parameters were obtained from the VLASS catalog. Radio sources (4C -06.18 and 3C 84) located outside the VLASS coverage area were omitted from the morphology-based analysis. The findings are depicted in Figure 34. For intervening systems, there appears to be no discernible connection between the morphology of background radio sources and N. Similarly, for associated systems, no evident relationship is observed between the minor-to-major axis ratio and N. However, there are noticeable increasing trends of N with both the peak-to-integrated flux ratio and the peak-to-ring flux ratio, suggesting that associated Hi absorption linked to compact radio sources exhibits higher Hi column densities in comparison to those associated with extended radio sources.
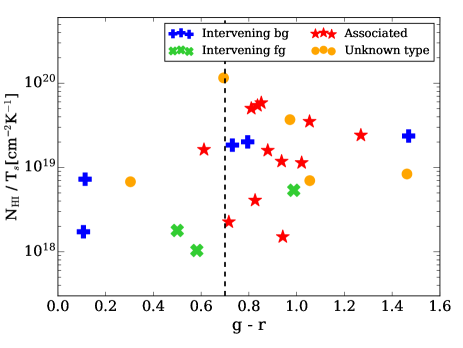
5.1.5 Column Density versus Color
The N versus the SDSS color of our Hi 21-cm absorption sample is shown in Figure 35. For the detected associated Hi absorption, most of the hosting galaxies are red () objects. The background sources in the intervening systems cover a broad range of g-r color values. Among the three intervening systems whose foregrounds are determined, two are blue objects (). A preliminary division in color distribution for foregrounds of associated and intervening systems has been identified, necessitating further validation with a larger sample size, especially concerning intervening systems. This division aligns with the redshift distribution of associated and intervening Hi absorption detailed in Section 5.1.2, reflecting the prevalence of bluer galaxies at higher redshifts due to the process of galaxy evolution.
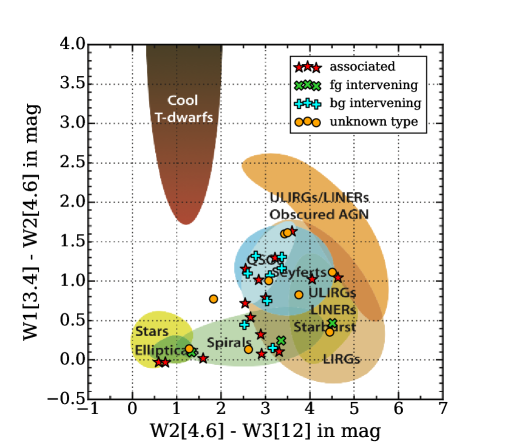
5.2 WISE color-color Classification
The WISE color-color diagram (Wright et al., 2010) is often used to illustrate the locations of interesting classes of objects. We use it to infer possible classes of foreground and background sources, the positions of our systems in the color-color diagram are shown in Figure 36. Of the eight background radio sources in the intervening systems, five are located in the region of QSOs, while two are found in areas corresponding to either spiral or elliptical galaxies. Notably, all sources in the QSO region exhibit a W1-W2 color exceeding 0.8 mag, suggesting the presence of a potent AGN (Stern et al., 2012). Additionally, three foreground radio sources in the intervening systems were identified, each in distinct regions: one in a spiral galaxy, another in an elliptical galaxy, and the third in the ULIRGs/LINERs starburst region. For the associated systems, the radio sources spread a broader range of locations, encompassing the QSO region, Seyferts region, spiral galaxy region, elliptical galaxy region, and the ULIRGs/LINERs starburst region.
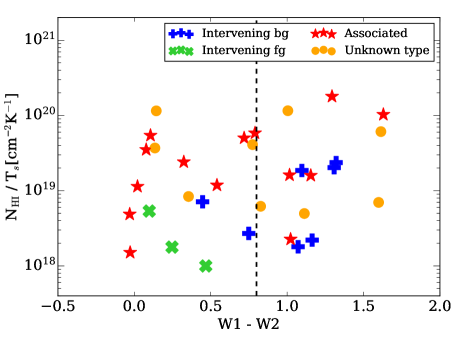
The color difference between W1[] and W2[], with a value of 0.8, is commonly utilized as a basic mid-infrared color criterion to identify AGN candidates (Stern et al., 2012). Figure 37 illustrates the difference in WISE magnitudes between the W1 and W2 bands plotted against the Hi column density. It reveals no apparent correlation between the W1-W2 magnitudes and Hi column density in associated systems. However, for the foreground sources in the intervening systems, a potential trend suggests that Hi column density diminishes as W1-W2 magnitudes increase. Notably, all three identified foreground sources exhibit W1-W2 magnitudes less than 0.8, suggesting that these sources are likely galaxies with minimal or no AGN activity.
5.3 Spectral Stacking Results
Stacking effectively replicates the overall spectral characteristics (Hu et al., 2019, 2020, 2021). In this section, we examine Hi properties of both associated and intervening Hi absorption systems. This is achieved by stacking Hi absorption spectra from, for the first time, a blind catalog of Hi absorbers that was compiled without bias.
The stacking technique used in this paper is similar to that described in Hu et al. (2019). Flux density spectra were converted to optical depth spectra using Eq. (2). We introduce a weight factor that equals the inverse of completeness. The weight of ith Hi absorption system is expressed as:
| (3) |
where refers to the completeness for a Hi absorbers with FWHM of , S/N of and at the frequency of . The completeness was estimated by adding mock absorption lines to real CRAFTS and FASHI spectra and calculating the fraction detected using our search method and selection threshold.
The averaged final stacked spectrum is obtained from:
| (4) |
The integrated of a stack, or , is then defined as integral along the velocity axis over spectrum:
| (5) |
where is large enough to capture all signals from the stack (we will later use ). The integrated N of a stack ( N)is then calculated by 1.82 1018 T. The errors for measurements were estimated through jackknife resampling.
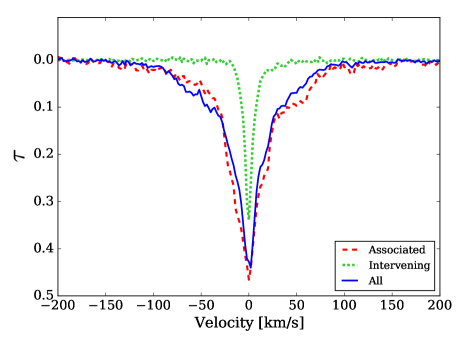
The Hi absorption used for stacking consists of 33 systems except for NVSS J112832+583346 (emission and absorption are indistinguishable), including 13 associated systems, 10 intervening systems, and 9 unknown-type systems. Stacking optical depth spectra from our sample results in strong detections. The stacked spectra are shown in Figure 38. The mean peak optical path, mean velocity-integrated optical path , mean FWHM and mean Hi column density N are measured to be 0.46 0.09, 0.34 0.10 and 0.44 0.07; 25.85 6.51 , 4.62 1.64 and 22.72 5.73 ; 39.80 11.85 , 8.94 2.61 and 30.84 14.60 ; 0.470 0.118, 0.084 0.030 and 0.413 0.104 T 1020cm-2K-1, for associated, intervening and all Hi absorption samples.
6 Discussions
6.1 Comoving Absorption Path
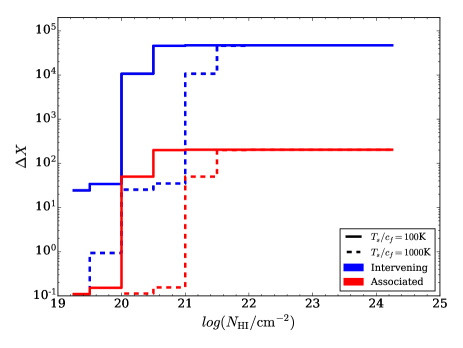
The absorption path length defines the moving interval of the survey that is sensitive to intervening absorbers. We estimate total comoving absorption path length () for the data (CRAFTS and FASHI) used here (1050-1150 MHz and 1250-1450 MHz), adopting the method described in Allison et al. (2015, 2020); Allison (2021) and Paper I.
Assuming the covering factor , velocity FWHM (the mean velocity width for all intervening 21-cm absorbers detected (Curran et al., 2016; Allison et al., 2016)), and a detection threshold of , we show the comoving absorption path length for our data as a function of HI column density in Figure 39. We present results for = 100 and 1000 K, which are the typical spin temperature of the cold (CNM) and the warm neutral medium (WNM) respectively (Murray et al., 2018). Under the assumption of = 100 K, the total comoving absorption path length spanned by our data is = 4.72 () and = 2.04 (). The comoving absorption paths sensitive to the DLAs () are = 4.07 () for the intervening absorption and = 1.81 () for the associated absorption, respectively.
6.2 Statistic Completeness
In this study, we examine characteristics of associated and intervening Hi 21-cm absorption using extensive statistical analysis. It is important to acknowledge that the outcomes are significantly influenced by sample completeness. To assess our sample’s completeness, we introduced mock absorption into actual data and conducted the search process again. We identified that the most significant factor affecting completeness was the bandpass fluctuations, primarily due to standing waves. In the FAST data, these standing waves exhibit a frequency width of approximately 1 MHz (equivalent to about 200 at the redshift of 0), posing a challenge to detect Hi absorption features with an FWHM of around 200 . Nonetheless, the average velocity width for the intervening Hi 21-cm absorption is recorded at 30 , and the FWHM for most associated Hi 21-cm absorption remains below 200 (Geréb et al., 2015). Given that our analysis has been adjusted for completeness, the findings of this work can still faithfully reflect the characteristics of the Hi 21-cm absorption with FWHM less than 200 .
Li et al. (2023) introduced a data processing pipeline for the FAST Hi intensity mapping drift-scan survey, employing a low-pass filter to mitigate noise and diminish the presence of standing waves. Their calibration approach effectively corrects both the temporal and bandpass gain variations over the 4-hour drift-scan sessions. More recently, Jing et al. (2024) unveiled HiFAST, a comprehensive calibration and imaging pipeline specifically designed for FAST Hi data, which includes a method for standing wave elimination based on FFT. We plan to incorporate the standing wave removal technique in our future data processing efforts, which is expected to expand our catalog and enhance statistical analyses across a broader parameter space.
| Radio Source | Source Type | RA(J2000) | DEC(J2000) | cz () | (mJy) |
| NVSS J004219+570836 | QSO | 00h 42m 19.45s | +57d 08m 36.59s | 342063.24 | 1126.1 33.8 |
| 4C +56.02 | Radio Source | 01h 10m 57.55s | +56d 32m 16.98s | - | 1890 56.7 |
| NVSS J011322+251852 | Radio Galaxy | 01h 13m 22.69s | +25d 18m 53.26s | 208355.79 | 57.4 1.8 |
| 4C +31.04 | Double Radio System | 01h 19m 35.00s | +32d 10m 50.05s | 18047.51 59.96 | 2640 79.1 |
| 4C +26.07 | Radio Source | 02h 05m 37.34s | +26d 50m 02.70s | 107625.49 43409.95 | 248 7.4 |
| 3C 84 | Radio Galaxy | 03h 19m 48.16s | +41d 30m 42.11s | 5264 11 km/s | 22829.2 684.9 |
| NVSS J033529+195621 | Radio Source | 03h 35m 29.43s | +19d 56m 21.3s | - | 56.6 1.8 |
| NVSS J040845+001306 | Radio Source | 04h 08m 45.29s | +00d 13m 07.35s | 8945 35 | 48.8 1.5 |
| NVSS J055437+271126 | Radio Galaxy | 05h 54m 37.30s | +27d 11m 25.9s | 27855.52 | 18.5 0.7 |
| NVSS J073755+264652 | Radio Galaxy | 07h 37m 55.34s | +26d 46m 52.57s | 71685.18 17.69 | 56.9 1.8 |
| 4C -06.18 | Radio Source | 07h 44m 21.66s | -06d 29m 35.93s | - | 8080 242 |
| NVSS J080101-075121 | Radio Source | 08h 01m 01.01s | -07d 51m 21.80s | 41371.36 12111.62 | 118.8 3.6 |
| NVSS J085521+575143 | Radio Source | 08h 55m 21.36s | +57d 51m 44.09s | 132598.20 | 751.55 119.75 |
| NVSS J092351+281527 | QSO | 09h 23m 51.52s | +28d 15m 25.02s | 223196 35 | 272.8 9.6 |
| NVSS J093150+254034 | Radio Galaxy | 09h 31m 50.56s | +25d 40m 34.61s | 243552 35 | 128.1 3.9 |
| NVSS J094208+135152 | Radio Source | 09h 42m 08.40s | +13d 51m 52.2s | - | 1338.9 40.2 |
| NVSS J095058+375758 | Radio Galaxy | 09h 50m 58.72s | +37d 57m 58.40s | 12149 4 | 66.9 2.1 |
| NVSS J095812+112643 | Radio Galaxy | 09h 58m 12.35s | +11d 26m 42.62s | 94134.83 23024.06 | 241.4 7.3 |
| NVSS J100755+405519 | Radio Source | 10h 07m 55.69s | +40d 55m 18.50s | 57260.36 44369.28 | 58.33 |
| NVSS J104941+133255 | QSO | 10h 49m 41.10s | +13d 32m 55.68s | 828592 75 | 107.6 3.9 |
| NVSS J112832+583346 | Radio Galaxy | 11h 28m 32.30s | +58d 33m 43.0s | 3121 3 | 677 |
| NVSS J115948+582020 | Radio Galaxy | 11h 59m 48.77s | +58d 20m 20.28s | 188419.59 | 1191.7 35.8 |
| NVSS J134035+444817 | Radio Galaxy | 13h 40m 35.20s | +44d 48m 17.40s | 19619 2 | 36.22 |
| 4C +57.23 | Radio Source | 13h 54m 00.12s | +56d 50m 04.74s | 62956 | 707.8 21.2 |
| NVSS J141314-031227 | Radio Galaxy | 14h 13m 14.89s | -03d 12m 27.28s | 1824 3 | 339 10 |
| NVSS J141558+132024 | QSO | 14h 15m 58.82s | +13d 20m 23.71s | 73962 3 | 1092.1 32.8 |
| NVSS J160332+171158 | Radio Galaxy | 16h 03m 32.08s | +17d 11m 55.31s | 10198 2 | 693 17 |
| NGC 6150 | Radio Source | 16h 25m 50.03s | +40d 29m 18.84s | 8747 3 | 32.4 1.4 |
| NVSS J225900+274356 | Radio Source | 22h 59m 00.31s | +27d 43m 56.70s | 32977 6895 | 496.2 14.9 |
-
Associated Hi absorption type.
-
Intervening Hi absorption type.
-
Unknown Hi absorption type.
| Radio Source | WISE Counterpart | W1 | W2 | W3 | W4 | WISE color-color classification |
| NVSS J004219+570836 | WISEA J004219.53+570836.0 | 14.577 | 13.413 | 10.047 | 7.579 | QSOs Seyferts |
| 4C +56.02 | WISEA J011057.55+563216.8 | 14.795 | 14.021 | 12.190 | 8.956 | - |
| NVSS J011322+251852 | WISEA J011322.69+251853.2 | 14.355 | 13.047 | 9.679 | 7.269 | QSOs |
| 4C +31.04 | WISEA J011935.00+321050.2 | 11.641 | 11.620 | 10.024 | 7.578 | Spirals |
| 4C +26.07 | WISEA J020537.42+265003.8 | 14.942 | 13.343 | 9.912 | 7.476 | QSOs |
| 3C 84 | WISEA J031948.16+413042.3 | 9.136 | 8.113 | 4.062 | 1.150 | Seyferts Starburst |
| NVSS J033529+195621 | WISEA J033529.35+195620.7 | 14.360 | 12.746 | 9.248 | 6.276 | QSOs |
| NVSS J040845+001306 | WISEA J040845.31+001308.0 | 11.511 | 11.433 | 8.520 | 6.698 | Spirals |
| NVSS J055437+271126 | WISEA J055437.35+271126.3 | 12.257 | 12.113 | 10.830 | 8.318 | Ellipticals/Spirals |
| NVSS J073755+264652 | WISEA J073755.33+264652.9 | 14.356 | 14.032 | 11.138 | 8.279 | Spirals |
| 4C -06.18 | WISEA J074421.66-062935.7 | 15.440 | 14.327 | 9.821 | 6.232 | LIRG |
| NVSS J080101-075121 | WISEA J080101.19-075123.0 | 15.097 | 14.962 | 12.345 | 8.642 | Spirals |
| NVSS J085521+575143 | WISEA J085521.34+575144.5 | 15.126 | 14.971 | 11.808 | 8.772 | Spirals/LIRGs |
| NVSS J092351+281527 | WISEA J092351.52+281525.1 | 14.117 | 13.045 | 9.946 | 7.721 | QSOs |
| NVSS J093150+254034 | WISEA J093150.56+254034.6 | 15.339 | 14.590 | 11.552 | 8.263 | Seyferts |
| NVSS J094208+135152 | - | - | - | - | - | - |
| NVSS J095058+375758 | WISEA J095058.73+375758.3 | 11.933 | 11.143 | 8.138 | 5.728 | Seyferts |
| NVSS J095812+112643 | WISEA J095812.38+112643.3 | 16.130 | 15.775 | 11.327 | 8.551 | ULIRGs/LINERs/Starburst |
| NVSS J100755+405519 | WISEA J100755.72+405517.7 | 15.927 | 14.922 | 11.848 | 8.360 | QSOs |
| NVSS J104941+133255 | WISEA J104941.17+133251.9 | 15.281 | 14.834 | 12.309 | 8.586 | Spirals |
| NVSS J112832+583346 | WISEA J112833.59+583346.5 | 9.342 | 8.299 | 3.667 | 0.726 | ULIRGs/LINERs |
| NVSS J115948+582020 | WISEA J115948.76+582020.2 | 16.207 | 15.110 | 12.511 | 9.314 | Seyferts |
| NVSS J134035+444817 | WISEA J134035.20+444817.3 | 11.066 | 10.050 | 7.202 | 4.728 | QSOs |
| 4C +57.23 | - | - | - | - | - | - |
| NVSS J141314-031227 | WISEA J141314.88-031227.5 | 7.399 | 6.244 | 3.692 | 1.068 | Seyferts/QSOs |
| NVSS J141558+132024 | WISEA J141558.82+132023.7 | 12.160 | 10.839 | 8.058 | 5.755 | QSOs |
| NVSS J160332+171158 | WISEA J160332.08+171155.3 | 10.939 | 10.966 | 10.372 | 8.476 | Ellipticals |
| NGC 6150 | WISEA J162549.96+402919.4 | 10.764 | 10.794 | 10.049 | 8.646 | Ellipticals |
| NVSS J225900+274356 | WISEA J225900.29+274356.9 | 13.148 | 12.429 | 9.887 | 7.551 | Seyferts/QSOs |
| Radio Source | SDSS Counterpart | u | g | r | i | z |
| NVSS J004219+570836 | - | - | - | - | - | - |
| 4C +56.02 | - | - | - | - | - | - |
| NVSS J011322+251852 | SDSS J011322.69+251853.2 | 20.650 | 19.921 | 19.126 | 18.586 | 18.242 |
| 4C +31.04 | SDSS J011934.99+321050.0 | 17.266 | 15.077 | 14.056 | 13.552 | 13.191 |
| 4C +26.07 | SDSS J020537.32+265001.5 | 22.497 | 21.744 | 20.689 | 20.066 | 20.411 |
| 3C 84 | SDSS J031948.15+413042.1 | 13.492 | 12.030 | 11.314 | 10.981 | 10.720 |
| NVSS J033529+195621 | - | - | - | - | - | - |
| NVSS J040845+001306 | SDSS J040845.31+001307.2 | 17.278 | 15.288 | 14.234 | 13.644 | 13.133 |
| NVSS J055437+271126 | - | - | - | - | - | - |
| NVSS J073755+264652 | SDSS J073755.33+264652.6 | 21.214 | 19.746 | 18.477 | 17.902 | 17.394 |
| 4C -06.18 | - | - | - | - | - | - |
| NVSS J080101-075121 | SDSS J080101.20-075123.3 | 24.094 | 20.079 | 19.107 | 18.560 | 18.200 |
| NVSS J085521+575143 | SDSS J085521.37+575144.1 | 22.514 | 21.667 | 20.140 | 19.547 | 19.198 |
| NVSS J092351+281527 | SDSS J092351.52+281525.1 | 19.698 | 19.198 | 19.091 | 19.021 | 18.808 |
| NVSS J093150+254034 | - | - | - | - | - | - |
| NVSS J094208+135152 | SDSS J094208.05+135154.9 | 20.724 | 19.471 | 18.889 | 18.614 | 18.536 |
| NVSS J095058+375758 | SDSS J095058.69+375758.8 | 17.847 | 16.194 | 15.342 | 14.852 | 14.450 |
| NVSS J095812+112643 | SDSS J095812.32+112642.5 | 24.484 | 22.480 | 21.018 | 20.518 | 19.505 |
| NVSS J100755+405519 | SDSS J100755.68+405518.5 | 24.644 | 22.095 | 21.401 | 20.895 | 21.325 |
| NVSS J104941+133255 | SDSS J104941.09+133255.6 | 19.841 | 18.827 | 18.713 | 18.741 | 18.569 |
| NVSS J112832+583346 | SDSS J112833.41+583346.2 | 14.333 | 13.368 | 12.559 | 12.326 | 11.979 |
| NVSS J115948+582020 | SDSS J115948.76+582020.0 | 22.127 | 21.688 | 20.957 | 20.674 | 20.773 |
| NVSS J134035+444817 | SDSS J134035.20+444817.3 | 17.999 | 16.776 | 16.164 | 15.739 | 15.457 |
| 4C +57.23 | SDSS J135400.09+565004.9 | 24.108 | 23.173 | 22.603 | 21.732 | 22.675 |
| NVSS J141314-031227 | SDSS J141314.87-031227.3 | 14.644 | 12.898 | 12.019 | 11.385 | 11.268 |
| NVSS J141558+132024 | SDSS J141558.81+132023.7 | 22.064 | 20.518 | 19.049 | 18.496 | 18.056 |
| NVSS J160332+171158 | SDSS J160332.08+171155.3 | 16.276 | 14.374 | 13.432 | 12.981 | 12.716 |
| NGC 6150 | SDSS J162549.96+402919.3 | 15.697 | 13.800 | 12.974 | 12.536 | 12.204 |
| NVSS J225900+274356 | SDSS J225900.30+274356.7 | 19.479 | 17.964 | 17.154 | 16.642 | 16.390 |
7 Summary
In this paper, we present a purely blind search for extragalactic Hi 21-cm absorption lines in drift-scan data from FAST. We have examined 1616.93 hours of data from the CRAFTS and FASHI surveys, which covered 7456.8 deg2 of the sky, with a total of 84533 radio sources with a flux density greater than 12 mJy were searched for Hi absorber. The data of both linear polarization of all 19 beams were processed. All data in the frequency range of 1.05 GHz to 1.45 GHz were searched. Assuming an Hi spin temperature to source covering fraction ratio of = 100 K, the total comoving absorption path length spanned by our data and sensitive to the Damped Lyman Absorbers (DLAs; ) is = 4.07 () for intervening absorption. For associated absorption, the corresponding value is = 1.81 (). A matched-filtering approach was used to detect Hi absorption profiles.
We successfully detected 14 known Hi absorbers and 20 new Hi 21-cm absorbers, comprising 14 associated systems, 11 intervening systems, and 9 systems with undetermined classifications. We fit the Hi profiles with multi-components Gaussian functions, and calculate the redshift, width, flux density, optical depth, and Hi column densities for each source. Statistical analysis reveals that in our sample the associated systems tend to be hosted by red (gr0.7) galaxies at lower redshifts, whereas the galaxies hosting intervening Hi absorption are typically found at higher redshifts and are of a bluer (gr0.7) type. Furthermore, it has been demonstrated that associated Hi 21-cm absorption connected to compact radio sources display higher N compared to those tied to extended radio sources. Through spectral stacking, mean peak optical path, mean velocity-integrated optical path , mean FWHM and mean Hi column density N are measured to be 0.46 and 0.34; 25.85 and 4.62 ; 39.80 and 8.95 ; 0.470 and 0.085 T 1020cm-2K-1, for associated and intervening samples, respectively.
| Radio Source | type | Component | czpeak | FWHM | |||||
| () | () | (mJy) | (mJy) | () | (1020cm-2K-1) | ||||
| 1 | 79415.64 | 11.41 | -31.77 | -385.78 | 0.017 | 0.21 | 0.004 | ||
| 2 | 79375.11 | 38.00 | -78.81 | -3187.88 | 0.043 | 1.71 | 0.031 | ||
| 3 | 79314.51 | 29.34 | -463.97 | -14491.27 | 0.282 | 8.44 | 0.154 | ||
| 4C +56.02 | unknown | 4 | 79297.69 | 16.00 | -354.86 | -6044.42 | 0.208 | 3.44 | 0.063 |
| 5 | 79311.79 | 58.58 | -149.29 | -9309.75 | 0.082 | 5.07 | 0.092 | ||
| 6 | 79332.23 | 15.91 | -190.75 | -3229.48 | 0.106 | 1.77 | 0.032 | ||
| Total | 79301.46 | 46.36 | -709.27 | -36648.59 | 0.470 | 22.55 | 0.410 | ||
| 1 | 17829.41 | 75.55 | -24.04 | -1933.34 | 0.009 | 0.73 | 0.013 | ||
| 2 | 17908.22 | 76.76 | -60.15 | -4914.73 | 0.023 | 1.88 | 0.034 | ||
| 3 | 17973.00 | 116.80 | -73.72 | -9165.34 | 0.028 | 3.51 | 0.064 | ||
| 4C +31.04 | associated | 4 | 18131.58 | 6.38 | -7.31 | -49.67 | 0.003 | 0.02 | 0.0003 |
| 5 | 18150.66 | 14.42 | -41.87 | -642.47 | 0.016 | 0.24 | 0.004 | ||
| 6 | 18154.05 | 6.13 | -40.82 | -266.41 | 0.016 | 0.10 | 0.002 | ||
| Total | 17926.22 | 147.44 | -99.15 | -16971.96 | 0.038 | 6.51 | 0.119 | ||
| 1 | 8118.95 | 23.50 | -356.58 | -8918.10 | 0.016 | 0.39 | 0.007 | ||
| 2 | 8120.26 | 3.82 | -436.91 | -1778.07 | 0.019 | 0.08 | 0.001 | ||
| 3C 84 | intervening | 3 | 8113.26 | 5.56 | -2434.58 | -14416.67 | 0.113 | 0.66 | 0.012 |
| 4 | 8105.77 | 4.26 | -438.45 | -1985.99 | 0.019 | 0.09 | 0.002 | ||
| Total | 8113.30 | 6.13 | -2738.08 | -27098.83 | 0.128 | 1.23 | 0.022 | ||
| 1 | 95443.10 | 50.66 | -29.36 | -1583.30 | 0.004 | 0.20 | 0.004 | ||
| 2 | 95566.33 | 24.10 | -58.37 | -1497.50 | 0.007 | 0.19 | 0.003 | ||
| 3 | 95587.42 | 154.72 | -57.11 | -9405.60 | 0.007 | 1.17 | 0.021 | ||
| 4C -06.18 | unknown | 4 | 95683.99 | 29.69 | -17.06 | -539.07 | 0.001 | 0.07 | 0.001 |
| 5 | 95727.47 | 16.85 | -107.79 | -1933.21 | 0.013 | 0.24 | 0.004 | ||
| 6 | 95721.51 | 85.94 | -113.93 | -10422.14 | 0.014 | 1.30 | 0.024 | ||
| Total | 95727.15 | 48.92 | -226.25 | -25380.82 | 0.028 | 3.16 | 0.058 | ||
| 1 | 7737.48 | 3.40 | -125.88 | -455.98 | 0.183 | 0.65 | 0.012 | ||
| NVSS J085521+575143 | intervening | 2 | 7739.16 | 6.84 | -30.34 | -220.94 | 0.041 | 0.30 | 0.005 |
| Total | 7737.56 | 3.80 | -151.77 | -676.91 | 0.226 | 0.97 | 0.018 | ||
| 1 | 3093.54 | 60.79 | -20.16 | -1304.38 | - | - | - | ||
| NVSS J112832+583346 | associated | 2 | 3183.79 | 75.05 | -22.33 | -1783.97 | - | - | - |
| Total | 3183.50 | 155.79 | -22.38 | -3088.35 | - | - | - | ||
| 1 | 19615.96 | 7.83 | -25.23 | -210.20 | 1.193 | 8.29 | 0.151 | ||
| NVSS J134035+444817 | associated | 2 | 19601.25 | 1.72 | -13.69 | -25.04 | 0.475 | 0.81 | 0.015 |
| Total | 19615.96 | 7.83 | -25.23 | -235.23 | 1.193 | 9.10 | 0.166 | ||
| 1 | 28585.67 | 30.58 | -26.07 | -848.63 | 0.038 | 1.22 | 0.022 | ||
| 2 | 28543.29 | 3.70 | -14.97 | -59.03 | 0.021 | 0.08 | 0.002 | ||
| 4C +57.23 | intervening | 3 | 28554.39 | 11.84 | -90.89 | -1146.00 | 0.137 | 1.70 | 0.031 |
| Total | 28554.46 | 12.14 | -92.33 | -2053.66 | 0.140 | 3.00 | 0.055 | ||
| 1 | 1793.21 | 36.34 | -20.44 | -790.80 | 0.062 | 2.38 | 0.043 | ||
| 2 | 1833.80 | 85.90 | -16.48 | -1506.73 | 0.050 | 4.52 | 0.082 | ||
| 3 | 1750.82 | 32.40 | -6.00 | -206.99 | 0.018 | 0.61 | 0.011 | ||
| NVSS J141314-031227 | associated | 4 | 1967.02 | 7.70 | -10.62 | -87.11 | 0.032 | 0.26 | 0.005 |
| 5 | 1988.83 | 22.67 | -14.10 | -340.29 | 0.042 | 1.02 | 0.019 | ||
| Total | 1796.40 | 76.72 | -29.77 | -2931.91 | 0.092 | 8.87 | 0.162 | ||
| 1 | 73959.81 | 14.00 | -339.23 | -5055.36 | 0.285 | 4.08 | 0.074 | ||
| 2 | 73992.67 | 101.64 | -22.01 | -2381.19 | 0.016 | 1.75 | 0.032 | ||
| NVSS J141558+132024 | intervening | 3 | 73947.99 | 8.43 | -122.28 | -1097.46 | 0.094 | 0.83 | 0.015 |
| 4 | 73961.54 | 25.41 | -243.32 | -6580.72 | 0.196 | 5.15 | 0.093 | ||
| Total | 73960.11 | 21.20 | -596.96 | -15114.73 | 0.574 | 12.97 | 0.236 | ||
| 1 | 10205.69 | 6.00 | -5.00 | -31.91 | 0.007 | 0.05 | 0.001 | ||
| NVSS J160332+171158 | associated | 2 | 10223.49 | 29.06 | -16.26 | -503.11 | 0.024 | 0.73 | 0.013 |
| 3 | 10219.07 | 4.73 | -3.81 | -19.17 | 0.006 | 0.03 | 0.001 | ||
| Total | 10219.51 | 31.61 | -19.16 | -554.19 | 0.028 | 0.81 | 0.015 |
| Radio Source | type | Component | czpeak | FWHM | |||||
| () | () | (mJy) | (mJy) | () | (1020cm-2K-1) | ||||
| 1 | 79032.90 | 3.12 | -166.16 | -552.68 | 0.160 | 0.52 | 0.009 | ||
| 2 | 79035.75 | 6.31 | -78.56 | -528.11 | 0.072 | 0.48 | 0.009 | ||
| NVSS J004219+570836 | intervening | 3 | 79039.80 | 17.01 | -12.01 | -217.41 | 0.011 | 0.19 | 0.004 |
| Total | 79033.10 | 4.24 | -220.14 | -1298.20 | 0.218 | 1.22 | 0.022 | ||
| 1 | 76385.99 | 13.53 | -12.45 | -179.35 | 0.245 | 3.40 | 0.062 | ||
| NVSS J011322+251852 | intervening | 2 | 76391.38 | 34.84 | -9.53 | -353.61 | 0.182 | 6.56 | 0.119 |
| 3 | 76424.11 | 7.73 | -3.00 | -24.69 | 0.054 | 0.44 | 0.008 | ||
| Total | 76386.53 | 19.39 | -21.43 | -557.65 | 0.467 | 11.05 | 0.201 | ||
| 1 | 75166.19 | 50.14 | -3.62 | -193.46 | 0.015 | 0.78 | 0.014 | ||
| 2 | 75181.06 | 30.50 | -16.11 | -523.09 | 0.067 | 2.16 | 0.039 | ||
| 4C +26.07 | unknown | 3 | 75199.14 | 13.39 | -12.35 | -175.96 | 0.051 | 0.72 | 0.013 |
| 4 | 75218.03 | 15.16 | -2.32 | -37.49 | 0.009 | 0.15 | 0.003 | ||
| Total | 75196.87 | 41.89 | -20.34 | -930.00 | 0.086 | 3.87 | 0.070 | ||
| 1 | 87558.37 | 82.67 | -11.30 | -994.05 | 0.223 | 18.96 | 0.345 | ||
| NVSS J033529+195621 | unknown | 2 | 87611.78 | 73.33 | -9.33 | -728.67 | 0.180 | 13.70 | 0.249 |
| Total | 87583.93 | 112.41 | -14.92 | -1722.72 | 0.306 | 33.97 | 0.618 | ||
| 1 | 8938.22 | 56.91 | -11.79 | -714.16 | 0.277 | 16.08 | 0.293 | ||
| NVSS J040845+001306 | associated | 2 | 8928.81 | 4.44 | -15.36 | -72.54 | 0.378 | 1.69 | 0.031 |
| 3 | 8937.82 | 5.33 | -5.48 | -31.09 | 0.119 | 0.66 | 0.012 | ||
| Total | 8928.85 | 16.12 | -26.30 | -817.79 | 0.774 | 19.24 | 0.350 | ||
| 1 | 14282.00 | 48.48 | -6.35 | -327.55 | 0.420 | 20.37 | 0.371 | ||
| NVSS J055437+271126 | unknown | 2 | 14340.73 | 63.71 | -8.24 | -558.77 | 0.589 | 36.61 | 0.666 |
| 3 | 14378.91 | 21.12 | -2.36 | -53.12 | 0.137 | 3.01 | 0.055 | ||
| Total | 14339.11 | 121.96 | -8.36 | -939.43 | 0.601 | 62.94 | 1.145 | ||
| NVSS J073755+264652 | associated | 1 | 71621.72 | 13.92 | -36.38 | -538.85 | 1.020 | 12.95 | 0.236 |
| 1 | 27414.63 | 54.20 | -29.29 | -1689.65 | 0.282 | 15.63 | 0.284 | ||
| NVSS J080101-075121 | unknown | 2 | 27442.86 | 14.36 | -28.11 | -429.66 | 0.270 | 3.96 | 0.072 |
| Total | 27441.86 | 54.57 | -42.29 | -2119.31 | 0.439 | 20.19 | 0.367 | ||
| 1 | 99217.81 | 13.36 | -17.79 | -252.99 | 0.067 | 0.95 | 0.017 | ||
| NVSS J092351+281527 | intervening | 2 | 99210.55 | 3.01 | -15.10 | -48.42 | 0.057 | 0.18 | 0.003 |
| Total | 99210.74 | 14.20 | -23.12 | -301.41 | 0.089 | 1.14 | 0.021 | ||
| NVSS J093150+254034 | intervening | 1 | 80339.23 | 2.64 | -50.71 | -142.47 | 0.504 | 1.31 | 0.024 |
| 1 | 39901.09 | 4.25 | -74.18 | -335.38 | 0.057 | 0.26 | 0.005 | ||
| NVSS J094208+135152 | intervening | 2 | 39906.72 | 3.41 | -88.03 | -319.36 | 0.068 | 0.24 | 0.004 |
| 3 | 39924.43 | 4.13 | -70.81 | -311.00 | 0.054 | 0.24 | 0.004 | ||
| Total | 39906.70 | 9.16 | -88.61 | -965.74 | 0.068 | 0.75 | 0.013 | ||
| NVSS J095058+375758 | associated | 1 | 12202.08 | 35.23 | -41.67 | -1562.53 | 0.975 | 31.57 | 0.574 |
| NVSS J104941+133255 | intervening | 1 | 73958.32 | 5.44 | -52.97 | -307.02 | 0.678 | 3.55 | 0.065 |
| 1 | 95828.71 | 7.69 | -55.91 | -457.67 | 0.264 | 2.08 | 0.038 | ||
| NVSS J095812+112643 | unknown | 2 | 95827.53 | 20.26 | -24.27 | -523.28 | 0.106 | 2.25 | 0.041 |
| Total | 95828.64 | 9.54 | -79.97 | -980.95 | 0.403 | 4.57 | 0.083 | ||
| 1 | 67051.58 | 8.10 | -6.27 | -54.01 | 0.114 | 0.96 | 0.018 | ||
| 2 | 67079.60 | 7.77 | -26.94 | -222.86 | 0.620 | 4.67 | 0.085 | ||
| 3 | 67088.98 | 8.93 | -14.83 | -141.02 | 0.293 | 2.67 | 0.049 | ||
| NVSS J100755+405519 | unknown | 4 | 67116.78 | 28.37 | -47.31 | -1428.72 | 1.667 | 39.01 | 0.710 |
| 5 | 67125.65 | 6.89 | -19.95 | -146.25 | 0.419 | 2.88 | 0.052 | ||
| 6 | 67138.74 | 6.83 | -19.96 | -145.13 | 0.419 | 2.86 | 0.052 | ||
| Total | 67124.71 | 34.34 | -57.04 | -2138.00 | 3.811 | 64.69 | 1.177 | ||
| 1 | 71474.51 | 3.31 | -107.07 | -376.98 | 0.094 | 0.33 | 0.006 | ||
| NVSS J115948+582020 | intervening | 2 | 71475.81 | 12.64 | -459.87 | -6189.24 | 0.488 | 6.10 | 0.111 |
| 3 | 71478.44 | 8.31 | -264.38 | -2337.63 | 0.251 | 2.14 | 0.039 | ||
| Total | 71475.69 | 11.02 | -729.98 | -8903.86 | 0.948 | 10.02 | 0.182 | ||
| NVSS J162549+402921 | associated | 1 | 8776.94 | 12.97 | -10.91 | -150.73 | 0.174 | 2.35 | 0.043 |
| 1 | 42850.83 | 336.00 | -17.82 | -6374.05 | 0.037 | 13.01 | 0.237 | ||
| NVSS J225900+274356 | associated | 2 | 42754.27 | 61.95 | -34.66 | -2285.23 | 0.072 | 4.72 | 0.086 |
| 3 | 42738.31 | 113.78 | -48.23 | -5840.69 | 0.102 | 12.20 | 0.222 | ||
| Total | 42750.67 | 100.48 | -94.94 | -14499.97 | 0.212 | 30.87 | 0.562 |
Acknowledgements
This work is supported by the National SKA Program of China (Nos. 2022SKA0110100 and 2022SKA0110101), the NSFC International (Regional) Cooperation and Exchange Project (No. 12361141814), and NSFC grants (Nos. 11773034, 11973047, 12203061, 12303004), the CAS Strategic Priority Research Program XDA15020200, and the NSFC grant 11773034. The authors thank Sneana Stanimirovi and James R. Allison for helpful discussion.
Data Availability
The radio data analyzed in this work can be accessed by sending a request to the FAST Data Centre or the corresponding authors of this paper.
References
- Aditya et al. (2024) Aditya, J. N. H. S., Yoon, H., Allison, J. R., et al. 2024, MNRAS, 527, 8511, doi: 10.1093/mnras/stad3722
- Allison (2021) Allison, J. R. 2021, MNRAS, 503, 985, doi: 10.1093/mnras/stab518
- Allison et al. (2016) Allison, J. R., Zwaan, M. A., Duchesne, S. W., & Curran, S. J. 2016, MNRAS, 462, 1341, doi: 10.1093/mnras/stw1722
- Allison et al. (2015) Allison, J. R., Sadler, E. M., Moss, V. A., et al. 2015, MNRAS, 453, 1249, doi: 10.1093/mnras/stv1532
- Allison et al. (2020) Allison, J. R., Sadler, E. M., Bellstedt, S., et al. 2020, MNRAS, 494, 3627, doi: 10.1093/mnras/staa949
- Allison et al. (2022) Allison, J. R., Sadler, E. M., Amaral, A. D., et al. 2022, PASA, 39, e010, doi: 10.1017/pasa.2022.3
- Augarde & Lequeux (1985) Augarde, R., & Lequeux, J. 1985, A&A, 147, 273
- Baan & Haschick (1990) Baan, W. A., & Haschick, A. 1990, ApJ, 364, 65, doi: 10.1086/169385
- Becker et al. (1995) Becker, R. H., White, R. L., & Helfand, D. J. 1995, ApJ, 450, 559, doi: 10.1086/176166
- Beichman et al. (1981) Beichman, C. A., Neugebauer, G., Soifer, B. T., et al. 1981, Nature, 293, 711, doi: 10.1038/293711a0
- Biggs et al. (2016) Biggs, A. D., Zwaan, M. A., Hatziminaoglou, E., Péroux, C., & Liske, J. 2016, MNRAS, 462, 2819, doi: 10.1093/mnras/stw1786
- Bordoloi et al. (2022) Bordoloi, R., O’Meara, J. M., Sharon, K., et al. 2022, Nature, 606, 59, doi: 10.1038/s41586-022-04616-1
- Bregman et al. (1981) Bregman, J. N., Lebofsky, M. J., Aller, M. F., et al. 1981, Nature, 293, 714, doi: 10.1038/293714a0
- Carilli et al. (1992) Carilli, C. L., Perlman, E. S., & Stocke, J. T. 1992, ApJ, 400, L13, doi: 10.1086/186637
- Casoli et al. (1989) Casoli, F., Combes, F., Augarde, R., Figon, P., & Martin, J. M. 1989, A&A, 224, 31
- Caulet et al. (1992) Caulet, A., Woodgate, B. E., Brown, L. W., et al. 1992, ApJ, 388, 301, doi: 10.1086/171153
- Cohen et al. (2007) Cohen, A. S., Lane, W. M., Cotton, W. D., et al. 2007, AJ, 134, 1245, doi: 10.1086/520719
- Combes et al. (2023) Combes, F., Gupta, N., Muller, S., et al. 2023, A&A, 671, A43, doi: 10.1051/0004-6361/202245482
- Curran (2017) Curran, S. J. 2017, A&A, 606, A56, doi: 10.1051/0004-6361/201731666
- Curran et al. (2016) Curran, S. J., Duchesne, S. W., Divoli, A., & Allison, J. R. 2016, MNRAS, 462, 4197, doi: 10.1093/mnras/stw1938
- Darling (2012) Darling, J. 2012, ApJ, 761, L26, doi: 10.1088/2041-8205/761/2/L26
- de Vries et al. (2009) de Vries, N., Snellen, I. A. G., Schilizzi, R. T., Mack, K. H., & Kaiser, C. R. 2009, A&A, 498, 641, doi: 10.1051/0004-6361/200811145
- De Young et al. (1973) De Young, D. S., Roberts, M. S., & Saslaw, W. C. 1973, ApJ, 185, 809, doi: 10.1086/152456
- Deka et al. (2023) Deka, P. P., Gupta, N., Chen, H. W., et al. 2023, arXiv e-prints, arXiv:2311.00336, doi: 10.48550/arXiv.2311.00336
- Dickey (1986) Dickey, J. M. 1986, ApJ, 300, 190, doi: 10.1086/163793
- Dickey (1997) —. 1997, AJ, 113, 1939, doi: 10.1086/118408
- Dickey & Benson (1982) Dickey, J. M., & Benson, J. M. 1982, AJ, 87, 278, doi: 10.1086/113103
- Douglas et al. (1996) Douglas, J. N., Bash, F. N., Bozyan, F. A., Torrence, G. W., & Wolfe, C. 1996, AJ, 111, 1945, doi: 10.1086/117932
- Dunning et al. (2017) Dunning, A., Bowen, M., Castillo, S., et al. 2017, in 2017 XXXIInd General Assembly and Scientific Symposium of the International Union of Radio Science (URSI GASS), 1–4, doi: 10.23919/URSIGASS.2017.8105012
- Dutta (2019) Dutta, R. 2019, Journal of Astrophysics and Astronomy, 40, 41, doi: 10.1007/s12036-019-9610-5
- Dutta et al. (2018) Dutta, R., Srianand, R., & Gupta, N. 2018, MNRAS, 480, 947, doi: 10.1093/mnras/sty1872
- Fischer et al. (1983) Fischer, J., Simon, M., Benson, J., & Solomon, P. M. 1983, ApJ, 273, L27, doi: 10.1086/184123
- Gallimore et al. (1999) Gallimore, J. F., Baum, S. A., O’Dea, C. P., Pedlar, A., & Brinks, E. 1999, ApJ, 524, 684, doi: 10.1086/307853
- Gehrz et al. (1983) Gehrz, R. D., Sramek, R. A., & Weedman, D. W. 1983, ApJ, 267, 551, doi: 10.1086/160892
- Geréb et al. (2015) Geréb, K., Maccagni, F. M., Morganti, R., & Oosterloo, T. A. 2015, A&A, 575, A44, doi: 10.1051/0004-6361/201424655
- Geréb et al. (2014) Geréb, K., Morganti, R., & Oosterloo, T. A. 2014, A&A, 569, A35, doi: 10.1051/0004-6361/201423999
- Giovannini et al. (2001) Giovannini, G., Cotton, W. D., Feretti, L., Lara, L., & Venturi, T. 2001, ApJ, 552, 508, doi: 10.1086/320581
- Giroletti et al. (2003) Giroletti, M., Giovannini, G., Taylor, G. B., et al. 2003, A&A, 399, 889, doi: 10.1051/0004-6361:20021821
- Gupta et al. (2006) Gupta, N., Salter, C. J., Saikia, D. J., Ghosh, T., & Jeyakumar, S. 2006, MNRAS, 373, 972, doi: 10.1111/j.1365-2966.2006.11064.x
- Gupta et al. (2016) Gupta, N., Srianand, R., Baan, W., et al. 2016, in MeerKAT Science: On the Pathway to the SKA, 14. https://arxiv.org/abs/1708.07371
- Gupta et al. (2021) Gupta, N., Jagannathan, P., Srianand, R., et al. 2021, ApJ, 907, 11, doi: 10.3847/1538-4357/abcb85
- Healey et al. (2007) Healey, S. E., Romani, R. W., Taylor, G. B., et al. 2007, ApJS, 171, 61, doi: 10.1086/513742
- Heiles & Troland (2003) Heiles, C., & Troland, T. H. 2003, ApJ, 586, 1067, doi: 10.1086/367828
- Helmboldt et al. (2007) Helmboldt, J. F., Taylor, G. B., Tremblay, S., et al. 2007, ApJ, 658, 203, doi: 10.1086/511005
- Helou et al. (1991) Helou, G., Madore, B. F., Schmitz, M., et al. 1991, The NASA/IPAC extragalactic database., ed. M. A. Albrecht & D. Egret, Vol. 171, 89–106, doi: 10.1007/978-94-011-3250-3_10
- Hu et al. (2020) Hu, W., Catinella, B., Cortese, L., et al. 2020, MNRAS, 493, 1587, doi: 10.1093/mnras/staa257
- Hu et al. (2021) Hu, W., Cortese, L., Staveley-Smith, L., et al. 2021, MNRAS, 507, 5580, doi: 10.1093/mnras/stab2431
- Hu et al. (2019) Hu, W., Hoppmann, L., Staveley-Smith, L., et al. 2019, MNRAS, 489, 1619, doi: 10.1093/mnras/stz2038
- Hu et al. (2023) Hu, W., Wang, Y., Li, Y., et al. 2023, A&A, 675, A40, doi: 10.1051/0004-6361/202245549
- Jiang et al. (2020) Jiang, P., Tang, N.-Y., Hou, L.-G., et al. 2020, Research in Astronomy and Astrophysics, 20, 064, doi: 10.1088/1674-4527/20/5/64
- Jiao et al. (2020) Jiao, K., Zhang, J.-C., Zhang, T.-J., et al. 2020, J. Cosmology Astropart. Phys, 2020, 054, doi: 10.1088/1475-7516/2020/01/054
- Jing et al. (2024) Jing, Y., Wang, J., Xu, C., et al. 2024, arXiv e-prints, arXiv:2401.17364, doi: 10.48550/arXiv.2401.17364
- Kang et al. (2023) Kang, J., Lu, C.-Z., Zhang, T., & Zhu, M. 2023, arXiv e-prints, arXiv:2308.08851, doi: 10.48550/arXiv.2308.08851
- Kloeckner et al. (2015) Kloeckner, H. R., Obreschkow, D., Martins, C., et al. 2015, in Advancing Astrophysics with the Square Kilometre Array (AASKA14), 27. https://arxiv.org/abs/1501.03822
- Lacy et al. (2020) Lacy, M., Baum, S. A., Chandler, C. J., et al. 2020, PASP, 132, 035001, doi: 10.1088/1538-3873/ab63eb
- Li et al. (2018) Li, D., Wang, P., Qian, L., et al. 2018, IEEE Microwave Magazine, 19, 112, doi: 10.1109/MMM.2018.2802178
- Li et al. (2023) Li, Y., Wang, Y., Deng, F., et al. 2023, ApJ, 954, 139, doi: 10.3847/1538-4357/ace896
- Lu et al. (2023) Lu, C.-Z., Zhang, T., & Zhang, T.-J. 2023, MNRAS, 521, 3150, doi: 10.1093/mnras/stad761
- Ma et al. (2019) Ma, Z., Xu, H., Zhu, J., et al. 2019, ApJS, 240, 34, doi: 10.3847/1538-4365/aaf9a2
- Maccagni et al. (2017) Maccagni, F. M., Morganti, R., Oosterloo, T. A., Geréb, K., & Maddox, N. 2017, A&A, 604, A43, doi: 10.1051/0004-6361/201730563
- Martin et al. (2005) Martin, D. C., Fanson, J., Schiminovich, D., et al. 2005, ApJ, 619, L1, doi: 10.1086/426387
- McCarthy et al. (1997) McCarthy, P. J., Miley, G. K., de Koff, S., et al. 1997, ApJS, 112, 415, doi: 10.1086/313035
- McHardy et al. (1991) McHardy, I. M., Abraham, R. G., Crawford, C. S., et al. 1991, MNRAS, 249, 742, doi: 10.1093/mnras/249.4.742
- Momjian et al. (2002) Momjian, E., Romney, J. D., & Troland, T. H. 2002, The Astrophysical Journal, 566, 195, doi: 10.1086/337993
- Morganti & Oosterloo (2018) Morganti, R., & Oosterloo, T. 2018, A&A Rev., 26, 4, doi: 10.1007/s00159-018-0109-x
- Murray et al. (2018) Murray, C. E., Stanimirović, S., Goss, W. M., et al. 2018, ApJS, 238, 14, doi: 10.3847/1538-4365/aad81a
- Myers et al. (2015) Myers, A. D., Palanque-Delabrouille, N., Prakash, A., et al. 2015, ApJS, 221, 27, doi: 10.1088/0067-0049/221/2/27
- Nagar et al. (2002) Nagar, N. M., Oliva, E., Marconi, A., & Maiolino, R. 2002, A&A, 391, L21, doi: 10.1051/0004-6361:20021039
- Nair & Abraham (2010) Nair, P. B., & Abraham, R. G. 2010, ApJS, 186, 427, doi: 10.1088/0067-0049/186/2/427
- Nan et al. (2011) Nan, R., Li, D., Jin, C., et al. 2011, International Journal of Modern Physics D, 20, 989, doi: 10.1142/S0218271811019335
- O’Dea et al. (1987) O’Dea, C. P., Sarazin, C. L., & Owen, F. N. 1987, ApJ, 316, 113, doi: 10.1086/165183
- Oh et al. (2018) Oh, K., Koss, M., Markwardt, C. B., et al. 2018, ApJS, 235, 4, doi: 10.3847/1538-4365/aaa7fd
- Ostorero et al. (2017) Ostorero, L., Morganti, R., Diaferio, A., et al. 2017, ApJ, 849, 34, doi: 10.3847/1538-4357/aa8ef6
- Perlman et al. (1996) Perlman, E. S., Carilli, C. L., Stocke, J. T., & Conway, J. 1996, AJ, 111, 1839, doi: 10.1086/117922
- Perlman et al. (2002) Perlman, E. S., Stocke, J. T., Carilli, C. L., et al. 2002, AJ, 124, 2401, doi: 10.1086/344109
- Perlman et al. (2001) Perlman, E. S., Stocke, J. T., Conway, J., & Reynolds, C. 2001, AJ, 122, 536, doi: 10.1086/321149
- Rahmani et al. (2012) Rahmani, H., Srianand, R., Gupta, N., et al. 2012, MNRAS, 425, 556, doi: 10.1111/j.1365-2966.2012.21503.x
- Readhead et al. (2021) Readhead, A. C. S., Ravi, V., Liodakis, I., et al. 2021, ApJ, 907, 61, doi: 10.3847/1538-4357/abd08c
- Roger et al. (1978) Roger, R. S., Caswell, J. L., Murray, J. D., Cole, D. J., & Cooke, D. J. 1978, MNRAS, 182, 209, doi: 10.1093/mnras/182.2.209
- Rubin (1978) Rubin, V. C. 1978, ApJ, 224, L55, doi: 10.1086/182758
- Saintonge (2007) Saintonge, A. 2007, AJ, 133, 2087, doi: 10.1086/513515
- Saraf et al. (2023) Saraf, M., Wong, O. I., Cortese, L., & Koribalski, B. S. 2023, MNRAS, 519, 4128, doi: 10.1093/mnras/stac3695
- Skrutskie et al. (2006) Skrutskie, M. F., Cutri, R. M., Stiening, R., et al. 2006, AJ, 131, 1163, doi: 10.1086/498708
- Stern et al. (2012) Stern, D., Assef, R. J., Benford, D. J., et al. 2012, ApJ, 753, 30, doi: 10.1088/0004-637X/753/1/30
- Struve & Conway (2012) Struve, C., & Conway, J. E. 2012, A&A, 546, A22, doi: 10.1051/0004-6361/201218768
- Su et al. (2022) Su, R., Sadler, E. M., Allison, J. R., et al. 2022, MNRAS, 516, 2947, doi: 10.1093/mnras/stac2257
- Thuan & Wadiak (1982) Thuan, T. X., & Wadiak, E. J. 1982, ApJ, 252, 125, doi: 10.1086/159539
- van Gorkom et al. (1989) van Gorkom, J. H., Knapp, G. R., Ekers, R. D., et al. 1989, AJ, 97, 708, doi: 10.1086/115016
- Varenius et al. (2017) Varenius, E., Costagliola, F., Klöckner, H. R., et al. 2017, A&A, 607, A43, doi: 10.1051/0004-6361/201629819
- Weedman (1972) Weedman, D. W. 1972, ApJ, 171, 5, doi: 10.1086/151250
- Wilson et al. (1976) Wilson, A. S., Penston, M. V., Fosbury, R. A. E., & Boksenberg, A. 1976, MNRAS, 177, 673, doi: 10.1093/mnras/177.3.673
- Wolfe et al. (2005) Wolfe, A. M., Gawiser, E., & Prochaska, J. X. 2005, ARA&A, 43, 861, doi: 10.1146/annurev.astro.42.053102.133950
- Wolfire et al. (2003) Wolfire, M. G., McKee, C. F., Hollenbach, D., & Tielens, A. G. G. M. 2003, ApJ, 587, 278, doi: 10.1086/368016
- Wright et al. (2010) Wright, E. L., Eisenhardt, P. R. M., Mainzer, A. K., et al. 2010, AJ, 140, 1868, doi: 10.1088/0004-6256/140/6/1868
- York et al. (2000) York, D. G., Adelman, J., Anderson, John E., J., et al. 2000, AJ, 120, 1579, doi: 10.1086/301513
- Yu et al. (2014) Yu, H.-R., Zhang, T.-J., & Pen, U.-L. 2014, Phys. Rev. Lett., 113, 041303, doi: 10.1103/PhysRevLett.113.041303
- Yu et al. (2023) Yu, Q., Fang, T., Wang, J., & Wu, J. 2023, ApJ, 952, 144, doi: 10.3847/1538-4357/acdb76
- Zhang et al. (2021) Zhang, B., Zhu, M., Wu, Z.-Z., et al. 2021, MNRAS, 503, 5385, doi: 10.1093/mnras/stab754
- Zhang et al. (2024) Zhang, C.-P., Zhu, M., Jiang, P., et al. 2024, Science China Physics, Mechanics, and Astronomy, 67, 219511, doi: 10.1007/s11433-023-2219-7
- Zheng et al. (2020) Zheng, Z., Li, D., Sadler, E. M., Allison, J. R., & Tang, N. 2020, MNRAS, 499, 3085, doi: 10.1093/mnras/staa3033
- Zovaro et al. (2019) Zovaro, H. R. M., Sharp, R., Nesvadba, N. P. H., et al. 2019, MNRAS, 484, 3393, doi: 10.1093/mnras/stz233
- Zwaan et al. (2015) Zwaan, M. A., Liske, J., Péroux, C., et al. 2015, MNRAS, 453, 1268, doi: 10.1093/mnras/stv1717