Towards a universal analytical model for Population III star formation: interplay between feedback and fragmentation
1Institute of Astronomy, University of Cambridge, Madingley Road, Cambridge, CB3 0HA, UK
2Perimeter Institute for Theoretical Physics, Waterloo, Ontario, N2L 2Y5, Canada
3Kavli Institute for Astronomy and Astrophysics, Peking University, Beijing 100871, People’s Republic of China
4Department of Astronomy, School of Science, University of Tokyo, Tokyo 113-0033, Japan
5Department of Physics, Kyoto University, Sakyo, Kyoto 606-8502, Japan
6Department of Astronomy, University of Texas, Austin, TX 78712, USA
7Weinberg Institute for Theoretical Physics, University of Texas, Austin, TX 78712, USA
8Department of Physics, School of Science, The University of Tokyo, 7-3-1 Hongo, Bunkyo, Tokyo 113-0033, Japan
9Research Center for the Early Universe, School of Science, The University of Tokyo, 7-3-1 Hongo, Bunkyo, Tokyo 113-0033, Japan
10Kavli Institute for the Physics and Mathematics of the Universe (WPI), The University of Tokyo, Kashiwa, Chiba 277-8583, Japan
Abstract
JWST has brought us new insights into Cosmic Dawn with tentative detection of the unique signatures of metal-free Population III (Pop III) stars, such as strong HeII emission, extremely blue UV spectrum, and enhanced nitrogen abundance. Self-consistent theoretical predictions of the formation rates, sites, and masses of Pop III stars are crucial for interpreting the observations, but are challenging due to complex physical processes operating over the large range of length scales involved. One solution is to combine analytical models for the small-scale star formation process with cosmological simulations that capture the large-scale physics such as structure formation, radiation backgrounds, and baryon-dark matter streaming motion that regulate the conditions of Pop III star formation. We build an analytical model to predict the final masses of Pop III stars/clusters from the properties of star-forming clouds, based on the key results of small-scale star formation simulations and stellar evolution models. Our model for the first time considers the interplay between feedback and fragmentation and covers different modes of Pop III star formation ranging from ordinary small () clusters in molecular-cooling clouds to massive () clusters containing supermassive () stars under violent collapse of atomic-cooling clouds with large gas accretion rates of . As an example, the model is applied to the Pop III star-forming clouds in the progenitors of typical haloes hosting high- luminous quasars ( at ), which shows that formation of Pop III massive clusters is common () in such biased () regions, and the resulting heavy black hole seeds from supermassive stars can account for a significant fraction of observed luminous () quasars at .
keywords:
stars: Population III – stars: black holes – dark ages, reionization, first stars1 Introduction
The first generation of so-called Population III (Pop III) stars, formed in metal-free primordial gas, are expected to be fundamentally different from present-day metal-enriched Population I/II (Pop I/II) stars (reviewed by, e.g., Bromm et al., 2009; Bromm, 2013; Loeb & Furlanetto, 2013; Haemmerlé et al., 2020; Klessen & Glover, 2023). Due to their pristine formation environments, Pop III stars tend to form in small clusters with a broad top-heavy initial mass function (IMF) extending up to a few according to small-scale (radiative) (magneto-) hydrodynamic simulations (e.g. Clark et al., 2011; Greif et al., 2011, 2012; Susa et al., 2014; Hirano et al., 2014, 2015, 2018; Stacy et al., 2013; Stacy & Bromm, 2014; Stacy et al., 2016; Hosokawa et al., 2016; Hirano & Bromm, 2017; Hirano et al., 2017; Suazo et al., 2019; Susa, 2019; Sugimura et al., 2020, 2023; McKee et al., 2020; Wollenberg et al., 2020; Park et al., 2021, 2023, 2024; Chon et al., 2018, 2021; Chon et al., 2022; Chon & Omukai, 2020; Sakurai et al., 2020; Regan et al., 2014; Regan et al., 2017, 2020a; Sharda et al., 2020; Sharda et al., 2021; Latif et al., 2021; Latif et al., 2022b; Woods et al., 2021, 2024; Riaz et al., 2018, 2023, 2022a; Prole et al., 2022a, b, 2023b, 2023a; Regan, 2023; Reinoso et al., 2023; Toyouchi et al., 2023; Sharda & Menon, 2024; Sadanari et al., 2024). Further, stellar evolution models predict that Pop III stars are more compact and hotter than Pop I/II stars, likely fast rotating, have negligible mass loss from metal line-driven winds (e.g. Schaerer, 2002; Meynet et al., 2006; Ekström et al., 2008; Heger & Woosley, 2010; Yoon et al., 2012; Tanikawa et al., 2020; Farrell et al., 2021; Murphy et al., 2021; Aryan et al., 2023; Martinet et al., 2023; Nandal et al., 2023; Volpato et al., 2023), and end their lives in diverse supernova events with distinct metal yields or collapse directly into massive back holes (BHs) (e.g., Heger & Woosley, 2002; Heger et al., 2003; Maeda & Nomoto, 2003; Umeda & Nomoto, 2003, 2005; Iwamoto et al., 2005; Kobayashi et al., 2006; Tominaga, 2009; Heger & Woosley, 2010; Nomoto et al., 2013).
With these peculiar properties, Pop III stars play important roles in the first billion years of cosmic history (i.e., Cosmic Dawn) through their radiation, metal enrichment, and by seeding BHs, which produce unique signatures in direct observations (e.g., Windhorst et al., 2018; Grisdale et al., 2021; Nakajima & Maiolino, 2022; Vikaeus et al., 2022; Trussler et al., 2023; Katz et al., 2023; Larkin et al., 2023; Venditti et al., 2024a; Zackrisson et al., 2011; Zackrisson et al., 2012, 2023), imprints in cosmic chemical and thermal evolution (see, e.g., Karlsson et al. 2013; Nomoto et al. 2013; Frebel & Norris 2015; Barkana 2016; Dayal & Ferrara 2018, for reviews), and impact on the formation and evolution of subsequent populations of stars, galaxies and supermassive BHs (SMBHs) (see, e.g., Bromm & Yoshida, 2011; Johnson et al., 2013; Pawlik et al., 2013; Jeon et al., 2015; Smith et al., 2015; Regan et al., 2017; Sakurai et al., 2017; Haemmerlé et al., 2020; Inayoshi et al., 2020; Schauer et al., 2021; Volonteri et al., 2021; Chon et al., 2022; Sarmento & Scannapieco, 2022; Chiaki et al., 2023; Sanati et al., 2023; Reinoso et al., 2023; Wise, 2023; Regan & Volonteri, 2024; Rossi et al., 2024), allowing us to constrain their properties through direct and indirect observations.
Recently, JWST has revealed the Cosmic Dawn with unprecedented discoveries of puzzling phenomena unexpected from conventional theoretical models (Adamo et al., 2024), some of which can be explained by the unique signatures of Pop III stars and their BH remnants, such as metal-poor strong HeII-emission systems (Wang et al., 2022a; Vanzella et al., 2023; Maiolino et al., 2023a), galaxies with extremely blue UV spectra (e.g., Nanayakkara et al., 2023; Austin et al., 2024; Cullen et al., 2024), strong carbon and nitrogen enrichment (D’Eugenio et al., 2023; Cameron et al., 2023; Senchyna et al., 2023; Ji et al., 2024; Schaerer et al., 2024; Topping et al., 2024) likely from fast-rotating or very massive Pop III stars (Liu et al., 2021b; Nandal et al., 2024a; Nandal et al., 2024d, c; Tsiatsiou et al., 2024), highly magnified individual massive stars (Welch et al., 2022; Schauer et al., 2022; Zackrisson et al., 2023), a slowly evolving UV luminosity function hinting at high UV variability, non-constant star formation efficiency (SFE), and/or top-heavy IMF (e.g., Inayoshi et al., 2022b; Finkelstein et al., 2023; Shen et al., 2023; Cueto et al., 2024; Harikane et al., 2024; Trinca et al., 2024; Ventura et al., 2024), and overabundant luminous quasars with overmassive (rapidly spinning) BHs at (e.g., Goulding et al., 2023; Harikane et al., 2023; Maiolino et al., 2023b, 2024; Kokorev et al., 2023; Übler et al., 2023; Akins et al., 2024; Durodola et al., 2024; Greene et al., 2024; Juodžbalis et al., 2024; Kocevski et al., 2024; Matthee et al., 2024; Inayoshi & Ichikawa, 2024) likely originating from heavy BH seeds (). Although there is still no conclusive direct detection of Pop III-dominated galaxies, which is likely challenging for JWST (Gardner et al., 2006; Riaz et al., 2022b; Nakajima & Maiolino, 2022; Katz et al., 2023; Bovill et al., 2024) and may require large extraterrestrial telescopes (Angel et al., 2008; Rhodes et al., 2020; Schauer et al., 2020), these observations highlight the importance of the Pop III components in high- galaxies. As JWST continues its revolutionary observations, other facilities (e.g., Roman Space Telescope and Vera C. Rubin Observatory) will come online in the near future, which may bring us new detection of Pop III signatures, such as the transient signals of Pop III gamma-ray bursts and supernova explosions (e.g., Fryer et al., 2022; Lazar & Bromm, 2022; Hartwig et al., 2023; Venditti et al., 2024b; Wiggins et al., 2024).
Gravitational wave observations of massive binary BH (BBH) mergers have also tentatively discovered a non-negligible contribution from Pop III BH remnants (up to of the detected events, see, e.g., Kinugawa et al., 2020, 2021b; Iwaya et al., 2023), especially for the most massive mergers such as GW190521 with unusual BH masses (Abbott et al., 2020b, a) in the range mostly forbidden for BHs from Pop I/II stars by standard pair-instability supernova (PISN) models (e.g., Heger et al., 2003; Belczynski et al., 2016; Yoshida et al., 2016; Woosley, 2017; Spera & Mapelli, 2017; Marchant et al., 2019; Marchant & Moriya, 2020; Mapelli et al., 2020). Thanks to their massive, compact nature and lack of mass loss, Pop III stars can produce BHs up to before triggering PISNe and more massive () BHs via direct collapse (e.g., Farrell et al., 2021; Volpato et al., 2023; Santoliquido et al., 2023; Mestichelli et al., 2024), which can end up in BBH mergers like GW190521 via isolated binary stellar evolution under proper conditions (Kinugawa et al., 2021a; Tanikawa et al., 2021, 2022; Santoliquido et al., 2023; Tanikawa, 2024) or through dynamical interactions in massive () dense clusters of Pop III stars/BHs themselves (Wang et al., 2022b; Liu et al., 2023; Mestichelli et al., 2024) and (Pop I/II) nuclear star clusters (Liu & Bromm, 2020c, 2021; Liu et al., 2024). In the next decades, the 3rd-generation GW detectors such as the Einstein Telescope (ET, Punturo et al., 2010; Maggiore et al., 2020) and the Cosmic Explorer (Reitze et al., 2019; Evans et al., 2023) will be able to detect BBH mergers up to , among which the contribution of Pop III BH remnants are expected to be larger and better characterized (e.g., Tanikawa et al., 2022; Franciolini et al., 2024; Santoliquido et al., 2024).
To fully understand the roles played by Pop III stars at Cosmic Dawn and the underlying physics (of early star formation, stellar feedback, BH formation and growth) through observations, self-consistent theoretical predictions are required not only for
-
(1)
the formation rates and sites of Pop III stars, but also for
-
(2)
the masses of Pop III star clusters and the stellar IMF.
Evidently, the total mass of Pop III stars in a galaxy is vital for the detectability of Pop III signatures embedded in the signals from co-existing Pop I/II stars and AGN, which are common in the galaxies detectable by JWST (e.g., Sarmento et al., 2018; Liu & Bromm, 2020b; Riaz et al., 2022b; Venditti et al., 2023, 2024a). The cluster mass also determines whether dynamical interactions can efficiently produce (distinguishable) massive, eccentric Pop III BBH mergers (Wang et al., 2022b; Liu et al., 2023; Mestichelli et al., 2024), which may not be possible for isolated binary stellar evolution (Costa et al., 2023; Santoliquido et al., 2023). The Pop III IMF affects the UV spectra of Pop III clusters (e.g., Zackrisson et al., 2011; Zackrisson et al., 2012; Bovill et al., 2024) and the X-ray outputs of Pop III X-ray binaries (Sartorio et al., 2023), shaping the imprints of Pop III stars on the 21-cm signal and reionization (e.g., Fialkov, 2014; Gessey-Jones et al., 2022; Salvador-Solé et al., 2017, 2022; Fialkov et al., 2023, Gessey-Jones et al. in prep.). Moreover, the shape of the Pop III IMF in the high-mass regime () has essential implications on the rates/abundances of strongly lensed massive Pop III stars detectable by JWST (Zackrisson et al., 2023), Pop III PISNe (e.g., Lazar & Bromm, 2022; Wiggins et al., 2024; Venditti et al., 2024b), very massive stars (VMSs, ) with peculiar metal enrichment (Nandal et al., 2024d, c), and supermassive stars (SMSs, ) as progenitors of heavy BH seeds (Smith & Bromm, 2019; Inayoshi et al., 2020; Haemmerlé et al., 2020; Volonteri et al., 2021; Wise, 2023; Regan & Volonteri, 2024) that are likely needed to explain the SMBHs in high- luminous quasars (e.g., Fan et al., 2001; Willott et al., 2010; Matsuoka et al., 2016; Onoue et al., 2019; Shen et al., 2020; Yang et al., 2021; Fan et al., 2023; Akins et al., 2024; Durodola et al., 2024; Greene et al., 2024; Matthee et al., 2024; Kocevski et al., 2024).
The two aspects are expected to be closely related to each other in the rapidly evolving environments of Cosmic Dawn. However, they are usually modelled separately in current theoretical studies, as it is challenging to combine them in one theoretical framework due to the large range of scales involved (from over-Mpc to sub-AU). The first aspect is mostly investigated with large-scale cosmological hydrodynamic simulations (e.g., Johnson et al., 2013; Smith et al., 2015; Xu et al., 2016; Sarmento et al., 2018; El-Badry et al., 2018; Nebrin et al., 2019; Liu et al., 2019; Liu & Bromm, 2020a, b; Liu et al., 2022; Skinner & Wise, 2020; Kulkarni et al., 2021; Schauer et al., 2019a, 2021; Kulkarni et al., 2022; Yajima et al., 2022, 2023; Kiyuna et al., 2023; Garcia et al., 2023; Venditti et al., 2023; Incatasciato et al., 2023; Correa Magnus et al., 2024; Lenoble et al., 2024; Sugimura et al., 2024; Smith et al., 2024) and semi-analytical models (e.g., Manrique et al., 2015; Salvador-Solé et al., 2017; Griffen et al., 2018; Dayal et al., 2020; Visbal et al., 2020; Li et al., 2021; Lupi et al., 2021; Chatterjee et al., 2020; Hartwig et al., 2022; Trinca et al., 2022, 2024; Hegde & Furlanetto, 2023; Nebrin et al., 2023; Bovill et al., 2024; Ventura et al., 2024; Feathers et al., 2024), which show that the formation rates and sites of Pop III star formation are regulated by cosmic/halo-scale processes, such as cosmic structure formation (for different dark matter models), dissociation of by Lyman-Werner (LW) radiation, streaming motion between baryons and dark matter, ionization and heating by X-rays, dynamical heating by halo mergers, and metal enrichment. For instance, LW radiation, streaming motion, and halo mergers can delay Pop III star formation, even shifting the formation sites to more massive () atomic-cooling haloes (e.g. Yoshida et al., 2003; Tseliakhovich & Hirata, 2010; Tseliakhovich et al., 2011; Fialkov et al., 2012; Tanaka & Li, 2014; Fernandez et al., 2014; Schauer et al., 2017; Inayoshi et al., 2018; Regan et al., 2020b; Kulkarni et al., 2021; Schauer et al., 2021). Such large-scale models lack the resolution to follow the sub-pc scale star formation process in detail (which is computationally prohibitive in a cosmologically representative volume). As a result, they estimate the final outcomes of Pop III star-formation with simple assumptions on the SFE and IMF treated as independent global parameters. On the other hand, for the second aspect, small-scale high-resolution (idealized/zoom-in) simulations of star-forming clouds (see above for references) have revealed that the final mass of Pop III stars formed and their IMF are determined by the complex interplay between fragmentation, radiative feedback, and stellar evolution, which have non-trivial correlations with the (initial) properties of the star-forming cloud. For instance, the standard pathway of Pop III star formation in molecular-cooling minihaloes ( at with gas infall rates ) typically produces Pop III stars with masses regulated by radiative feedback (e.g., Hirano et al., 2014, 2015; Park et al., 2021; Sugimura et al., 2023), while more violent collapse () in atomic-cooling haloes can overcome/suppress radiative feedback and produce SMSs up to a few (e.g., Bromm & Loeb, 2003; Chon et al., 2018; Chon & Omukai, 2020; Sakurai et al., 2020; Toyouchi et al., 2023; Reinoso et al., 2023; Regan, 2023).
To bridge the aforementioned insights from theoretical efforts on the (1) large- and (2) small-scale aspects and achieve self-consistent modelling of Pop III star formation across all scales, we build a universal analytical model to predict the outcomes of Pop III star formation from the properties of star-forming clouds, as described in Sec. 2. Our model inherits the basic elements from previous analytical studies (e.g., Omukai & Inutsuka, 2002; Tan & McKee, 2004; McKee & Tan, 2002, 2003, 2008; Hosokawa & Omukai, 2009; Johnson et al., 2012; Yajima & Khochfar, 2017; Fukushima et al., 2018; Li et al., 2021; Toyouchi et al., 2023) such as the balance between mass inflow from the collapsing cloud and mass loss by feedback, the reaction of protostars to accretion, as well as their finite lifetimes and maximum masses set by stellar evolution (Sec. 2.2). It captures the key trends in the evolution of Pop III protostar systems inferred from small-scale simulations with simple scaling relations governed by physically motivated parameters (Sec. 2.1). Furthermore, our model can track the growth and feedback of multiple protostars, and is used to explore the interplay between feedback and fragmentation in determining the formation efficiency and IMF of Pop III stars (Sec.2.3, Appendices A and B). As an example, the model is applied to the Pop III star-forming clouds in the progenitor haloes of high- luminous quasar host galaxies (Li et al., 2021) to evaluate the mass distributions of Pop III stars/clusters formed in such over-dense regions (Sec. 3.1). We also discuss the caveats in our model and possible ways to improve it (Sec. 3.2). Given its simplicity and flexibility, our model can be easily incorporated into large-scale semi-analytical models and cosmological simulations.
2 Analytical model
In this section, we describe our analytical model for Pop III star formation. We first introduce the scaling relations learned from simulations to capture the general evolution of Pop III star-forming disks and protostar systems governed by gravity and hydrodynamics (Sec. 2.1). Next, we consider the roles played by feedback and stellar evolution, which are combined with the scaling relations to calculate the final mass under the simple assumption that only a single star forms per cloud (Sec. 2.2). Finally, we generalize the model to consider multiple protostars and explore the effects of fragmentation/multiplicity on the final stellar mass (Sec. 2.3). For conciseness, we only show the results for select examples below. To demonstrate the flexibility of our model, we provide more detailed results for a broader exploration of parameter space and an alternative parametrization of multiplicity in Appendices A and B. The qualitative conclusions shown in this section remain valid for other choices of parameters/assumptions, although the predicted final stellar mass (for the same gas infall rate) can vary up to an order of magnitude.
2.1 Scaling relations for Pop III star-forming disks and protostar systems
It is shown in Liu et al. (2021a, see their sec. 2.1) that the total masses and radii of Pop III protostar systems in hydrodynamic simulations of typical primordial star-forming clouds in minihaloes (, ) can be reproduced with an analytical solution within a factor of at least in the early stage (see also fig. 9 in Susa, 2019):
| (1) | ||||
| (2) |
where , , given as the polytropic index in the effective equation of state (EoS) of collapsing primordial gas under canonical cooling111The EoS can be different in non-standard pathways of Pop III star formation on lower- or higher-temperature tracks of primordial gas collapse driven by HD or atomic-cooling (e.g., Hirano et al., 2014; Regan, 2023; Gurian et al., 2024). For simplicity, we adopt the standard value for cooling by default and explore the dependence of our results on in Appendix A.2. in the temperature range (Omukai & Nishi, 1998; Omukai et al., 2005). To generalize this solution for Pop III star formation in smaller/larger haloes with weaker/stronger gas inflows, we re-write Eq. 1 with a normalization factor and a characteristic timescale , and express with :
| (3) | ||||
| (4) |
Taking time derivative of Eq. 3, the accretion rate can be expressed as a function of mass :
| (5) |
This scaling is also predicted by (spherically symmetric) similarity solutions for polytropic gas with given (e.g., Yahil, 1983; Suto & Silk, 1988; Omukai & Nishi, 1998; Tan & McKee, 2004), as well as cosmological zoom-in simulations of the accretion-driven growth of a Pop III protostar (Bromm & Loeb, 2004).
Next, we set the characteristic timescale using the relation between time and density normalization parameters in self-similar transformations of the hydrodynamic equations (see eq. 1 in Liu et al., 2021a)
| (6) |
where , given the proton mass , the mean molecular weight of primordial gas , and the typical density around which primordial gas in run-away collapse under cooling settles to the effective EoS . Here, is also the typical density at the edge of a Pop III star-forming disk (see, e.g., fig. 8 in Toyouchi et al., 2023). Finally, to determine , we equate the accretion rate of the protostar at , , to the cloud-scale initial gas inflow rate onto the disk, multiplied by a factor (Sakurai et al., 2016; Toyouchi et al., 2023) that captures the rotational support against collapse, which gives and
| (7) |
The effects of other aspects, such as ejections of protostars by dynamical interactions and magnetic/radiative outflows, can also be absorbed into the parameter . Thanks to the simple power-law scaling, once the slope is known, the mass evolution is completely governed by one parameter, . This also indicates that our results are not very sensitive to the disk edge density given the weak dependence of on . The cloud-scale initial gas inflow rate and play more important roles, which capture the dynamics of the collapsing cloud evaluated at the density (time) scale ().
Eq. 4 provides a good estimate of the radius of the star-forming disk in the early stage. A similar scaling relation is obtained in Tan & McKee (2004, see their eq. 17) based on angular momentum conservation and analytical spherical collapse solutions (McKee & Tan, 2002, 2003), where is the entropy parameter. The normalization of their scaling law is consistent with that in Eq. 4 learned from simulations if the disk mass is similar to the mass of protostars () and the typical value of is adopted for infalling gas with and . However, this simple power-law scaling can produce unphysically large radii () when becomes very large () in the late stage if stellar feedback is inefficient (see Sec. 2.2). Therefore, we further impose an upper limit on the disk radius that can be related to the (initial) cloud size (see Sec. 2.2 below) and introduce the dependence on and :
| (8) |
For simplicity, is fixed throughout this paper as , where is the Boltzmann constant, although in reality depends on the detailed thermo-chemical evolution of the collapsing gas. In fact, as discussed below, if can become very large () before star formation is terminated by feedback, the cloud must undergo violent collapse with high inflow rates . This usually happens in hotter, atomic-cooling clouds, where can be higher than that adopted here, leading to smaller disks. In a companion paper (Gurian et al. in prep.), we develop a semi-analytical model for the thermo-chemistry and collapse dynamics, which can be used to calculate and under different conditions of Pop III star formation (see also Li et al., 2021; Sharda & Krumholz, 2022; Smith et al., 2024). We plan to explore the correlation between and in further work using this model222In fact, according to the spherical collapse solution for polytropic gas in Tan & McKee (2004, see their eq. 5), weakly correlates with the gas infall rate as . We have verified by numerical experiments that including this weak dependence has minor effects on our results..
2.2 Maximum/final mass of a single star per cloud
We first consider the simple case that only one protostar exists in the cloud, so Eqs. 7 and 8 delineate the (smoothed) median mass and radius evolution of the protostar and circumstellar disk, respectively, governed only by gravity and hydrodynamics. For simplicity, we assume that Eqs. 7 and 8 hold for until star formation is terminated quasi-instantaneously by factors other than gravity and hydrodynamics, such as stellar feedback, stellar collapse/explosion, and gas supply, although in reality they may cause gradual reductions of accretion with long-term deviations from the scaling in Eqs. 5 and 7 (McKee & Tan, 2008). Each terminating effect corresponds to a characteristic maximum/final mass. Below, we consider five characteristic masses, which are combined to derive a universal formula for the final mass of the central Pop III star, as illustrated in Fig. 1.
-
1.
Final mass regulated by photo-ionization feedback (): In our previous work (Gurian et al., 2024), we derive the final mass regulated by photo-ionization feedback assuming that a D-type shock is launched into the cloud once the protostar is thermally relaxed to produce ionizing photons efficiently (Alvarez et al., 2006), and star formation is shut down when the homogenized downstream medium is fully ionized (which marks the evaporation of the cloud). However, the final masses estimated in this way are lower than those found in 2D radiative hydrodynamic simulations (Hirano et al., 2014, 2015) by a factor of few. This is mainly caused by the disregard of the circumstellar disk, which can still feed the protostar even if bipolar ionized bubbles have expanded significantly. In fact, it has long been argued that photo-evaporation of the primordial protostellar disk may ultimately set the upper mass scale for Pop III stars (e.g., McKee & Tan, 2008; Hosokawa et al., 2011; Stacy et al., 2012; Fukushima et al., 2020). As shown in Toyouchi et al. (2023), the feedback-regulated final mass can be estimated from the mass loss rate of the circumstellar disk by photo-evaporation (Tanaka et al., 2013)
(9) where is the production rate of ionizing photons (as a function of ), and is the physical scale within which the disk suffers from photo-evaporation. Assuming that the accretion rate of the protostar is comparable to the gas inflow rate onto the circumstellar disk, the final mass can be obtained by solving , above which the disk is rapidly evaporated by ionizing radiation and can no longer feed the protostar. In Toyouchi et al. (2023), both and are fixed as and . Here, we further consider their time evolution, i.e., mass dependence, using the scaling relations in Sec. 2.1. We set to the circumstellar disk radius given by Eq. 8 (i.e., ) and use Eq. 5 to derive . Finally, to calculate , we use the fitting formula from Schaerer (2002) for non-accreting, non-rotating333Pop III stars are likely born as fast rotators due to rapid accretion of gas with high angular momentum and inefficient magnetic braking during protostar growth (e.g., Stacy et al., 2011; Stacy et al., 2013; Hirano & Bromm, 2018; Kimura et al., 2023). In the extreme case, Pop III stars can undergo chemically-homogeneous evolution under efficient mixing triggered by fast rotation. As a result, the star becomes more compact and hotter, such that the production efficiency of ionizing photons is boosted by a factor of (Sibony et al., 2022). The final mass regulated by photo-ionization feedback will then be reduced slightly (by up to a factor of 2), as will be shown below that when is independent of for massive stars. Pop III stars with combined with the linear relation for massive stars radiating at the Eddington limit (Bromm et al., 2001; Johnson et al., 2012):
(10) where , , , and . We assume that the effects of accretion on stellar evolution, such as initial swelling and expansion by radiation pressure enhanced by the accretion shock (Hosokawa & Omukai, 2009) become unimportant when the disk is about to diminish under photo-ionization feedback. This assumption is expected to be valid in most cases with , where the protostar can reach within an accretion timescale that is longer than the Kelvin-Helmholtz (KH) timescale444We use the protostar evolution model described in appendix A of Reinoso et al. (2023) to calculate the KH timescale . . Note that disk photo-evaporation only happens after the ionized bubble breaks out into the cloud, while it is shown in the simulations by Jaura et al. (2022) that the bubble can be trapped at the center in the early stage for an extended period . Here, we assume such that the initial confinement of ionizing photons does not affect . We find that this assumption is valid as long as .
-
2.
Maximum mass gained during the feedback-free bloating phase (): In the calculation of , we assume that the protostar is always able to thermally relax and contract, which is only valid for low accretion rates. In fact, the protostar will expand significantly to enter a bloating phase (Omukai & Palla, 2001, 2003), when the accretion rate is above a critical value (Hosokawa et al., 2013; Haemmerlé et al., 2018; Herrington et al., 2023; Nandal et al., 2023). In this case, the surface temperature becomes as low as K (see fig. 1 in Toyouchi et al., 2023), and the emission of ionizing photons is negligible (with a rate lower than that from a contracted star of the same mass by a factor of ), which leads to effectively feedback-free evolution. According to Eq. 5, the accretion rate of the protostar slowly decreases with time and will drop below at so the maximum mass accreted during the bloating phase is .
-
3.
Maximum mass regulated by the stellar lifetime (): Beyond stellar feedback, star formation also terminates when the central protostar runs out of fuel for nuclear fusion in its core and then collapses/explodes. To the first order, this means that the time taken for the protostar to reach a mass , i.e., the accretion timescale , cannot exceed the lifetime of a star with the same mass. The maximum mass regulated by the stellar lifetime satisfies . It is non-trivial to calculate the lifetimes of accreting massive stars (e.g., Begelman, 2010; Johnson et al., 2012; Haemmerlé, 2021; Nandal et al., 2024b; Saio et al., 2024). Here, we simply estimate with (extrapolation of) the fitting formula from Schaerer (2002) for non-accreting Pop III stars (in the mass range ) bound by a lower limit to be calibrated (see below):
(11) where , , , and .
-
4.
Maximum mass regulated by general-relativity instability (GRI, ): When the accretion rate is very high (), the star will collapse by GRI before running out of fuel, and the final stellar mass can be estimated with the fitting formula (Woods et al., 2017; Li et al., 2021)
(12) assuming a constant accretion rate (see also Haemmerlé, 2021, 2024; Nandal et al., 2024b; Saio et al., 2024). In our case, the accretion rate decreases slowly as (Eq. 5), and the protostar with a current mass spends most of its time at accretion rates similar to the current rate . We use the current rate to evaluate Eq. 12 and find the final mass regulated by GRI by solving the equation for .
-
5.
Maximum mass regulated by the gas supply (): Finally, the stellar mass cannot exceed the total mass of gas available in the collapsing cloud.
Among the five maximum masses, the first two are closely related to each other. If , the circumstellar disk will evaporate immediately after the bloating phase ends, and the final mass will be close to , which we call the bloating mode. On the other hand, if , the protostar can further grow after the bloating phase until it reaches to destroy the disk, which we call the feedback-regulated mode. Therefore, if we only consider gravity, hydrodynamics and photo-ionization feedback, the final mass can be well estimated by . Considering the other three masses that serve as upper limits, we have
| (13) |
There are nine parameters in our single-star model: , , , , , , , , and . The first three reflect the properties of star-forming clouds (and host haloes) on large scales (). The last two parameters are relevant for primordial stellar evolution at small (sub-AU) scales. These two aspects are connected to each other through our model for star-forming disks (Eqs. 3-8) at intermediate scales governed by , , , and .
For illustration, below we treat at as the independent variable and use physically-motivated values for the other parameters. We adopt for typical primordial collapsing gas under cooling with . The cloud mass is associated with through the collapse timescale , i.e., . As an optimistic estimate, we set the collapse timescale to the free-fall timescale555The relation between the (cloud-scale) initial gas inflow rate and cloud mass depends on the collapse dynamics and can be generally written as , where is a numerical parameter of order unity (McKee & Tan, 2002, 2003; Tan & McKee, 2004; Omukai et al., 2005). We adopt and to obtain conservative (optimistic) estimates of (). The results of our single-star model are insensitive to the choices of and when is large enough given . for a critical density , beyond which cooling saturates in minihaloes (Abel et al., 2002; Bromm et al., 2002; Gurian et al., 2024) and formation becomes efficient in atomic-cooling haloes (Sugimura et al., 2024). Given the cloud mass and the critical density, we estimate the initial cloud size as , which then sets the upper limit of the circumstellar disk radius in Eq. 8. We further fix using the critical accretion rate above which GRI collapse is expected to occur (Woods et al., 2017, see their fig. 4). To be specific, we require that when , which gives . We adopt an intermediate value based on the finding from simulations (Sakurai et al., 2016; Toyouchi et al., 2023). This means that half of the infalling gas goes into the protostar system, while the rest constitutes the star-forming disk (or leaves the star-forming cloud via ejected protostars and outflows). Following Toyouchi et al. (2023), we use by default to obtain conservative estimates of . In reality, these input parameters can have non-trivial correlations with and each other and show a strong dependence on environmental factors (e.g., LW radiation and streaming motion between baryons and dark matter). For simplicity, we ignore such correlations in this section and explore their possible impact on the results in Appendix A.
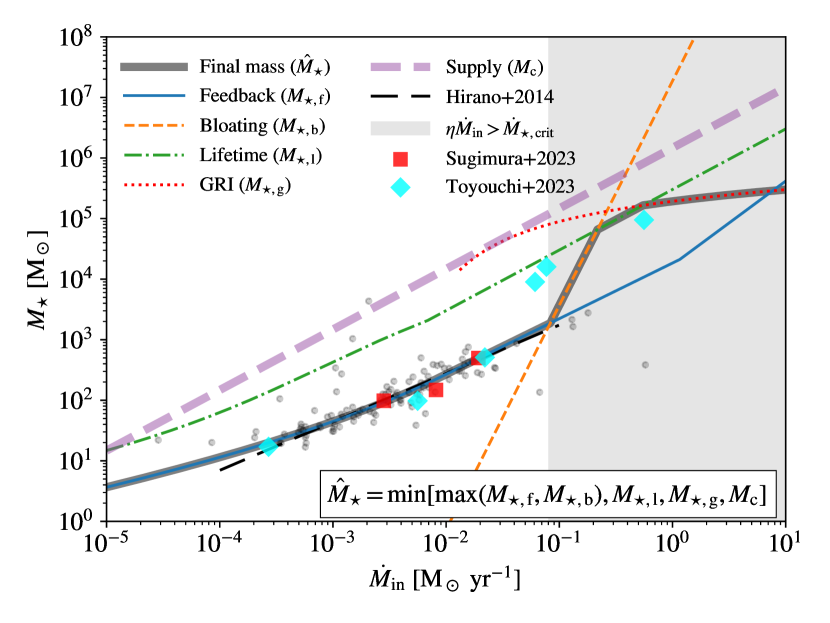
Fig. 1 shows the characteristic masses , , , , , and the final mass as functions of . The transition from the feedback-regulated mode () to the bloating mode () occurs almost exactly at , corresponding to . Approaching this transition point, when the production rate of ionizing photons is proportional to stellar mass as for massive stars with , can be solved analytically to obtain for , where . In the bloating mode, the final stellar mass increases rapidly with as before it reaches the limits placed by the stellar lifetime and GRI. The gas supply () never becomes a limiting factor, and we always have .
In the feedback-regulated regime, our results () agree perfectly with the fitting formula based on 2D simulations (for ) from Hirano et al. (2014, see their fig. 14)
| (14) |
and the results of the 3D simulations with adaptive mesh refinement (AMR) over Cartesian coordinates in Sugimura et al. (2023), which produce 2 to 4 stars per cloud in the end rather than a single star. Here, we have applied a correction factor to the initial gas inflow rates in Sugimura et al. (2023, see their table 1) to be consistent with the definition of in Hirano et al. (2014)666Underlying the fitting formula Eq. 14 from Hirano et al. (2014), the initial gas inflow rate is measured when the central hydrogen density reaches at the radius where the ratio between enclosed mass and Bonner–Ebert mass reaches the maximum, corresponding to a density (see their figs. 11 and 13) consistent with our definition of for . When is evaluated at an earlier stage with a smaller central density in the 2D simulations of Hirano et al. (2015) as well as in the 3D simulations of Sugimura et al. (2023), a best-fit is obtained with a similar slope but a higher normalization, because is lower compared with the case. The two fits are consistent with each other given the relation , which is used to correct the inflow rates reported in Sugimura et al. (2023).. The final mass is underestimated by our model at compared with the results of two simulations from Hirano et al. (2014) in this regime where the initial KH contraction phase likely becomes important. This so-called low-mass mode of Pop III star formation (Stacy & Bromm, 2014) is expected to be rare.
We also compare our predictions with the results of the 3D single-star simulations with spherical coordinates in Toyouchi et al. (2023, see their table 3), finding a good agreement for . This shows that our model accurately captures the median evolution of Pop III protostars and circumstellar disks in the feedback-regulated regime at least for . However, two simulations in Toyouchi et al. (2023) with obtain higher masses () than our results () and those from the 2D simulations in Hirano et al. (2014) under similar conditions. This implies that the final mass can vary greatly from system to system around the critical inflow rate required to trigger the bloating phase, likely due to the deviation from the scaling relations (Eqs. 3-8) in the (stochastic) evolution of individual systems, which we will discuss in Sec. 3.2 and Appendix A.2. In the lifetime/GRI-regulated regime, our model reproduces the result of Toyouchi et al. (2023) for within a factor of 2, showing a slight overestimation777The final mass for in Toyouchi et al. (2023, see their LWH-10 model) is obtained by assuming constant mass growth for a duration of using the average accretion rate in the first 0.2 Myr covered by the simulation. Therefore, it should be regarded as a lower limit if the gas inflow can be sustained beyond 0.5 Myr..
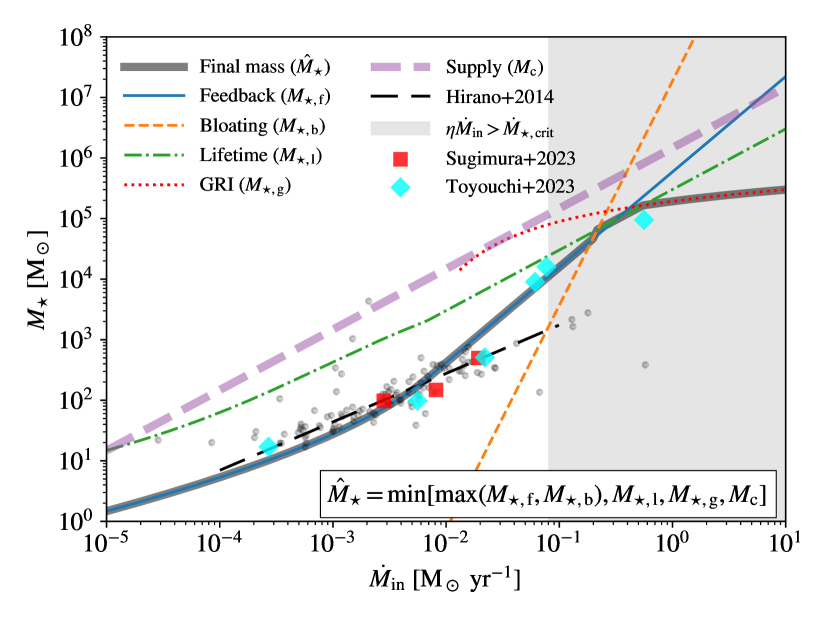
For comparison, Fig. 2 shows the results assuming a fixed scale AU for disk photo-evaporation following Toyouchi et al. (2023). As expected, the predicted - relation is generally consistent with the simulation data from Toyouchi et al. (2023). The final mass regulated by photo-ionization feedback is overestimated (by up to a factor of ) at compared with the fit from Hirano et al. (2014)888Similarly, is overestimated by a factor of in Li et al. (2021, see their eq. 27), where smaller values of are adopted based on the gravitational influence radii of protostars. . In this way, the feedback-regulated mode is also important for , and the bloating mode becomes rare. However, for , is slightly lower for AU compared with the fit from Hirano et al. (2014) and our results with . This indicates that the evolution of is crucial for the accurate modelling of photo-ionization feedback and calculation of .
2.3 Effects of fragmentation/multiplicity
In the previous subsection, we derive the final stellar mass under the assumption that only one protostar forms per cloud. However, in the last two decades, small-scale simulations have shown that fragmentation is common in primordial star-forming clouds/disks (Bromm, 2013; Haemmerlé et al., 2020; Klessen & Glover, 2023), producing multiple protostars that undergo complex evolution and interactions (accretion, migration, gravitational scatters, and mergers). There is also evidence for multiplicity in Pop III star formation from stellar archaeology data (Hartwig et al., 2023). However, the final fates of the protostars are still in debate due to computational limitations (e.g., resolution, time coverage, volume, and treatment of feedback). For instance, in the dense disks formed under strong gas inflows (), gaseous dynamical friction can drive rapid inward migrations of fragments/protostars to merge with one central object that dominates the total stellar mass, converging to the single-star scenario, or feed a small number of SMSs and many low-mass stars (Inayoshi & Haiman, 2014; Boekholt et al., 2018; Suazo et al., 2019; Chon & Omukai, 2020; Latif et al., 2021; Woods et al., 2021, 2024; Prole et al., 2023a; Reinoso et al., 2023; Schleicher et al., 2023). In general, the interplay between fragmentation and feedback has profound implications for the formation efficiency and IMF of Pop III stars, similar to the case of Pop I/II star formation (e.g., Menon et al., 2024).
In light of this, we generalize the single-star model in Sec. 2.2 to follow the growth and feedback of multiple protostars per cloud and explore the effects of multiplicity on the final total stellar mass. We assume that the cloud has modest turbulence at the onset of collapse due to inefficient cooling (Chon et al., 2021) and only forms one star-forming disk that fragments by disk instability. We only follow the median evolution of the mass distribution of surviving protostars and ignore transient protostars that are promptly lost in mergers or ejections999Although ejections are commonly seen in simulations (e.g., Prole et al., 2022a; Raghuvanshi & Dutta, 2023; Reinoso et al., 2023), their effects on the final total stellar mass are still unclear. Since protostars can hardly grow once ejected from the star-forming cloud, the mass carried by ejected stars is expected to be negligible compared with the final mass of the remaining star cluster. However, the radiative feedback from ejected stars may also regulate star formation. We defer the inclusion of ejected stars to future work.. As a heuristic attempt, we consider a simple phenomenological multiplicity model under the following two assumptions.
-
1.
The mass distribution of protostars follows a power law .
-
2.
The fraction of the total accretion rate that feeds a protostar is identical to the fraction of total stellar mass occupied by the protostar. Therefore, if the number of protostars is constant, the mass distribution of protostars undergoes self-similar evolution: The shape (i.e., power-law index) remains unchanged and the boundaries increase proportionally with the total stellar mass .
Here, the second assumption is motivated by the quasi-linear relation between and found in the (magneto-) hydrodynamic simulations from Sharda et al. (2020) when the accretion rate is measured over a timescale in the early stage with .
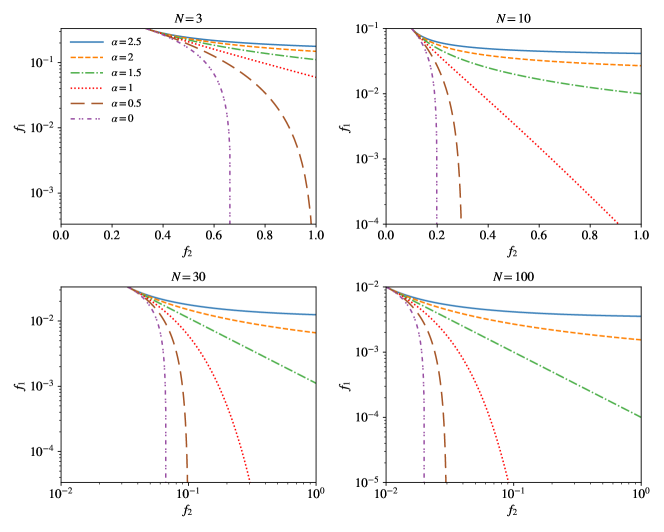
In this way, the protostar mass distribution is determined by three parameters , , and , where the last two parameters determine the lower and upper bounds as and . These parameters are related to the number of protostars through
| (15) |
where given the mass of individual protostars. We treat and as free parameters and associate to , such that becomes the third parameter of our model. Given , , and , we first solve Eq. 15 to obtain , as shown in Fig. 3. Then we distribute bins in the range according to a power law with index and apply small corrections to ensure . The masses and accretion rates of individual protostars are simply and given the total stellar mass and accretion rate of the protostar cluster (Eq. 5). Here, we assume that the evolution of with (governed by cloud-scale collapse) is completely determined by and not affected by the fragmentation process before feedback kicks in, since recent simulations have shown that the growth of total stellar mass is insensitive to the number of protostars at least in the early stage without feedback (see, e.g., Liu et al., 2021a; Prole et al., 2022a). In this way, the effects of fragmentation on the final total stellar mass only manifest via its interplay with feedback, as discussed below.
Once the relation between and the masses and accretion rates of individual protostars is known, we generalize the analysis in Sec. 2.2 to multiple protostars. We first absorb the effects of the bloating phase into the calculation of ionizing photon production rates, in which we reduce the value from Eq. 10 by a factor of when the accretion rate is above (see fig. 4 in Toyouchi et al., 2023). We derive the total disk photo-evaporation rate under the assumption that all protostars reside in a central region much smaller than the star-forming disk and contribute to the evaporation of the disk effectively as one point source. This central concentration may occur by inward migrations from dynamical friction (Riaz et al., 2023). In this case, we simply replace in Eq. 9 with the summation of the rates from individual protostars and still use the radius of the entire disk from Eq. 8 with to estimate the disk evaporation scale
| (16) |
An alternative scenario with distributed feedback is explored in Appendix A.1.
Next, we consider the limits on the total stellar mass placed by the lifetime and GRI of the most massive protostar in the cluster (with the index ), assuming that once this star ends its life, gas inflows will be shut down either by a supernova explosion or by black hole accretion feedback. To be specific, we now use rather than to evaluate the stellar lifetime formula (Eq. 11) and compare with the GRI mass from Eq. 12 (using instead of ). The final total stellar mass is given by the maximum value of that satisfies
| (17) | ||||
and again capped by the cloud mass .
To demonstrate the effects of multiplicity on , we explore the parameter space101010An alternative parametrization of multiplicity focusing on the minimum mass of Pop III stars is investigated in Appendix B. of , , and with examples while fixing and . Here, we assume that is constant (i.e., independent of ) for simplicity and consider the concentrated feedback scenario (Eq. 16). In practice, we impose an upper limit on corresponding to when evaluating Eq. 17 to avoid the production of objects below the minimum mass of Pop III protostars (Greif et al., 2011, see their fig. 7). Therefore, is not strictly constant in the model, and the input value of as a parameter should be regarded as the optimistic target value. These choices (, , constant , and concentrated feedback) together with the assumptions of and are adopted as the default setup unless otherwise noted. More detailed results, including those with different prescriptions/assumptions and choices of parameters for fragmentation, mass-size scaling relation, and photo-ionization feedback are shown in Appendix A.
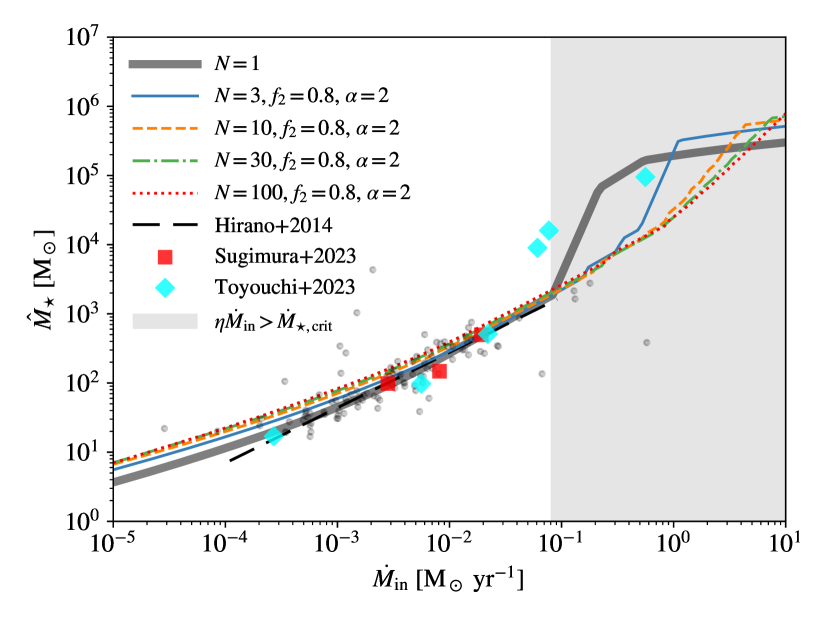
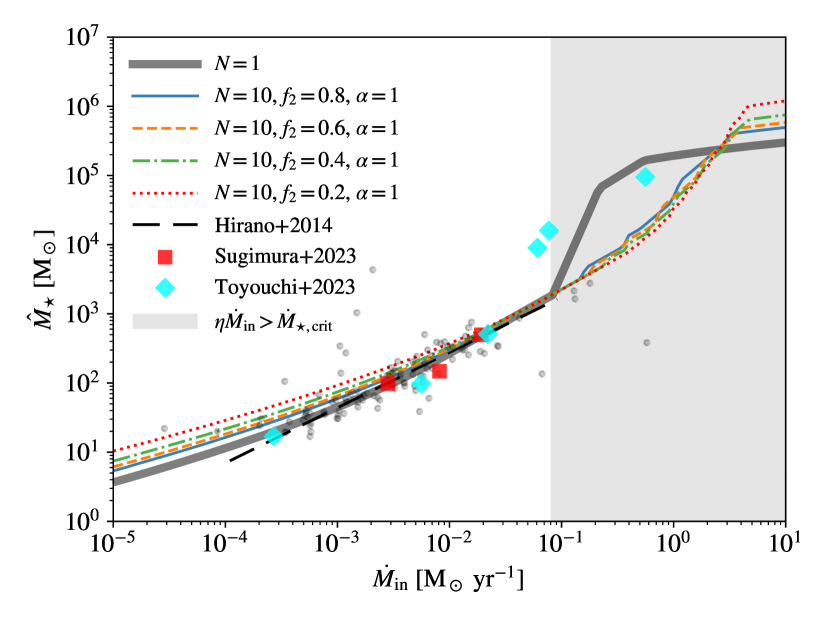
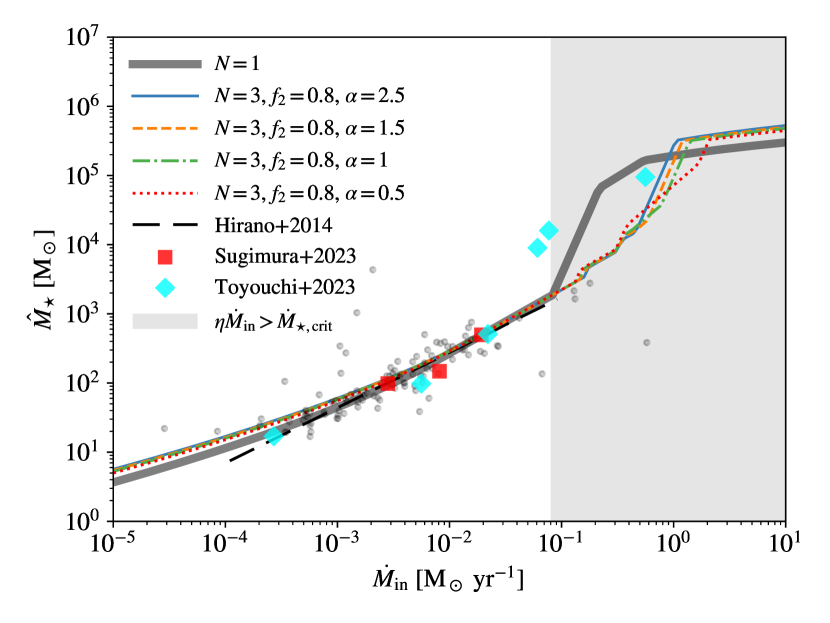
Fig. 4 shows the relation between and for , 10, 30, and 100 given and . Note that decreases with (Fig. 3), low-mass stars make up a larger fraction of the total stellar mass given a larger , which are less efficient at producing ionizing photons compared with massive stars if we do not consider the bloating phase. Therefore, as increases, photo-ionization feedback is weaker in the low-accretion rate regime without bloating, leading to higher . The effect is stronger for smaller . On the contrary, for , the transition from the no-bloating feedback-regulated regime (, where all stars have contracted before star formation is terminated by feedback) to the lifetime/GRI-regulated regime () is smoother and delayed as increases, leading to smaller in the intermediate stage (corresponding to the bloating mode in the single-star model). This is because the full bloating phase, where all protostars have accretion rates above , is more difficult to trigger when we distribute the total accretion rate among multiple protostars. Even if the most massive stars have entered the bloating phase, low-mass stars can still contract and produce ionizing photons efficiently under low accretion rates. The fraction of stars that experience bloating when star formation terminates increases with until it reaches unity. However, increases again with in the GRI-regulated regime, because the GRI mass limit (Eq. 12) is applied to the most massive star, whose mass fraction in the cluster is lower with higher .
Fig. 5 shows the results for , 0.6, 0.4, and 0.2 given and . Similarly to trends with , decreases with for and in the GRI-regulated regime, but increases with in the intermediate regime. This is because the importance of massive stars simply increases with , resulting in stronger feedback if there is no bloating but meanwhile making the bloating phase and GRI easier to occur. Besides, since increases when is smaller (Fig. 3), the transition to the GRI-regulated regime is generally sharper.
Fig. 6 shows the results for , 1.5, 1, and 0.5 given and . Here, the dependence on is generally weaker compared to the trends in and . The biggest effect is that the full bloating phase occurs at lower when the protostar mass distribution is more bottom-heavy with higher because decreases with when the input values of and are fixed (Fig. 3).
3 Discussion
3.1 Implications for the cluster mass distribution and IMF of Pop III stars
As an example, we apply our analytical model for Pop III star formation to the primordial star-forming clouds in the (main) progenitor haloes of high- luminous quasar host galaxies and derive the mass distributions of Pop III clusters () and stars (). The (cloud-scale initial) gas inflow rates of such clouds are calculated by Li et al. (2021) with merger trees targeting typical luminous quasar host haloes with masses and a co-moving number density111111We derive the number density of haloes with at from the halo mass function in CDM with the colossus package (Diemer, 2018) using the Tinker et al. (2008) model and the planck15 set of cosmological parameters (Planck Collaboration et al., 2016). See https://bdiemer.bitbucket.io/colossus/lss_mass_function.html. of at , corresponding to over-dense peaks that only occupy a small fraction of cosmic volume in the standard CDM cosmology (Planck Collaboration et al., 2016). They use a one-zone model to follow the cloud collapse until to predict the gas inflow rate, consistent with our definition of for . In addition to standard thermo-chemistry of collapsing primordial gas, they also model the effects of Lyman-Werner (LW) radiation from nearby star-forming galaxies, dynamical heating by halo mergers, and streaming motion between baryons and dark matter, which can delay Pop III star formation to more massive (atomic-cooling) clouds/haloes with higher gas inflow rates, favoring the formation of SMSs and heavy BH seeds (see, e.g., Inayoshi et al., 2020; Haemmerlé et al., 2020; Volonteri et al., 2021; Wise, 2023; Regan & Volonteri, 2024, for reviews).
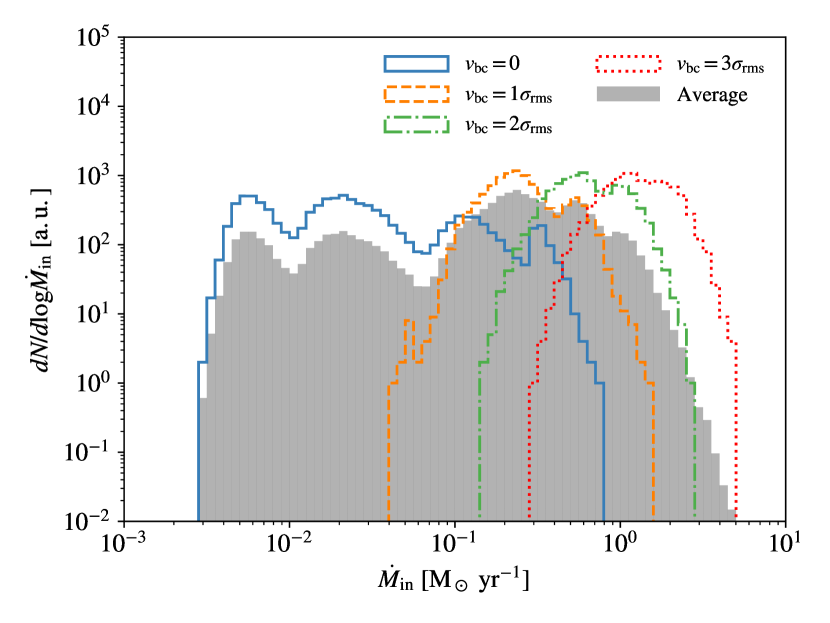
Here we consider the distributions predicted by Li et al. (2021) for four values of baryon-dark matter streaming velocity , 1, 2, and (where is the cosmic root-mean-squared velocity), as shown in Fig. 7. The distribution for covers a broad range with multiple peaks corresponding to haloes of different assembly histories and LW background intensities (Li et al., 2021, see their fig. 6), and the distribution is narrower and dominated by higher as increases, reaching up to for . We further construct the distribution in the cosmic (volume) average case by numerically integrating the results for the four values over the probability density function of (Tseliakhovich et al., 2011; Fialkov, 2014; Schauer et al., 2019b)
| (18) |
using the trapezium rule. To be specific, the results for , 1, 2, and 3 are combined with the weights , , , and , respectively, where the function is defined as . Since we only have 4 bins of , the numerical integration is only meant to capture the general shape of the cosmic average distribution, while the detailed features in the integrated distribution may be numerical artifacts, which can be smoothed out given a finer grid of .
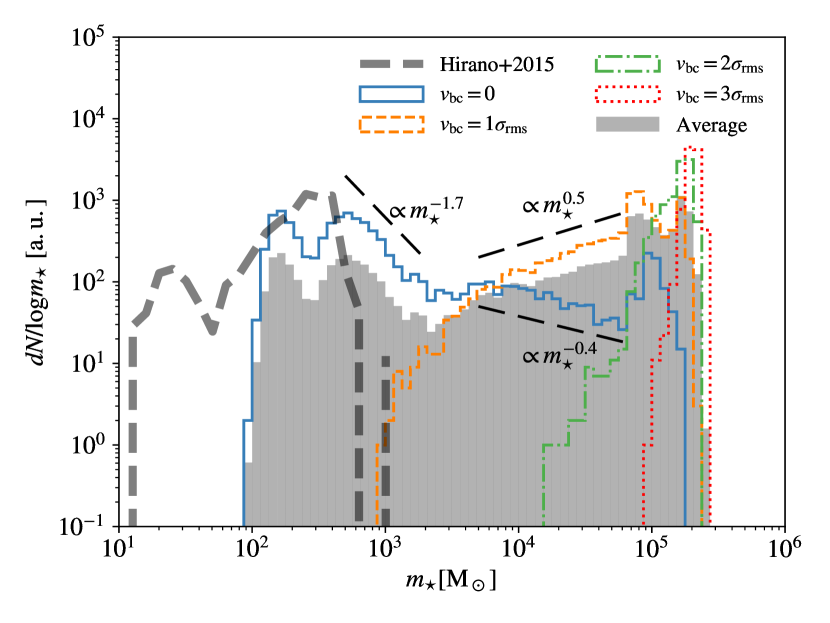
Fig. 8 shows the resulting mass distributions of Pop III stars in the single-star model (, ) under the default setup for , 1, 2, and as well as the cosmic average. For comparison, we also plot the mass distribution of Pop III stars formed in typical minihaloes in unbiased regions with from the 2D (single-star) simulations in Hirano et al. (2015). Some statistical properties of these mass distributions are summarized in Table 1. In the simple case with no streaming motion (), the mass distribution spans a wide range with a complex shape caused by the multimodal distribution of . There are two low-mass peaks around and and a high-mass peak at that contains a small fraction () of stars. In between the second low-mass peak and the high mass peak, the distribution approximately follows a broken power-law form with at and at . Although the majority () of primordial star-forming clouds in high- luminous quasar progenitor haloes form ordinary Pop III stars with (in the feedback-regulated regime), a non-negligible fraction () of clouds produce SMSs with that can become heavy BH seeds. Besides, a small fraction () of clouds produce VMSs with that can explain the high nitrogen abundances observed in several high- galaxies by JWST (Nandal et al., 2024c).
Similarly to our case with , the mass distribution predicted by Hirano et al. (2015) is also dominated by ordinary Pop III stars () with a peak at . However, it has a sharp cutoff at in the lack of enhanced environmental effects (halo mergers and LW radiation) that can produce high and more massive Pop III stars in high- luminous quasar progenitor haloes. Hirano et al. (2015) also obtain a small () fraction of Pop III stars below , mostly formed in HD cooling haloes at , while such cases are extremely rare in high- luminous quasar progenitor haloes, since Pop III star formation mostly occur at in the relevant biased regions (Li et al., 2021). The masses of Pop III stars are significantly boosted by higher streaming velocities between baryons and dark matter, such that most () stars have for , while the number of VMSs is reduced. With the contributions of such high- regions, the cosmic average mass function of Pop III stars is dominated () by SMSs, showing a very top-heavy power law at followed by two higher-mass peaks that account for half of the entire population. These differences indicate that the environmental effects at halo and cosmic scales strongly regulate the masses of Pop III stars. In general, the broad mass distributions predicted by our analytical model are consistent with the picture emerging from recent numerical simulations that the mass spectrum of BH seeds from the first stars is a continuum (Li et al., 2023; Regan & Volonteri, 2024).
| 0 | 1 | - | - | 0.1384 | 0.0825 | 0.1384 | 0.0336 |
|---|---|---|---|---|---|---|---|
| 1 | - | - | 0.9232 | 0.0625 | 0.9232 | 0.2622 | |
| 1 | - | - | 1 | 0 | 1 | 0.9347 | |
| 1 | - | - | 1 | 0 | 1 | 0.9999 | |
| Average | 1 | - | - | 0.6998 | 0.0561 | 0.6998 | 0.3271 |
| Average | 3 | 0.8 | 2 | 0.3237 | 0.9262 | 0.4149 | 0.0505 |
| Average | 10 | 0.8 | 2 | 0.2482 | 0.8781 | 0.0698 | 5.4e-5 |
| Average | 30 | 0.8 | 2 | 0.2457 | 0.5775 | 0.0301 | 1.1e-6 |
| Average | 100 | 0.8 | 2 | 0.2659 | 0.4561 | 0.0193 | 0 |
| Average | 10 | 0.8 | 1 | 0.2915 | 0.9699 | 0.2474 | 0.0011 |
| Average | 10 | 0.6 | 1 | 0.2919 | 1.0592 | 0.1655 | 0.0004 |
| Average | 10 | 0.4 | 1 | 0.2718 | 0.9872 | 0.1077 | 6.4e-5 |
| Average | 10 | 0.2 | 1 | 0.2180 | 0.7562 | 0.0406 | 4.3e-5 |
| Average | 3 | 0.8 | 2.5 | 0.3235 | 0.8560 | 0.4735 | 0.0589 |
| Average | 3 | 0.8 | 1.5 | 0.3245 | 0.9620 | 0.3771 | 0.0385 |
| Average | 3 | 0.8 | 1 | 0.3260 | 0.9779 | 0.3690 | 0.0220 |
| Average | 3 | 0.8 | 0.5 | 0.3353 | 0.9118 | 0.4424 | 0.0033 |
Given the number density of typical high- luminous quasar host haloes (with at ), the number density of heavy () BH seeds from Pop III SMSs formed in their main progenitors is (averaging over regions with different ). This should be regarded as a lower limit of the abundance of Pop III heavy BH seeds in high- luminous quasar progenitor haloes, as Pop III formation can occur in multiple branches of a merger tree beyond the main branch. Nevertheless, this lower limit already accounts for of the number density of luminous quasars with bolometric luminosities at inferred from JWST observations121212The fact that implies that the majority of quasars newly discovered by JWST reside in less massive () haloes at than those considered in Li et al. (2021) which are expected to host the most massive BHs with (Wyithe & Padmanabhan, 2006). One needs to model Pop III SMS formation for a broader halo mass range to fully evaluate the roles played by Pop III stars in seeding SMBHs, which we defer to future work. (Akins et al., 2024, see their fig. 8). Given Eddington ratios and duty cycles of the order of unity (Fragione & Pacucci, 2023), such heavy BH seeds from Pop III SMSs (formed at ) can grow to by , powering luminous quasars with . In fact, about half of the Pop III SMSs (and their BH remnants) have masses above , which is the minimum BH mass required to activate efficient growth found in recent simulations (Regan & Volonteri, 2024). A detailed investigation for the formation and growth of BH seeds from Pop III SMSs is beyond the scope of this paper (see, e.g., Johnson & Haardt, 2016; Latif & Khochfar, 2020; Haemmerlé, 2021, 2024; Toyouchi et al., 2021; Inayoshi et al., 2022a; Hu et al., 2022; Park et al., 2022; Li et al., 2023; Lupi et al., 2023; Massonneau et al., 2023; Sassano et al., 2023; Bhowmick et al., 2024; Cammelli et al., 2024; Coughlin & Begelman, 2024; Jeon et al., 2023, 2024; Nandal et al., 2024b; Saio et al., 2024). In general, Pop III SMSs can make a significant contribution to the (heavy) BH seed population underlying high- luminous quasars, at least under the single-star assumption.
Next, we explore the effects of multiplicity at the smaller scales of star-forming clouds. The 12 multiplicity models shown in Sec. 2.3 and listed in Table 1 (with ) are applied to the datasets from Li et al. (2021). For conciseness, we focus on the dependence on as the most important multiplicity parameter, considering the cosmic average case for . The mass distributions of Pop III clusters and stars with , 10, 30, and 100 given and are shown in Fig. 9. The corresponding statistics are summarized in Table 1, which also include the results for the other 8 models varying and . As expected, fragmentation generally suppresses the formation of massive Pop III clusters with , reducing their number fraction from in the single-star model to for , as the full bloating phase becomes rare in the presence of low-mass slowly-accreting stars. However, in the case, the maximum total stellar mass increases to because the collapse of the most massive star by GRI is delayed. Interestingly, the Pop III cluster masses predicted by our model remain below the upper limit (Liu & Bromm, 2020b) estimated from the non-detection of Pop III-dominated galaxies in the Hubble Frontier Fields at with a limiting rest-frame UV magnitude of -13.5 (Bhatawdekar & Conselice, 2021) using the stellar population synthesis code yggdrasil (Zackrisson et al., 2011). The decrease of with slows down at and is even reversed for , because the ionizing power is lower when there are more (low-mass) stars for a fixed total stellar mass in the no-bloating feedback-regulated regime. In fact, there is always a significant fraction of haloes hosting massive clusters for the 12 models considered here covering , , and . This indicates that massive star clusters are common outcomes of primordial star formation in over-dense regions, whose -body dynamics has crucial implications on the formation and evolution of merging Pop III BBHs and their gravitational wave signatures (Wang et al., 2022b; Liu et al., 2023; Mestichelli et al., 2024).
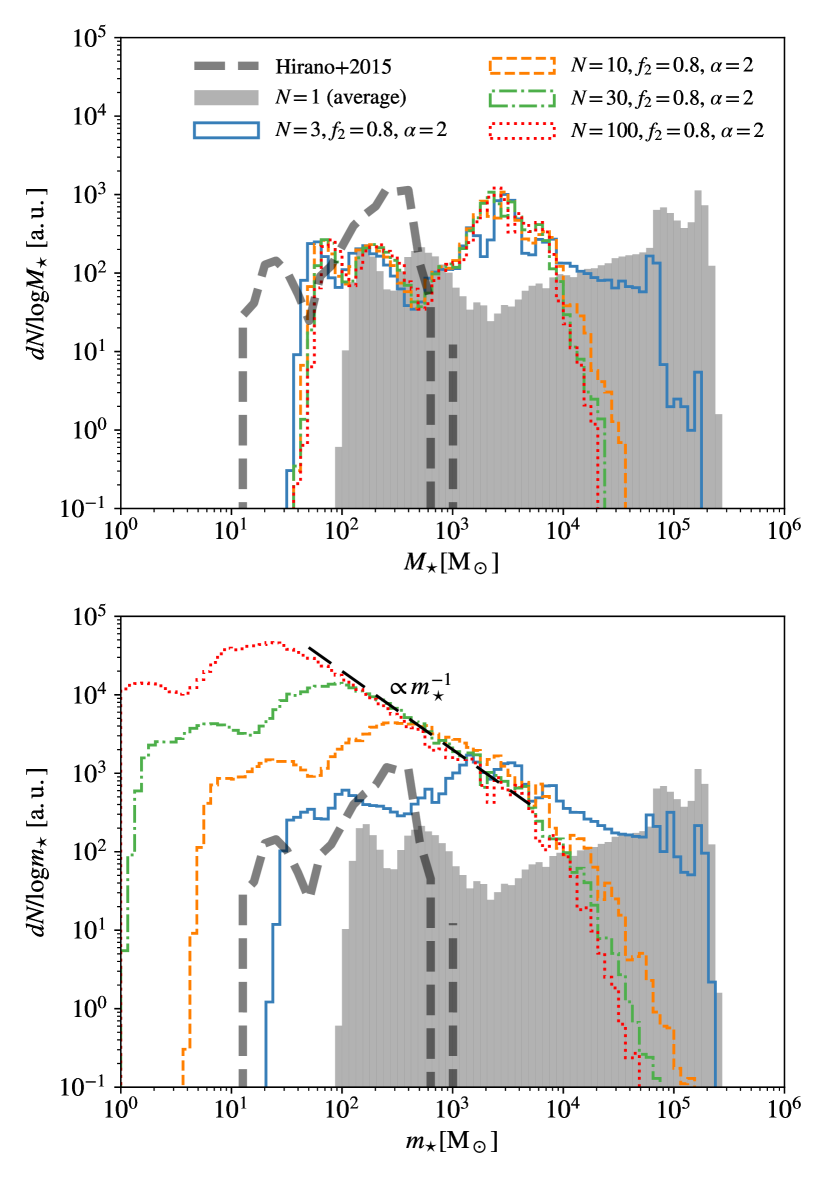
The number of SMSs is also reduced as increases, showing a sharp drop from to , down to per halo for . The corresponding number density of heavy BH seeds is for , lower than the observed number density of luminous () quasars by a factor of . Besides, given , most () SMSs have , which may not be massive enough to produce rapidly growing BH seeds (Regan & Volonteri, 2024). This indicates that fragmentation can significantly reduce the efficiency of heavy BH seed formation in Pop III star-forming clouds. On the other hand, formation of VMSs with as potential sources of strong nitrogen enrichment (Nandal et al., 2024c) is significantly enhanced by fragmentation. The number of such VMSs is per halo for compared with for . This implies that understanding the effects of fragmentation/multiplicity on the final products of primordial star formation is essential for interpreting the peculiar observational signatures of high- galaxies/quasars unveiled by JWST (Adamo et al., 2024). Note that here we focus on the natal population of stars/BHs, while VMSs, SMSs, and heavy BH seeds can further form and grow via run-away collisions in massive clusters (e.g., Sakurai et al., 2017; Boekholt et al., 2018; Wang et al., 2022b). Last but not least, when is larger, the shape of the overall IMF of Pop III stars is increasingly influenced by the protostar mass distribution assumed in the multiplicity model and extends to lower masses (down to for ). The mass distribution of stars follows a power-law form consistent with the input IMF at the cloud/disk scales () from to for , while in the case, the mass distribution of stars resembles more the cluster mass distribution regulated by larger-scale physics.
Compared with , the effects of and are weaker. The most obvious trend is that decreases when is lower (see the third section in Table 1). Indeed, in our default multiplicity model, beyond , it is mainly (rather than ) that characterizes the oligarchy of the most massive objects from competitive accretion, which is important for SMS formation. It will be shown in Appendix B that can have stronger effects under an alternative parametrization of multiplicity.
We end this section with some brief comments on the Pop III SFE in high- luminous quasar progenitor haloes, defined as given the total gas mass in the halo at the moment of star formation. A broad range is obtained regardless of the choices of multiplicity parameters. In the single-star model, the efficiency is generally higher in more massive haloes with larger . The typical values are for ordinary Pop III star formation () in minihaloes with and for SMS formation () in atomic-cooling haloes (). When fragmentation is included, hardly changes in minihaloes but is significantly reduced for massive Pop III clusters () given , where the cosmic average efficiency is . We plan to conduct more detailed analyses on Pop III SFE and its correlation with IMF in future work by applying our model to a cosmologically representative sample of Pop III star-forming haloes.
3.2 Caveats and future improvements
The goal of this paper is to provide a flexible analytical framework that can predict the outcomes of Pop III star formation from the properties of star-forming clouds and clarify the key physical processes that determine the final masses of Pop III stars. As an initial version, our model is kept as simple as possible, while reproducing the key results of small-scale simulations of primordial star-forming clouds (Hirano et al., 2014; Sugimura et al., 2023; Toyouchi et al., 2023). It does not necessarily take into account all possible factors governing Pop III star formation, and some model elements can be improved to better reflect the complexity in simulations and reality, as we discuss below.
-
1.
The scaling relations used in our model (Sec. 2.1) describe the (smoothed) median evolution for a large sample of Pop III protostar systems focusing on the surviving protostars. However, the evolution of individual systems shows strong stochasticity and diversity in simulations. For instance, the accretion rates of protostars fluctuate significantly at very short timescales for Pop III star-forming clouds across a broad range of initial collapse rates , modulated by the interactions between protostars and the clumpy structure of the unstable star-forming disk (Sakurai et al., 2016; Hosokawa et al., 2016; Chon & Omukai, 2020; Park et al., 2023, 2024; Sugimura et al., 2020, 2023; Toyouchi et al., 2023; Prole et al., 2023a; Reinoso et al., 2023). This has interesting implications on the bloating mode of Pop III star formation (Sec. 2.2). For typical protostars in this regime with masses and KH timescales , the bloating phase will terminate if the accretion rate stays below the critical rate for a duration longer than (Schleicher et al., 2013; Sakurai et al., 2015; Toyouchi et al., 2023; Reinoso et al., 2023) in which the star contracts to produce intense ionizing radiation. Such contraction is more likely to occur at later stages as the accretion rate generally decreases with time. In the current model, we simply assume that the contraction occurs exactly when the (smoothed) median accretion rate drops below , while in reality, the timing and the resulting final mass may have a large scatter due to the stochastic nature of this process. We plan to consider such fluctuating accretion rates as well as protostar mergers and ejections in future work based on statistical analyses of the protostar accretion/merger/ejection histories in simulations and/or physically motivated models for fragmentation via disk instability (e.g., Tsukamoto et al., 2015; Inoue & Yoshida, 2020; Kimura et al., 2021). In this way, we can explicitly follow the mass evolution of individual protostars and their circumstellar disks in a fully dynamical manner.
-
2.
We assume that Pop III star formation happens via monolithic collapse with weak turbulence based on the simulations by Chon et al. (2021) for isolated primordial star-forming clouds with masses (see also Higashi et al., 2022). However, this assumption may not always hold in realistic environments of Pop III star formation, especially for more massive clouds with violent collapse (). The presence of strong turbulence in star-forming clouds has two consequences: First, gas inflows onto the star-forming disk can be highly dynamical, deviating from the steady declining trend described by Eq. 5 (Regan et al., 2020a, see their fig. 6). Second, core fragmentation can break the cloud into multiple clumps each hosting their own star-forming disks and star clusters, which is particularly relevant when strong streaming motion between baryons and dark matter produces filamentary clouds (Hirano et al., 2018, 2023; Latif et al., 2022a). It should be straightforward to include these effects in our framework, which are expected to reduce the final masses of Pop III stars formed, but a larger sample of simulations is required to better understand the statistical properties of such turbulent collapse.
-
3.
We adopt a simple power-law form with an invariant slope for the mass function of protostars, in the hope that it is flexible enough to qualitatively demonstrate the effects of multiplicity. Our model is not meant to reflect the reality, where the time evolution and shape of protostar mass function can be more complex, especially for SMS formation with high gas inflow rates (). Since high accretion rates (, Hosokawa et al., 2013; Haemmerlé et al., 2018; Herrington et al., 2023; Nandal et al., 2023) cause significant expansion of some protostars during such violent collapse, super-competitive accretion and stellar collisions can cause a ‘class bifurcation’ in the stellar population, where the total stellar mass is dominated by a small number of SMSs accompanied by a large number of low-mass stars (e.g., Chon & Omukai, 2020; Prole et al., 2023a; Reinoso et al., 2023; Schleicher et al., 2023). The exact form of the mass function of Pop III (proto)stars (at the cloud scale) is still in debate, as different simulations produce highly divergent results which often suffer from poor statistics with a small number of realizations. We defer the consideration of more complex mass distributions to future work.
-
4.
Related to the previous point (iii), the dependence of fragmentation outcomes on environmental factors (e.g., , LW radiation, and halo dynamics) and cloud/disk properties (e.g., , , , , and , or even the underlying temperature, density, and velocity profiles) regulated by larger (cosmic/halo)-scale physics is also ignored in our calculation of the - relation. Recent simulations start to find hints for the existence of a non-trivial dependence (see, e.g., fig. 4 in Regan & Volonteri, 2024). The parameters for cloud/disk properties may also correlate with each other, while they are treated as independent variables in our case. One needs to analyse a large set of (multi-scale) simulations systematically covering the diverse environments of Pop III star formation to characterize the correlations between cloud/disk properties and multiplicity parameters and their dependence on the larger-scale condition of primordial star formation. Here, we simply estimate the range of possible effects of such correlations on the final masses of Pop III star clusters with controlled numerical experiments (see Sec. 2.3 and Appendix A).
-
5.
Our model does not include the effects of magnetic fields, which have been intensively investigated in recent numerical studies (e.g., McKee et al., 2020; Sharda et al., 2020; Sharda et al., 2021; Hirano et al., 2021; Prole et al., 2022b; Saad et al., 2022; Stacy et al., 2022; Hirano & Machida, 2022; Higashi et al., 2024; Sadanari et al., 2023, 2024; Sharda & Menon, 2024). Currently, (radiative) magneto-hydrodynamic simulations have converged on the picture that magnetic fields are significantly amplified by a turbulent dynamo and rotation to near equipartition with kinetic energy in the central region of primordial star-forming clouds, regardless of the initial field strength. Nevertheless, there is no census on the roles played by such strong magnetic fields during the star formation process, which may depend on the initial cloud properties. For instance, Sharda & Menon (2024, see their fig. 7) find that dynamically strong magnetic fields slow down accretion onto protostars in typical primordial star-forming clouds with . However, the simulations by Hirano et al. (2021) targeting more massive (), atomic-cooling clouds show that efficient extraction of angular momentum by magnetic fields increases the accretion rate and enhances fragmentation and protostar mergers, facilitating the growth of the primary protostar. Besides, it is shown by several groups (Sharda et al., 2020; Saad et al., 2022; Stacy et al., 2022; Hirano & Machida, 2022; Sadanari et al., 2024) that magnetic pressure and torques can efficiently suppress and even eliminate fragmentation, while Prole et al. (2022b) find that the number and total mass of protostars are unaffected by saturated magnetic fields at equipartition. It is non-trivial to model magnetic fields explicitly in a simple analytical manner. However, their effects can possibly be absorbed into some existing parameters (e.g., , , , , and ) if clearer trends can be deduced from simulations, which is an interesting topic for follow-up studies.
4 Summary and outlook
We build an analytical model for Pop III star formation to predict the final masses of Pop III clusters and stars from the (initial) properties of star-forming clouds, using physically motivated prescriptions for the following physical processes and quantities:
-
(1)
gas inflow onto the star-forming disk,
-
(2)
disk geometry and fragmentation, the resulting spatial, mass, and accretion rate distributions of protostars,
-
(3)
destruction of the star-forming disk/cloud by stellar feedback,
-
(4)
evolution of protostars regulated by their accretion histories.
The first two processes are expected to be closely related to the cloud-scale (initial) condition of star formation, while the last two processes lead to the termination of star formation (via depletion of gas supply or stellar collapse/explosion). Any self-consistent model of star formation must consider these four aspects. The basic idea of our model is to express them as functions of the total mass of protostars, so that the final mass can be easily obtained in a root-finding process.
To be specific, given the initial gas inflow rate onto the star-forming disk, we use power-law scaling relations between mass, size, and time to describe the (smoothed) median evolution of Pop III protostar systems (Sec. 2.1), which is combined with a phenomenological fragmentation model (see Sec. 2.3 and Appendix A) to handle points (i) and (ii), based on the results of (magneto-) hydrodynamic simulations (Liu et al., 2021b; Sharda et al., 2020). For point (iii), we calculate the disk photo-evaporation rate as a function of the production rates of ionizing photons from individual protostars (Tanaka et al., 2013) considering different spatial configurations of protostars and their circumstellar disks from point (ii). Besides, for point (iv), we include the bloating phase of protostar evolution with negligible ionizing power, triggered by high accretion rates (, Hosokawa et al., 2013; Haemmerlé et al., 2018; Herrington et al., 2023; Nandal et al., 2023), and consider the finite lifetimes and maximum masses of stars before collapse/explosion (see Sec. 2.2).
Despite its simplicity, our model covers the full range of outcomes of Pop III star formation known to date, from ordinary small () clusters in molecular-cooling clouds to massive () clusters containing supermassive () stars (SMSs) under violent collapse () of atomic-cooling clouds, reproducing relevant simulation results (Hirano et al., 2014; Sugimura et al., 2023; Toyouchi et al., 2023). Moreover, our model specifically considers the interplay between feedback and fragmentation. We find that enhanced fragmentation tends to increase the final mass of the star cluster regulated by photo-ionization feedback under low gas inflow rates (). However, it suppresses the formation of SMSs in higher- clouds not only by internal starvation (Prole et al., 2022a) but also due to the decrease of final cluster mass caused by enhanced photo-ionization feedback from low-mass slowly-accreting () stars.
As an example, we apply our model to the Pop III star-forming clouds in the main progenitors of typical haloes hosting high- luminous quasars with at (Li et al., 2021), which predicts broad mass distributions for Pop III clusters and stars extending to a few (Sec. 3.1). This shows that the formation of Pop III massive clusters is common (among of the Pop III star-forming haloes) in such biased () regions, which favours the production of dynamical Pop III BBH mergers with distinct gravitational wave signatures (Wang et al., 2022b; Liu et al., 2023; Mestichelli et al., 2024). The corresponding SFE (ratio of the total stellar and gas masses in the halo) covers a broad range , and is generally higher for more massive clusters. As the number of stars per cloud increases, the shape of the overall stellar mass distribution becomes more similar to that of the protostar mass distribution assumed in the fragmentation model (for individual clouds), while it closely follows the cluster mass distribution when fragmentation is inefficient (). This indicates that the overall IMF of Pop III stars is regulated by both large-scale physics (embodied by the gas inflow rate distribution for Pop III star-forming clouds) and small-scale fragmentation/feedback processes. When fragmentation is inefficient (), the resulting Pop III SMSs as progenitors of heavy () BH seeds can account for a significant fraction () of observed luminous () quasars at (e.g., Greene et al., 2024; Matthee et al., 2024; Kokorev et al., 2023; Akins et al., 2024) powered by SMBHs with . On the other hand, if we extend this trend to present-day star formation in a metal-enriched medium (by increasing and the slope of the protostar mass distribution), where cooling and fragmentation are much more efficient compared with the Pop III case, the overall IMF is mostly shaped by small-scale processes rather than large-scale physics, such that it becomes nearly universal as long as the IMF in individual star clusters is relatively insensitive to cloud/cluster properties131313To what extent (or at which scale) the IMF of present-day stars remains universal is still in debate. Recent observations and simulations have discovered hints for a non-trivial dependence of the IMF on various properties of the star-forming environment (e.g., metallicity, temperature, density, star formation rate, and cloud mass, Marks et al., 2012; Jeřábková et al., 2018; Lacchin et al., 2020; Gunawardhana et al., 2011; Cheng et al., 2023; Dib, 2023; Grudic et al., 2023; Rusakov et al., 2023; Yan et al., 2023; Tanvir & Krumholz, 2024)..
Finally, we also discuss the potential missing pieces and directions to improve the model, such as stochastic evolution, core fragmentation, complex forms of protostar mass distribution, correlations between cloud/disk properties and multiplicity parameters, their dependence on the larger-scale condition of primordial star formation, and the effects of magnetic fields (Sec. 3.2). In conclusion, our cloud/disk-scale analytical model for Pop III star formation can be incorporated into semi-analytical models (e.g., Manrique et al., 2015; Griffen et al., 2018; Dayal et al., 2020; Visbal et al., 2020; Li et al., 2021; Lupi et al., 2021; Hartwig et al., 2022; Hegde & Furlanetto, 2023; Nebrin et al., 2023; Bovill et al., 2024; Ventura et al., 2024; Feathers et al., 2024; Trinca et al., 2024) and cosmological hydrodynamic simulations (e.g., Johnson et al., 2013; Smith et al., 2015; Skinner & Wise, 2020; Kulkarni et al., 2021; Schauer et al., 2021; Kiyuna et al., 2023; Yajima et al., 2022; Garcia et al., 2023; Lenoble et al., 2024; Sugimura et al., 2024) that focus on larger (cosmic/halo)-scale physics (e.g., structure formation, radiation backgrounds, baryons-dark matter streaming motion, and metal enrichment) to self-consistently follow the formation and feedback of Pop III stars across all scales in a cosmologically representative volume. Such self-consistent modelling is necessary to make comprehensive predictions on the observational signatures and imprints of Pop III stars and their BH remnants, which can be directly compared with multi-messenger observations of Cosmic Dawn to validate and advance our theories of early star/galaxy/BH formation.
Acknowledgements
The authors thank Wenxiu Li![]() for providing the data underlying Li
et al. (2021). We thank Piyush Sharda
for providing the data underlying Li
et al. (2021). We thank Piyush Sharda![]() for providing the data for protostar accretion histories from the simulations shown in Sharda
et al. (2020). We thank Daisuke Toyouchi
for providing the data for protostar accretion histories from the simulations shown in Sharda
et al. (2020). We thank Daisuke Toyouchi![]() for useful discussions and Anastasia Fialkov for helpful comments on the manuscript. BL gratefully acknowledges the support of the Royal Society University Research Fellowship. Research at Perimeter Institute is supported in part by the Government of Canada through the Department of Innovation, Science and Economic Development Canada and by the Province of Ontario through the Ministry of Colleges and Universities. The development of this paper benefited from in-person discussions at the Dark Matter, First Light workshop hosted by the Perimeter Institute for Theoretical Physics and the First Star VII conference organized by the Flatiron Institute and Columbia University. We thank the organizers of these events for providing us platforms to exchange ideas.
for useful discussions and Anastasia Fialkov for helpful comments on the manuscript. BL gratefully acknowledges the support of the Royal Society University Research Fellowship. Research at Perimeter Institute is supported in part by the Government of Canada through the Department of Innovation, Science and Economic Development Canada and by the Province of Ontario through the Ministry of Colleges and Universities. The development of this paper benefited from in-person discussions at the Dark Matter, First Light workshop hosted by the Perimeter Institute for Theoretical Physics and the First Star VII conference organized by the Flatiron Institute and Columbia University. We thank the organizers of these events for providing us platforms to exchange ideas.
Data Availability
The code and data underlying this paper will be shared on reasonable request to the corresponding author.
References
- Abbott et al. (2020a) Abbott R., et al., 2020a, Phys. Rev. Lett., 125, 101102
- Abbott et al. (2020b) Abbott R., et al., 2020b, ApJ, 900, L13
- Abel et al. (2002) Abel T., Bryan G. L., Norman M. L., 2002, Science, 295, 93
- Adamo et al. (2024) Adamo A., et al., 2024, arXiv e-prints, p. arXiv:2405.21054
- Akins et al. (2024) Akins H. B., et al., 2024, arXiv e-prints, p. arXiv:2406.10341
- Alvarez et al. (2006) Alvarez M. A., Bromm V., Shapiro P. R., 2006, ApJ, 639, 621
- Angel et al. (2008) Angel R., et al., 2008, ApJ, 680, 1582
- Aryan et al. (2023) Aryan A., Pandey S. B., Gupta R., Ror A. K., 2023, MNRAS, 521, L17
- Austin et al. (2024) Austin D., et al., 2024, arXiv e-prints, p. arXiv:2404.10751
- Barkana (2016) Barkana R., 2016, Phys. Rep., 645, 1
- Begelman (2010) Begelman M. C., 2010, MNRAS, 402, 673
- Belczynski et al. (2016) Belczynski K., et al., 2016, A&A, 594, A97
- Bhatawdekar & Conselice (2021) Bhatawdekar R., Conselice C. J., 2021, ApJ, 909, 144
- Bhowmick et al. (2024) Bhowmick A. K., et al., 2024, arXiv e-prints, p. arXiv:2406.14658
- Boekholt et al. (2018) Boekholt T. C. N., Schleicher D. R. G., Fellhauer M., Klessen R. S., Reinoso B., Stutz A. M., Haemmerlé L., 2018, MNRAS, 476, 366
- Bovill et al. (2024) Bovill M. S., Stiavelli M., Wiggins A. I., Ricotti M., Trenti M., 2024, ApJ, 962, 49
- Bromm (2013) Bromm V., 2013, Reports on Progress in Physics, 76, 112901
- Bromm & Loeb (2003) Bromm V., Loeb A., 2003, ApJ, 596, 34
- Bromm & Loeb (2004) Bromm V., Loeb A., 2004, New Astron., 9, 353
- Bromm & Yoshida (2011) Bromm V., Yoshida N., 2011, ARA&A, 49, 373
- Bromm et al. (2001) Bromm V., Kudritzki R. P., Loeb A., 2001, ApJ, 552, 464
- Bromm et al. (2002) Bromm V., Coppi P. S., Larson R. B., 2002, ApJ, 564, 23
- Bromm et al. (2009) Bromm V., Yoshida N., Hernquist L., McKee C. F., 2009, Nature, 459, 49
- Cameron et al. (2023) Cameron A. J., Katz H., Rey M. P., Saxena A., 2023, MNRAS, 523, 3516
- Cammelli et al. (2024) Cammelli V., Monaco P., Tan J. C., Singh J., Fontanot F., De Lucia G., Hirschmann M., Xie L., 2024, arXiv e-prints, p. arXiv:2407.09949
- Chatterjee et al. (2020) Chatterjee A., Dayal P., Choudhury T. R., Schneider R., 2020, MNRAS, 496, 1445
- Cheng et al. (2023) Cheng C. M., Villaume A., Balogh M. L., Brodie J. P., Martín-Navarro I., Romanowsky A. J., van Dokkum P. G., 2023, MNRAS, 526, 4004
- Chiaki et al. (2023) Chiaki G., Chon S., Omukai K., Trinca A., Schneider R., Valiante R., 2023, MNRAS, 521, 2845
- Chon & Omukai (2020) Chon S., Omukai K., 2020, MNRAS, 494, 2851
- Chon et al. (2018) Chon S., Hosokawa T., Yoshida N., 2018, MNRAS, 475, 4104
- Chon et al. (2021) Chon S., Omukai K., Schneider R., 2021, MNRAS, 508, 4175
- Chon et al. (2022) Chon S., Ono H., Omukai K., Schneider R., 2022, MNRAS, 514, 4639
- Clark et al. (2011) Clark P. C., Glover S. C. O., Smith R. J., Greif T. H., Klessen R. S., Bromm V., 2011, Science, 331, 1040
- Correa Magnus et al. (2024) Correa Magnus L., Smith B. D., Khochfar S., O’Shea B. W., Wise J. H., Norman M. L., Turk M. J., 2024, MNRAS, 527, 307
- Costa et al. (2023) Costa G., Mapelli M., Iorio G., Santoliquido F., Escobar G. J., Klessen R. S., Bressan A., 2023, MNRAS, 525, 2891
- Coughlin & Begelman (2024) Coughlin E. R., Begelman M. C., 2024, arXiv e-prints, p. arXiv:2405.00084
- Cueto et al. (2024) Cueto E. R., Hutter A., Dayal P., Gottlöber S., Heintz K. E., Mason C., Trebitsch M., Yepes G., 2024, A&A, 686, A138
- Cullen et al. (2024) Cullen F., et al., 2024, MNRAS, 531, 997
- D’Eugenio et al. (2023) D’Eugenio F., et al., 2023, arXiv e-prints, p. arXiv:2311.09908
- Dayal & Ferrara (2018) Dayal P., Ferrara A., 2018, Phys. Rep., 780, 1
- Dayal et al. (2020) Dayal P., et al., 2020, MNRAS, 495, 3065
- Dib (2023) Dib S., 2023, ApJ, 959, 88
- Diemer (2018) Diemer B., 2018, ApJS, 239, 35
- Durodola et al. (2024) Durodola E., Pacucci F., Hickox R. C., 2024, arXiv e-prints, p. arXiv:2406.10329
- Dutta et al. (2020) Dutta J., Sur S., Stacy A., Bagla J. S., 2020, ApJ, 901, 16
- Ekström et al. (2008) Ekström S., Meynet G., Chiappini C., Hirschi R., Maeder A., 2008, A&A, 489, 685
- El-Badry et al. (2018) El-Badry K., et al., 2018, MNRAS, 480, 652
- Evans et al. (2023) Evans M., et al., 2023, arXiv e-prints, p. arXiv:2306.13745
- Fan et al. (2001) Fan X., et al., 2001, AJ, 122, 2833
- Fan et al. (2023) Fan X., Bañados E., Simcoe R. A., 2023, ARA&A, 61, 373
- Farrell et al. (2021) Farrell E., Groh J. H., Hirschi R., Murphy L., Kaiser E., Ekström S., Georgy C., Meynet G., 2021, MNRAS, 502, L40
- Feathers et al. (2024) Feathers C. R., Kulkarni M., Visbal E., Hazlett R., 2024, ApJ, 962, 62
- Fernandez et al. (2014) Fernandez R., Bryan G. L., Haiman Z., Li M., 2014, MNRAS, 439, 3798
- Fialkov (2014) Fialkov A., 2014, International Journal of Modern Physics D, 23, 1430017
- Fialkov et al. (2012) Fialkov A., Barkana R., Tseliakhovich D., Hirata C. M., 2012, MNRAS, 424, 1335
- Fialkov et al. (2023) Fialkov A., Gessey-Jones T., Dhandha J., 2023, arXiv e-prints, p. arXiv:2311.05366
- Finkelstein et al. (2023) Finkelstein S. L., et al., 2023, arXiv e-prints, p. arXiv:2311.04279
- Fragione & Pacucci (2023) Fragione G., Pacucci F., 2023, ApJ, 958, L24
- Franciolini et al. (2024) Franciolini G., Kritos K., Reali L., Broekgaarden F., Berti E., 2024, arXiv e-prints, p. arXiv:2401.13038
- Frebel & Norris (2015) Frebel A., Norris J. E., 2015, ARA&A, 53, 631
- Fryer et al. (2022) Fryer C. L., Lien A. Y., Fruchter A., Ghirlanda G., Hartmann D., Salvaterra R., Upton Sanderbeck P. R., Johnson J. L., 2022, ApJ, 929, 111
- Fukushima et al. (2018) Fukushima H., Omukai K., Hosokawa T., 2018, MNRAS, 473, 4754
- Fukushima et al. (2020) Fukushima H., Hosokawa T., Chiaki G., Omukai K., Yoshida N., Kuiper R., 2020, MNRAS, 497, 829
- Garcia et al. (2023) Garcia F. A. B., Ricotti M., Sugimura K., Park J., 2023, MNRAS, 522, 2495
- Gardner et al. (2006) Gardner J. P., et al., 2006, Space Sci. Rev., 123, 485
- Gessey-Jones et al. (2022) Gessey-Jones T., et al., 2022, MNRAS, 516, 841
- Goulding et al. (2023) Goulding A. D., et al., 2023, ApJ, 955, L24
- Greene et al. (2024) Greene J. E., et al., 2024, ApJ, 964, 39
- Greif et al. (2011) Greif T. H., Springel V., White S. D. M., Glover S. C. O., Clark P. C., Smith R. J., Klessen R. S., Bromm V., 2011, ApJ, 737, 75
- Greif et al. (2012) Greif T. H., Bromm V., Clark P. C., Glover S. C. O., Smith R. J., Klessen R. S., Yoshida N., Springel V., 2012, MNRAS, 424, 399
- Griffen et al. (2018) Griffen B. F., Dooley G. A., Ji A. P., O’Shea B. W., Gómez F. A., Frebel A., 2018, MNRAS, 474, 443
- Grisdale et al. (2021) Grisdale K., Thatte N., Devriendt J., Pereira-Santaella M., Slyz A., Kimm T., Dubois Y., Yi S. K., 2021, MNRAS, 501, 5517
- Grudic et al. (2023) Grudic M. Y., Offner S. S. R., Guszejnov D., Faucher-Giguère C.-A., Hopkins P. F., 2023, The Open Journal of Astrophysics, 6, 48
- Gunawardhana et al. (2011) Gunawardhana M. L. P., et al., 2011, MNRAS, 415, 1647
- Gurian et al. (2024) Gurian J., Jeong D., Liu B., 2024, ApJ, 963, 33
- Haemmerlé (2021) Haemmerlé L., 2021, A&A, 647, A83
- Haemmerlé (2024) Haemmerlé L., 2024, arXiv e-prints, p. arXiv:2407.01594
- Haemmerlé et al. (2018) Haemmerlé L., Woods T. E., Klessen R. S., Heger A., Whalen D. J., 2018, MNRAS, 474, 2757
- Haemmerlé et al. (2020) Haemmerlé L., Mayer L., Klessen R. S., Hosokawa T., Madau P., Bromm V., 2020, Space Sci. Rev., 216, 48
- Harikane et al. (2023) Harikane Y., et al., 2023, ApJ, 959, 39
- Harikane et al. (2024) Harikane Y., et al., 2024, arXiv e-prints, p. arXiv:2406.18352
- Hartwig et al. (2015) Hartwig T., Bromm V., Klessen R. S., Glover S. C. O., 2015, MNRAS, 447, 3892
- Hartwig et al. (2022) Hartwig T., et al., 2022, ApJ, 936, 45
- Hartwig et al. (2023) Hartwig T., Ishigaki M. N., Kobayashi C., Tominaga N., Nomoto K., 2023, ApJ, 946, 20
- Hegde & Furlanetto (2023) Hegde S., Furlanetto S. R., 2023, MNRAS, 525, 428
- Heger & Woosley (2002) Heger A., Woosley S. E., 2002, ApJ, 567, 532
- Heger & Woosley (2010) Heger A., Woosley S. E., 2010, ApJ, 724, 341
- Heger et al. (2003) Heger A., Fryer C. L., Woosley S. E., Langer N., Hartmann D. H., 2003, ApJ, 591, 288
- Herrington et al. (2023) Herrington N. P., Whalen D. J., Woods T. E., 2023, MNRAS, 521, 463
- Higashi et al. (2022) Higashi S., Susa H., Chiaki G., 2022, ApJ, 940, 38
- Higashi et al. (2024) Higashi S., Susa H., Federrath C., Chiaki G., 2024, ApJ, 962, 158
- Hirano & Bromm (2017) Hirano S., Bromm V., 2017, MNRAS, 470, 898
- Hirano & Bromm (2018) Hirano S., Bromm V., 2018, MNRAS, 476, 3964
- Hirano & Machida (2022) Hirano S., Machida M. N., 2022, ApJ, 935, L16
- Hirano et al. (2014) Hirano S., Hosokawa T., Yoshida N., Umeda H., Omukai K., Chiaki G., Yorke H. W., 2014, ApJ, 781, 60
- Hirano et al. (2015) Hirano S., Hosokawa T., Yoshida N., Omukai K., Yorke H. W., 2015, MNRAS, 448, 568
- Hirano et al. (2017) Hirano S., Hosokawa T., Yoshida N., Kuiper R., 2017, Science, 357, 1375
- Hirano et al. (2018) Hirano S., Yoshida N., Sakurai Y., Fujii M. S., 2018, ApJ, 855, 17
- Hirano et al. (2021) Hirano S., Machida M. N., Basu S., 2021, ApJ, 917, 34
- Hirano et al. (2023) Hirano S., Shen Y., Nishijima S., Sakai Y., Umeda H., 2023, MNRAS, 525, 5737
- Hosokawa & Omukai (2009) Hosokawa T., Omukai K., 2009, ApJ, 703, 1810
- Hosokawa et al. (2011) Hosokawa T., Omukai K., Yoshida N., Yorke H. W., 2011, Science, 334, 1250
- Hosokawa et al. (2013) Hosokawa T., Yorke H. W., Inayoshi K., Omukai K., Yoshida N., 2013, ApJ, 778, 178
- Hosokawa et al. (2016) Hosokawa T., Hirano S., Kuiper R., Yorke H. W., Omukai K., Yoshida N., 2016, ApJ, 824, 119
- Hu et al. (2022) Hu H., Inayoshi K., Haiman Z., Li W., Quataert E., Kuiper R., 2022, ApJ, 935, 140
- Inayoshi & Haiman (2014) Inayoshi K., Haiman Z., 2014, MNRAS, 445, 1549
- Inayoshi & Ichikawa (2024) Inayoshi K., Ichikawa K., 2024, arXiv e-prints, p. arXiv:2402.14706
- Inayoshi et al. (2018) Inayoshi K., Li M., Haiman Z., 2018, MNRAS, 479, 4017
- Inayoshi et al. (2020) Inayoshi K., Visbal E., Haiman Z., 2020, ARA&A, 58, 27
- Inayoshi et al. (2022a) Inayoshi K., Nakatani R., Toyouchi D., Hosokawa T., Kuiper R., Onoue M., 2022a, ApJ, 927, 237
- Inayoshi et al. (2022b) Inayoshi K., Harikane Y., Inoue A. K., Li W., Ho L. C., 2022b, ApJ, 938, L10
- Incatasciato et al. (2023) Incatasciato A., Khochfar S., Oñorbe J., 2023, MNRAS, 522, 330
- Inoue & Yoshida (2020) Inoue S., Yoshida N., 2020, MNRAS, 491, L24
- Ishiyama et al. (2016) Ishiyama T., Sudo K., Yokoi S., Hasegawa K., Tominaga N., Susa H., 2016, ApJ, 826, 9
- Ito & Omukai (2024) Ito M., Omukai K., 2024, arXiv e-prints, p. arXiv:2405.10073
- Iwamoto et al. (2005) Iwamoto N., Umeda H., Tominaga N., Nomoto K., Maeda K., 2005, Science, 309, 451
- Iwaya et al. (2023) Iwaya M., Kinugawa T., Tagoshi H., 2023, arXiv e-prints, p. arXiv:2312.17491
- Jaura et al. (2022) Jaura O., Glover S. C. O., Wollenberg K. M. J., Klessen R. S., Geen S., Haemmerlé L., 2022, MNRAS, 512, 116
- Jeon et al. (2015) Jeon M., Bromm V., Pawlik A. H., Milosavljević M., 2015, MNRAS, 452, 1152
- Jeon et al. (2023) Jeon J., Liu B., Bromm V., Finkelstein S. L., 2023, MNRAS, 524, 176
- Jeon et al. (2024) Jeon J., Bromm V., Liu B., Finkelstein S. L., 2024, arXiv e-prints, p. arXiv:2402.18773
- Jeřábková et al. (2018) Jeřábková T., Hasani Zonoozi A., Kroupa P., Beccari G., Yan Z., Vazdekis A., Zhang Z. Y., 2018, A&A, 620, A39
- Ji et al. (2024) Ji X., et al., 2024, arXiv e-prints, p. arXiv:2404.04148
- Johnson & Haardt (2016) Johnson J. L., Haardt F., 2016, Publ. Astron. Soc. Australia, 33, e007
- Johnson et al. (2012) Johnson J. L., Whalen D. J., Fryer C. L., Li H., 2012, ApJ, 750, 66
- Johnson et al. (2013) Johnson J. L., Dalla Vecchia C., Khochfar S., 2013, MNRAS, 428, 1857
- Juodžbalis et al. (2024) Juodžbalis I., et al., 2024, arXiv e-prints, p. arXiv:2403.03872
- Karlsson et al. (2013) Karlsson T., Bromm V., Bland-Hawthorn J., 2013, Reviews of Modern Physics, 85, 809
- Katz et al. (2023) Katz H., Kimm T., Ellis R. S., Devriendt J., Slyz A., 2023, MNRAS, 524, 351
- Kimura et al. (2021) Kimura K., Hosokawa T., Sugimura K., 2021, ApJ, 911, 52
- Kimura et al. (2023) Kimura K., Hosokawa T., Sugimura K., Fukushima H., 2023, ApJ, 950, 184
- Kinugawa et al. (2020) Kinugawa T., Nakamura T., Nakano H., 2020, MNRAS, 498, 3946
- Kinugawa et al. (2021a) Kinugawa T., Nakamura T., Nakano H., 2021a, MNRAS, 501, L49
- Kinugawa et al. (2021b) Kinugawa T., Nakamura T., Nakano H., 2021b, MNRAS, 504, L28
- Kiyuna et al. (2023) Kiyuna M., Hosokawa T., Chon S., 2023, MNRAS, 523, 1496
- Klessen & Glover (2023) Klessen R. S., Glover S. C. O., 2023, ARA&A, 61, 65
- Kobayashi et al. (2006) Kobayashi C., Umeda H., Nomoto K., Tominaga N., Ohkubo T., 2006, ApJ, 653, 1145
- Kocevski et al. (2024) Kocevski D. D., et al., 2024, arXiv e-prints, p. arXiv:2404.03576
- Kokorev et al. (2023) Kokorev V., et al., 2023, ApJ, 957, L7
- Komiya et al. (2016) Komiya Y., Suda T., Fujimoto M. Y., 2016, ApJ, 820, 59
- Kulkarni et al. (2021) Kulkarni M., Visbal E., Bryan G. L., 2021, ApJ, 917, 40
- Kulkarni et al. (2022) Kulkarni M., Visbal E., Bryan G. L., Li X., 2022, ApJ, 941, L18
- Lacchin et al. (2020) Lacchin E., Matteucci F., Vincenzo F., Palla M., 2020, MNRAS, 495, 3276
- Larkin et al. (2023) Larkin M. M., Gerasimov R., Burgasser A. J., 2023, AJ, 165, 2
- Latif & Khochfar (2020) Latif M. A., Khochfar S., 2020, MNRAS, 497, 3761
- Latif et al. (2021) Latif M. A., Khochfar S., Schleicher D., Whalen D. J., 2021, MNRAS, 508, 1756
- Latif et al. (2022a) Latif M. A., Whalen D. J., Khochfar S., Herrington N. P., Woods T. E., 2022a, Nature, 607, 48
- Latif et al. (2022b) Latif M. A., Whalen D., Khochfar S., 2022b, ApJ, 925, 28
- Lazar & Bromm (2022) Lazar A., Bromm V., 2022, MNRAS, 511, 2505
- Lenoble et al. (2024) Lenoble R., Commerçon B., Rosdahl J., 2024, A&A, 685, A7
- Li et al. (2021) Li W., Inayoshi K., Qiu Y., 2021, ApJ, 917, 60
- Li et al. (2023) Li W., Inayoshi K., Onoue M., Toyouchi D., 2023, ApJ, 950, 85
- Liu & Bromm (2020a) Liu B., Bromm V., 2020a, MNRAS, 495, 2475
- Liu & Bromm (2020b) Liu B., Bromm V., 2020b, MNRAS, 497, 2839
- Liu & Bromm (2020c) Liu B., Bromm V., 2020c, ApJ, 903, L40
- Liu & Bromm (2021) Liu B., Bromm V., 2021, MNRAS, 506, 5451
- Liu et al. (2019) Liu B., Jaacks J., Finkelstein S. L., Bromm V., 2019, MNRAS, 486, 3617
- Liu et al. (2021a) Liu B., Meynet G., Bromm V., 2021a, MNRAS, 501, 643
- Liu et al. (2021b) Liu B., Sibony Y., Meynet G., Bromm V., 2021b, MNRAS, 506, 5247
- Liu et al. (2022) Liu B., Zhang S., Bromm V., 2022, MNRAS, 514, 2376
- Liu et al. (2023) Liu S., Wang L., Hu Y.-M., Tanikawa A., Trani A. A., 2023, arXiv e-prints, p. arXiv:2311.05393
- Liu et al. (2024) Liu B., et al., 2024, arXiv e-prints, p. arXiv:2406.17397
- Loeb & Furlanetto (2013) Loeb A., Furlanetto S. R., 2013, The First Galaxies in the Universe. Princeton Univ. Press, Princeton, NJ
- Lupi et al. (2021) Lupi A., Haiman Z., Volonteri M., 2021, MNRAS, 503, 5046
- Lupi et al. (2023) Lupi A., Quadri G., Volonteri M., Colpi M., Regan J. A., 2023, arXiv e-prints, p. arXiv:2312.08422
- Maeda & Nomoto (2003) Maeda K., Nomoto K., 2003, ApJ, 598, 1163
- Magg et al. (2018) Magg M., Hartwig T., Agarwal B., Frebel A., Glover S. C. O., Griffen B. F., Klessen R. S., 2018, MNRAS, 473, 5308
- Magg et al. (2019) Magg M., Klessen R. S., Glover S. C. O., Li H., 2019, MNRAS, 487, 486
- Maggiore et al. (2020) Maggiore M., et al., 2020, J. Cosmology Astropart. Phys., 2020, 050
- Maiolino et al. (2023a) Maiolino R., et al., 2023a, arXiv e-prints, p. arXiv:2306.00953
- Maiolino et al. (2023b) Maiolino R., et al., 2023b, arXiv e-prints, p. arXiv:2308.01230
- Maiolino et al. (2024) Maiolino R., et al., 2024, Nature, 627, 59
- Manrique et al. (2015) Manrique A., et al., 2015, ApJS, 216, 13
- Mapelli et al. (2020) Mapelli M., Spera M., Montanari E., Limongi M., Chieffi A., Giacobbo N., Bressan A., Bouffanais Y., 2020, ApJ, 888, 76
- Marchant & Moriya (2020) Marchant P., Moriya T. J., 2020, A&A, 640, L18
- Marchant et al. (2019) Marchant P., Renzo M., Farmer R., Pappas K. M. W., Taam R. E., de Mink S. E., Kalogera V., 2019, ApJ, 882, 36
- Marks et al. (2012) Marks M., Kroupa P., Dabringhausen J., Pawlowski M. S., 2012, MNRAS, 422, 2246
- Martinet et al. (2023) Martinet S., Meynet G., Ekström S., Georgy C., Hirschi R., 2023, arXiv e-prints, p. arXiv:2309.00062
- Massonneau et al. (2023) Massonneau W., Volonteri M., Dubois Y., Beckmann R. S., 2023, A&A, 670, A180
- Matsuoka et al. (2016) Matsuoka Y., et al., 2016, ApJ, 828, 26
- Matthee et al. (2024) Matthee J., et al., 2024, ApJ, 963, 129
- McKee & Tan (2002) McKee C. F., Tan J. C., 2002, Nature, 416, 59
- McKee & Tan (2003) McKee C. F., Tan J. C., 2003, ApJ, 585, 850
- McKee & Tan (2008) McKee C. F., Tan J. C., 2008, ApJ, 681, 771
- McKee et al. (2020) McKee C. F., Stacy A., Li P. S., 2020, MNRAS, 496, 5528
- Menon et al. (2024) Menon S. H., Lancaster L., Burkhart B., Somerville R. S., Dekel A., Krumholz M. R., 2024, ApJ, 967, L28
- Mestichelli et al. (2024) Mestichelli B., Mapelli M., Torniamenti S., Sedda M. A., Branchesi M., Costa G., Iorio G., Santoliquido F., 2024, arXiv e-prints, p. arXiv:2405.06037
- Meynet et al. (2006) Meynet G., Ekström S., Maeder A., 2006, A&A, 447, 623
- Murphy et al. (2021) Murphy L. J., et al., 2021, MNRAS, 501, 2745
- Nakajima & Maiolino (2022) Nakajima K., Maiolino R., 2022, MNRAS, 513, 5134
- Nanayakkara et al. (2023) Nanayakkara T., et al., 2023, ApJ, 947, L26
- Nandal et al. (2023) Nandal D., Regan J. A., Woods T. E., Farrell E., Ekström S., Meynet G., 2023, A&A, 677, A155
- Nandal et al. (2024a) Nandal D., Sibony Y., Tsiatsiou S., 2024a, arXiv e-prints, p. arXiv:2405.11235
- Nandal et al. (2024b) Nandal D., Zwick L., Whalen D. J., Mayer L., Ekström S., Meynet G., 2024b, arXiv e-prints, p. arXiv:2407.06994
- Nandal et al. (2024c) Nandal D., Regan J. A., Woods T. E., Farrell E., Ekström S., Meynet G., 2024c, A&A, 683, A156
- Nandal et al. (2024d) Nandal D., Farrell E., Buldgen G., Meynet G., Ekström S., 2024d, A&A, 685, A159
- Nebrin et al. (2019) Nebrin O., Ghara R., Mellema G., 2019, J. Cosmology Astropart. Phys., 2019, 051
- Nebrin et al. (2023) Nebrin O., Giri S. K., Mellema G., 2023, MNRAS, 524, 2290
- Nomoto et al. (2013) Nomoto K., Kobayashi C., Tominaga N., 2013, ARA&A, 51, 457
- Omukai & Inutsuka (2002) Omukai K., Inutsuka S.-i., 2002, MNRAS, 332, 59
- Omukai & Nishi (1998) Omukai K., Nishi R., 1998, ApJ, 508, 141
- Omukai & Palla (2001) Omukai K., Palla F., 2001, ApJ, 561, L55
- Omukai & Palla (2003) Omukai K., Palla F., 2003, ApJ, 589, 677
- Omukai et al. (2005) Omukai K., Tsuribe T., Schneider R., Ferrara A., 2005, ApJ, 626, 627
- Onoue et al. (2019) Onoue M., et al., 2019, ApJ, 880, 77
- Park et al. (2021) Park J., Ricotti M., Sugimura K., 2021, MNRAS, 508, 6193
- Park et al. (2022) Park K., Chiaki G., Wise J. H., 2022, ApJ, 936, 116
- Park et al. (2023) Park J., Ricotti M., Sugimura K., 2023, MNRAS, 521, 5334
- Park et al. (2024) Park J., Ricotti M., Sugimura K., 2024, MNRAS, 528, 6895
- Pawlik et al. (2013) Pawlik A. H., Milosavljević M., Bromm V., 2013, ApJ, 767, 59
- Planck Collaboration et al. (2016) Planck Collaboration et al., 2016, A&A, 594, A13
- Prole et al. (2022a) Prole L. R., Clark P. C., Klessen R. S., Glover S. C. O., 2022a, MNRAS, 510, 4019
- Prole et al. (2022b) Prole L. R., Clark P. C., Klessen R. S., Glover S. C. O., Pakmor R., 2022b, MNRAS, 516, 2223
- Prole et al. (2023a) Prole L. R., Regan J. A., Glover S. C. O., Klessen R. S., Priestley F. D., Clark P. C., 2023a, arXiv e-prints, p. arXiv:2312.06769
- Prole et al. (2023b) Prole L. R., Schauer A. T. P., Clark P. C., Glover S. C. O., Priestley F. D., Klessen R. S., 2023b, MNRAS, 520, 2081
- Punturo et al. (2010) Punturo M., et al., 2010, Classical and Quantum Gravity, 27, 194002
- Raghuvanshi & Dutta (2023) Raghuvanshi S. P., Dutta J., 2023, ApJ, 944, 76
- Regan (2023) Regan J., 2023, The Open Journal of Astrophysics, 6, 12
- Regan & Volonteri (2024) Regan J., Volonteri M., 2024, arXiv e-prints, p. arXiv:2405.17975
- Regan et al. (2014) Regan J. A., Johansson P. H., Wise J. H., 2014, ApJ, 795, 137
- Regan et al. (2017) Regan J. A., Visbal E., Wise J. H., Haiman Z., Johansson P. H., Bryan G. L., 2017, Nature Astronomy, 1, 0075
- Regan et al. (2020a) Regan J. A., Wise J. H., Woods T. E., Downes T. P., O’Shea B. W., Norman M. L., 2020a, The Open Journal of Astrophysics, 3, 15
- Regan et al. (2020b) Regan J. A., Wise J. H., O’Shea B. W., Norman M. L., 2020b, MNRAS, 492, 3021
- Reinoso et al. (2023) Reinoso B., Klessen R. S., Schleicher D., Glover S. C. O., Solar P., 2023, MNRAS, 521, 3553
- Reitze et al. (2019) Reitze D., et al., 2019, in Bulletin of the American Astronomical Society. p. 35 (arXiv:1907.04833), doi:10.48550/arXiv.1907.04833
- Rhodes et al. (2020) Rhodes J. D., Huff E., Masters D., Nierenberg A., 2020, AJ, 160, 261
- Riaz et al. (2018) Riaz R., Bovino S., Vanaverbeke S., Schleicher D. R. G., 2018, MNRAS, 479, 667
- Riaz et al. (2022a) Riaz R., Schleicher D. R. G., Bovino S., Vanaverbeke S., Klessen R. S., 2022a, arXiv e-prints, p. arXiv:2211.04413
- Riaz et al. (2022b) Riaz S., Hartwig T., Latif M. A., 2022b, ApJ, 937, L6
- Riaz et al. (2023) Riaz R., Schleicher D. R. G., Bovino S., Vanaverbeke S., Klessen R. S., 2023, MNRAS, 518, 4895
- Rossi et al. (2021) Rossi M., Salvadori S., Skúladóttir Á., 2021, MNRAS, 503, 6026
- Rossi et al. (2024) Rossi M., Salvadori S., Skúladóttir Á., Vanni I., Koutsouridou I., 2024, arXiv e-prints, p. arXiv:2406.12960
- Rusakov et al. (2023) Rusakov V., Steinhardt C. L., Sneppen A., 2023, ApJS, 268, 10
- Saad et al. (2022) Saad C. R., Bromm V., El Eid M., 2022, MNRAS, 516, 3130
- Sadanari et al. (2023) Sadanari K. E., Omukai K., Sugimura K., Matsumoto T., Tomida K., 2023, MNRAS, 519, 3076
- Sadanari et al. (2024) Sadanari K. E., Omukai K., Sugimura K., Matsumoto T., Tomida K., 2024, arXiv e-prints, p. arXiv:2405.15045
- Saio et al. (2024) Saio H., Nandal D., Ekstroem S., Meynet G., 2024, arXiv e-prints, p. arXiv:2406.18040
- Sakurai et al. (2015) Sakurai Y., Hosokawa T., Yoshida N., Yorke H. W., 2015, MNRAS, 452, 755
- Sakurai et al. (2016) Sakurai Y., Vorobyov E. I., Hosokawa T., Yoshida N., Omukai K., Yorke H. W., 2016, MNRAS, 459, 1137
- Sakurai et al. (2017) Sakurai Y., Yoshida N., Fujii M. S., Hirano S., 2017, MNRAS, 472, 1677
- Sakurai et al. (2020) Sakurai Y., Haiman Z., Inayoshi K., 2020, MNRAS, 499, 5960
- Salvador-Solé et al. (2017) Salvador-Solé E., Manrique A., Guzman R., Rodríguez Espinosa J. M., Gallego J., Herrero A., Mas-Hesse J. M., Marín Franch A., 2017, ApJ, 834, 49
- Salvador-Solé et al. (2022) Salvador-Solé E., Manrique A., Mas-Hesse J. M., Cabello C., Gallego J., Rodríguez-Espinosa J. M., Guzman R., 2022, arXiv e-prints, p. arXiv:2208.10426
- Salvadori et al. (2007) Salvadori S., Schneider R., Ferrara A., 2007, MNRAS, 381, 647
- Sanati et al. (2023) Sanati M., Jeanquartier F., Revaz Y., Jablonka P., 2023, A&A, 669, A94
- Santoliquido et al. (2023) Santoliquido F., Mapelli M., Iorio G., Costa G., Glover S. C. O., Hartwig T., Klessen R. S., Merli L., 2023, MNRAS, 524, 307
- Santoliquido et al. (2024) Santoliquido F., et al., 2024, arXiv e-prints, p. arXiv:2404.10048
- Sarmento & Scannapieco (2022) Sarmento R., Scannapieco E., 2022, ApJ, 935, 174
- Sarmento et al. (2018) Sarmento R., Scannapieco E., Cohen S., 2018, ApJ, 854, 75
- Sartorio et al. (2023) Sartorio N. S., et al., 2023, MNRAS,
- Sassano et al. (2023) Sassano F., Capelo P. R., Mayer L., Schneider R., Valiante R., 2023, MNRAS, 519, 1837
- Schaerer (2002) Schaerer D., 2002, A&A, 382, 28
- Schaerer et al. (2024) Schaerer D., Marques-Chaves R., Xiao M., Korber D., 2024, arXiv e-prints, p. arXiv:2406.08408
- Schauer et al. (2017) Schauer A. T. P., Regan J., Glover S. C. O., Klessen R. S., 2017, MNRAS, 471, 4878
- Schauer et al. (2019a) Schauer A. T. P., Glover S. C. O., Klessen R. S., Ceverino D., 2019a, MNRAS, 484, 3510
- Schauer et al. (2019b) Schauer A. T. P., Liu B., Bromm V., 2019b, ApJ, 877, L5
- Schauer et al. (2020) Schauer A. T. P., Drory N., Bromm V., 2020, ApJ, 904, 145
- Schauer et al. (2021) Schauer A. T. P., Glover S. C. O., Klessen R. S., Clark P., 2021, MNRAS, 507, 1775
- Schauer et al. (2022) Schauer A. T. P., Bromm V., Drory N., Boylan-Kolchin M., 2022, ApJ, 934, L6
- Schleicher et al. (2013) Schleicher D. R. G., Palla F., Ferrara A., Galli D., Latif M., 2013, A&A, 558, A59
- Schleicher et al. (2023) Schleicher D. R. G., Reinoso B., Klessen R. S., 2023, MNRAS, 521, 3972
- Senchyna et al. (2023) Senchyna P., Plat A., Stark D. P., Rudie G. C., 2023, arXiv e-prints, p. arXiv:2303.04179
- Sharda & Krumholz (2022) Sharda P., Krumholz M. R., 2022, MNRAS, 509, 1959
- Sharda & Menon (2024) Sharda P., Menon S. H., 2024, arXiv e-prints, p. arXiv:2405.18265
- Sharda et al. (2020) Sharda P., Federrath C., Krumholz M. R., 2020, MNRAS, 497, 336
- Sharda et al. (2021) Sharda P., Federrath C., Krumholz M. R., Schleicher D. R. G., 2021, MNRAS, 503, 2014
- Shen et al. (2020) Shen X., Hopkins P. F., Faucher-Giguère C.-A., Alexander D. M., Richards G. T., Ross N. P., Hickox R. C., 2020, MNRAS, 495, 3252
- Shen et al. (2023) Shen X., Vogelsberger M., Boylan-Kolchin M., Tacchella S., Kannan R., 2023, MNRAS, 525, 3254
- Shima & Hosokawa (2021) Shima K., Hosokawa T., 2021, MNRAS, 508, 4767
- Sibony et al. (2022) Sibony Y., Liu B., Simmonds C., Meynet G., Bromm V., 2022, A&A, 666, A199
- Skinner & Wise (2020) Skinner D., Wise J. H., 2020, MNRAS, 492, 4386
- Smith & Bromm (2019) Smith A., Bromm V., 2019, Contemporary Physics, 60, 111
- Smith et al. (2015) Smith B. D., Wise J. H., O’Shea B. W., Norman M. L., Khochfar S., 2015, MNRAS, 452, 2822
- Smith et al. (2024) Smith B. D., O’Shea B. W., Khochfar S., Turk M. J., Wise J. H., Norman M. L., 2024, arXiv e-prints, p. arXiv:2406.08199
- Spera & Mapelli (2017) Spera M., Mapelli M., 2017, MNRAS, 470, 4739
- Stacy & Bromm (2014) Stacy A., Bromm V., 2014, ApJ, 785, 73
- Stacy et al. (2011) Stacy A., Bromm V., Loeb A., 2011, MNRAS, 413, 543
- Stacy et al. (2012) Stacy A., Greif T. H., Bromm V., 2012, MNRAS, 422, 290
- Stacy et al. (2013) Stacy A., Greif T. H., Klessen R. S., Bromm V., Loeb A., 2013, MNRAS, 431, 1470
- Stacy et al. (2016) Stacy A., Bromm V., Lee A. T., 2016, MNRAS, 462, 1307
- Stacy et al. (2022) Stacy A., McKee C. F., Lee A. T., Klein R. I., Li P. S., 2022, MNRAS, 511, 5042
- Suazo et al. (2019) Suazo M., Prieto J., Escala A., Schleicher D. R. G., 2019, ApJ, 885, 127
- Sugimura et al. (2014) Sugimura K., Omukai K., Inoue A. K., 2014, MNRAS, 445, 544
- Sugimura et al. (2020) Sugimura K., Matsumoto T., Hosokawa T., Hirano S., Omukai K., 2020, ApJ, 892, L14
- Sugimura et al. (2023) Sugimura K., Matsumoto T., Hosokawa T., Hirano S., Omukai K., 2023, ApJ, 959, 17
- Sugimura et al. (2024) Sugimura K., Ricotti M., Park J., Garcia F. A. B., Yajima H., 2024, arXiv e-prints, p. arXiv:2403.04824
- Susa (2019) Susa H., 2019, ApJ, 877, 99
- Susa et al. (2014) Susa H., Hasegawa K., Tominaga N., 2014, ApJ, 792, 32
- Suto & Silk (1988) Suto Y., Silk J., 1988, ApJ, 326, 527
- Tan & McKee (2004) Tan J. C., McKee C. F., 2004, ApJ, 603, 383
- Tanaka & Li (2014) Tanaka T. L., Li M., 2014, MNRAS, 439, 1092
- Tanaka et al. (2013) Tanaka K. E. I., Nakamoto T., Omukai K., 2013, ApJ, 773, 155
- Tanikawa (2024) Tanikawa A., 2024, Reviews of Modern Plasma Physics, 8, 13
- Tanikawa et al. (2020) Tanikawa A., Yoshida T., Kinugawa T., Takahashi K., Umeda H., 2020, MNRAS, 495, 4170
- Tanikawa et al. (2021) Tanikawa A., Kinugawa T., Yoshida T., Hijikawa K., Umeda H., 2021, MNRAS, 505, 2170
- Tanikawa et al. (2022) Tanikawa A., Yoshida T., Kinugawa T., Trani A. A., Hosokawa T., Susa H., Omukai K., 2022, ApJ, 926, 83
- Tanvir & Krumholz (2024) Tanvir T. S., Krumholz M. R., 2024, MNRAS, 527, 7306
- Tinker et al. (2008) Tinker J., Kravtsov A. V., Klypin A., Abazajian K., Warren M., Yepes G., Gottlöber S., Holz D. E., 2008, ApJ, 688, 709
- Tominaga (2009) Tominaga N., 2009, ApJ, 690, 526
- Topping et al. (2024) Topping M. W., et al., 2024, MNRAS, 529, 3301
- Toyouchi et al. (2021) Toyouchi D., Inayoshi K., Hosokawa T., Kuiper R., 2021, ApJ, 907, 74
- Toyouchi et al. (2023) Toyouchi D., Inayoshi K., Li W., Haiman Z., Kuiper R., 2023, MNRAS, 518, 1601
- Trinca et al. (2022) Trinca A., Schneider R., Valiante R., Graziani L., Zappacosta L., Shankar F., 2022, MNRAS, 511, 616
- Trinca et al. (2024) Trinca A., Schneider R., Valiante R., Graziani L., Ferrotti A., Omukai K., Chon S., 2024, MNRAS, 529, 3563
- Trussler et al. (2023) Trussler J. A. A., et al., 2023, MNRAS, 525, 5328
- Tseliakhovich & Hirata (2010) Tseliakhovich D., Hirata C., 2010, Phys. Rev. D, 82, 083520
- Tseliakhovich et al. (2011) Tseliakhovich D., Barkana R., Hirata C. M., 2011, MNRAS, 418, 906
- Tsiatsiou et al. (2024) Tsiatsiou S., et al., 2024, arXiv e-prints, p. arXiv:2404.16512
- Tsukamoto et al. (2015) Tsukamoto Y., Takahashi S. Z., Machida M. N., Inutsuka S., 2015, MNRAS, 446, 1175
- Übler et al. (2023) Übler H., et al., 2023, A&A, 677, A145
- Umeda & Nomoto (2003) Umeda H., Nomoto K., 2003, Nature, 422, 871
- Umeda & Nomoto (2005) Umeda H., Nomoto K., 2005, ApJ, 619, 427
- Vanzella et al. (2023) Vanzella E., et al., 2023, A&A, 678, A173
- Venditti et al. (2023) Venditti A., Graziani L., Schneider R., Pentericci L., Di Cesare C., Maio U., Omukai K., 2023, MNRAS, 522, 3809
- Venditti et al. (2024a) Venditti A., Bromm V., Finkelstein S. L., Calabrò A., Napolitano L., Graziani L., Schneider R., 2024a, arXiv e-prints, p. arXiv:2405.10940
- Venditti et al. (2024b) Venditti A., Bromm V., Finkelstein S. L., Graziani L., Schneider R., 2024b, MNRAS, 527, 5102
- Ventura et al. (2024) Ventura E. M., Qin Y., Balu S., Wyithe J. S. B., 2024, MNRAS, 529, 628
- Vikaeus et al. (2022) Vikaeus A., Zackrisson E., Schaerer D., Visbal E., Fransson E., Malhotra S., Rhoads J., Sahlén M., 2022, MNRAS, 512, 3030
- Visbal et al. (2020) Visbal E., Bryan G. L., Haiman Z., 2020, ApJ, 897, 95
- Volonteri et al. (2021) Volonteri M., Habouzit M., Colpi M., 2021, Nature Reviews Physics, 3, 732
- Volpato et al. (2023) Volpato G., Marigo P., Costa G., Bressan A., Trabucchi M., Girardi L., 2023, ApJ, 944, 40
- Wang et al. (2022a) Wang X., et al., 2022a, arXiv e-prints, p. arXiv:2212.04476
- Wang et al. (2022b) Wang L., Tanikawa A., Fujii M., 2022b, MNRAS, 515, 5106
- Welch et al. (2022) Welch B., et al., 2022, Nature, 603, 815
- Wiggins et al. (2024) Wiggins A. I., Bovill M. S., Strolger L.-G., Stiavelli M., Bowling C., 2024, arXiv e-prints, p. arXiv:2402.17076
- Willott et al. (2010) Willott C. J., et al., 2010, AJ, 139, 906
- Windhorst et al. (2018) Windhorst R. A., et al., 2018, ApJS, 234, 41
- Wise (2023) Wise J. H., 2023, arXiv e-prints, p. arXiv:2304.09311
- Wollenberg et al. (2020) Wollenberg K. M. J., Glover S. C. O., Clark P. C., Klessen R. S., 2020, MNRAS, 494, 1871
- Woods et al. (2017) Woods T. E., Heger A., Whalen D. J., Haemmerlé L., Klessen R. S., 2017, ApJ, 842, L6
- Woods et al. (2021) Woods T. E., Patrick S., Elford J. S., Whalen D. J., Heger A., 2021, ApJ, 915, 110
- Woods et al. (2024) Woods T. E., Patrick S., Whalen D. J., Heger A., 2024, ApJ, 960, 59
- Woosley (2017) Woosley S. E., 2017, ApJ, 836, 244
- Wyithe & Padmanabhan (2006) Wyithe J. S. B., Padmanabhan T., 2006, MNRAS, 366, 1029
- Xu et al. (2016) Xu H., Norman M. L., O’Shea B. W., Wise J. H., 2016, ApJ, 823, 140
- Yahil (1983) Yahil A., 1983, ApJ, 265, 1047
- Yajima & Khochfar (2017) Yajima H., Khochfar S., 2017, MNRAS, 467, L51
- Yajima et al. (2022) Yajima H., et al., 2022, MNRAS, 509, 4037
- Yajima et al. (2023) Yajima H., Abe M., Fukushima H., Ono Y., Harikane Y., Ouchi M., Hashimoto T., Khochfar S., 2023, MNRAS, 525, 4832
- Yan et al. (2023) Yan Z., Jerabkova T., Kroupa P., 2023, A&A, 670, A151
- Yang et al. (2021) Yang J., et al., 2021, ApJ, 923, 262
- Yoon et al. (2012) Yoon S. C., Dierks A., Langer N., 2012, A&A, 542, A113
- Yoshida et al. (2003) Yoshida N., Abel T., Hernquist L., Sugiyama N., 2003, ApJ, 592, 645
- Yoshida et al. (2016) Yoshida T., Umeda H., Maeda K., Ishii T., 2016, MNRAS, 457, 351
- Zackrisson et al. (2011) Zackrisson E., Rydberg C.-E., Schaerer D., Östlin G., Tuli M., 2011, ApJ, 740, 13
- Zackrisson et al. (2012) Zackrisson E., et al., 2012, MNRAS, 427, 2212
- Zackrisson et al. (2023) Zackrisson E., et al., 2023, arXiv e-prints, p. arXiv:2312.09289
Appendix A Detailed results in a larger parameter space
In Sec. 2.3, we demonstrate the dependence of our results on mutiplicity parameters with select examples in the fiducial case where is independent of in the concentrated feedback scenario (Eq. 16) given , , and . In this Appendix, we first provide more detailed results in the fiducial case as maps of in Figs. 10-12 covering the curves shown in Figs. 4-6. Then we vary the feedback and fragmentation prescriptions (Appendix A.1) and the parameters governing the mass-size scaling relation and feedback strength (Appendix A.2) to evaluate their impact on our results.
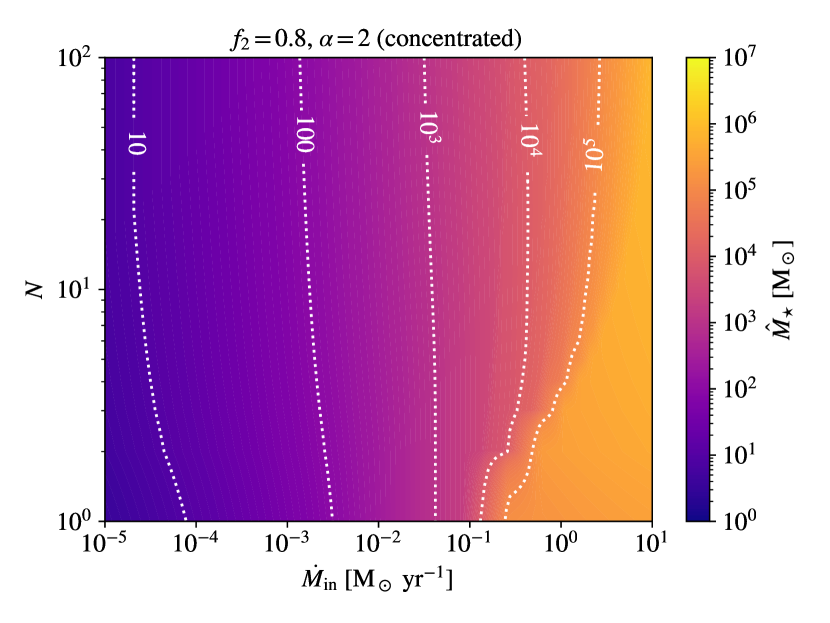
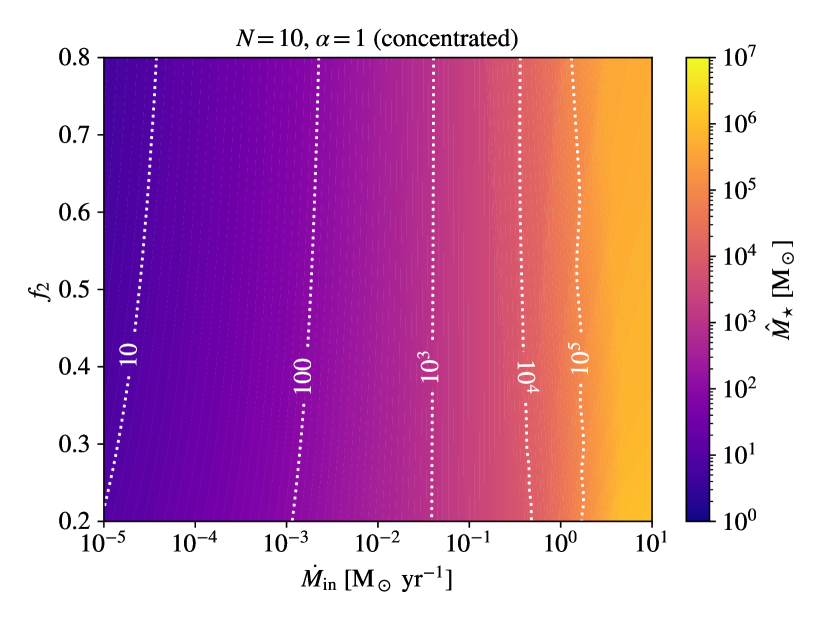
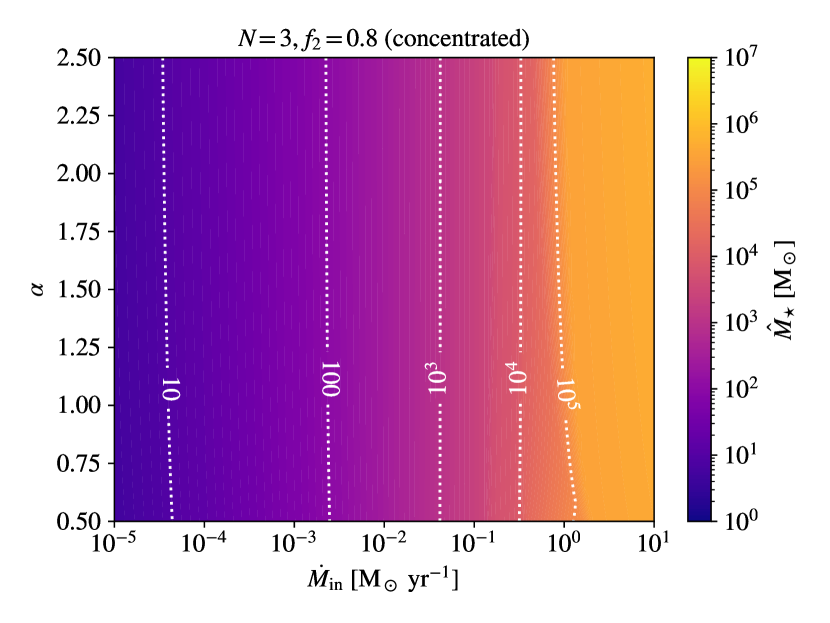
A.1 Feedback and fragmentation prescriptions
In this section, we relax the assumptions of concentrated feedback (Eq. 16) and constant . As an extreme opposite to concentrated feedback, we consider the scenario where the distances between protostars are comparable to the disk size caused by outward migrations from accretion of angular momentum, as seen in recent radiative hydrodynamic simulations (e.g., Sugimura et al., 2020, 2023; Park et al., 2023, 2024), so the ionizing flux from a protostar mostly affects its own circumstellar disk, and the total mass loss rate of photo-evaporation is the summation of the mass loss rates from the sub-disks around individual protostars:
| (19) |
Here, we assume that the sub-disks of individual protostars are always connected to each other (by spiral arms) so that the termination of protostar growth happens spontaneously when exceeds . The maximum sub-disk radius of each protostar is chosen to ensure that the total disk area does not exceed :
| (20) |
assuming that the size-mass scaling relation (Eq. 4) holds for each protostar141414Alternatively, if all protostars have the same disk size, we simply use .. The photo-evaporation rate is smaller in this scenario of distributed feedback due to the super-linear scaling relation between mass and size (Eq. 8).
Besides, it is shown by Susa (2019) and Liu et al. (2021a) that the (median) number of surviving protostars increases with time following a power-law scaling at least in the early stage151515The number of fragments also increases with resolution without convergence up to densities of (Prole et al., 2022a). in most simulations of Pop III star-forming clouds. It is unclear whether this trend can hold till the end of star formation. In our default setup (Sec. 2.3), we assume that the number of surviving protostars has saturated at an input value (e.g., Shima & Hosokawa, 2021; Chon et al., 2021) independent of before the accretion of protostars is turned down by feedback (i.e., in the formalism of Liu et al., 2021a). Now, as an alternative model, we assume that keeps growing in time and introduce the dependence of on as
| (21) |
using Eq. 7, where is the new parameter defined as the number of protostars at . We keep and fixed to the input value, and let evolve with through the dependence on , as fragmentation is expected to be important mainly for the smallest objects in the system.
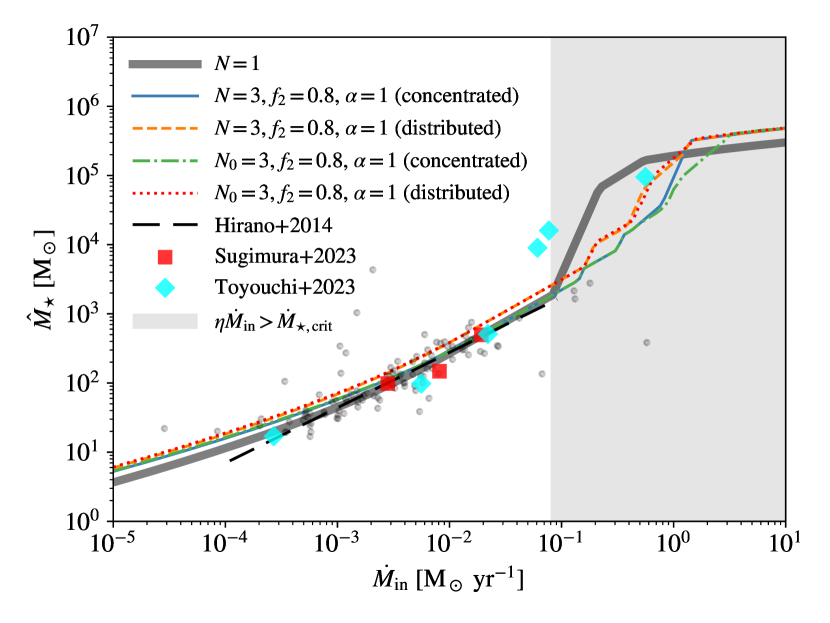
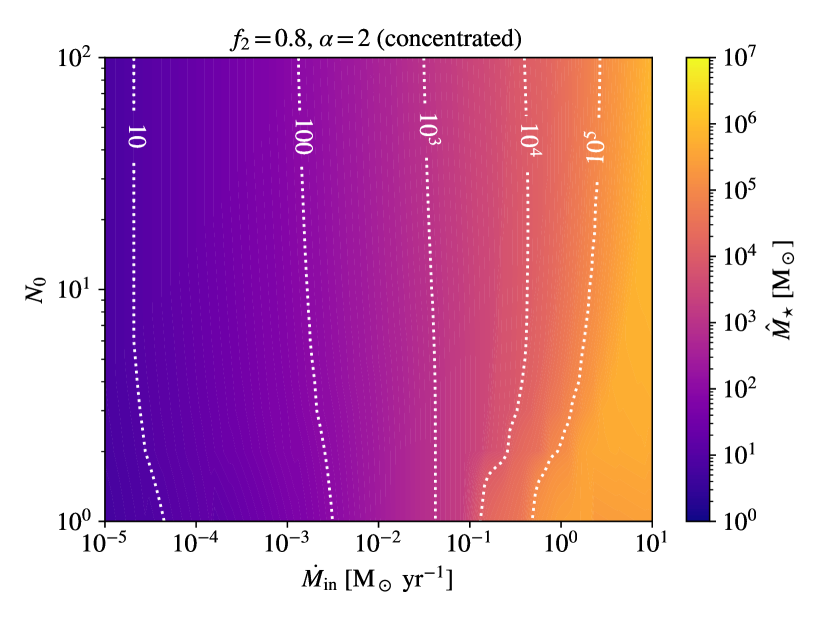
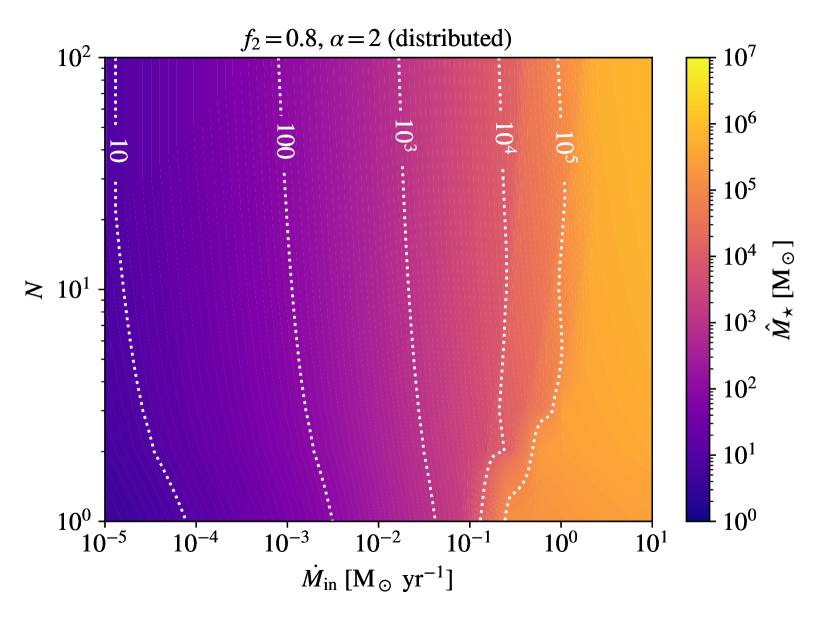
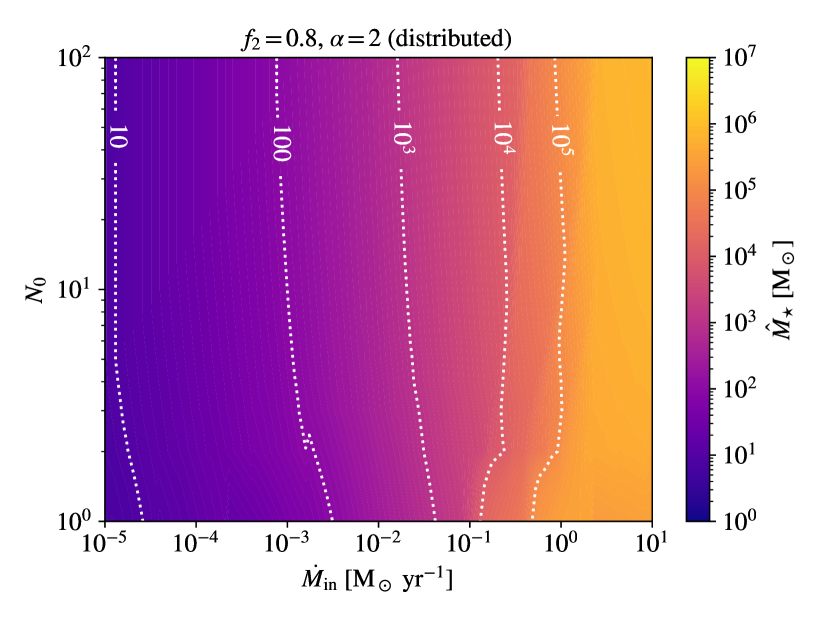
Fig. 13 shows the effects of the treatments for and for the exemplar multiplicity model with , , and . As expected, increases when we consider distributed feedback, in particular for the intermediate regime, where the circumstellar disks of the most massive stars that undergo bloating are intact from photo-evaporation. On the other hand, allowing to increase with reduces in the intermediate regime under concentrated feedback. However, the effect is minor for distributed feedback, because when the disk sizes approach their upper limits (), enhanced fragmentation increases the ionizing flux from small protostars that do not enter the bloating phase but meanwhile reduce the disk sizes, and the two effects cancel out each other in the disk evaporation rate.
A.2 Mass-size scaling relation and feedback parameters
Next, we explore the effects of the mass-size scaling relation and feedback parameters on our results by varying the polytropic index of the effective EoS, the assumption on the disk photonevaporation scale , and for the single-star case () and the exemplar multiplicity model with (constant), , , and concentrated feedback, as shown in Fig. 17. Here we consider three new models with , , and , varying one aspect each time with respect to the fiducial model (, , and ). The model is meant to capture Pop III star formation under extremely strong LW radiation (with an intensity in units of , Sugimura et al., 2014) or the cosmic microwave background at very high redshifts (, Ito & Omukai, 2024), where formation is significantly suppressed and the gas remains quasi-isothermal during collapse by atomic cooling (see fig. 4 in Li et al., 2021).
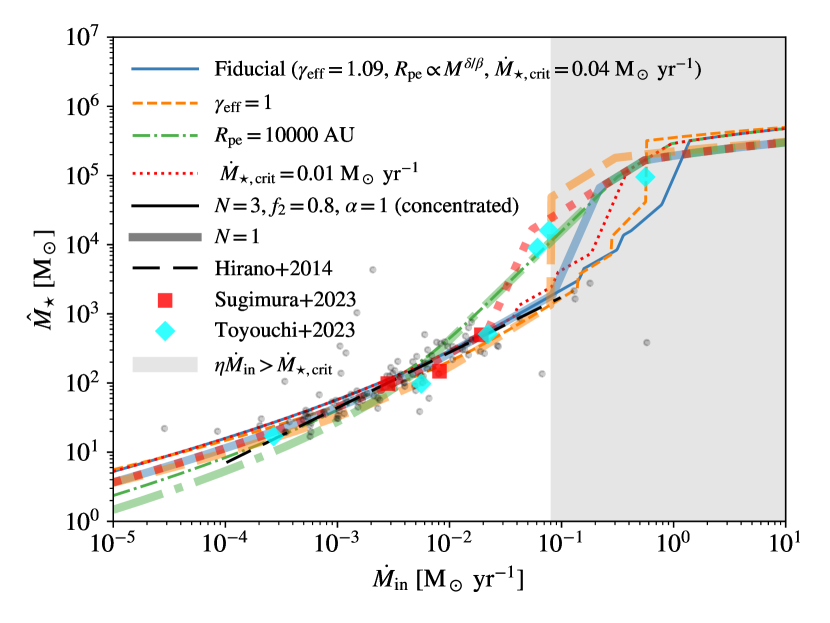
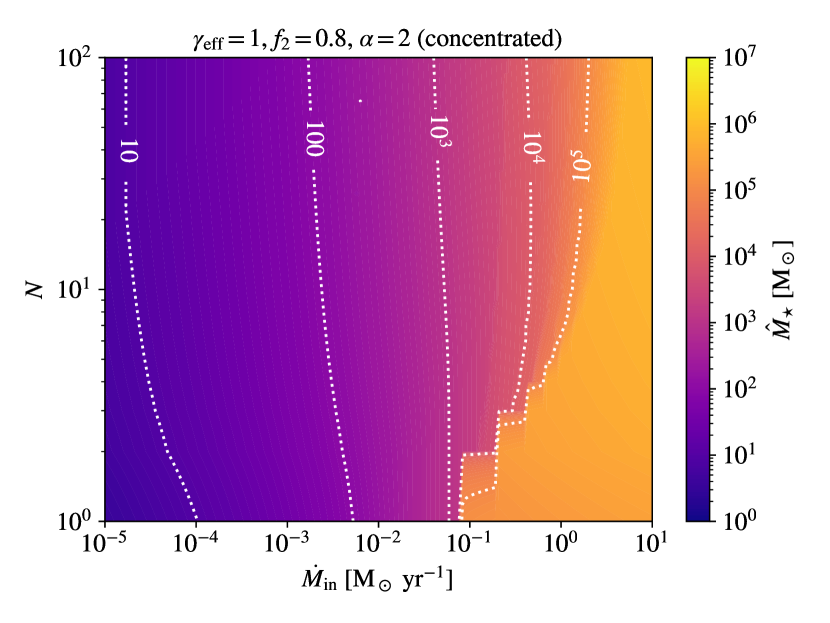
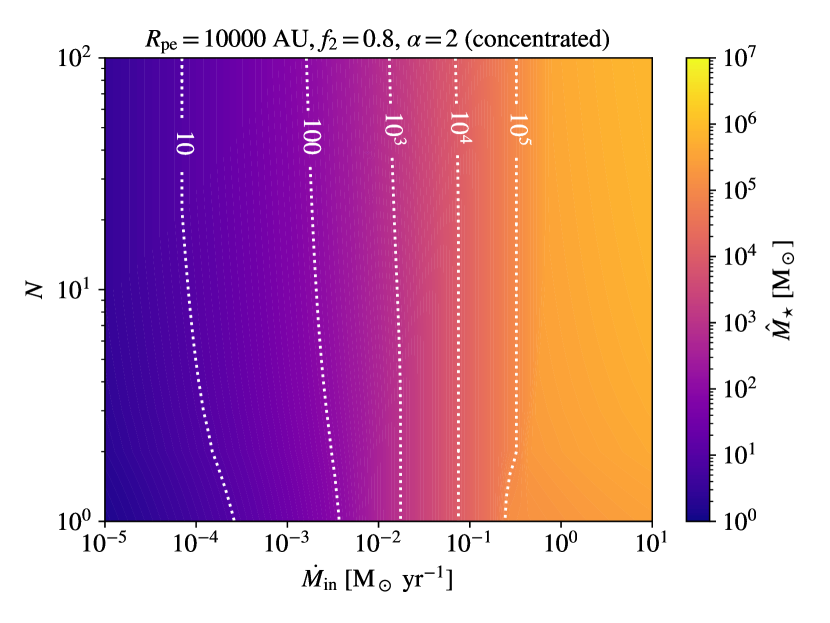
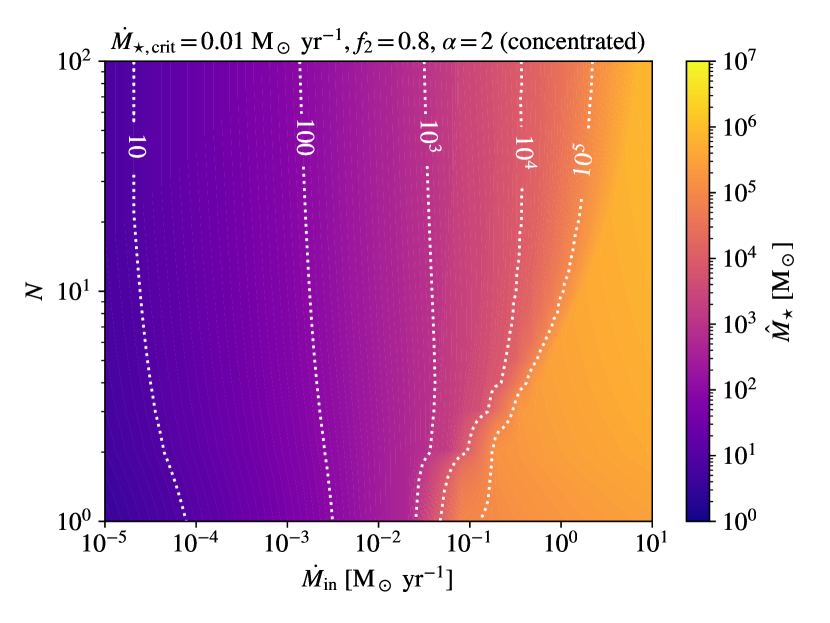
If the star-forming gas is isothermal with , the accretion rate does not evolve with time and , so in the single-star case, there is a sharp transition from the feedback-regulated regime to the lifetime/GRI-regulated regime (where the bloating phase lasts until the the star collapses) at . Therefore, is higher for when the bloating phase is involved. However, becomes slightly smaller in the feedback-regulated regime because the disk size is smaller when increases (Eq. 8) even though the accretion rate become higher (see Eq. 5). The trends are similar when multiple protostars are considered. Now there is a jump in the - curve each time the accretion rate of a protostar crosses such that it is in the bloating phase right before the end of star formation, which also occurs at a smaller compared with the case.
In the single-star case and the exemplar multiplicity model, using instead of increases (reduces) for , while reducing facilitates the transition to the bloating or lifetime/GRI-regulated regime. With , the effects of multiplicity on vanish for in the feedback-regulated regime. These clouds are dominated by massive () stars that follow the linear relation between and stellar mass, so the total production rate of ionizing photons and disk evaporation rate at a given total stellar mass hardly vary with at least for . Interestingly, the models with and have similar results for in the single-star case, consistent with the simulation results in Toyouchi et al. (2023), where SMS formation starts at slightly lower compared with the fiducial model. This degeneracy is broken in the exemplar multiplicity model.
Appendix B Alternative parametrization of multiplicity
In Sec. 2.3, we build a phenomenological multiplicity model with four variables , , , and , which are correlated with each other via Eq. 15, so only three of them can be chosen as free model parameters. Here, and have clear physical meanings as the slope of mass distribution and target number of stars and therefore, they should be adopted as model parameters. and are related to the least and most massive star in the cluster, respectively. As we are mainly concerned with the formation of SMSs as the most massive objects in the clusters, we use as the last free parameter by default.
Motivated by possible constraints on the minimum mass of metal-free stars by stellar archaeology (e.g., Salvadori et al., 2007; Frebel & Norris, 2015; Hartwig et al., 2015; Komiya et al., 2016; Ishiyama et al., 2016; Magg et al., 2018; Magg et al., 2019; Dutta et al., 2020; Rossi et al., 2021), here, we consider an alternative parametrization of multiplicity by adopting as the third free parameter (in replacement of ) with given the total mass . Once is known according to , is derived using Eq. 15. Since the solution of may not exist for the input (target) value of , we constrain with an upper limit and a lower limit corresponding to . Below, we briefly explore the effects of multiplicity with the new parametrization under the default setup (constant , concentrated feedback, , , , and ).
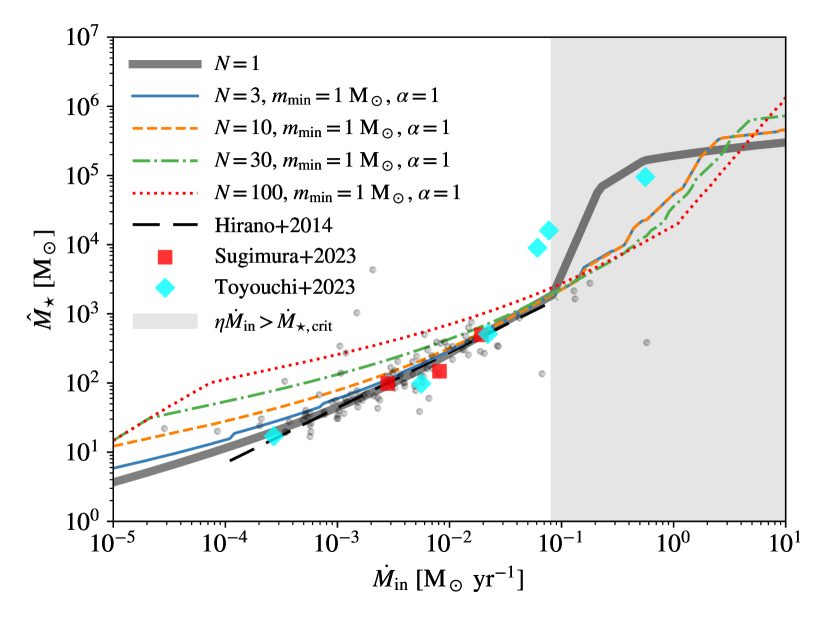
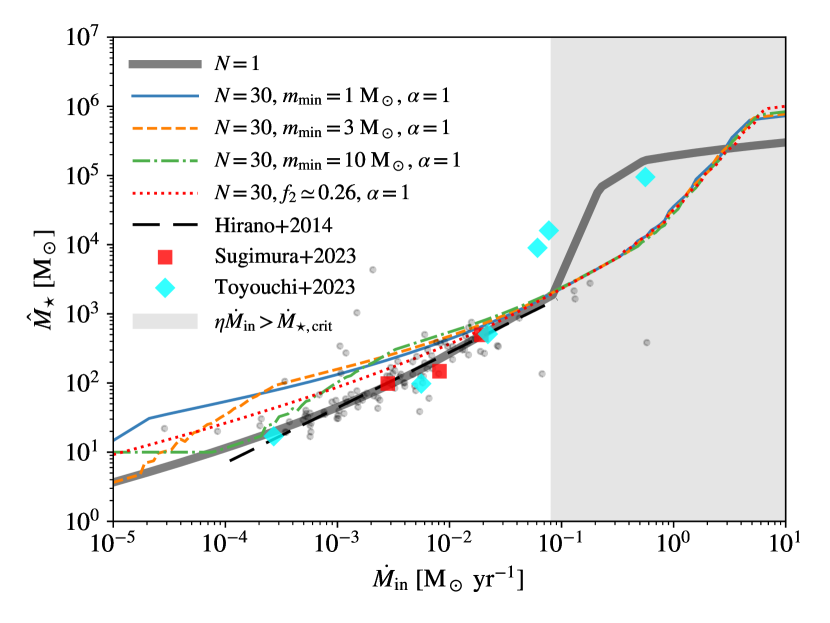
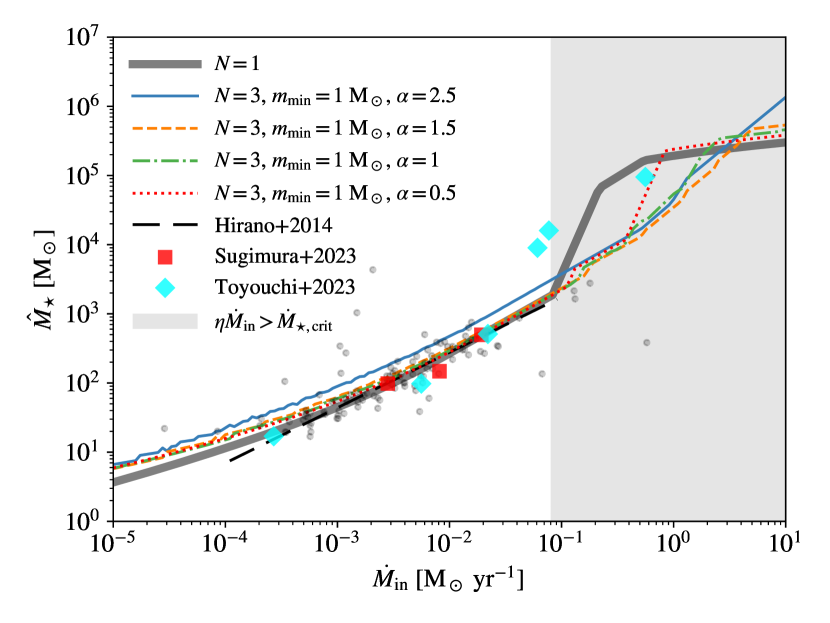
Fig. 21 shows the evolution of with for , 10, 30, and 100 given and . We adopt as the fiducial choice based on observations (Salvadori et al., 2007; Hartwig et al., 2015; Magg et al., 2019; Rossi et al., 2021). The trends are similar to the case where is fixed (Fig. 4), as becomes higher in the feedback-regulated regime () when increases, showing a slower transition to the lifetime/GRI-regulated regime. However, the effects of varying are stronger with the new parametrization for because rapidly decreases with given a fixed , which reduces the ionization flux at and the mass fraction of stars in the bloating phase at . The final mass is even regulated by the gas supply for at the low end. Interestingly, the results for and 10 are identical at because in this regime ().
The dependence on is illustrated in in Fig. 22 for , 3, and 10 given and . Here the evolution of with has two stages. When is low, is below the input target value of and increases with , which explains the rapid increase of with . For , is achieved at where . Once excesses the target value of with higher , the increase of first slows down (within the no-bloating feedback-regulated regime) before accelerating again when the bloating effect kicks in. In this stage, the dependence on is minor since is close to 0 for all the cases considered here, whose results are well reproduced by the model with a fixed from the default parametrization, given .
Finally, we consider the dependence on , as shown in Fig. 23 with and for . At , is higher when the mass distribution is more bottom-heavy, showing a consistent but stronger trend compared with the default case with fixed (Fig. 6), which reflects the weaker ionizing power of smaller stars. The trend will be even stronger if is larger. However, for , increasing with a fixed has a similar effect as increasing while fixing (and , see Fig. 4) for . The reason is that the input value is no longer effective here as and increases with . In the extreme case of strongly dominated by low-mass stars, the final mass is always regulated by photo-evaporation feedback for , which is weaker when is larger, so is higher than that for , holding the trend at .