Guitar Chord Diagram Suggestion for Western Popular Music
Abstract
Chord diagrams are used by guitar players to show where and how to play a chord on the fretboard. They are useful to beginners learning chords or for sharing the hand positions required to play a song. However, the diagrams presented on guitar learning tools are usually selected from an existing database of common positions and rarely represent the actual positions used by performers. In this paper, we propose a tool which suggests a chord diagram given a chord label, taking into account the diagram of the previous chord. Based on statistical analysis of the DadaGP and mySongBook datasets, we show that some guitar chord diagrams are over-represented in Western popular music and that some chords can be played in up to 108 different ways. We argue that taking the previous position into account as context can improve the variety and the quality of chord diagram suggestion, and compare this approach with a model taking only the current chord label into account. We show that adding previous context improves the F1-score on this task by up to 32% and reduces the propensity of the model to suggest standard open chords. We also define the notion of texture in the context of chord diagrams and show through a variety of metrics that our model improves texture consistency with the previous diagram.
1 Introduction
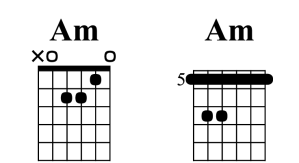
On the guitar, a chord can be played in multiple ways, each position having its own pitch, timbral and biomechanical specificities. Chord diagrams can be used to represent the position at which a chord is played. They can be notated with a graphical representation as shown in Figure 1, or in text form (compatible with ASCII tablatures) with a number indicating which fret is played on each string. For instance, the chord diagrams from Figure 1 can be annotated, respectively, as x.0.2.2.1.0, and 5.7.7.5.5.5. The former contains both an open (0) and a muted (x) string and is the most common shape, used by beginners for its simplicity and in pop music for the resonance of open strings. The latter is a barré chord and is harder to play, but can be shifted along the fretboard to play other minor chords without changing hand shapes.
We propose the task of chord diagram suggestion to assist composition. Chord diagram suggestion research has so far been focusing on playability [1, 2, 3] with limited ability to take into account the relationship between consecutive chords. We can see similar problems in the suggestions of the most popular guitar learning services, which only provide catalogs of standard chord diagrams. While such an approach provides agency to the user, it might also drive beginners towards using the same diagrams over and over again. In this paper, we propose a model that suggests a chord diagram, given a chord label and the previous notated diagram. The contributions of this work are as follows: (i) a context-aware approach for guitar chord diagram suggestion; (ii) a set of metrics to assess performance in this task and characterize texture for guitar chord diagrams; (iii) an illustrative application of this task for rhythm guitar tablature continuation; (iv) openly released code and data for all of the above. The rest of this paper is organized as follows: In section 2, we present related work on symbolic music for guitar in Western popular music repertoire. We then present our proposed approach and models in section 3. In section 4, we discuss in details the datasets and the data augmentation procedure we used. After discussing evaluation metrics, we finally share our results in section 5, before showing how it could be used for rhythm guitar continuation in section 6.
2 Related Works
A large part of research on guitar focuses on tablatures as a notation system, especially when studying Western popular music. From the audio realm, tablatures are often the output medium for guitar transcription [4, 5, 6], but they can even be used as a source of additional data to improve automatic transcription [7, 8]. In a field related to audio transcription, chord recognition from audio is an important task in Music Information Retrieval [9], as attested by its recurring occurrence in MIREX111https://www.music-ir.org/mirex/wiki/2021:Audio_Chord_Estimationand ongoing research in the neighboring field of multipitch estimation [10]. Chord recognition from audio was also specifically studied in the case of guitar, exploiting knowledge of the instrument to improve algorithms dedicated to it [11, 5, 4]. Once or when available, tablatures can also be both the input and the output, like for symbolic music generation (symbolic referring here to the use of a notation format, like sheet music or tablatures). This topic was already studied using Markov chains [12] and benefited from the advance of deep neural networks [13]. The release of the dataset DadaGP in 2021 [14] also had a significant impact in the field, fostering all kinds of research on guitar tablature generation [15, 16, 17, 18, 19]. To assist composition, research has also been conducted on how to jazzify chords [20] or generate style-conditioned chord sequences [21]. Tablatures and guitar chord research is also intertwined with the field of guitar fingering research, as deriving tablatures from audio – or scores – requires choosing string/fret combinations to play the notes, which will ultimately be influenced by the fingers used to press the strings and the accompanying biomechanical constraints. This problem has been tackled by a graph-search approach [22] or HMM-like models [23, 24, 25] and can then be used for tasks like automatic arrangement [26]. When it comes to guitar chord diagrams however, they are mostly studied with playability considerations in mind [1, 2, 3] or in a musicological analysis of their use [27]. In this paper, we consider chord diagram suggestion as an assisted composition task, to help beginner guitar players choose how to play a new chord in a preexisting sequence, or assist composers in creating guitar accompaniment parts.
3 Methodology
3.1 Proposed Model
In this work, we suggest a diagram for a chord, based on its label and the previous diagram (Figure 2).
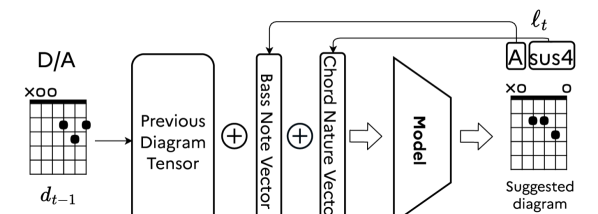
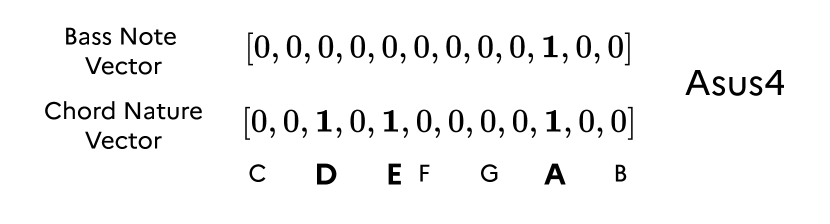
The task consists in finding the diagram which probability is highest in the provided context. To do so, we convert the chord labels and diagrams into vectors and train a neural network on chord pairs. For each chord label, we first extract its bass note, which might be different from its root note in case of inverted chords. This bass note information is then converted into a one-hot vector of size 12 where enharmonic equivalents of the twelve-tone equal temperament are merged together (the Bass Note Vector). Then, the pitch-class content of the chord is converted into a many-hot vector of size 12 (the Chord Nature Vector).
The diagrams are converted into many-hot arrays of size , each row accounting for a string (6 on a standard guitar) and its 25 frets (counting the open string as a zeroth fret). An additional per-string coefficient is added to account for muted strings. This ensures that all vectors always have a non-zero value for a string, which ultimately permits normalizing predictions and using them as probabilities. In summary, input data contains 180 values for – the previous diagram – and – the new chord label, from which the bass note and chord nature vectors are computed. As a result, the model outputs 156 probabilities, 26 per string, for .
To evaluate to which extent adding the context information improves chord diagram suggestion, we define the baseline as the same model, but removing information about the previous diagram. In that case, the baseline model takes only 24 values as input, but still returns 156.
3.2 Implementation Details
We use a fully connected neural network as an architecture. Hyperparameters were tuned – through manual exploration – to maximize performance of both the baseline and the proposed model, ending up with no hidden layer for the baseline and one hidden layer of size 150 for the full model. Performance is evaluated with a Binary Cross-Entropy loss on the output, the model using a Sigmoid activation function, and string-wise normalization of the predictions (to enforce a single prediction per string). Training uses the Adam optimizer with , and a learning rate . The training is stopped whenever the validation loss does not improve by at least for two consecutive epochs. Full training of the model can be done in a few minutes on a standard laptop CPU. The Python implementation is openly available, along with a demonstration website, at algomus.fr/code.
4 Data
4.1 Corpora
This study is conducted on two corpora of guitar tablatures containing chord diagram information. The first one is DadaGP [14], a community-based corpus of more than 25000 songs spanning a wide variety of styles, though mostly focusing on rock and metal. The second one is the proprietary dataset mySongBook222mysongbook.com(MSB), which consists of about 2500 songs professionally transcribed.
The .gp file format of these datasets allows including chord diagrams with the tablature data. We only use tracks which contain chord diagram data, reducing the datasets to 2766 and 520 tracks for DadaGP and MSB respectively. From these tracks, we extract chord pairs that occur within a 2 bars interval and finally keep one occurrence of each unique transition per track. By doing so, we acknowledge the fact that a chord transition can be more common in a given repertoire and occur in many songs, but we remove duplicate transitions that are inherent to the repetitive nature of Western popular music. This processing step leaves us with 31321 and 7365 transitions for DadaGP and MSB, respectively.
4.2 Statistical Analyses
In this subsection, we provide detailed statistics of the chords used in the datasets. This analysis aims at emphasizing the bias towards more common diagrams and key signatures, due to guitar affordance. Furthermore, because of the considered repertoire, and the large amount of pop/rock/metal tracks, some chord natures are more common than others. However, we also want to underline that this bias is not at the expense of variety, but results in highly unbalanced datasets.
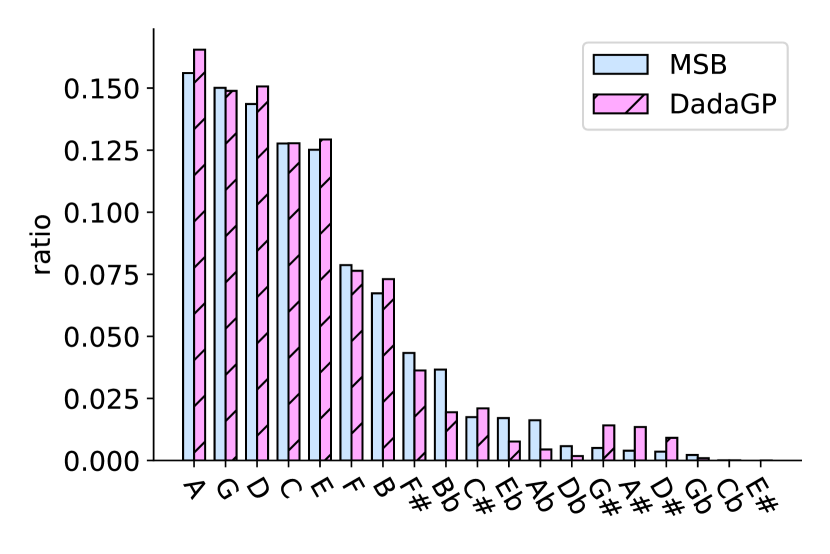
A first dimension to analyze on chords is on what root note they are built. Observation shows that the distributions of root notes are similar between datasets (Figure 4), with more than half the chords having A, G, D, C or E as root.
In both datasets, major chords (M) are the most common (Figure 5), followed by minor chords (m) and power chords (5). The tail of the distribution then includes more complex chords, like seventh, suspended or added-tone chords. The distribution of chord natures is in fact highly unbalanced towards the three first classes, making the suggestion of diagrams for less common chords a bigger challenge. Besides, this plot shows that notation between files can vary, MSB containing lots of 7M and maj7 labels that are both representing major seventh chords.
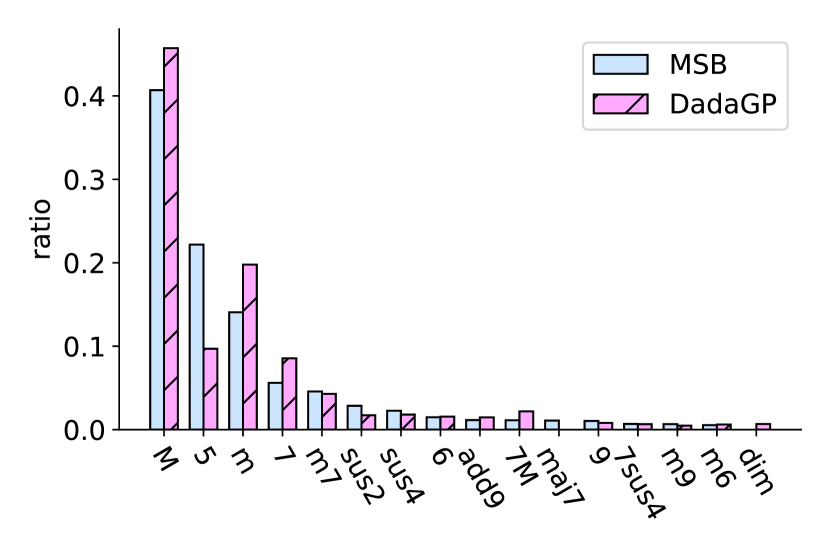
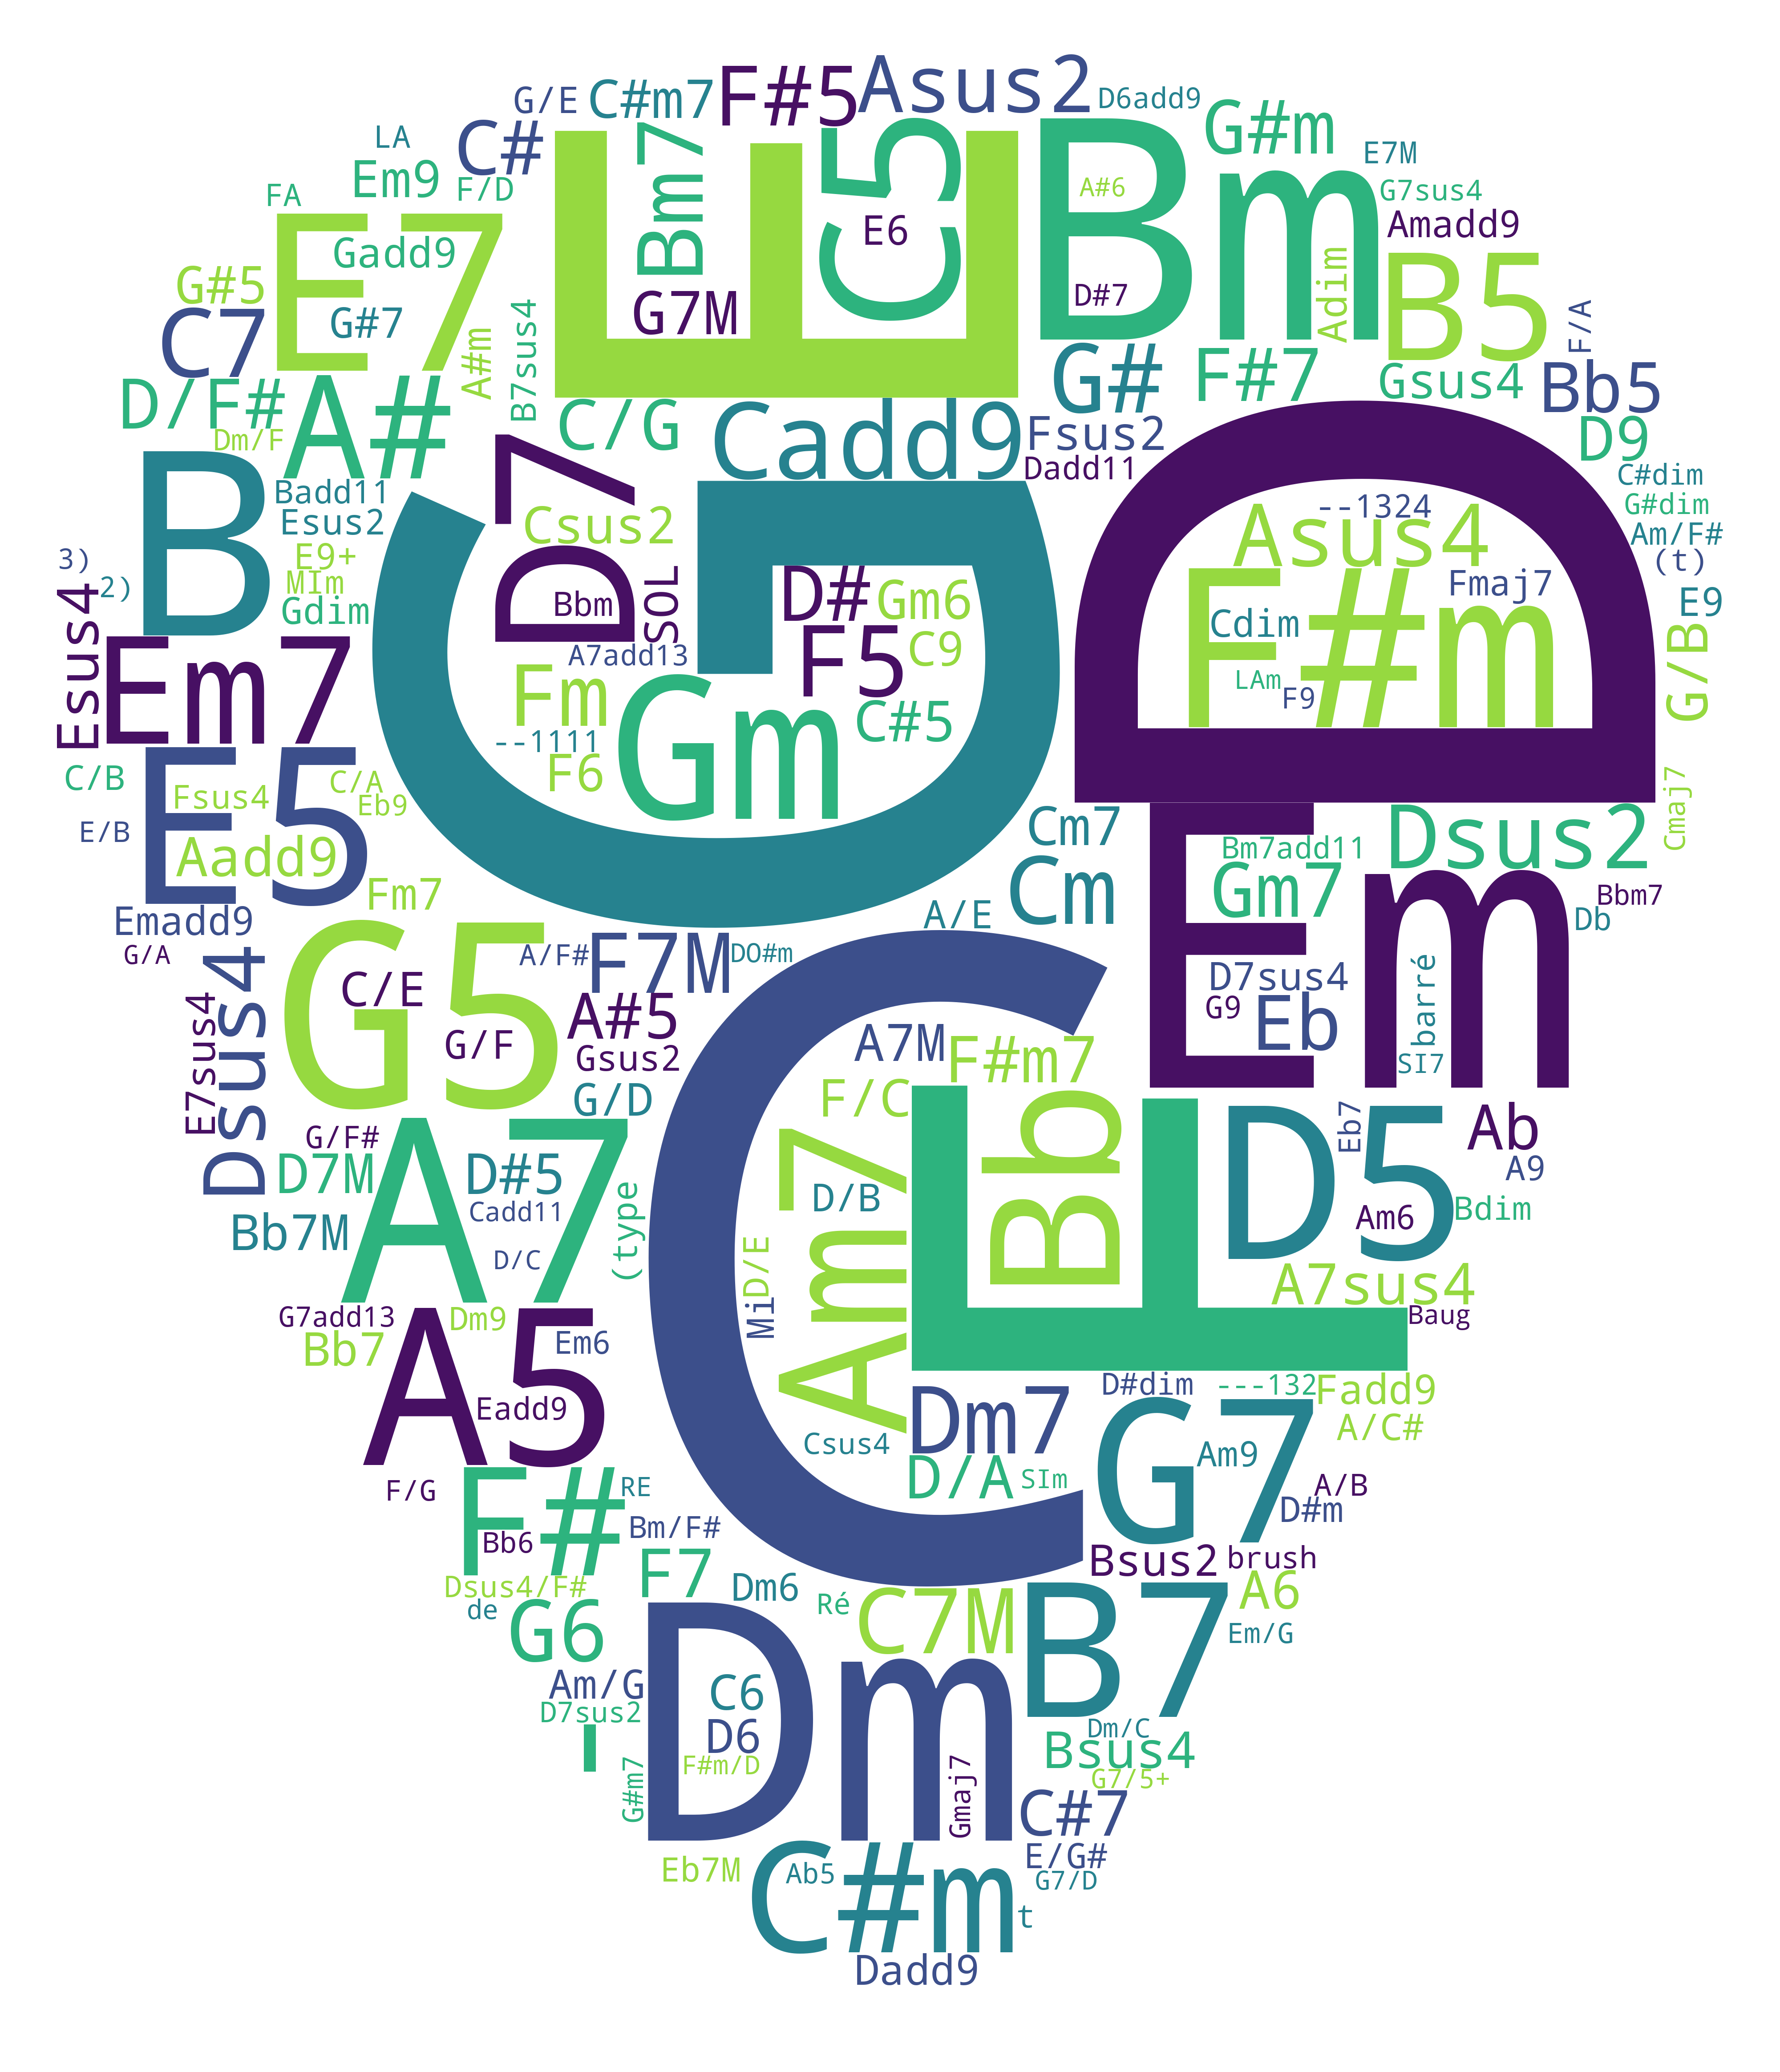
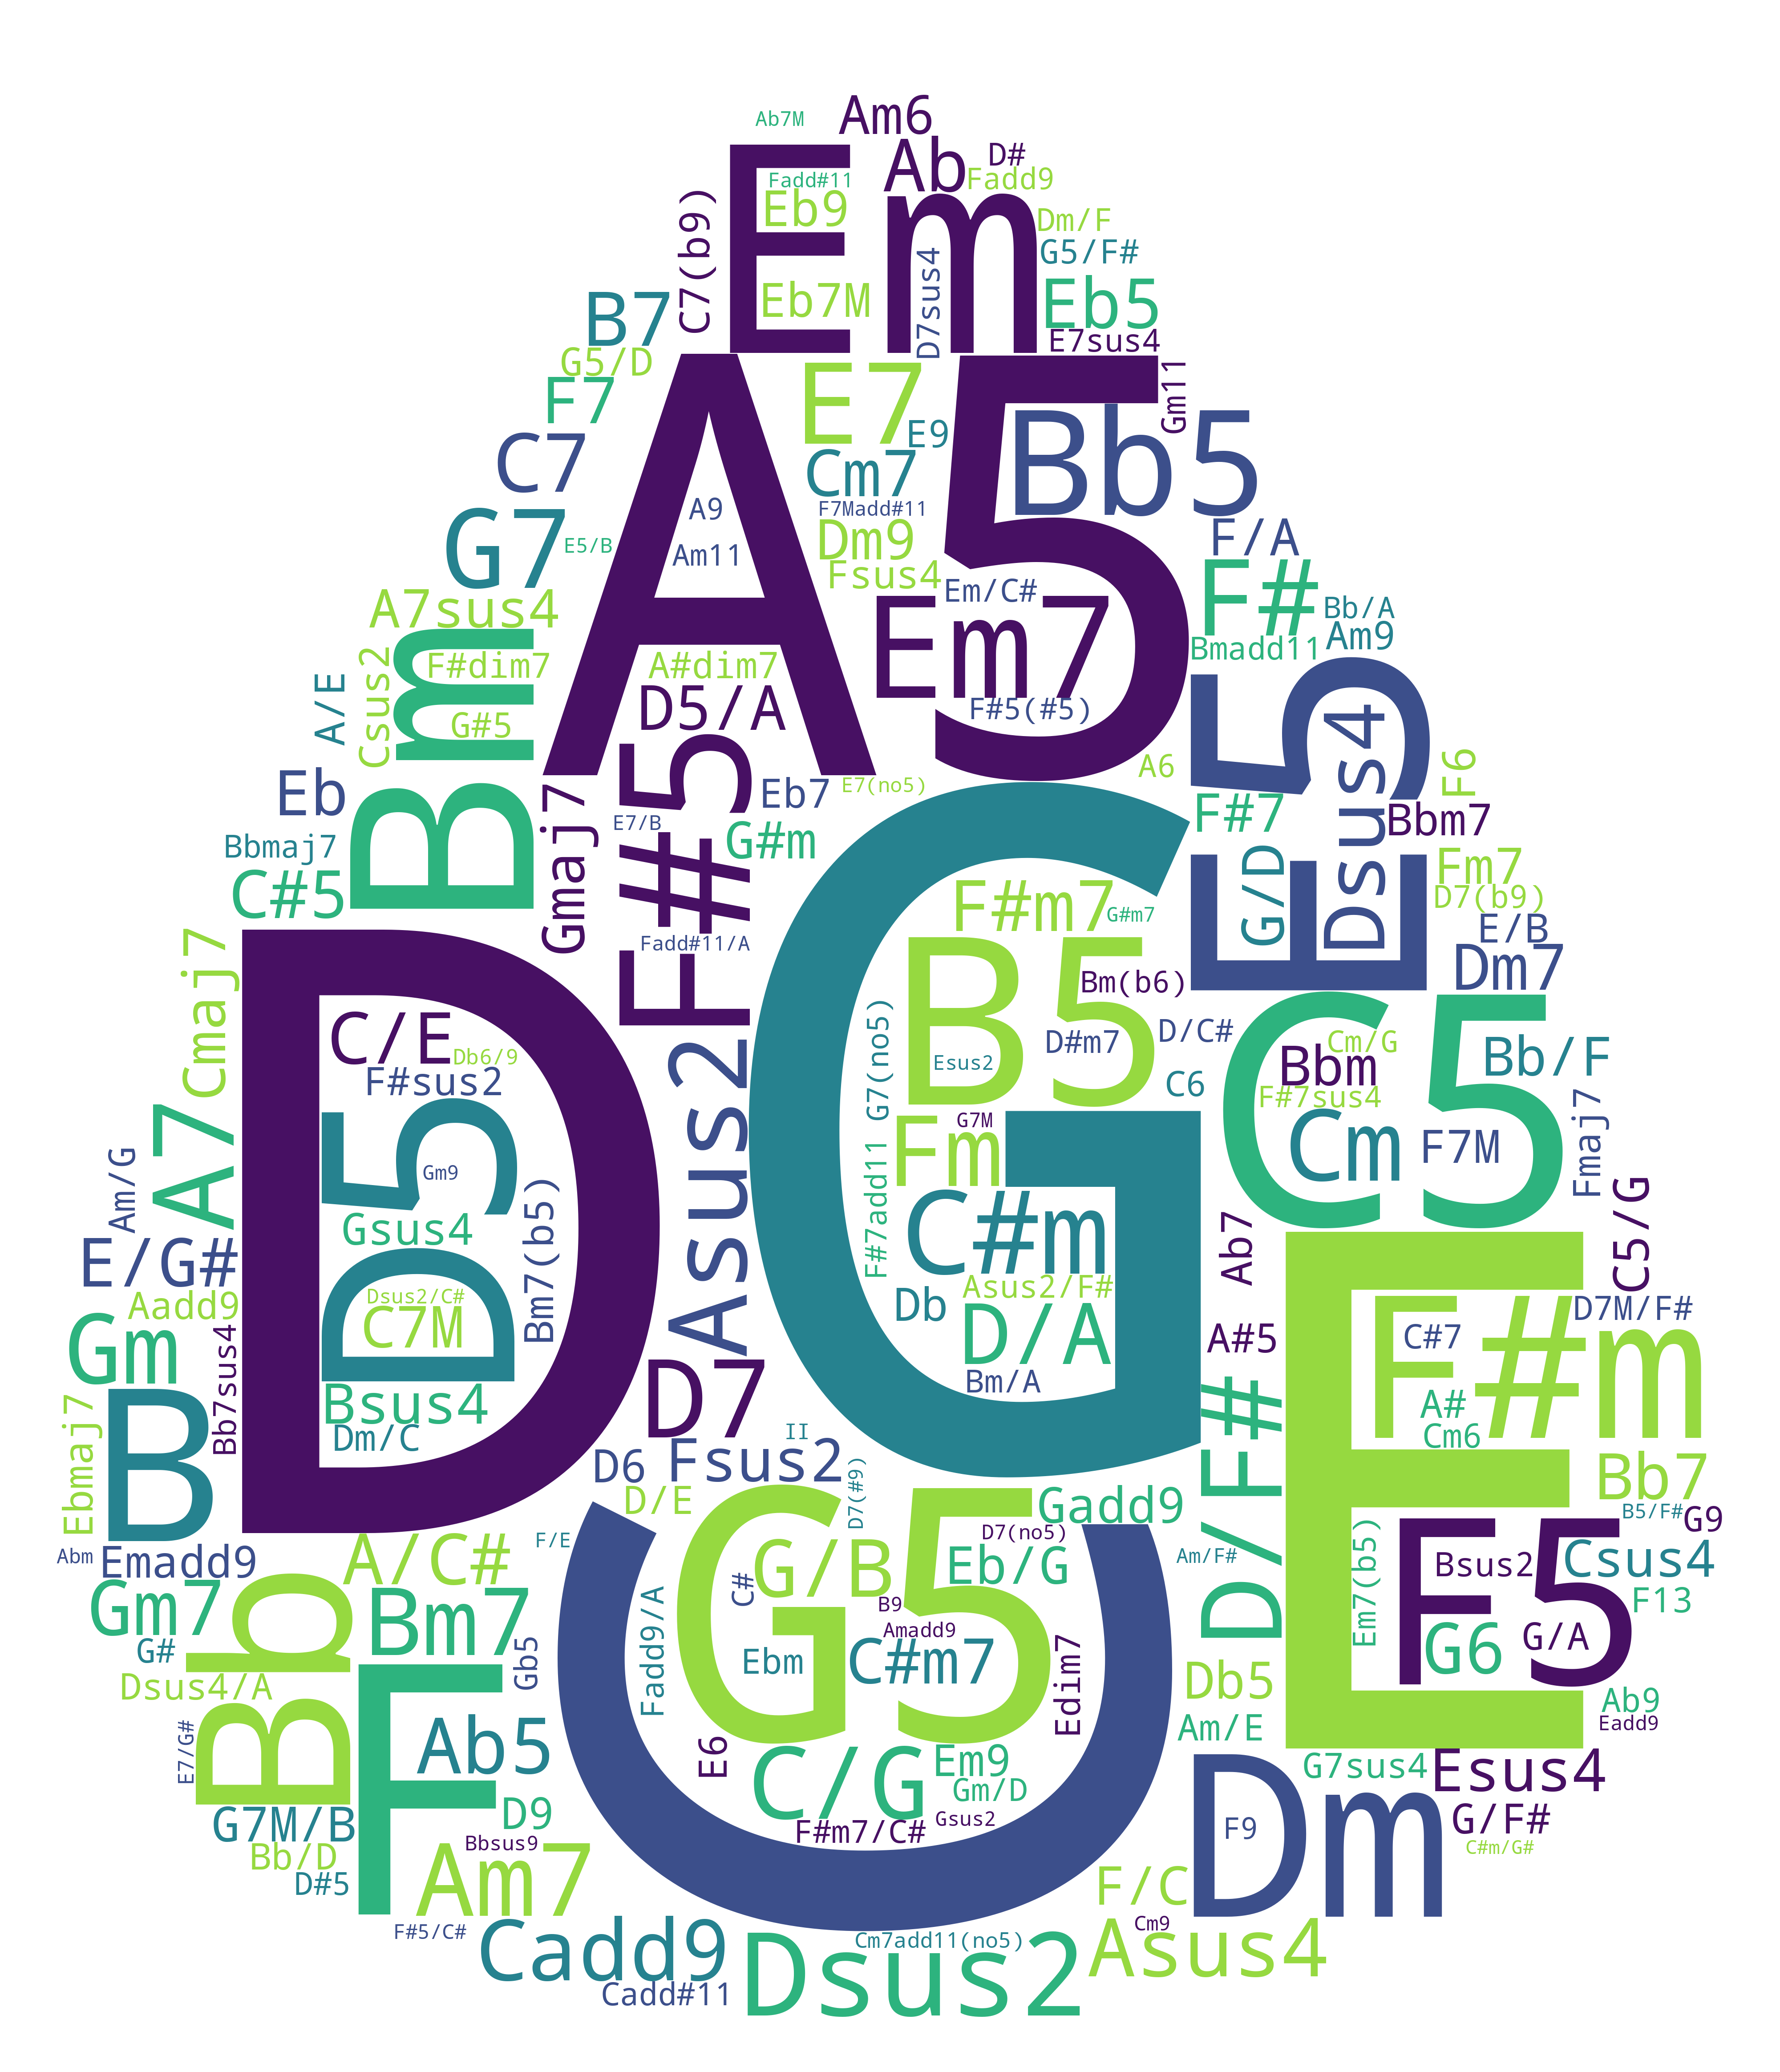
Wordcloud representations of the chord labels are also provided (Figure 6) to give an overview of the combined root notes and chord natures. This representation further confirms the unbalanced nature of the datasets but also illustrates their differences in the relative importance of chords. For instance, power chords are more prominent in MSB than in DadaGP.
While chord labels are already numerous and varied, even more variety comes with the different diagrams that can be used for each label. One can get a sense of it through the median number of diagrams per label: 11.5 for MSB and 24 for DadaGP. This observation illustrates the number of possibilities when suggesting a diagram for a chord, while also showing how a bigger dataset comes with more variety (which could be considered noise). This variety and noisiness of data is particularly noticeable on the most common chords, G Major having 33 and 108 diagrams in MSB and DadaGP, respectively. The variety of diagrams observed comes mostly from the fact that transcribers might write some strings as muted instead of open or played, which can yield different diagrams for the same hand position on the fretboard. The staggering amount of diagrams in DadaGP comes both from the same issue, worsened by the size of the corpus, and occasional incorrect labeling. For instance, some diagrams notated as a G Major can actually represent a G/B or a G5.
All diagrams observed for each chord label are available, along with the extracted chord pairs, on algomus.fr/data.
4.3 Data Augmentation Strategy
The previous statistical analyses showed that a wide variety of diagrams and labels are represented in both datasets. However, more common chords are over-represented and might prevent the model to suggest less used diagrams. We want to improve the robustness of the proposed approach and reduce its bias towards key signatures more frequent in the datasets so that the model can suggest diagrams even for rare tonalities and chord nature. To do so, we apply the augmentation technique from [12]. For each chord pair, both diagrams are shifted one fret down and the chord labels transposed one semitone down accordingly, until one of the diagrams contains an open string. Similarly, chord pairs are also shifted one fret up until reaching the 15th fret. This maximum is chosen based on the highest diagrams observed in data and to prevent the model from suggesting chords on higher frets, which are used far less in rhythm guitar. Using this augmentation strategy makes the training sets more than three times larger.
5 Experiments
5.1 Metrics
Like most tasks on probability estimation, we can evaluate the performance of the model through its Precision (P), Recall (R) and F1-score. However, in the case of this musical task, it could be argued that the so-called ground-truth is not perfect nor the only acceptable answer. For instance, a G major chord can be played with the following diagrams: 3.2.0.0.0.3 and 3.2.0.0.3.3 either repeating the B or the D, and they might be considered equivalent by guitar players. For this reason, we propose hereafter several automated metrics to account for the different errors that can be encountered on diagram prediction.
Pitch Metrics
Similarly to [6],
we want to measure to which extent the model
suggests diagrams that contain all the expected notes for a given chord label.
For this purpose, we compute for a chord diagram
the set of pitch classes it contains and compare it
with the pitch classes associated with the chord label .
From these sets, we can compute Pitch Precision (),
Pitch Recall () and a Pitch F1-score ().
Tablature Metrics Drawing insights from [6], we also define metrics to measure how similar the model suggestions are to the reference diagrams, when comparing them on the fretboard. Similarly to the pitch metrics, we compute the set of string/fret (SF) pairs on the predicted diagram and compare them with those of the expected diagram. We can use those sets to compute String/Fret Precision (), String/Fret Recall () and the corresponding F1-score ().
Detect Unplayable Diagrams To evaluate how often the model can return an unplayable diagram, we implement a playability metric inspired by [2]. In this paper, the authors define an anatomical score to evaluate the ease of playing a chord. They use a custom fitness function that penalizes chords containing uncomfortable stretches between fingers based on an optimal fingering computed beforehand. This metric allows us to detect unplayable diagrams when obtaining a low anatomical score, like in chords spanning over 5 frets or more. We settled for a threshold of after manual analysis of anatomical scores and playability of the model’s suggestions.
Ease of Transition While it is necessary that the suggested diagrams are playable, playability of chord sequences also depends on the chord transitions involved. To assess the ease of the transitions suggested, we also implement the chord change (CC) metric proposed in [4]. This metric analyzes the transition between the diagrams through two movements: wrist movement , which is obtained as the absolute difference of the index finger fret in the two chords; and the fingers movement , defined as the Manhattan distance between the positions of each finger. The final value is inversely proportional to these movements measures and is highest (1) when the chord change is easy () and close to 0 when the transition is very hard ().
5.2 Results
For the experiments, we apply a 60-20-20 train, validation, test split to both datasets and average the results over four different splits (Table 1). For fair comparison with the baseline, chord pairs which have identical and (but different ) are considered duplicates and skipped during testing. The data augmentation strategy presented subsection 4.3 is used for the full model but not for the baseline as it decreased its performance. This observation suggests that the results of the baseline should be taken with care, as prediction quality might decrease significantly on data not represented in the training set. The first observation from Table 1 is that the proposed model surpasses the baseline on standard, pitch and string/fret F1-scores. However, both implementations perform well on pitch metrics, showing that the proposed diagrams contain overall the expected pitch content. There is also a significant improvement over the baseline on string/fret metrics, suggesting that information from the previous diagram helps the model choose the correct fretboard area.
| F1 | ||||
|---|---|---|---|---|
| MSB | Baseline | 0.40.01 | 0.87.01 | 0.46.04 |
| Full Model | 0.72.02 | 0.90.01 | 0.67.02 | |
| DGP | Baseline | 0.38.01 | 0.88.00 | 0.45.02 |
| Full Model | 0.63.01 | 0.88.01 | 0.60.02 |
Unplayability and transition ease of the ground-truth and the models’ prediction are shown in Table 2. It can be observed that the proposed model suggests unplayable diagrams 15% of the time, which is moderately more than the baseline, with a clearer gap on DadaGP. As a reference, 3-4% of the ground-truth diagrams are deemed unplayable – most of them because the metric does not recognize the barré technique with other fingers than the index. However, the proposed diagrams permit slightly easier transitions than the baseline, which is probably again due to the context information that keeps the suggested diagram in the same fretboard area, thus limiting wrist and fingers movements. Nonetheless, even our model with context information has a 10 percentage points difference with the transition ease measured in the datasets, showing that the transitions are still too complicated.
| Unplayable diagrams | Ease of Transition | ||
| MSB | Baseline | 0.12.02 | 0.15.02 |
| Full Model | 0.15.03 | 0.21.03 | |
| Test Set | 0.03.02 | 0.31.02 | |
| DadaGP | Baseline | 0.09.01 | 0.13.01 |
| Full Model | 0.15.01 | 0.19.01 | |
| Test Set | 0.04.01 | 0.29.01 |
Overall, one can note that performance is similar on MSB and DadaGP. We still decided to share results on both datasets because we deemed relevant the fact that the proposed approach improves diagram suggestion even when training on noisier data. It also shows that a larger amount of chord pairs with an unbalanced distribution does not significantly increase the bias towards common diagrams.
5.3 Diagram Texture Consistency
We want to evaluate here if the texture change observed when using a suggested diagram is similar to the one from the reference. To measure this texture, we implement some of the sound quality measures of [2] and variations of them. More precisely, for each diagram, we extract: the ratio of open strings; the ratio of muted strings; the string centroid; and the ratio of unique notes i.e. counting only once notes that are repeated on several octaves. We also compute the difference of these metrics from one chord to the next to assess how consistent they are through a transition. The results are reported in Table 3.
| DadaGP | MSB | |||||
|---|---|---|---|---|---|---|
| BL | Full | Data | BL | Full | Data | |
| Muted notes | 0.15 .01 | 0.27 .01 | 0.28 .01 | 0.32 .02 | 0.32 .01 | 0.33 .01 |
| 0.20 .01 | 0.08 .00 | 0.10 .01 | 0.18 .02 | 0.08 .01 | 0.08 .01 | |
| Open Strings | 0.25 .01 | 0.19 .02 | 0.20 .01 | 0.20 .01 | 0.17 .02 | 0.20 .02 |
| 0.22 .01 | 0.15 .01 | 0.17 .00 | 0.19 .01 | 0.15 .01 | 0.15 .01 | |
| String Centroid | 0.53 .00 | 0.54 .01 | 0.55 .00 | 0.60 .01 | 0.59 .01 | 0.59 .01 |
| 0.10 .00 | 0.05 .00 | 0.06 .00 | 0.11 .01 | 0.05 .01 | 0.06 .01 | |
| Unique Notes | 0.61 .00 | 0.71 .00 | 0.80 .01 | 0.68 .01 | 0.72 .01 | 0.80 .01 |
| 0.21 .01 | 0.13 .00 | 0.12 .00 | 0.20 .02 | 0.13 .01 | 0.11 .01 | |
All values go from 0 to 1. A first observation is that the performances of the full models trained and tested on DadaGP and MSB are similar. However, this experiment does show slight differences in the datasets, on the amount of muted notes and the string centroids in particular. The biggest difference is the improvement of the baseline’s performance on individual chord metrics for MSB, which could be due to the fact that the dataset is smaller and less varied. From the values for both datasets, it appears that the metrics are rather consistent from one chord to the next. We can also observe that the baseline trained on DadaGP tends to play too many notes on each chord (lower ratio of muted notes) probably by repeating them on different octaves (lower ratio of unique notes). Finally, an encouraging result is that the model using context suggests diagrams with a texture similar to the ground-truth (lower values). It should however be noted that it also tends to repeat more notes than necessary, while still missing some.
6 Discussion
6.1 Application to Rhythm Guitar Continuation
As introduced in [28], a chord diagram suggestion tool could be used in a larger framework for rhythm guitar continuation. Provided with a chord sequence and a tablature prompt, a guitar player might be interested in generating the continuation of the prompt. The model introduced in this paper could be used as a first step to choose chord diagrams that are consistent with the prompt, before generating a tablature showing how to strum the new chords. An example of this usage on three different chord sequences is given Figure 7.
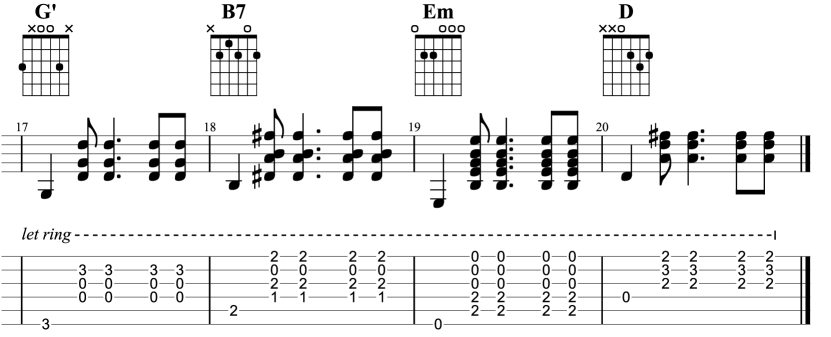
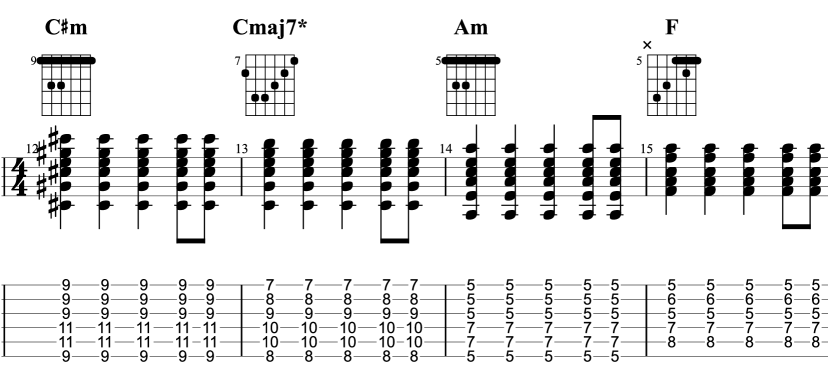
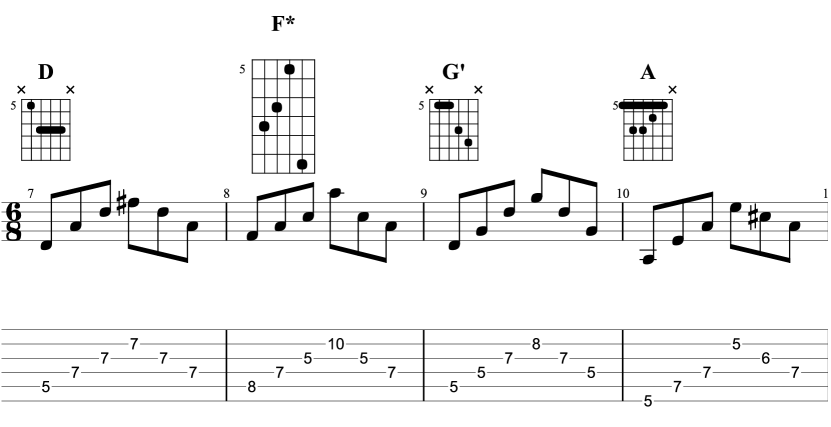
Chord label sequences are generated with the tool from [21] and the first diagram is sampled from the probability distribution of all diagrams for the corresponding label. Subsequent diagrams are generated successively using our trained model. To illustrate potential tablature applications, strumming patterns were proposed by the authors for the first bar, and then uniformly generalized to following bars. As discussed in subsection 5.2, the system sometimes suggests unplayable diagrams and does not always include all the notes expected in a chord. However, we think that the sequences are consistent in terms of texture and usually contain diagrams less common than standard open chords and barré chords. For instance, in the first sequence, the B7 diagram contains an open string that would help maintain the sound quality of the first chord, unlike the more common barré shapes that are x.2.4.2.4.2 or 7.9.7.8.7.7. In the second sequence, though the second diagram is not playable (at least with common guitar techniques), the model suggested keeping a similar barré shape and shifting it on the fretboard. However, it changes shape on the last F chord which allows staying around the same frets as the previous Am chord. Finally, the last sequence exhibits a similar behavior, all diagrams starting at the 5th fret, even though the second diagram repeats the A on the 10th fret, making the overall diagram very hard to play.
6.2 Conclusions and Future Work
In this paper, we have shown that chords used in the Western popular guitar repertoire are varied but also highly unbalanced, with some common chords and diagrams being used much more frequently than more complex ones. From this observation, we proposed a new approach to suggest guitar chord diagrams for Western popular music. We showed with several metrics that adding context information through the previous diagram improves the quality of the suggestions while also maintaining a better consistency of texture between chords. All experiments were conducted on two datasets, one proprietary and one public, to further guarantee the validity of the conclusions. Finally, we also gave an example application of the proposed tool in rhythm guitar continuation, where it could help beginners play more interesting and varied chords, or ease the process of writing accompaniment tracks.
Studying this application in more details is a possibility for future work, as well as improving the current suggestion tool, for instance by conditioning the suggestions on musical style. It would also be relevant to increase the number of previous diagrams provided as context. This could allow seeing how far back the system needs to look to maximize the quality of the suggestions, and show when and how continuity in texture is broken. Besides, it is likely that the suggestion system could be improved by musically relevant features on the context like harmony or instrumentation, as other instruments affect greatly the diagrams chosen by guitar players. Finally, while we studied texture consistency through several metrics, it would also be interesting to check how the diagrams suggested affect the voices from one chord to the other and whether the transitions respect some voice-leading principles.
Acknowledgments
This work is partially funded under the ANR-TABASCO project:
ANR-22-CE38-0001.
The authors would like to thank the reviewers, as well as
Baptiste Bacot, Louis Couturier, Dinh-Viet-Toan Le, and Mathieu Giraud for their
feedback on this paper.
References
- [1] K. Sawayama, N. Emura, M. Miura, and M. Yanagida, “A system yielding the optimal chord-form sequence on the guitar,” in Proc. of the International Conference on Music Perception and Cognition (ICMPC), 2006.
- [2] K. A. Wortman and N. Smith, “CombinoChord: A Guitar Chord Generator App,” in IEEE 11th Annual Computing and Communication Workshop and Conference (CCWC), 2021.
- [3] M. A. V. Vásquez, M. Baelemans, J. Driedger, W. Zuidema, and J. A. Burgoyne, “Quantifying the ease of playing song chords on the guitar,” in Proc. of the 24th International Society for Music Information Retrieval Conference (ISMIR), 2023.
- [4] K. Yazawa, K. Itoyama, and H. G. Okuno, “Automatic transcription of guitar tablature from audio signals in accordance with player’s proficiency,” in IEEE International Conference on Acoustics, Speech and Signal Processing (ICASSP), 2014.
- [5] E. J. Humphrey and J. P. Bello, “From music audio to chord tablature: Teaching deep convolutional networks toplay guitar,” in IEEE International Conference on Acoustics, Speech and Signal Processing (ICASSP), 2014.
- [6] A. Wiggins and Y. E. Kim, “Guitar Tablature Estimation with a Convolutional Neural Network.” in Proc. of the 20th International Society for Music Information Retrieval Conference (ISMIR), 2019.
- [7] F. Cwitkowitz, J. Driedger, and Z. Duan, “A Data-Driven Methodology for Considering Feasibility and Pairwise Likelihood in Deep Learning Based Guitar Tablature Transcription Systems,” in Proc. of the Sound and Music Computing Conference (SMC), 2022.
- [8] Y. Zang, Y. Zhong, F. Cwitkowitz, and Z. Duan, “SynthTab: Leveraging Synthesized Data for Guitar Tablature Transcription,” in IEEE International Conference on Acoustics, Speech and Signal Processing (ICASSP), 2024.
- [9] M. McVicar, R. Santos-Rodriguez, Y. Ni, and T. D. Bie, “Automatic Chord Estimation from Audio: A Review of the State of the Art,” IEEE/ACM Transactions on Audio, Speech, and Language Processing, vol. 22, no. 2, 2014.
- [10] R. M. Bittner, J. J. Bosch, D. Rubinstein, G. Meseguer-Brocal, and S. Ewert, “A Lightweight Instrument-Agnostic Model for Polyphonic Note Transcription and Multipitch Estimation,” in IEEE International Conference on Acoustics, Speech and Signal Processing (ICASSP), 2022.
- [11] A. M. Barbancho, A. Klapuri, L. J. Tardon, and I. Barbancho, “Automatic Transcription of Guitar Chords and Fingering From Audio,” IEEE Transactions on Audio, Speech, and Language Processing, vol. 20, no. 3, 2012.
- [12] M. McVicar, S. Fukayama, and M. Goto, “AutoGuitarTab: Computer-Aided Composition of Rhythm and Lead Guitar Parts in the Tablature Space,” in IEEE/ACM Transactions on Audio, Speech, and Language Processing, vol. 23, 2015.
- [13] Y.-H. Chen, Y.-S. Huang, W.-Y. Hsiao, and Y.-H. Yang, “Automatic Composition of Guitar Tabs by Transformers and Groove Modeling,” in Proc. of the 21st International Society for Music Information Retrieval Conference, 2020.
- [14] P. Sarmento, A. Kumar, C. J. Carr, Z. Zukowski, M. Barthet, and Y.-H. Yang, “DadaGP: A Dataset of Tokenized GuitarPro Songs for Sequence Models,” in Proc. of the 22nd International Society for Music Information Retrieval Conference, 2021.
- [15] S. Adkins, P. Sarmento, and M. Barthet, “LooperGP: A Loopable Sequence Model for Live Coding Performance Using GuitarPro Tablature,” in International Conference on Computational Intelligence in Music, Sound, Art and Design (EvoMUSART), 2023.
- [16] P. Sarmento, A. Kumar, Y.-H. Chen, CJ. Carr, Z. Zukowski, and M. Barthet, “GTR-CTRL: Instrument and Genre Conditioning for Guitar-Focused Music Generation with Transformers,” in International Conference on Computational Intelligence in Music, Sound, Art and Design (EvoMUSART), 2023.
- [17] P. Sarmento, A. Kumar, D. Xie, CJ. Carr, Z. Zukowski, and M. Barthet, “ShredGP: Guitarist Style-Conditioned Tablature Generation with Transformers,” in Proc. of the 16th International Symposium on Computer Music Multidisciplinary Research (CMMR), 2023.
- [18] J. Loth, P. Sarmento, CJ. Carr, Z. Zukowski, and M. Barthet, “ProgGP: From GuitarPro Tablature Neural Generation To Progressive Metal Production,” in Proc. of the 16th International Symposium on Computer Music Multidisciplinary Research (CMMR), 2023.
- [19] W. Cui, P. Sarmento, and M. Barthet, “MoodLoopGP: Generating Emotion-Conditioned Loop Tablature Music with Multi-Granular Features,” in International Conference on Computational Intelligence in Music, Sound, Art and Design, 2024.
- [20] T.-P. Chen, S. Fukayama, M. Goto, and L. Su, “Chord Jazzification: Learning Jazz Interpretations of Chord Symbols,” in Proc. of the 21st International Society for Music Information Retrieval Conference, 2020.
- [21] D. Dalmazzo, K. Déguernel, and B. L. T. Sturm, “The Chordinator: Modeling Music Harmony By Implementing Transformer Networks and Token Strategies,” in International Conference on Computational Intelligence in Music, Sound, Art and Design (EvoMUSART), 2024.
- [22] V. Lombardo and D. P. Radicioni, “Guitar Fingering for Music Performance,” in Proc. of the International Computer Music Conference (ICMC), 2005.
- [23] G. Hori, H. Kameoka, and S. Sagayama, “Input-Output HMM Applied to Automatic Arrangement for Guitars,” Journal of Information Processing, vol. 21, no. 2, 2013.
- [24] G. Hori and S. Sagayama, “Minimax Viterbi Algorithm for HMM-based Guitar Fingering Decision,” in Proc. of the 17th International Society for Music Information Retrieval Conference, 2016.
- [25] G. Hori, “Three-Level Model for Fingering Decision of String Instruments,” in Proc. of the 15th International Symposium on Computer Music Multidisciplinary Research (CMMR), 2021.
- [26] S. Ariga, S. Fukayama, and M. Goto, “Song2Guitar: A Difficulty Aware Arrangement System for Generating Guitar Solo Covers from Polyphonic Audio of Popular Music,” in Proc. of the 18th International Society for Music Information Retrieval Conference, 2017.
- [27] J. Cournut, L. Bigo, M. Giraud, N. Martin, and D. Régnier, “What are the most used guitar positions?” in 8th International Conference on Digital Libraries for Musicology (DLfM), 2021.
- [28] A. D’Hooge, L. Bigo, and K. Déguernel, “Rhythm Guitar Tablature Continuation from Chord Progression and Tablature Prompt,” in Digital Music Research Network One-day Workshop (DMRN+18), 2023.