The interstellar medium conditions of a strong Ly emitter at revealed by JWST: a robust LyC leaker candidate at the Epoch of Reionization
Abstract
Making use of JWST NIRSpec and NIRCam data, we conduct a detailed analysis of GN-8-LAE, a strong Ly emitter at . We investigate the interstellar medium (ISM) conditions that enable the Ly detection in this source at the Epoch of Reionization (EoR), and scrutinize GN-8-LAEas an early reionizer. In agreement with previous results, we find that GN-8-LAEis a young galaxy (age ) with lower stellar mass () than most Ly emitters at similar redshifts. The derived stellar mass and star formation rate surface densities are and , respectively. Our spectral analysis indicates that: the Ly line peak has a small velocity offset with respect to the galaxy systemic redshift; ; the ISM is characterized by a hard ionization field, although no signature of AGN is present. Moreover, we report the presence of NIII] emission implying super-solar N abundance, which makes GN-8-LAEone of the first strong Ly and nitrogen emitters at the EoR. Based on all these properties, we apply a wide range of methods to constrain the Lyman continuum escape fraction () of GN-8-LAEand report in all cases. Therefore, we conclude that GN-8-LAEis a robust candidate for a Lyman continuum (LyC) leaker at the EoR which is being caught at the moment of efficiently reionizing its surrounding medium.
d
1 INTRODUCTION
Finding the sources that reionized the Universe within the first billion years of cosmic time constitutes one of the main goals of extragalactic astronomy. Based on a number of observational constraints, it has been determined that the Epoch of Reionization (EoR) occurred between redshifts and (Robertson et al., 2015), although some recent quasar studies suggest that it would have only been completed by redshift (Kulkarni et al., 2019; Bosman et al., 2022).
During this period, the intergalactic medium changed progressively from a state dominated by neutral atomic hydrogen (HI) to a phase with virtually all atomic H ionized. This process requires that sufficient H ionizing photons (with energy ) are produced within galaxies and can escape their interstellar media to reach and ionize their circumgalactic gas. Reionization is, therefore, depicted as a process in which growing bubbles of ionized gas progressively fill the intergalactic medium until making it completely transparent (e.g., Dayal & Ferrara, 2018).
The opacity of the IGM during the EoR prevents direct observation of basically all the H-ionizing photons produced by galaxies at that time. Indeed, there is a declining incidence of Ly emitting galaxies at (e.g., Stark et al., 2010; Fontana et al., 2010; Pentericci et al., 2011; Caruana et al., 2014; Schenker et al., 2014). However, this decline is less evident in the most luminous star-forming galaxies, with several examples of bright Ly emitters found at (e.g., Zitrin et al., 2015; Roberts-Borsani et al., 2016; Stark et al., 2017; Kumari et al., 2024; Witstok et al., 2024a). These sources constitute an excellent laboratory to investigate how the patchy reionization process evolved in the first billion years of cosmic time.
An alternative approach to understanding the drivers of reionization is to study the so-called Lyman continuum (LyC) leakers at low and intermediate redshifts (e.g., Leitherer et al., 1995; Steidel et al., 2001; Vanzella et al., 2018; Flury et al., 2022). These are rare star-forming galaxies in which a significant amount ofionizing photons are able to escape the source and its circumgalactic medium (CGM) to reach the observer. If the escape fraction is , then the LyC leaker is considered a good analog of the sources of reionization. This is because it is estimated that star-forming galaxies at high must have had to have efficiently conducted the reionization process (e.g., Rosdahl et al., 2018), although some observational studies concluded that a value could be enough (Atek et al., 2024).
As the LyC leakage cannot be directly observed at the EoR, considerable effort has been devoted to identifying other photometric and spectroscopic properties that characterize LyC leakers. These galaxies typically show compact morphologies with high star formation rate densities (; e.g., Naidu et al., 2020); a steep UV continuum; a narrow Ly line with high rest-frame EW () and with a small velocity offset () with respect to the galaxy systemic redshift derived from other emission lines (Verhamme et al., 2017; Izotov et al., 2018); a line ratio [OIII]/[OII] (Nakajima & Ouchi, 2014; Izotov et al., 2017; Flury et al., 2022); and strong CIV emission, with C IV/C III] (Schaerer et al., 2022), among others. However, very rarely have all these properties been reported together in LyC leakers.
With its high sensitivity up to mid-infrared wavelengths, JWST (Gardner et al., 2023) is making the study of galaxies within the EoR routinely possible (e.g., Endsley et al., 2023; Rinaldi et al., 2023, 2024a; Caputi et al., 2024; Iani et al., 2024a; Bunker et al., 2023; Donnan et al., 2023; Castellano et al., 2024; Harikane et al., 2024). JWST spectroscopic capabilities in the infrared allow for unprecedented investigations of the interstellar media in some of these sources (e.g., Bunker et al., 2023; Matthee et al., 2023; Schaerer et al., 2024). These studies point towards the presence of relatively extreme interstellar medium conditions, which are not typically found at lower redshifts (e.g., Meštrić et al., 2022; Vanzella et al., 2023). With JWST spectroscopy one can search, in particular, for the signatures that characterize LyC leakers (e.g., Mascia et al., 2023a). Moreover, JWST spectra have enabled the discovery of unexpected emission lines whose origin is difficult to explain, such as NeIII] and NIV], which has recently been reported in a number of high- objects (e.g., Isobe et al., 2023; Marques-Chaves et al., 2024; Schaerer et al., 2024).
In this work, we present a detailed spectroscopic and photometric study of GN-8-LAE, a strong Ly emitter at selected from the public JWST Advanced Deep Extragalactic Survey (JADES; Eisenstein et al., 2023a) in GOODS-North. This source was previously studied in other works (e.g., Hainline et al., 2024) and within a sample of high- Ly emitters by Witstok et al. (2024a) (under the name JADES-GN-z8-0-LA) who inferred that it could have a very high escape fraction and lived in a large ionized bubble, with the likely presence of interacting companions. Here we perform an independent study of the JWST data for this source, particularly extending the analysis of spectral properties in order to obtain a more complete understanding of the physical conditions of this strong early reionizer candidate.
Our paper is structured as follows. In Section 2 we describe the datasets used in our study. We present our independent derivation of the main physical properties of GN-8-LAE, based on the analysis of both spectroscopic and photometric data, in Section 3. In Section 4 we test all the main criteria to identify LyC leakers and show that GN-8-LAE complies with all of them. Finally, in Section 5 we summarize our findings and present some concluding remarks. We adopt thoughout a flat CDM cosmology with , and , and a Kroupa initial mass function (Kroupa, 2001). In all cases, the term ‘escape fraction’ () refers to its absolute value.
2 DATA
We use the publicly available spectroscopic and photometric data from JADES (Eisenstein et al., 2023b) in the GOODS-N, as part of the Public Data Release 3 (D’Eugenio et al., 2024). It contains several thousands of readily available reduced, extracted, and calibrated NIRSpec/MSA spectra. We complement this rich dataset with JWST/NIRCam and HST imaging.
In the following sections, we will discuss in more detail the observations of GN-8-LAE, which is included in the JADES catalog with NIRSpec-ID 1899 and NIRCam-ID 1010260 (: 189h11m51.86s, 62°15’25.06”).
2.1 JWST/NIRCam and HST observations
We collect all JWSTimaging from the JADES third release public JWST/NIRCam data D’Eugenio et al. (2024). HST images for this source were retrieved from the Hubble Legacy Fields (HLF) GOODS-N public data release, as described by Whitaker et al. (2019).
We choose to extract forced photometry using Photutils (Bradley et al., 2022), using apertures of radius to minimize possible contamination between GN-8-LAE and a nearby faint, high- source. After confirming that the position of GN-8-LAE is accurate in the JADES catalog, we use the centroids to perform forced photometry. We applied the aperture corrections derived by the JADES team for matching filters and aperture size, and corrected for galactic extinction as described in Navarro-Carrera et al. (2023).
We estimated the errors by placing a series of radius apertures around each source in blank parts of the sky. We then measured the standard deviation between the recovered fluxes, which is the 1 uncertainty for our flux measurements. We use 3 uncertainties as upper limits and set the flux to zero in the case of non-detection.
As a sanity check, we compared our photometry against the one in the JADES catalog (D’Eugenio et al., 2024). All our flux measurements are in agreement with the ones reported by JADES, within their respective uncertainties.
We explore the morphology of GN-8-LAE by modeling it for several NIRCam bands, covering the rest-frame UV and optical. We used both Sérsic (Sérsic, 1963), Gaussian, and point-like PSF-convolved models, and fitted them to the NIRCam observations using PetroFit (Geda et al., 2022) with PSFs generated using WebbPSF (Perrin et al., 2014) in a 3x3” background subtracted cutout centered around GN-8-LAE.
Our findings suggest that GN-8-LAE is only resolved in the short wavelength (SW) bands, with an effective radius of pc (measured in F150W, corresponding to the rest-frame UV of GN-8-LAE). The fit residuals for the long wavelength (LW) bands show a good fit and do not show significant differences when using Sérsic, Gaussian, or point-like profiles (suggesting an effective radius pc).
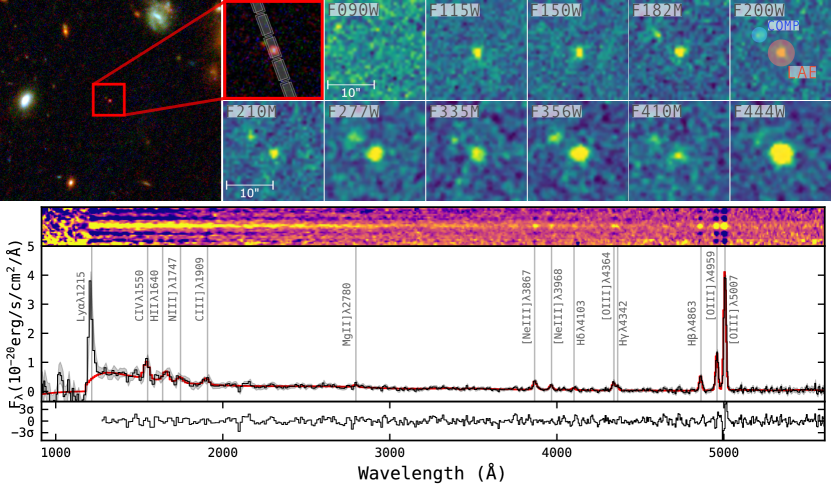
A visual inspection of GN-8-LAEhighlights the presence of a faint source very close in projection to GN-8-LAE, in the detector plane. This galaxy is part of the JADES photometric catalog but does not have any spectroscopic observations associated with it, and could be a fainter high- candidate. Fig. 1 shows the orientation of the shutters relative toGN-8-LAE, together with cutouts for all NIRCam bands centered in GN-8-LAE (labeled as LAE). We also highlight the companion located north-west of GN-8-LAE (labeled as COMP).
2.2 NIRSpec/MSA observations
We use NIRSpec/MSA spectroscopic observations from the JADES NIRCam+NIRSPec program in the GOODS-N (PID: 1181, PI: Eisenstein). The data are publicly available in the MAST (DOI: 10.17909/8tdj-8n28)
The observations of our target were taken in two different configurations: low-resolution () using prism and covering the spectral range 0.6–5.3 , and medium-resolution () using the G140M, G235M, and G395M gratings. We refer the reader to D’Eugenio et al. (2024) for a more detailed description of the observation strategy and reduction of the spectroscopic data used in this paper.
The NIRSpec observations are comprised of a total of two dithers with the 3-point nodding pattern. This translates into 12 integrations and a total of 12ks for the prism observations, and 6 integrations and a total of 6ks for each grating. This allows us to detect both strong (and faint) emission lines and continuum in the case of prism observations.
This source was not affected by any of the technical issues described in D’Eugenio et al. (2024), and the extracted spectrum has a good S/N, so no re-extraction was performed with a smaller number of pixels (e.g., 3 central pixels in Bunker et al., 2023; Witstok et al., 2024a).
We use a modified version of MSAEXP (Brammer, 2023) line fitting algorithm to measure the line fluxes, their respective uncertainties, and observed equivalent widths for both prism and gratings. Among the additional features, our modified version of MSAEXP allows for broad emission line templates, and an enriched list of emission lines (Kokorev et al. 2024b in prep). MSAEXP provides a fit for all emission lines and continuum simultaneously. It makes use of single narrow and/or broad templates for emission lines and splines for the continuum. The template matrix is fitted using least squares. We determine the upper limits using the MSAEXP best-fit continuum and the observed flux and errors, assuming the typical line width for the rest of lines in each spectrum.
We have compared our extracted line fluxes with the ones quoted in the JADES catalog. The line fluxes are in excellent agreement for all measurements in common, well within the estimated uncertainties. These values are provided in Table 1. A detailed analysis of the Ly emission line is presented in Sect. 3.9.
3 Physical Properties of GN-8-LAE
| Line | |||||
| C iv] 1548,1550 | 228 | 36 | - | - | |
| O iii] 1660,1666 + He ii 1640a | 131 | 43 | - | - | |
| (He ii 1640)a | 35 | - | - | - | - |
| N iii] 1749-1753 | 69 | 30 | - | - | |
| C iii] 1907,1909 | 69 | 28 | - | - | |
| Mg ii 2795,2802 | 25 | 13 | - | - | |
| [O ii] 3726,3729b | - | 21 | 12 | - | |
| [Ne iii] 3869c | - | - | 59.8 | 9.7 | |
| [Ne iii] 3967 + H | 35.0 | 7.0 | - | - | |
| H | 15.4 | 7.0 | 19.8 | 7.6 | |
| H d | 45 | 10 | 44 | 12 | |
| [O iii] 4363d | 28.6 | 9.5 | - | - | |
| H | 93.1 | 8.0 | 76 | 12 | |
| [O iii] 4959 | 230 | 10 | 232 | 17 | |
| [O iii] 5007 | 715 | 14 | 749 | 23 |
In the following sections, we will characterize the emission lines detected for GN-8-LAE, its spectroscopic redshift and UV properties, metallicity, elemental abundances and several other parameters.
We report a summary of all physical properties derived for GN-8-LAE in Table 3.
3.1 Emission lines and spectroscopic redshift
The combination of broad spectral coverage and high signal-to-noise from the prism spectrum allows us to detect a wealth of rest-frame optical and UV emission lines (see Table 1). The continuum is also well-detected at all wavelengths. Fig. 1 shows both 2D and 1D spectra, the aspect of GN-8-LAE in JWST/NIRCam images, and the positioning of the NIRSPec/MSA shutters.
We report line flux measurements and rest-frame equivalent widths (henceforth abbreviated ) in Table 1. When available, we report the measured fluxes from both prism and gratings. Notably, s are always measured using the PRISM spectrum, as the continuum is not present in gratings.
Interestingly, blue-wards of Ly we tentatively detect an emission feature that falls at the expected wavelength of the line complex O VI + Ly + C II. However, a careful analysis of the spectral data reduction and extraction should be performed to confirm the presence of these lines more robustly.
The low spectral resolution of the prism observations () makes several lines appear partially or completely blended. This is shown in Table 1. Crucially, the blending between H and [O iii] 4363 is only partial, and the respective line fluxes were recovered by a careful fit in which the line central wavelengths were fixed. As a sanity check, the comparison between the deblended H flux, and the one from the grating spectrum shows an excellent agreement.
The spectroscopic redshift of GN-8-LAE was derived by averaging the positions of all emission lines detected in the prism spectrum (excluding blended lines and the Ly line). We report a redshift . This spectroscopic redshift solution derived using NIRSpec/MSA is in good agreement with the one obtained by the FRESCO team using only the [O iii] 5007,4959 lines (8.28 Oesch et al., 2023)) and with the one reported by Witstok et al. (2024a).
Wavelength calibration offsets between prism and grating spectra were reported by D’Eugenio et al. (2024), thus we double-checked the spectroscopic redshift obtained from grating G395M, with the most detected emission lines. We retrieved a , compatible with the PRISM solution. The peak of the [O iii] 5007 from the G395M is in excellent agreement with the redshift determined from the prism spectrum (see Fig. 6). Accordingly, no systematic effect on wavelength calibration was found between gratings and prism for GN-8-LAE.
| Parameter | Reference/Prior | Best-fit Value |
| Templates | BC03a | |
| SFH | delayed exponential | |
| folding time (, Gyr) | 0.0001–15 | |
| Mass () | ||
| Metallicity () | ||
| Age (Gyr) | 0.0001 – 15 | |
| Extinction law | SMCc | |
| Av | 0.0 - 7.0 | |
| -slope | - | |
| IMF | Kroupa (2001) |
3.2 Spectro-photometric SED fitting
To fully explore the high-quality photometric and spectroscopic data available for GN-8-LAE, we use BAGPIPES (Carnall et al., 2019a) for performing a joint spectro-photometric SED fitting. Table 2 lists the configuration parameters employed for the run. Briefly, BAGPIPES uses stellar emission from Bruzual & Charlot (2003) with an Kroupa (2001) initial mass function (IMF) with a cut-off mass of , and nebular emission from CLOUDY (Ferland et al., 2013). We used broad and flat (uninformative) priors for all parameters, as the combination of spectrum and photometry has enough constraints without any additional information. All runs were performed by fixing the redshift to the spectroscopic value retrieved as described in the previous sections.
We use the techniques described by Carnall et al. (2019b) to take full advantage of the combination of spectroscopic and photometric datasets. In particular, we allow for a perturbation to the spectrum in the form of a second-order Chebyshev polynomial, which can correct for systematic issues in the flux calibration, although we found the applied correction to be small in the case of GN-8-LAE. We also allow for a multiplicative factor on the spectroscopic errors to correct for underestimated uncertainties. These new parameters are fitted simultaneously to the rest of the physical parameters.
The best-fit results are shown in Table 2, assuming a delayed exponential star formation history (see Schaerer et al., 2024). They indicate that GN-8-LAE has a low stellar mass (), is extremely young (best-fit age of Myr), and has low dust extinction (). The metallicity we retrieve is approximately 1/5th solar (). Finally, the ionization parameter is elevated, with .
3.3 UV magnitude and slope from the NIRSpec spectrum
We measure an UV-magnitude of at and UV -slope (using the best-fit continuum and the definition by Calzetti et al., 1994). This places GN-8-LAE close to the typical at (e.g., Bouwens et al., 2021; Donnan et al., 2023), making GN-8-LAE relatively bright compared to similar LAEs (e.g., Saxena et al., 2023). Additionally, we retrieve the values for and UV slope from NIRCam+HST photometry. We recover and . The agreement in ensures that there is no significant systematic offset between photometry and spectrum (e.g., due uncertainties in path-loss corrections Kokorev et al., 2023). The departure in the values can be explained by the photometry being affected by strong UV emission lines.
When comparing to the median value of high- LAEs and SFGs samples studied using JWST (Table 5, Kumari et al., 2024; Morishita et al., 2024; Iani et al., 2024b) or the general population of galaxies (Bouwens et al., 2009), GN-8-LAE shows a bluer UV -slope. Several studies link blue slopes (and absence of dust) to a enhanced (e.g., Chisholm et al., 2022).
As a sanity check, the values for spectroscopic redshift, and slope derived in our analysis are in good agreement with the ones reported by (Witstok et al., 2024a). Our slope is slightly bluer but in agreement within the errors (this discrepancy could be rooted in the different techniques we used to fit the FUV continuum). Our values for emission line fluxes are in good agreement with the ones reported in the JADES catalog (D’Eugenio et al., 2024). The measurements reported by Witstok et al. (2024a) for GN-8-LAEare systematically smaller when compared to the ones from JADEs and our study. This difference could be explained by the different extraction procedures used by Witstok et al. (2024a).
3.4 Basic physical properties from the NIRSpec spectrum
We estimate the color excess by inspecting the Balmer decrement between H and H (using theoretical values from Storey & Hummer, 1995). We use an SMC (Gordon et al., 2003) extinction law for all our measurements. Accordingly, we recover a color excess of . Together with the insights from the slope (Meurer et al., 1999) and BAGPIPES, all three estimators converge towards the low dust content of GN-8-LAE. This is in line with the results for strong Ly emitters in the literature (e.g., Rosani et al., 2020; Saxena et al., 2023). For all the reasons above, we do not apply any dust correction to line ratios, fluxes, or derived quantities in this paper.
Under the assumption that all emission lines originate from the reprocessing of ionizing photons from young, short-lived massive stars in the ISM of the galaxy (see Sect. 3.6), it is possible to estimate the instantaneous star formation rate (in the past Myr) from the luminosity of Balmer lines (Kennicutt, 1998; Rinaldi et al., 2023) after taking into account the Kroupa (2001) IMF we use in this work.
As the PRISM spectrum does not cover H we derive the SFR from the H flux instead, by applying the relations by Storey & Hummer (1995). By doing so, we retrieve , which in turn corresponds to , where the error incorporates in quadrature the intrinsic scatter inherent to the Kennicutt (1998) calibration.
If deriving the SFR from FUV luminosity density (Kennicutt, 1998), the ratio takes the value . As discussed by Weisz et al. (2012); Faisst et al. (2019); Emami et al. (2019) and Navarro-Carrera et al. (in prep.), the ratio is a tracer of recent burstiness in the star formation history. Ratios indicate a very recent burst in star formation, produced not longer than Myr ago.
GN-8-LAEshows a well above unity. This is in agreement with predictions from simulations (Sparre et al., 2017; Ceverino et al., 2018) and observations (Navarro-Carrera et al., in prep.), where low-mass galaxies are expected to show increasingly bursty SFHs and, thus, populate the starburst cloud (Rinaldi et al., 2024b). The expected light-weighted age for GN-8-LAEis extremely young: Myr.
The specific star formation rate (sSFR) of GN-8-LAE is . Following the criterion from Caputi et al. (2017, 2021), GN-8-LAE is classified as a starburst (SB) galaxy, as .
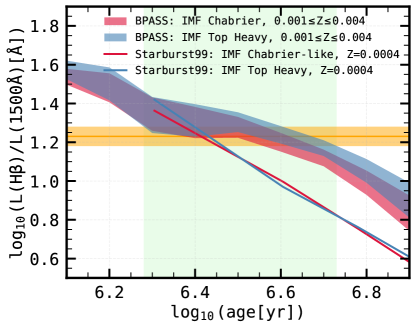
By further exploring the relation between the Balmer lines and the UV luminosity density it is possible to estimate a value for the light-weighted age, under the assumption of GN-8-LAE being a star-forming galaxy. We explore the evolution of stellar tracks from Starbust99 (Leitherer et al., 1999) and BPASS (v2.2.1 Eldridge et al., 2017; Stanway & Eldridge, 2018) for Chabrier-like and top-heavy IMFs (the uncertainty on our measurements is much larger than the one produced by the choice of IMF). We then explore the time-evolution of the ratio between and . We refer the reader to Iani et al. (2022b) for an in-depth discussion of the methodology. For GN-8-LAE we found a light-weighted age in the range of Myr, as shown in Fig. 2.
All properties are in line with the ones obtained in the analysis by Witstok et al. (2024a). We infer lower dust content and slightly higher instantaneous SFR (both compatible within the uncertainty).
Having reviewed the basic properties of GN-8-LAE, in the following sections, we will overview in more detail our derivations for gas-phase metallicity, ionization source, and C and N abundances.
3.5 Auroral line determination of electron temperature, and gas-phase metallicity
| Calibration | Reference | |
|---|---|---|
| Direct | I06a | |
| C3O3 | M22b | |
| EWCIII | M22b | |
| R23 | S24c | |
| O3 | S24c |
By following Proxauf et al. (2014), we constrain the (hereafter ) of the ionized gas thanks to the presence of the auroral [O iii] 4363 line (ruled by collisional excitation). In particular, we use the ratio ([O iii] 4958,5007)/[O iii] 4363, which is monotonically correlated to . For GN-8-LAE, we report .
We use a variety of UV and optical calibrations for determining the gas-phase metallicity of GN-8-LAE, together with the estimation from the direct () method (Sanders et al., 2024; Izotov et al., 2006). For the so-called direct method, we consider that by assuming the rest of higher ionization terms to be negligible (Sanders et al., 2024). We use the calibrations from Izotov et al. (2006) to derive and . The term directly depends on the [O ii] 3727/H ratio, for which we have only an upper limit. We report the derived metallicity as an interval.
All the values for metallicities are displayed in Table 4. We find an average value of or (Asplund et al., 2021) as an average between the two optical diagnostics and the direct method. The discrepancy between optical/direct metallicities and UV metallicities could be due to the strong dependence of UV lines on the ionization of the ISM (Maiolino & Mannucci, 2019).
| Galaxy | SFR | type | reference | |||||||
| (mag) | () | () | () | (pc) | ||||||
| GN-8-LAE | 8.279 | -19.6 | 7.66 | 11.3 | -2.73 | 203 | 7.85 | 140 | LAE & N-em | This Work |
| GN-z11 | 10.6 | -21.5 | 8.73 | 24 | -2.4 | 18 | 7.66 | LAE & N-em | Bunker et al. (2023) | |
| JADES-GS-z7-LA | 7.28 | -17.0 | 6.9 | 0.3-0.6 | -2.0 | 388 | (8.16) | - | LAE | Saxena et al. (2023) |
| COLA1 | 6.59 | -21.35 | 9.93 | 10.1 | (-3.2) | - | 7.88 | LAE | Torralba-Torregrosa et al. (2024) | |
| JADES LAEs | -19.00 | - | - | -2.34 | - | 7.50 | - | LAEs | Kumari et al. (2024) | |
| JADES SFGs | -19.08 | - | - | -2.26 | - | 7.73 | - | SFGs | Kumari et al. (2024) | |
| NIRSPec SFGs | -19.25 | 8.48 | 3.86 | -2.23 | - | - | 309 | SFGs | Morishita et al. (2024) | |
| GS-z14-0 | 14.3 | -20.81 | 8.7 | 22 | -2.20 | - | (7.11) | 260 | SFG | Carniani et al. (2024) |
| GS-z14-1 | 13.9 | -19.00 | 8.0 | 2 | -2.71 | - | (7.69) | SFG | Carniani et al. (2024) | |
| GHz2 | 13.9 | -20.53 | 9.05 | 5.2 | -2.46 | - | 7.26 | 105 | SFG | Castellano et al. (2024) |
| GN-z9p4 | 9.4 | -21.00 | 8.7 | 64 | - | - | 7.37 | N-em | Schaerer et al. (2024) | |
| RXCJ2248 | 8.05 | -20 | 8.05 | 63 | -2.72 | - | 7.43 | N-em | Topping et al. (2024) |
By inspecting Table 5, GN-8-LAE is slightly more metal-rich when compared to typical LAEs or N-emitters at similar redshifts (Kumari et al., 2024; Schaerer et al., 2024; Topping et al., 2024). However, we find it consistent with the SFGs population (Kumari et al., 2024) and with the expectations from the mass-metallicity relation (MZR, although slightly above the median trend reported by Curti et al., 2024).
3.6 The ionization source
The presence of UV emission lines is usually associated with hard ionization fields and ionization parameters in the range 111 is defined as the ratio between the number density of ionizing photons and the number density of hydrogen atoms (e.g., Osterbrock & Ferland, 2006), coupled with relatively low gas-phase metallicity () (Jaskot & Ravindranath, 2016; Mingozzi et al., 2024). The presence of strong high-ionization lines such as C iv] 1548,1550 in the spectrum of GN-8-LAE (highly likely from nebular origin) strengthens this idea.
The [O iii] 5007/[O ii] 3727 ratios probe intermediate-ionization regions. By using UV diagnostics calibrated for these regions (Mingozzi et al., 2022), we get from (C iv] 1549), and from C iv] 1548/C iii] 1907. These values are compatible with the one derived in the spectro-photometric SED fit (Sect. 3.2). When compared to the median values of of high-z SFGs ( Reddy et al., 2023a, b), GN-8-LAE shows an enhanced , more in line with the results of Williams et al. (2023) for an ultra-compact, magnified galaxy at .
We discard the presence of a Type I Active Galactic Nucleus (AGN) (McCarthy, 1993; Ramos Almeida et al., 2011), as no evidence of broadening or wings has been found for GN-8-LAE. This is true for both the prism and grating spectra, with essentially all lines being unresolved ( km/s). The average measured line width for the G395M/F290LP spectrum (the one with more detected lines) is km/s. Moreover, no X-ray detection in the vicinity of GN-8-LAE is reported within the 2 Ms Chandra Deep Field-North Survey catalog (Xue et al., 2016). However, we discuss the possibility of a Type II AGN in the following paragraphs.
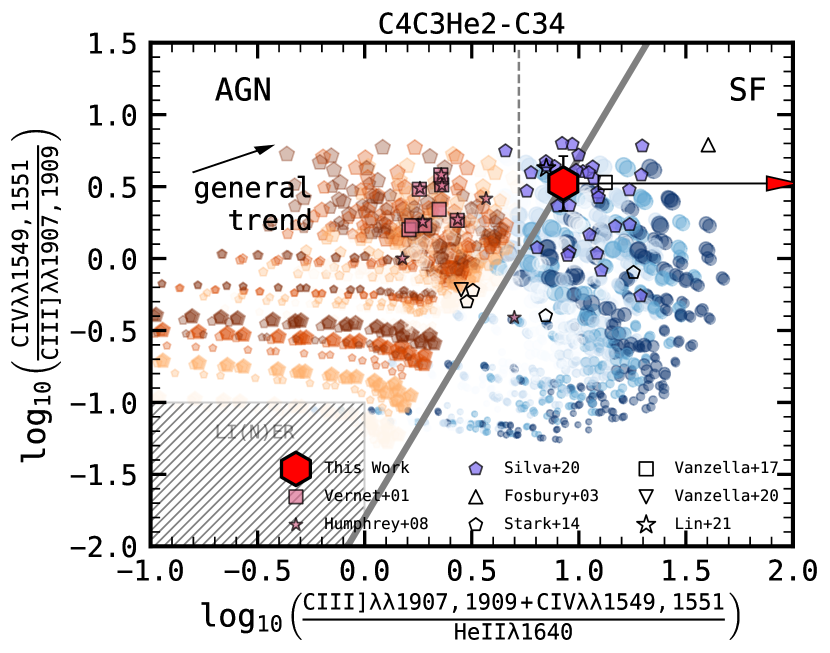
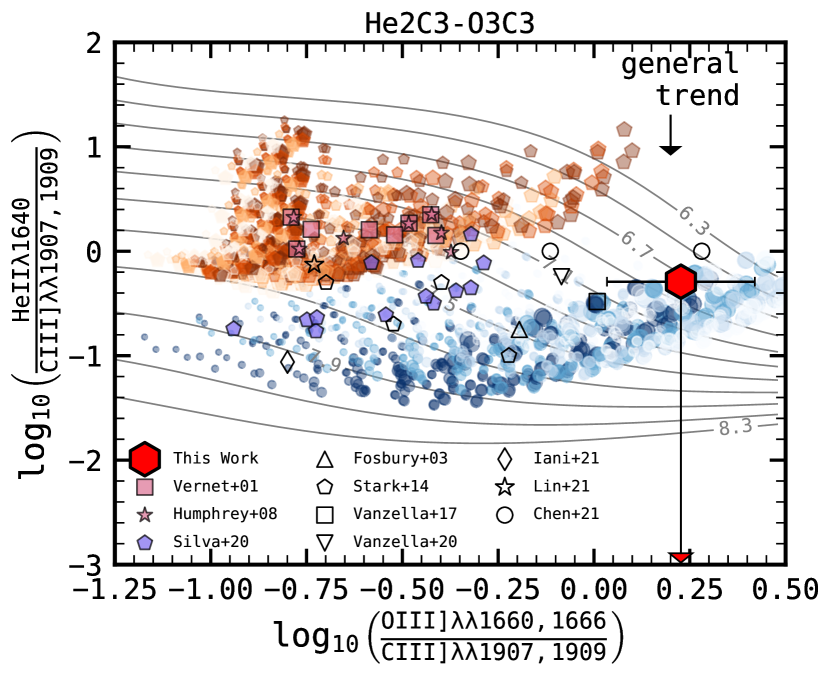
Several UV diagnostics have been proposed to discriminate between SF or AGN-dominated galaxies. In Fig. 3 we show two diagnostics adapted from Iani et al. (2022a)—namely C4C3-C34 and C3He2-O3C3 (e.g. Nakajima et al., 2018; Hirschmann et al., 2019; Byler et al., 2020). We overlay photoionization models for nebular emission in SFGs (as blue hexagons, Gutkin et al., 2016, G16) and AGN (red pentagons, Feltre et al., 2016, F16). We limit the models to subsolar metallicities ().
GN-8-LAE falls in the SF region for C4C3He2–C34 and He2C3-O3C3 (see Fig. 3), in particular, the one with the highest ionization parameter. However, it does it only marginally in the case of C4C3He2–C4C3 and also when putting it in the context of the mass-excitation diagram (MEX, Juneau et al., 2014). We also find GN-8-LAE to be compatible with SF galaxies with the highest by using the O3H /O33 diagnostic (Mazzolari et al., 2024).
In light of these results, the ionizing radiation in GN-8-LAE probably originated from a population of young, massive stars, rather than AGN. However, a contribution of AGN, shocks, and SF (so-called composite Hirschmann et al., 2019) can not be completely ruled out.
3.7 C/O abundance
Following Pérez-Montero & Amorín (2017), we estimate the C/O abundance from the ratio between (C III] + C IV) and O III]) (see also Berg et al., 2016). We estimate a , i.e. almost half of the solar value ([C/O], Gutkin et al., 2016).
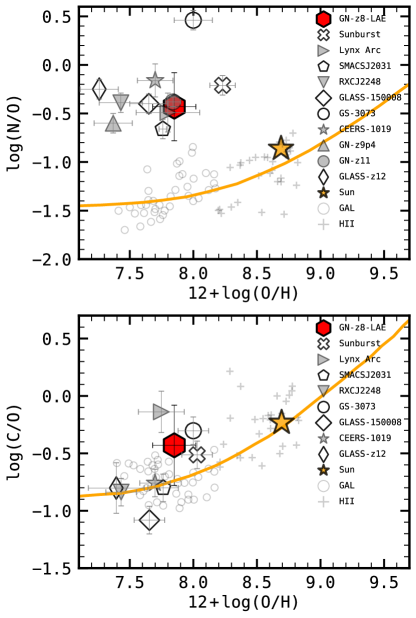
The value we retrieved is in agreement with those of local, metal-poor dwarf galaxies (Berg et al., 2019) and with young low-mass and low-luminosity galaxies at intermediate redshift () (e.g., Erb et al., 2010; Stark et al., 2014). Our target metallicity estimate (12 + ) is in agreement with the (C/O) - metallicity trend reported by (Garnett et al., 1995; Nicholls et al., 2017).
3.8 The N iii] 1749-1753 complex
Several high- N-emitter galaxies have been found very recently using JWST/NIRSpec: GHZ2/GLASS-z12 (Castellano et al., 2024), GN-z11 (Bunker et al., 2024; Cameron et al., 2023; Senchyna et al., 2024), GN-z9p4 (Schaerer et al., 2024), GLASS-150008 (Isobe et al., 2023), CEERS-1019 (Marques-Chaves et al., 2024), RXCJ2248-4431 (Topping et al., 2024) and GS-3073 (Ji et al., 2024).
As reported in Table 1, we find a N iii] 1749-1753 (blended complex of emission lines) detection in the PRISM spectrum of GN-8-LAE. This would position GN-8-LAE amongst the highest redshift N-emitter galaxies, and the only one with strong Ly emission. When inspecting the PRISM spectrum of GN-8-LAE we found a weak feature resembling an emission line in the expected position of N iv] 1486, however, it is not possible to constrain it further due to its low signal-to-noise.
By using the relations from (Villar-Martín et al., 2004; Aller, 1984), we derived directly from our measurement of N iii] 1749-1753/H . As we do not have any detection of higher ionization N lines (N iv] 1486), we use the relations by Hamann et al. (2002) for the metallicity of GN-8-LAE to predict the N iv] 1486 flux from our C iv] 1548,1550 measurement. This allows us to determine . The total Nitrogen abundance is dominated by the contribution of the direct measurement of , so the assumptions behind the determination of could only further increase the Nitrogen abundance.
All in all, we derive an elevated, super-solar Nitrogen abundance of and, in turn, for GN-8-LAE. In particular, this ratio translates to approximately 2.8 times the solar ratio (Asplund et al., 2021). This is in line with other high- N-emitters compact SFGs, characterized by an N-enriched (with supersolar N abundances) and metal-poor (low-metallicity, O/H) ISM (Marques-Chaves et al., 2024).
As of today, no unique scenario exists to interpret the presence of N lines and reconcile the super-solar nitrogen abundance in metal-poor galaxies. Wolf-Rayet stars, very massive and supermassive stars (), a top-heavy IMF, and tidal disruption events have been suggested as mechanisms that could enhance the nitrogen abundance (see Schaerer et al., 2024, and references therein).
In the case of GN-8-LAE, the strong high-ionization lines, Ly and N iii] 1749-1753, seem to favor the scenario of a short burst of intense star formation in the present or past few million years (Topping et al., 2024). This is in agreement with our findings in Sec. 3.2 and 3.
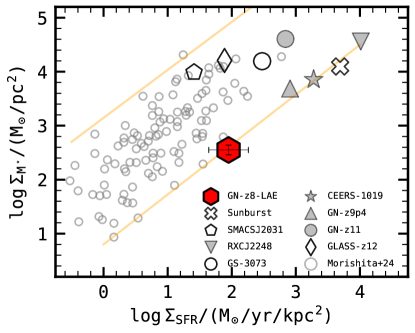
Taking advantage of the morphological properties we derived in 2, we can study the position of GN-8-LAE in the stellar mass surface density () - star formation surface density () plane, shown in Fig. 5. We report these results in Table 3, following Reddy et al. (2023a) and using the SFR derived from the Balmer lines and the stellar mass from the spectro-photometric fit reported in Table 2.
In Fig. 5 we include the compilation of spectroscopically confirmed SFGs at by (Morishita et al., 2024), and all the known Nitrogen emitters discovered with NIRSpec (see Sect. 3.8). From the position in this plane, GN-8-LAE shows a smaller stellar mass surface density compared to the rest of N-emitters, and is located in the extreme sSFR envelope of the SFG distribution (again, as several other N-emitters).
3.9 The Ly emission of JADES-GN-z8-LA
GN-8-LAE was selected as a strong Ly emitter, as can be seen in Fig. 1. We detect Ly in both prism and the G140M grating spectra with a signal-to-noise of approximately 12 in both cases.
We model the Ly line using an asymmetric profile as proposed by Shibuya et al. (2014). We report a flux of for the G140M grating. We also report a . Note that this value was derived using the prism spectrum, where the spectral continuum is detected.
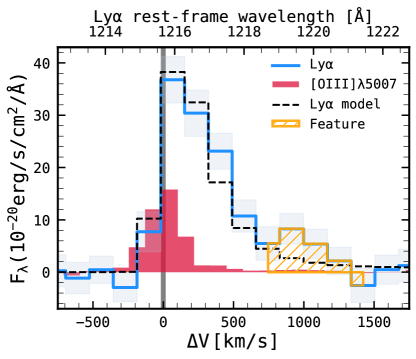
From the best-fit Ly model, we report a velocity offset of km/s with respect to the systemic velocity of the system. This value is small, within the line spread function of NIRSpec around (Saxena et al., 2023), but similar to the one reported by Saxena et al. (2024) for several LAEs and also compatible with values from the compilation of LAEs by Witstok et al. (2024b). The presence of Ly emission close (or at) the systemic velocity could indicate a low neutral hydrogen column density over the line-of-sight (LOS Kerutt et al., 2024).
The Ly line is not resolved in the prism spectrum, and we find a similar situation for the G140M grating (Fig. 6). We recover a best-fit line width comparable to the spread function (LSF), of .
The flux recovered from the prism spectrum is . This value is enhanced with respect to the model flux from the G140M grating. We explain this by the presence of a feature red-wise of the Ly line. This feature is blended with Ly for the prism observations, but can be resolved using the G140M grating, as shown in Fig. 6 (orange hatched area). We found several possible explanations for this feature assuming it is not a random fluctuation: 1. A broad red wing associated with the Ly line (Yang et al., 2014). 2. An effect of the OV]1218 emission line (Humphrey, 2019; Iani et al., 2022a). 3. An effect of Ly scattering.
Several arguments disfavor the possibility of the feature being OV]1218 emission. First of all, we find no evidence of the presence of the remaining component of the doublet O v] 1214,1218. OV]1214 is expected to be brighter than OV]1218 from models (Humphrey, 2019) and it is far enough from Ly to be resolved in the G140M spectrum. Perhaps more importantly, we found the line center associated with OV]1218 not to be in agreement with the systemic redshift of GN-8-LAE.
The specific shape of the Ly profile is expected to depend on the conditions of both intergalactic medium (IGM) and ISM (Blaizot et al., 2023; Witten et al., 2023, 2024). However, a detailed modeling of the Ly profile falls out of the scope of our analysis.
By comparing the ratio between the observed Ly flux, and Balmer lines to theoretical predictions, we can estimate the Ly escape fraction (although with caveats, see Choustikov et al., 2024b). We assume a Case B recombination and an electron density between 100 and 1000 and use the electron temperature derived in Sect. 3.5. Using PyNeb (Luridiana et al., 2015), we derive , for 100 and 1000 , respectively. By comparing this ratio with the one observed in GN-8-LAE we retrieve a . Any dust correction would shift towards higher values.
Our derived is in agreement with the one found by using indirect tracers (e.g., , and Sobral & Matthee, 2019). In particular, we employ the relation corrected for the ionizing photon production efficiency (see Sect. 4.3) and dust extinction from Sobral & Matthee (2019, Eq. 6) to retrieve . This value is compatible with the direct method estimations within the error bars.
4 GN-8-LAE as a LyC leaker
Young and star-forming galaxies such as GN-8-LAE are expected to produce a high number of ionizing photons, but only the ones that escape the galaxy (i.e., are not absorbed in ISM) effectively contribute towards the reionization of the universe (Chisholm et al., 2020). In particular, LyC leakers are defined by having a non-negligible escape of LyC photons.
Two scenarios for the escape of LyC photons have been proposed, even though low-mass/faint and star-forming galaxies are rich in neutral hydrogen, which is opaque to LyC radiation (e.g., Watts et al., 2021). The density-bounded medium scenario involves the presence of a low-column-density neutral hydrogen medium surrounding the sources of ionizing radiation. Some authors have suggested that it fails to reproduce spectral properties of LyC leakers (Ramambason et al., 2020).
The second scenario consists of the presence of an optically thick but porous medium, that does not completely cover all the sources of ionizing radiation (Zackrisson et al., 2013). Following Rivera-Thorsen et al. (2017), we divide this second scenario into two cases: one where the medium is clumpy and provides a multitude of clear LOS (picket fence model, Gronke & Dijkstra, 2016), another where there are only a few channels open for the LyC photons to escape (ionized channels model, Zackrisson et al., 2013). In principle, the Ly profile (shaped by the resonant interactions with the neutral hydrogen), could show evidence of these two different geometries (Rivera-Thorsen et al., 2017; Hutter et al., 2023, and references therein).
For a given galaxy, the number of ionizing (Lyman continuum, LyC) photons injected into the IGM per unit time can be expressed as
| (1) |
Where (escape fraction of ionizing photons) represents the fraction of LyC photons that escape the galaxy with respect to the total amount produced by the young stellar population (in the case of GN-8-LAE). In turn, (hydrogen ionizing photon production) can be understood as the number of hydrogen ionizing photons per unit of UV luminosity (e.g., Naidu et al., 2022; Lin et al., 2024), and is defined as:
| (2) |
From the above relations, it can be seen that is a key parameter to determine , and . However, the LyC emission can rarely be observed directly for galaxies, as the mean-free path for LyC photons decreases exponentially with redshift Inoue et al. (2014).
In the following sections, we will explore the possible contribution of galaxies like GN-8-LAE to the reionization of the Universe and, particularly, the possibility of GN-8-LAE efficiently injecting ionizing photons into the IGM.
4.1 Tracers of high LyC escape fraction
The literature has extensively explored the estimation of using different tracers and techniques. Most studies rely on small samples of spectroscopically confirmed LyC leakers low- analogs or simulations to predict whether a galaxy is a LyC leaker based on one or several of its observed properties.
Among the most relevant single-variable indicators for elevated LyC leakage, we find:
-
•
Properties of the Ly emission: Verhamme et al. (2017) found that LyC leakers preferently have Ly large rest-frame equivalent widths () and escape fractions ().
More recent studies (e.g., Naidu et al., 2022; Izotov et al., 2021, using low- analogs) suggest that leakers are characterized by a high , and more crucially, narrow Ly profiles close to the systemic velocity (low values of ). This would indicate a highly transparent IGM. Chisholm et al. (2018) provides a estimation for based on the dust-corrected . -
•
Dust content or slope: Several works suggest that LyC leakers are characterized by blue slopes and low dust content (Chisholm et al., 2022; Saldana-Lopez et al., 2022, for samples of low-z analogs). In particular, was found to correlate with several parameters apart from dust content, such as [O iii] 5007/[O ii] 3726,9 (O32) ratio, but also metallicity, , or stellar mass.
-
•
: Using the X-SHOOTER Lyman- survey (XLS-z2, Matthee et al., 2021) sample, Naidu et al. (2020) argue that intense and compact star formation (high ) might create the necessary conditions (ionized channels) that allow for an efficient escape of LyC (and Ly) photons (see Pucha et al., 2022; Trebitsch et al., 2017, would be a feedback-regulated process).
- •
-
•
Elevated O iii] 5007/[O ii] 3726,3729 (O32) ratio: Izotov et al. (2017); Flury et al. (2022) found evidence of a correlation between the O32 line ratio for samples of low- analogs (although this ratio depends strongly on the ionization parameter, Strom et al., 2018). More recent studies, however, seem to suggest O32 is not necessarily elevated for LyC leakers, or that the correlation is not so tight (Izotov et al., 2021).
- •
Several recent works propose the use of multi-variable tracers as LyC leakage predictors. Interestingly, large departures from single-variable estimates have been reported (e.g., Fig. 6 of Jaskot et al., 2024a, where several multi-variate models are compared with predictions from Chisholm et al., 2022). Among these models, we highlight:
-
•
Mascia et al. (2023a) studied a sample of high- galaxies from the GLASS survey (Treu et al., 2022), and used a sample of low redshift analogs (from the from the Low-redshift Lyman Continuum Surve, LzLCs Flury et al., 2022) to calibrate an empirical relation between observed properties and . The relation takes the shape: , thus their model relies on three parameters (previously identified as individual tracers: , and ) to identify LyC leakers.
- •
-
•
Jaskot et al. (2024b, a): use the LzLCs sample to build several predictors (using Cox proportional hazards models) with a broad range of observed parameters, then apply them to and samples. Models including dust attenuation (E(B-V) or ) and the O32 ratio or morphological measurements (, ) seem to be the best-performing to predict the for the sample.
| Reference | Method | |
| Chisholm et al. (2022) | ||
| Naidu et al. (2020) | ||
| Chisholm et al. (2018) | ||
| Schaerer et al. (2022) | C4C3a | |
| Mascia et al. (2023a) | , , | |
| Mascia et al. (2023b) | , , | |
| Jaskot et al. (2024b) ‘Top Three’ | E(B-V), , | |
| Jaskot et al. (2024b) ‘R50-’ | , , , | |
| Jaskot et al. (2024a) ‘Full JWST’ | , , , E(B-V), , | |
| , , | ||
| Lin et al. (2024) | ,O32, | leaker () |
4.2 Estimating the LyC leakage for GN-8-LAE
We now apply the previously defined criteria to GN-8-LAE. Notably, all single variable from the above requirements are satisfied: a narrow Ly which is close to () and has residual emission at the systemic velocity, low dust content () and blue slope (), is compact and has an elevated value of , presence of bright C iv and high C iv/C iii] ratio, an elevated O32 (upper limit, as [O ii] 3727,9 is not detected) and the presence of narrow Mg ii close to the systemic velocity. We report the results for all indicators in Table 6.
By applying the relations described in Chisholm et al. (2018, 2022); Naidu et al. (2020); Schaerer et al. (2022), we recover an escape fraction compatible with the leakage of LyC photons.
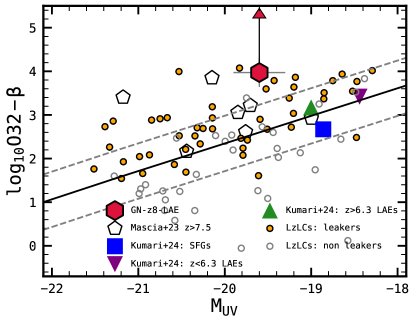
We now explore the multi-variate indicators. The relation by Mascia et al. (2023a) leads to an elevated lower limit of , due to the upper limit in the O32 ratio. A similar answer is found when using Lin et al. (2024). This is shown in Fig. 7, where GN-8-LAE is located well above the discontinuous line of probability of LyC leakage (this value is a lower limit, for the reasons above). Using their model, we recover a probability of of GN-8-LAE being a LyC leaker. Interestingly, the average values for LAEs/SFGs in JADES (Kumari et al., 2024) lie along/below the probability line, respectively. This indicates that LyC leakers are uncommon in their sample, while GN-8-LAE shows several qualities in this direction.
By exploring several of the best-performing models from Jaskot et al. (2024b, a), namely: Top Three, R50- and Full JWST models, we derive consistent multi-variable confirmation of the possible LyC nature of GN-8-LAE. Most observed properties, besides the ones concerning the Ly emission, were used in this series of models. All models coincide in assigning a low probability to , and predict mean values of .
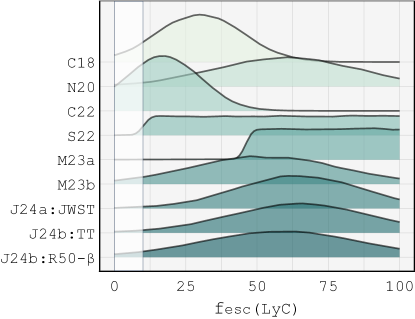
All this information is encoded in Fig. 8, which essentially displays the results of all indicators (Tabel 6). First of all, is clear that all indicators show evidence of an elevated LyC escape fraction (). Interestingly, multi-variable indicators (shown downwards in the figure) tend to predict consistently higher when compared to single-variable indicators. Similar effects have been also reported in the literature (e.g. Lin et al., 2024; Jaskot et al., 2024a).
Finally, we explored the predictions from the (minimal) model by Maji et al. (2022), calibrated using the Sphinx simulation post-processed using RASCAS (Michel-Dansac et al., 2020). However, in the case of GN-8-LAE, the model over-predicts the escape luminosity. This could be due to GN-8-LAE falling out of the SPHINX parameter space (e.g., and ).
If one message has to be conveyed from these analyses is that estimating with indirect methods is not straightforward. Moreover, calibrations using could be further affected by the complex physics ruing the properties of the Ly line (Choustikov et al., 2024a). Nonetheless, all calibrations and observed properties agree on GN-8-LAE having a , thus making it a strong Lyman continuum leaker candidate.
4.3 Hydrogen ionizing photon production efficiency
To make independent from the estimation of , which is indirect and uncertain for the vast majority of high- galaxies, we introduce the quantity (Lin et al., 2024).
In the case of GN-8-LAE, we report and assuming (the one recovered from the slope). This value of is elevated with respect to the sample of HAEs studied by Rinaldi et al. (2023) (). In turn, this one was already enhanced relative to the typical reported in the literature at lower redshifts (e.g., Lam et al., 2019). Our high value inferred for GN-8-LAE is however similar to that derived for the source studied by Álvarez Márquez et al. (2024).
By following the discussion in Rinaldi et al. (2024a) and Atek et al. (2024), the average product can be constrained from the progress of Cosmic Reionization. In the case of GN-8-LAE, this would impose an for , in agreement with what presented by Atek et al. (2024). In the light of our derivations of , we argue that GN-8-LAE is caught at the moment of being an efficient reionizer during the EoR.
5 Summary and Discussion
We conducted a detailed analysis of the spectroscopic and photometric properties of GN-8-LAE, a prominent Ly emitter at selected from the JADES GOODS-N program. Some of these properties were studied before by Witstok et al. (2024a), with their derived parameter values being in broad agreement with ours in most cases. One notable exception is the UV slope, though, for which we obtained a lower value () than Witstok et al. (2024a), albeit consistent within the error bars. The reason for this departure might stem from the fact that we used the best-fit FUV continuum to determine , while Witstok et al. (2024a) made use of the masked spectrum. Remarkably, GN-8-LAE is a low stellar-mass galaxy (), contrary to the vast majority of Ly emitters known at , which are typically significantly more luminous and massive.
Although GN-8-LAE is at too high a redshift to detect a significant amount of ionizing photons, we can conclude that this source is a robust candidate for a LyC leaker, namely an early reionizer. Indeed, our analysis of multiple indirect tracers univocally indicates that the of GN-8-LAE must be , i.e. well above the average threshold needed for galaxies to drive the reionization process (Atek et al., 2024). Particularly, GN-8-LAE is a strong CIV] emitter, as expected for LyC leakers (Schaerer et al., 2022).
We also reported the detection of the NIII] emission line complex in GN-8-LAE, which was not identified in previous studies of this source. Very recently, NIII] was discovered in a handful of high- galaxies (e.g., Marques-Chaves et al., 2024; Schaerer et al., 2024), but our source is the first reported case of simultaneous NIII] and Ly emission at the EoR. As in Schaerer et al. (2024), our measured NIII] flux implies a supra-solar N abundance, which is at odds with the sub-solar metallicity derived for our target.
The exact origin of the NIII] is unclear, but Schaerer et al. (2024) suggested that there could be a link between this emission and extremely high values of and . This is confirmed for our source, which has and and, thus, is placed on the - surface density relation derived by Morishita et al. (2024), along with other extreme density sources like previously found N-emitters. The NIII] could also be associated with the presence of Wolf-Rayet stars injecting N to the ISM (Rivera-Thorsen et al., 2024), but in this case we would also expect to see the permitted NIII lines and broadened HeII emission, which we do not detect in GN-8-LAE.
In summary, GN-8-LAE is, to our knowledge, the most robust candidate found to date for a source being caught at the moment of reionizing its surrounding medium. Which physical processes could lead to the properties observed in GN-8-LAE? Based on magnetohydrodynamical galaxy simulations, Witten et al. (2024) concluded that prominent Ly emission at the EoR could be explained via galaxy mergers inducing vigorous star formation. This remains to be investigated from the observational point of view. Further JWST observations should allow us to find more sources like GN-8-LAE in the early Universe and thoroughly study their properties, eventually leading to the unlock of the process of reionization.
6 ACKNOWLEDGMENTS
We thank Pratika Dayal for their useful discussions. RN and KIC acknowledge funding from the Dutch Research Council (NWO) through the award of the Vici Grant VI.C.212.036. E.I. and P.R. acknowledge funding from the Netherlands Research School for Astronomy (NOVA). This work is based on observations made with the NASA/ESA/CSA James Webb Space Telescope. The data were obtained from the Mikulski Archive for Space Telescopes at the Space Telescope Science Institute, which is operated by the Association of Universities for Research in Astronomy, Inc., under NASA contract NAS 5-03127 for JWST. These observations are associated with JWST programs GTO #1180, GO #1210, GO #1963 and GO #1895. The authors acknowledge the team led by coPIs D. Eisenstein and N. Luetzgendorf for developing their respective observing programs with a zero-exclusive-access period. Also based on observations made with the NASA/ESA Hubble Space Telescope obtained from the Space Telescope Science Institute, which is operated by the Association of Universities for Research in Astronomy, Inc., under NASA contract NAS 526555.
Software: AstroPy (Collaboration et al., 2022), BAGPIPES (Carnall et al., 2019a), dustmaps (Green, 2018), Matplotlib (Hunter, 2007), NumPy (Harris et al., 2020), Photutils (Bradley et al., 2022), Python (van Rossum, 1995), SciPy (Virtanen et al., 2020), TOPCAT (Taylor, 2017), WebbPSF (Perrin et al., 2014).
Facilities: HST, JWST
References
- Akerman et al. (2004) Akerman, C. J., Carigi, L., Nissen, P. E., Pettini, M., & Asplund, M. 2004, Astronomy and Astrophysics, 414, 931, doi: 10.1051/0004-6361:20034188
- Aller (1984) Aller, L. H. 1984, Astrophysics and Space Science Library, doi: 10.1007/978-94-010-9639-3
- Asplund et al. (2021) Asplund, M., Amarsi, A. M., & Grevesse, N. 2021, Astronomy and Astrophysics, 653, A141, doi: 10.1051/0004-6361/202140445
- Atek et al. (2024) Atek, H., Labbé, I., Furtak, L. J., et al. 2024, Nature, 626, 975, doi: 10.1038/s41586-024-07043-6
- Berg et al. (2019) Berg, D. A., Erb, D. K., Henry, R. B. C., Skillman, E. D., & McQuinn, K. B. W. 2019, The Astrophysical Journal, 874, 93, doi: 10.3847/1538-4357/ab020a
- Berg et al. (2016) Berg, D. A., Skillman, E. D., Henry, R. B. C., Erb, D. K., & Carigi, L. 2016, The Astrophysical Journal, 827, 126, doi: 10.3847/0004-637X/827/2/126
- Blaizot et al. (2023) Blaizot, J., Garel, T., Verhamme, A., et al. 2023, Monthly Notices of the Royal Astronomical Society, 523, 3749, doi: 10.1093/mnras/stad1523
- Bosman et al. (2022) Bosman, S. E. I., Davies, F. B., Becker, G. D., et al. 2022, Monthly Notices of the Royal Astronomical Society, 514, 55, doi: 10.1093/mnras/stac1046
- Bouwens et al. (2009) Bouwens, R. J., Illingworth, G. D., Franx, M., et al. 2009, The Astrophysical Journal, 705, 936, doi: 10.1088/0004-637X/705/1/936
- Bouwens et al. (2021) Bouwens, R. J., Oesch, P. A., Stefanon, M., et al. 2021, The Astronomical Journal, 162, 47, doi: 10.3847/1538-3881/abf83e
- Bradley et al. (2022) Bradley, L., Sipőcz, B., Robitaille, T., et al. 2022, doi: 10.5281/ZENODO.7419741
- Brammer (2023) Brammer, G. 2023, Zenodo, doi: 10.5281/zenodo.7299500
- Bruzual & Charlot (2003) Bruzual, G., & Charlot, S. 2003, Monthly Notices of the Royal Astronomical Society, 344, 1000, doi: 10.1046/j.1365-8711.2003.06897.x
- Bunker et al. (2023) Bunker, A. J., Saxena, A., Cameron, A. J., et al. 2023, Astronomy and Astrophysics, 677, A88, doi: 10.1051/0004-6361/202346159
- Bunker et al. (2024) Bunker, A. J., Cameron, A. J., Curtis-Lake, E., et al. 2024, JADES NIRSpec Initial Data Release for the Hubble Ultra Deep Field: Redshifts and Line Fluxes of Distant Galaxies from the Deepest JWST Cycle 1 NIRSpec Multi-Object Spectroscopy, arXiv, doi: 10.48550/arXiv.2306.02467
- Byler et al. (2020) Byler, N., Kewley, L. J., Rigby, J. R., et al. 2020, The Astrophysical Journal, 893, 1, doi: 10.3847/1538-4357/ab7ea9
- Calzetti et al. (1994) Calzetti, D., Kinney, A. L., & Storchi-Bergmann, T. 1994, The Astrophysical Journal, 429, 582, doi: 10.1086/174346
- Cameron et al. (2023) Cameron, A. J., Saxena, A., Bunker, A. J., et al. 2023, Astronomy & Astrophysics, 677, A115, doi: 10.1051/0004-6361/202346107
- Caputi et al. (2017) Caputi, K. I., Deshmukh, S., Ashby, M. L. N., et al. 2017, The Astrophysical Journal, 849, 45, doi: 10.3847/1538-4357/aa901e
- Caputi et al. (2021) Caputi, K. I., Caminha, G. B., Fujimoto, S., et al. 2021, The Astrophysical Journal, 908, 146, doi: 10.3847/1538-4357/abd4d0
- Caputi et al. (2024) Caputi, K. I., Rinaldi, P., Iani, E., et al. 2024, The Astrophysical Journal, 969, 159, doi: 10.3847/1538-4357/ad4eb2
- Carnall et al. (2019a) Carnall, A. C., Leja, J., Johnson, B. D., et al. 2019a, The Astrophysical Journal, 873, 44, doi: 10.3847/1538-4357/ab04a2
- Carnall et al. (2019b) Carnall, A. C., McLure, R. J., Dunlop, J. S., et al. 2019b, Monthly Notices of the Royal Astronomical Society, 490, 417, doi: 10.1093/mnras/stz2544
- Carniani et al. (2024) Carniani, S., Hainline, K., D’Eugenio, F., et al. 2024, A shining cosmic dawn: spectroscopic confirmation of two luminous galaxies at $z\sim14$, doi: 10.48550/arXiv.2405.18485
- Caruana et al. (2014) Caruana, J., Bunker, A. J., Wilkins, S. M., et al. 2014, Monthly Notices of the Royal Astronomical Society, 443, 2831, doi: 10.1093/mnras/stu1341
- Castellano et al. (2024) Castellano, M., Napolitano, L., Fontana, A., et al. 2024, JWST NIRSpec Spectroscopy of the Remarkable Bright Galaxy GHZ2/GLASS-z12 at Redshift 12.34, doi: 10.48550/arXiv.2403.10238
- Ceverino et al. (2018) Ceverino, D., Klessen, R. S., & Glover, S. C. O. 2018, Monthly Notices of the Royal Astronomical Society, 480, 4842, doi: 10.1093/mnras/sty2124
- Chisholm et al. (2020) Chisholm, J., Prochaska, J. X., Schaerer, D., Gazagnes, S., & Henry, A. 2020, Monthly Notices of the Royal Astronomical Society, 498, 2554, doi: 10.1093/mnras/staa2470
- Chisholm et al. (2018) Chisholm, J., Gazagnes, S., Schaerer, D., et al. 2018, Astronomy & Astrophysics, 616, A30, doi: 10.1051/0004-6361/201832758
- Chisholm et al. (2022) Chisholm, J., Saldana-Lopez, A., Flury, S., et al. 2022, Monthly Notices of the Royal Astronomical Society, 517, 5104, doi: 10.1093/mnras/stac2874
- Choustikov et al. (2024a) Choustikov, N., Stiskalek, R., Saxena, A., et al. 2024a, Inferring the Ionizing Photon Contributions of High-Redshift Galaxies to Reionization with JWST NIRCam Photometry, arXiv. http://arxiv.org/abs/2405.09720
- Choustikov et al. (2024b) Choustikov, N., Katz, H., Saxena, A., et al. 2024b, Monthly Notices of the Royal Astronomical Society, 529, 3751, doi: 10.1093/mnras/stae776
- Collaboration et al. (2022) Collaboration, T. A. T. A., Price-Whelan, A. M., Lim, P. L., et al. 2022, doi: 10.3847/1538-4357/ac7c74
- Curti et al. (2024) Curti, M., Maiolino, R., Curtis-Lake, E., et al. 2024, Astronomy & Astrophysics, 684, A75, doi: 10.1051/0004-6361/202346698
- Dayal & Ferrara (2018) Dayal, P., & Ferrara, A. 2018, Physics Reports, 780, 1, doi: 10.1016/j.physrep.2018.10.002
- D’Eugenio et al. (2024) D’Eugenio, F., Cameron, A. J., Scholtz, J., et al. 2024, JADES Data Release 3 – NIRSpec/MSA spectroscopy for 4,000 galaxies in the GOODS fields, doi: 10.48550/arXiv.2404.06531
- Donnan et al. (2023) Donnan, C. T., McLeod, D. J., Dunlop, J. S., et al. 2023, Monthly Notices of the Royal Astronomical Society, 518, 6011, doi: 10.1093/mnras/stac3472
- Dopita et al. (2006) Dopita, M. A., Fischera, J., Sutherland, R. S., et al. 2006, The Astrophysical Journal Supplement Series, 167, 177, doi: 10.1086/508261
- Eisenstein et al. (2023a) Eisenstein, D. J., Johnson, B. D., Robertson, B., et al. 2023a, arXiv e-prints, arXiv:2310.12340, doi: 10.48550/arXiv.2310.12340
- Eisenstein et al. (2023b) Eisenstein, D. J., Willott, C., Alberts, S., et al. 2023b, Overview of the JWST Advanced Deep Extragalactic Survey (JADES), doi: 10.48550/arXiv.2306.02465
- Eldridge et al. (2017) Eldridge, J. J., Stanway, E. R., Xiao, L., et al. 2017, Publications of the Astronomical Society of Australia, 34, e058, doi: 10.1017/pasa.2017.51
- Emami et al. (2019) Emami, N., Siana, B., Weisz, D. R., et al. 2019, The Astrophysical Journal, 881, 71, doi: 10.3847/1538-4357/ab211a
- Endsley et al. (2023) Endsley, R., Stark, D. P., Whitler, L., et al. 2023, Monthly Notices of the Royal Astronomical Society, 524, 2312, doi: 10.1093/mnras/stad1919
- Erb et al. (2010) Erb, D. K., Pettini, M., Shapley, A. E., et al. 2010, The Astrophysical Journal, 719, 1168, doi: 10.1088/0004-637X/719/2/1168
- Faisst et al. (2019) Faisst, A. L., Capak, P. L., Emami, N., Tacchella, S., & Larson, K. L. 2019, The Astrophysical Journal, 884, 133, doi: 10.3847/1538-4357/ab425b
- Feltre et al. (2016) Feltre, A., Charlot, S., & Gutkin, J. 2016, Monthly Notices of the Royal Astronomical Society, 456, 3354, doi: 10.1093/mnras/stv2794
- Ferland et al. (2013) Ferland, G. J., Porter, R. L., van Hoof, P. A. M., et al. 2013, Revista Mexicana de Astronomia y Astrofisica, 49, 137, doi: 10.48550/arXiv.1302.4485
- Flury et al. (2022) Flury, S. R., Jaskot, A. E., Ferguson, H. C., et al. 2022, The Astrophysical Journal, 930, 126, doi: 10.3847/1538-4357/ac61e4
- Fontana et al. (2010) Fontana, A., Vanzella, E., Pentericci, L., et al. 2010, The Astrophysical Journal, 725, L205, doi: 10.1088/2041-8205/725/2/L205
- Gardner et al. (2023) Gardner, J. P., Mather, J. C., Abbott, R., et al. 2023, Publications of the Astronomical Society of the Pacific, 135, 068001, doi: 10.1088/1538-3873/acd1b5
- Garnett et al. (1995) Garnett, D. R., Skillman, E. D., Dufour, R. J., et al. 1995, The Astrophysical Journal, 443, 64, doi: 10.1086/175503
- Geda et al. (2022) Geda, R., Crawford, S. M., Hunt, L., et al. 2022, The Astronomical Journal, 163, 202, doi: 10.3847/1538-3881/ac5908
- Gordon et al. (2003) Gordon, K. D., Clayton, G. C., Misselt, K. A., Landolt, A. U., & Wolff, M. J. 2003, The Astrophysical Journal, 594, 279, doi: 10.1086/376774
- Green (2018) Green, G. M. 2018, Journal of Open Source Software, 3, 695, doi: 10.21105/joss.00695
- Gronke & Dijkstra (2016) Gronke, M., & Dijkstra, M. 2016, The Astrophysical Journal, 826, 14, doi: 10.3847/0004-637X/826/1/14
- Gutkin et al. (2016) Gutkin, J., Charlot, S., & Bruzual, G. 2016, Monthly Notices of the Royal Astronomical Society, 462, 1757, doi: 10.1093/mnras/stw1716
- Hainline et al. (2024) Hainline, K. N., Johnson, B. D., Robertson, B., et al. 2024, The Astrophysical Journal, 964, 71, doi: 10.3847/1538-4357/ad1ee4
- Hamann et al. (2002) Hamann, F., Korista, K. T., Ferland, G. J., Warner, C., & Baldwin, J. 2002, The Astrophysical Journal, 564, 592, doi: 10.1086/324289
- Harikane et al. (2024) Harikane, Y., Inoue, A. K., Ellis, R. S., et al. 2024, JWST, ALMA, and Keck Spectroscopic Constraints on the UV Luminosity Functions at z~7-14: Clumpiness and Compactness of the Brightest Galaxies in the Early Universe, doi: 10.48550/arXiv.2406.18352
- Harris et al. (2020) Harris, C. R., Millman, K. J., Walt, S. J. v. d., et al. 2020, Nature, 585, 357, doi: 10.1038/s41586-020-2649-2
- Henry et al. (2000) Henry, R. B. C., Edmunds, M. G., & Köppen, J. 2000, The Astrophysical Journal, 541, 660, doi: 10.1086/309471
- Hirschmann et al. (2019) Hirschmann, M., Charlot, S., Feltre, A., et al. 2019, Monthly Notices of the Royal Astronomical Society, 487, 333, doi: 10.1093/mnras/stz1256
- Humphrey (2019) Humphrey, A. 2019, Monthly Notices of the Royal Astronomical Society, 486, 2102, doi: 10.1093/mnras/stz687
- Hunter (2007) Hunter, J. D. 2007, Computing in Science & Engineering, 9, 90, doi: 10.1109/MCSE.2007.55
- Hutter et al. (2023) Hutter, A., Trebitsch, M., Dayal, P., et al. 2023, Monthly Notices of the Royal Astronomical Society, 524, 6124, doi: 10.1093/mnras/stad2230
- Iani et al. (2022a) Iani, E., Caputi, K. I., Rinaldi, P., & Kokorev, V. I. 2022a, The Astrophysical Journal Letters, 940, L24, doi: 10.3847/2041-8213/aca014
- Iani et al. (2022b) Iani, E., Zanella, A., Vernet, J., et al. 2022b, doi: 10.1093/mnras/stac3198
- Iani et al. (2024a) Iani, E., Caputi, K. I., Rinaldi, P., et al. 2024a, The Astrophysical Journal, 963, 97, doi: 10.3847/1538-4357/ad15f6
- Iani et al. (2024b) Iani, E., Rinaldi, P., Caputi, K. I., et al. 2024b, MIDIS: MIRI uncovers Virgil, an extended source at $z\simeq 6.6$ with the photometric properties of Little Red Dots, doi: 10.48550/arXiv.2406.18207
- Inoue et al. (2014) Inoue, A. K., Shimizu, I., Iwata, I., & Tanaka, M. 2014, Monthly Notices of the Royal Astronomical Society, 442, 1805, doi: 10.1093/mnras/stu936
- Isobe et al. (2023) Isobe, Y., Ouchi, M., Tominaga, N., et al. 2023, The Astrophysical Journal, 959, 100, doi: 10.3847/1538-4357/ad09be
- Izotov et al. (2022) Izotov, Y. I., Chisholm, J., Worseck, G., et al. 2022, Monthly Notices of the Royal Astronomical Society, 515, 2864, doi: 10.1093/mnras/stac1899
- Izotov et al. (2006) Izotov, Y. I., Stasińska, G., Meynet, G., Guseva, N. G., & Thuan, T. X. 2006, Astronomy & Astrophysics, 448, 955, doi: 10.1051/0004-6361:20053763
- Izotov et al. (2017) Izotov, Y. I., Thuan, T. X., & Guseva, N. G. 2017, Monthly Notices of the Royal Astronomical Society, 471, 548, doi: 10.1093/mnras/stx1629
- Izotov et al. (2021) Izotov, Y. I., Worseck, G., Schaerer, D., et al. 2021, Monthly Notices of the Royal Astronomical Society, 503, 1734, doi: 10.1093/mnras/stab612
- Izotov et al. (2018) —. 2018, Monthly Notices of the Royal Astronomical Society, 478, 4851, doi: 10.1093/mnras/sty1378
- Jaskot & Ravindranath (2016) Jaskot, A. E., & Ravindranath, S. 2016, The Astrophysical Journal, 833, 136, doi: 10.3847/1538-4357/833/2/136
- Jaskot et al. (2024a) Jaskot, A. E., Silveyra, A. C., Plantinga, A., et al. 2024a, Multivariate Predictors of LyC Escape II: Predicting LyC Escape Fractions for High-Redshift Galaxies, arXiv. http://arxiv.org/abs/2406.10179
- Jaskot et al. (2024b) —. 2024b, Multivariate Predictors of LyC Escape I: A Survival Analysis of the Low-redshift Lyman Continuum Survey, doi: 10.48550/arXiv.2406.10171
- Ji et al. (2024) Ji, X., Übler, H., Maiolino, R., et al. 2024, GA-NIFS: An extremely nitrogen-loud and chemically stratified galaxy at $z\sim 5.55$, doi: 10.48550/arXiv.2404.04148
- Juneau et al. (2014) Juneau, S., Bournaud, F., Charlot, S., et al. 2014, The Astrophysical Journal, 788, 88, doi: 10.1088/0004-637X/788/1/88
- Kennicutt (1998) Kennicutt, R. C. 1998, Annual Review of Astronomy and Astrophysics, 36, 189, doi: 10.1146/annurev.astro.36.1.189
- Kerutt et al. (2024) Kerutt, J., Oesch, P. A., Wisotzki, L., et al. 2024, Astronomy & Astrophysics, 684, A42, doi: 10.1051/0004-6361/202346656
- Kokorev et al. (2023) Kokorev, V., Fujimoto, S., Labbe, I., et al. 2023, The Astrophysical Journal, 957, L7, doi: 10.3847/2041-8213/ad037a
- Kroupa (2001) Kroupa, P. 2001, Monthly Notices of the Royal Astronomical Society, 322, 231, doi: 10.1046/j.1365-8711.2001.04022.x
- Kulkarni et al. (2019) Kulkarni, V. P., Cashman, F. H., Lopez, S., et al. 2019, The Astrophysical Journal, 886, 83, doi: 10.3847/1538-4357/ab4c2e
- Kumari et al. (2024) Kumari, N., Smit, R., Witstok, J., et al. 2024, JADES: Physical properties of Ly$\alpha$ and non-Ly$\alpha$ emitters at z ~ 4.8-9.6, arXiv, doi: 10.48550/arXiv.2406.11997
- Lam et al. (2019) Lam, D., Bouwens, R. J., Labbé, I., et al. 2019, Astronomy & Astrophysics, 627, A164, doi: 10.1051/0004-6361/201935227
- Leitherer et al. (1995) Leitherer, C., Ferguson, H. C., Heckman, T. M., & Lowenthal, J. D. 1995, The Astrophysical Journal, 454, L19, doi: 10.1086/309760
- Leitherer et al. (1999) Leitherer, C., Schaerer, D., Goldader, J. D., et al. 1999, The Astrophysical Journal Supplement Series, 123, 3, doi: 10.1086/313233
- Lin et al. (2024) Lin, Y.-H., Scarlata, C., Williams, H., et al. 2024, Monthly Notices of the Royal Astronomical Society, 527, 4173, doi: 10.1093/mnras/stad3483
- Luridiana et al. (2015) Luridiana, V., Morisset, C., & Shaw, R. A. 2015, Astronomy & Astrophysics, 573, A42, doi: 10.1051/0004-6361/201323152
- Maiolino & Mannucci (2019) Maiolino, R., & Mannucci, F. 2019, The Astronomy and Astrophysics Review, 27, 3, doi: 10.1007/s00159-018-0112-2
- Maji et al. (2022) Maji, M., Verhamme, A., Rosdahl, J., et al. 2022, Astronomy & Astrophysics, 663, A66, doi: 10.1051/0004-6361/202142740
- Marques-Chaves et al. (2024) Marques-Chaves, R., Schaerer, D., Kuruvanthodi, A., et al. 2024, Astronomy & Astrophysics, 681, A30, doi: 10.1051/0004-6361/202347411
- Mascia et al. (2023a) Mascia, S., Pentericci, L., Calabrò, A., et al. 2023a, Astronomy & Astrophysics, 672, A155, doi: 10.1051/0004-6361/202345866
- Mascia et al. (2023b) —. 2023b, New insight on the nature of cosmic reionizers from the CEERS survey, arXiv, doi: 10.48550/arXiv.2309.02219
- Matthee et al. (2023) Matthee, J., Mackenzie, R., Simcoe, R. A., et al. 2023, The Astrophysical Journal, 950, 67, doi: 10.3847/1538-4357/acc846
- Matthee et al. (2021) Matthee, J., Sobral, D., Hayes, M., et al. 2021, Monthly Notices of the Royal Astronomical Society, 505, 1382, doi: 10.1093/mnras/stab1304
- Mazzolari et al. (2024) Mazzolari, G., Übler, H., Maiolino, R., et al. 2024, New AGN diagnostic diagrams based on the [OIII]$\lambda 4363$ auroral line, arXiv, doi: 10.48550/arXiv.2404.10811
- McCarthy (1993) McCarthy, P. J. 1993, Annual Review of Astronomy and Astrophysics, 31, 639, doi: 10.1146/annurev.aa.31.090193.003231
- Meurer et al. (1999) Meurer, G. R., Heckman, T. M., & Calzetti, D. 1999, The Astrophysical Journal, 521, 64, doi: 10.1086/307523
- Meštrić et al. (2022) Meštrić, U., Vanzella, E., Zanella, A., et al. 2022, Monthly Notices of the Royal Astronomical Society, 516, 3532, doi: 10.1093/mnras/stac2309
- Michel-Dansac et al. (2020) Michel-Dansac, L., Blaizot, J., Garel, T., et al. 2020, Astronomy & Astrophysics, 635, A154, doi: 10.1051/0004-6361/201834961
- Mingozzi et al. (2022) Mingozzi, M., James, B. L., Arellano-Córdova, K. Z., et al. 2022, The Astrophysical Journal, 939, 110, doi: 10.3847/1538-4357/ac952c
- Mingozzi et al. (2024) Mingozzi, M., James, B. L., Berg, D. A., et al. 2024, The Astrophysical Journal, 962, 95, doi: 10.3847/1538-4357/ad1033
- Morishita et al. (2024) Morishita, T., Stiavelli, M., Chary, R.-R., et al. 2024, The Astrophysical Journal, 963, 9, doi: 10.3847/1538-4357/ad1404
- Naidu et al. (2020) Naidu, R. P., Tacchella, S., Mason, C. A., et al. 2020, The Astrophysical Journal, 892, 109, doi: 10.3847/1538-4357/ab7cc9
- Naidu et al. (2022) Naidu, R. P., Matthee, J., Oesch, P. A., et al. 2022, Monthly Notices of the Royal Astronomical Society, 510, 4582, doi: 10.1093/mnras/stab3601
- Nakajima & Ouchi (2014) Nakajima, K., & Ouchi, M. 2014, Monthly Notices of the Royal Astronomical Society, 442, 900, doi: 10.1093/mnras/stu902
- Nakajima et al. (2018) Nakajima, K., Schaerer, D., Le Fèvre, O., et al. 2018, Astronomy & Astrophysics, 612, A94, doi: 10.1051/0004-6361/201731935
- Navarro-Carrera et al. (2023) Navarro-Carrera, R., Rinaldi, P., Caputi, K. I., et al. 2023, Constraints on the Faint End of the Galaxy Stellar Mass Function at z ~ 4-8 from Deep JWST Data, arXiv, doi: 10.48550/arXiv.2305.16141
- Nicholls et al. (2017) Nicholls, D. C., Sutherland, R. S., Dopita, M. A., Kewley, L. J., & Groves, B. A. 2017, Monthly Notices of the Royal Astronomical Society, 466, 4403, doi: 10.1093/mnras/stw3235
- Oesch et al. (2023) Oesch, P. A., Brammer, G., Naidu, R. P., et al. 2023, The JWST FRESCO Survey: Legacy NIRCam/Grism Spectroscopy and Imaging in the two GOODS Fields, arXiv. http://arxiv.org/abs/2304.02026
- Osterbrock & Ferland (2006) Osterbrock, D. E., & Ferland, G. J. 2006, Astrophysics of gaseous nebulae and active galactic nuclei. https://ui.adsabs.harvard.edu/abs/2006agna.book.....O
- Ouchi et al. (2020) Ouchi, M., Ono, Y., & Shibuya, T. 2020, Annual Review of Astronomy and Astrophysics, 58, 617, doi: 10.1146/annurev-astro-032620-021859
- Pentericci et al. (2011) Pentericci, L., Fontana, A., Vanzella, E., et al. 2011, The Astrophysical Journal, 743, 132, doi: 10.1088/0004-637X/743/2/132
- Perrin et al. (2014) Perrin, M. D., Sivaramakrishnan, A., Lajoie, C.-P., et al. 2014, in Space Telescopes and Instrumentation 2014: Optical, Infrared, and Millimeter Wave, Vol. 9143 (SPIE), 1174–1184, doi: 10.1117/12.2056689
- Proxauf et al. (2014) Proxauf, B., Öttl, S., & Kimeswenger, S. 2014, Astronomy & Astrophysics, 561, A10, doi: 10.1051/0004-6361/201322581
- Pucha et al. (2022) Pucha, R., Reddy, N. A., Dey, A., et al. 2022, The Astronomical Journal, 164, 159, doi: 10.3847/1538-3881/ac83a9
- Pérez-Montero & Amorín (2017) Pérez-Montero, E., & Amorín, R. 2017, Monthly Notices of the Royal Astronomical Society, 467, 1287, doi: 10.1093/mnras/stx186
- Ramambason et al. (2020) Ramambason, L., Schaerer, D., Stasińska, G., et al. 2020, Astronomy & Astrophysics, 644, A21, doi: 10.1051/0004-6361/202038634
- Ramos Almeida et al. (2011) Ramos Almeida, C., Levenson, N. A., Alonso-Herrero, A., et al. 2011, The Astrophysical Journal, 731, 92, doi: 10.1088/0004-637X/731/2/92
- Reddy et al. (2023a) Reddy, N. A., Topping, M. W., Sanders, R. L., Shapley, A. E., & Brammer, G. 2023a, The Astrophysical Journal, 952, 167, doi: 10.3847/1538-4357/acd754
- Reddy et al. (2023b) Reddy, N. A., Sanders, R. L., Shapley, A. E., et al. 2023b, The Astrophysical Journal, 951, 56, doi: 10.3847/1538-4357/acd0b1
- Rinaldi et al. (2023) Rinaldi, P., Caputi, K. I., Costantin, L., et al. 2023, The Astrophysical Journal, 952, 143, doi: 10.3847/1538-4357/acdc27
- Rinaldi et al. (2024a) Rinaldi, P., Caputi, K. I., Iani, E., et al. 2024a, The Astrophysical Journal, 969, 12, doi: 10.3847/1538-4357/ad4147
- Rinaldi et al. (2024b) Rinaldi, P., Navarro-Carrera, R., Caputi, K. I., et al. 2024b, The emergence of the Star Formation Main Sequence with redshift unfolded by JWST, doi: 10.48550/arXiv.2406.13554
- Rivera-Thorsen et al. (2017) Rivera-Thorsen, T. E., Dahle, H., Gronke, M., et al. 2017, Astronomy & Astrophysics, 608, L4, doi: 10.1051/0004-6361/201732173
- Rivera-Thorsen et al. (2024) Rivera-Thorsen, T. E., Chisholm, J., Welch, B., et al. 2024, The Sunburst Arc with JWST: Detection of Wolf-Rayet stars injecting nitrogen into a low-metallicity, $z=2.37$ proto-globular cluster leaking ionizing photons, doi: 10.48550/arXiv.2404.08884
- Roberts-Borsani et al. (2016) Roberts-Borsani, G. W., Bouwens, R. J., Oesch, P. A., et al. 2016, The Astrophysical Journal, 823, 143, doi: 10.3847/0004-637X/823/2/143
- Robertson et al. (2015) Robertson, B. E., Ellis, R. S., Furlanetto, S. R., & Dunlop, J. S. 2015, The Astrophysical Journal, 802, L19, doi: 10.1088/2041-8205/802/2/L19
- Rosani et al. (2020) Rosani, G., Caminha, G. B., Caputi, K. I., & Deshmukh, S. 2020, Astronomy & Astrophysics, 633, A159, doi: 10.1051/0004-6361/201935782
- Rosdahl et al. (2018) Rosdahl, J., Katz, H., Blaizot, J., et al. 2018, Monthly Notices of the Royal Astronomical Society, 479, 994, doi: 10.1093/mnras/sty1655
- Saldana-Lopez et al. (2022) Saldana-Lopez, A., Schaerer, D., Chisholm, J., et al. 2022, Astronomy & Astrophysics, 663, A59, doi: 10.1051/0004-6361/202141864
- Sanders et al. (2024) Sanders, R. L., Shapley, A. E., Topping, M. W., Reddy, N. A., & Brammer, G. B. 2024, The Astrophysical Journal, 962, 24, doi: 10.3847/1538-4357/ad15fc
- Saxena et al. (2022) Saxena, A., Cryer, E., Ellis, R. S., et al. 2022, Monthly Notices of the Royal Astronomical Society, 517, 1098, doi: 10.1093/mnras/stac2742
- Saxena et al. (2023) Saxena, A., Robertson, B. E., Bunker, A. J., et al. 2023, Astronomy and Astrophysics, 678, A68, doi: 10.1051/0004-6361/202346245
- Saxena et al. (2024) Saxena, A., Bunker, A. J., Jones, G. C., et al. 2024, Astronomy & Astrophysics, 684, A84, doi: 10.1051/0004-6361/202347132
- Schaerer et al. (2024) Schaerer, D., Marques-Chaves, R., Xiao, M., & Korber, D. 2024, Discovery of a new N-emitter in the epoch of reionization, arXiv. http://arxiv.org/abs/2406.08408
- Schaerer et al. (2022) Schaerer, D., Izotov, Y. I., Worseck, G., et al. 2022, Astronomy & Astrophysics, 658, L11, doi: 10.1051/0004-6361/202243149
- Schenker et al. (2014) Schenker, M. A., Ellis, R. S., Konidaris, N. P., & Stark, D. P. 2014, The Astrophysical Journal, 795, 20, doi: 10.1088/0004-637X/795/1/20
- Senchyna et al. (2024) Senchyna, P., Plat, A., Stark, D. P., et al. 2024, The Astrophysical Journal, 966, 92, doi: 10.3847/1538-4357/ad235e
- Shibuya et al. (2014) Shibuya, T., Ouchi, M., Nakajima, K., et al. 2014, The Astrophysical Journal, 788, 74, doi: 10.1088/0004-637X/788/1/74
- Sobral & Matthee (2019) Sobral, D., & Matthee, J. 2019, Astronomy & Astrophysics, 623, A157, doi: 10.1051/0004-6361/201833075
- Sparre et al. (2017) Sparre, M., Hayward, C. C., Feldmann, R., et al. 2017, Monthly Notices of the Royal Astronomical Society, 466, 88, doi: 10.1093/mnras/stw3011
- Stanway & Eldridge (2018) Stanway, E. R., & Eldridge, J. J. 2018, Monthly Notices of the Royal Astronomical Society, 479, 75, doi: 10.1093/mnras/sty1353
- Stark et al. (2010) Stark, D. P., Ellis, R. S., Chiu, K., Ouchi, M., & Bunker, A. 2010, Monthly Notices of the Royal Astronomical Society, 408, 1628, doi: 10.1111/j.1365-2966.2010.17227.x
- Stark et al. (2014) Stark, D. P., Richard, J., Siana, B., et al. 2014, Monthly Notices of the Royal Astronomical Society, 445, 3200, doi: 10.1093/mnras/stu1618
- Stark et al. (2017) Stark, D. P., Ellis, R. S., Charlot, S., et al. 2017, Monthly Notices of the Royal Astronomical Society, 464, 469, doi: 10.1093/mnras/stw2233
- Steidel et al. (2001) Steidel, C. C., Pettini, M., & Adelberger, K. L. 2001, The Astrophysical Journal, 546, 665, doi: 10.1086/318323
- Storey & Hummer (1995) Storey, P. J., & Hummer, D. G. 1995, Monthly Notices of the Royal Astronomical Society, 272, 41, doi: 10.1093/mnras/272.1.41
- Strom et al. (2018) Strom, A. L., Steidel, C. C., Rudie, G. C., Trainor, R. F., & Pettini, M. 2018, The Astrophysical Journal, 868, 117, doi: 10.3847/1538-4357/aae1a5
- Sérsic (1963) Sérsic, J. L. 1963, Boletin de la Asociacion Argentina de Astronomia La Plata Argentina, 6, 41. https://ui.adsabs.harvard.edu/abs/1963BAAA....6...41S
- Taylor (2017) Taylor, M. 2017, arXiv e-prints, arXiv:1711.01885, doi: 10.48550/arXiv.1711.01885
- Topping et al. (2024) Topping, M. W., Stark, D. P., Senchyna, P., et al. 2024, Monthly Notices of the Royal Astronomical Society, 529, 3301, doi: 10.1093/mnras/stae682
- Torralba-Torregrosa et al. (2024) Torralba-Torregrosa, A., Matthee, J., Naidu, R. P., et al. 2024, Anatomy of an ionized bubble: NIRCam grism spectroscopy of the $z=6.6$ double-peaked Lyman-$\alpha$ emitter COLA1 and its environment, doi: 10.48550/arXiv.2404.10040
- Trebitsch et al. (2017) Trebitsch, M., Blaizot, J., Rosdahl, J., Devriendt, J., & Slyz, A. 2017, Monthly Notices of the Royal Astronomical Society, 470, 224, doi: 10.1093/mnras/stx1060
- Treu et al. (2022) Treu, T., Roberts-Borsani, G., Bradac, M., et al. 2022, The Astrophysical Journal, 935, 110, doi: 10.3847/1538-4357/ac8158
- van Rossum (1995) van Rossum, G. 1995, Python
- Vanzella et al. (2018) Vanzella, E., Nonino, M., Cupani, G., et al. 2018, Monthly Notices of the Royal Astronomical Society, 476, L15, doi: 10.1093/mnrasl/sly023
- Vanzella et al. (2023) Vanzella, E., Loiacono, F., Bergamini, P., et al. 2023, Astronomy & Astrophysics, 678, A173, doi: 10.1051/0004-6361/202346981
- Verhamme et al. (2017) Verhamme, A., Orlitová, I., Schaerer, D., et al. 2017, Astronomy & Astrophysics, 597, A13, doi: 10.1051/0004-6361/201629264
- Vila-Costas & Edmunds (1993) Vila-Costas, M. B., & Edmunds, M. G. 1993, Monthly Notices of the Royal Astronomical Society, 265, 199, doi: 10.1093/mnras/265.1.199
- Villar-Martín et al. (2004) Villar-Martín, M., Cerviño, M., & González Delgado, R. M. 2004, Monthly Notices of the Royal Astronomical Society, 355, 1132, doi: 10.1111/j.1365-2966.2004.08395.x
- Virtanen et al. (2020) Virtanen, P., Gommers, R., Oliphant, T. E., et al. 2020, Nature Methods, 17, 261, doi: 10.1038/s41592-019-0686-2
- Watts et al. (2021) Watts, A. B., Catinella, B., Cortese, L., Power, C., & Ellison, S. L. 2021, Monthly Notices of the Royal Astronomical Society, 504, 1989, doi: 10.1093/mnras/stab1025
- Weisz et al. (2012) Weisz, D. R., Johnson, B. D., Johnson, L. C., et al. 2012, The Astrophysical Journal, 744, 44, doi: 10.1088/0004-637X/744/1/44
- Whitaker et al. (2019) Whitaker, K. E., Ashas, M., Illingworth, G., et al. 2019, The Astrophysical Journal Supplement Series, 244, 16, doi: 10.3847/1538-4365/ab3853
- Williams et al. (2023) Williams, H., Kelly, P. L., Chen, W., et al. 2023, Science, 380, 416, doi: 10.1126/science.adf5307
- Witstok et al. (2024a) Witstok, J., Maiolino, R., Smit, R., et al. 2024a, JADES: Primeval Lyman-$\mathrm{\alpha}$ emitting galaxies reveal early sites of reionisation out to redshift $z \sim 9$, arXiv, doi: 10.48550/arXiv.2404.05724
- Witstok et al. (2024b) Witstok, J., Smit, R., Saxena, A., et al. 2024b, Astronomy & Astrophysics, 682, A40, doi: 10.1051/0004-6361/202347176
- Witten et al. (2024) Witten, C., Laporte, N., Martin-Alvarez, S., et al. 2024, Nature Astronomy, 8, 384, doi: 10.1038/s41550-023-02179-3
- Witten et al. (2023) Witten, C. E. C., Laporte, N., & Katz, H. 2023, The Astrophysical Journal, 944, 61, doi: 10.3847/1538-4357/acac9d
- Xu et al. (2022) Xu, X., Henry, A., Heckman, T., et al. 2022, The Astrophysical Journal, 933, 202, doi: 10.3847/1538-4357/ac7225
- Xue et al. (2016) Xue, Y. Q., Luo, B., Brandt, W. N., et al. 2016, The Astrophysical Journal Supplement Series, 224, 15, doi: 10.3847/0067-0049/224/2/15
- Yang et al. (2014) Yang, H., Wang, J., Zheng, Z.-Y., et al. 2014, The Astrophysical Journal, 784, 35, doi: 10.1088/0004-637X/784/1/35
- Zackrisson et al. (2013) Zackrisson, E., Inoue, A. K., & Jensen, H. 2013, The Astrophysical Journal, 777, 39, doi: 10.1088/0004-637X/777/1/39
- Zitrin et al. (2015) Zitrin, A., Labbé, I., Belli, S., et al. 2015, The Astrophysical Journal, 810, L12, doi: 10.1088/2041-8205/810/1/L12
- Álvarez Márquez et al. (2024) Álvarez Márquez, J., Colina, L., Crespo Gómez, A., et al. 2024, Astronomy and Astrophysics, 686, A85, doi: 10.1051/0004-6361/202347946