Inhomogeneous magnetic ordered state and evolution of magnetic fluctuations in Sr(Co1-xNix)2P2 revealed by 31P NMR
Abstract
SrCo2P2 with a tetragonal structure is known to be a Stoner-enhanced Pauli paramagnetic metal being nearly ferromagnetic. Recently Schmidt et al. [Phys. Rev. B 108, 174415 (2023)] reported that a ferromagnetic ordered state is actually induced by a small Ni substitution for Co of = 0.02 in Sr(Co1-xNix)2P2 where antiferromagnetic ordered phase also appears by further Ni-substitution with . Here, using nuclear magnetic resonance (NMR) measurements on 31P nuclei, we have investigated how the magnetic properties change by the Ni substitution in Sr(Co1-xNix)2P2 from a microscopic point of view, especially focusing on the evolution of magnetic fluctuations with the Ni substitution and the characterization of the magnetically ordered states. The temperature dependences of 31P spin-lattice relaxation rate divided by temperature () and Knight shift () for SrCo2P2 are reasonably explained by a model where a double-peak structure for the density of states near the Fermi energy is assumed. Based on a Korringa ratio analysis using the and data, ferromagnetic spin fluctuations are found to dominate in the ferromagnetic Sr(Co1-xNix)2P2 as well as the antiferromagnets where no clear antiferromagnetic fluctuations are observed. We also found the distribution of the ordered Co moments in the magnetically ordered states from the analysis of the 31P NMR spectra exhibiting a characteristic rectangular-like shape.
I Introduction
Magnetic fluctuation is one of the important parameters to control the physical properties of unconventional superconductors (SCs) such as high cuprates and iron-based SCs. The discovery of superconductivity in iron pnictides in 2008 Kamihara2008 triggered considerable experimental and theoretical attention on transition-metal (TM) pnictides Johnston2010 ; Canfield2010 ; Stewart2011 . Among them, Co compounds with ThCr2Si2-type structure, Co2X2 ( = alkaline earth or lanthanide, = pnictogen) have been found to show a rich variety of magnetic properties with different crystal structures. SrCo2P2 with an uncollapsed tetragonal (ucT) structure shows no magnetic ordering and is a Stoner-enhanced Pauli paramagnet with dominant ferromagnetic interactions Moresen1998 ; Jia2009 ; Imai2014 ; Imai2015PP ; Imai2017 . In contrast, an A-type antiferromagnetic (AFM) state has been reported in CaCo2P2 with a collapsed tetragonal (cT) structure below a Néel temperature of 110 K, in which the Co moments are ferromagnetically aligned in the plane and the moments adjacent along the axis are aligned antiferromagnetically Reehuis1998 ; Imai2017 ; Baumbach2014PRB . The ordered Co moments in the AFM state are reported to be 0.32-0.35 from the neutron diffraction (ND) measurements Reehuis1998 and nuclear magnetic resonance (NMR) measurements Higa2018 . A ferromagnetic (FM) state is also reported by replacing the divalent alkaline-earth ions by the trivalent La ions in the metallic LaCo2P2 with an ucT structure below a Curie temperature of = 130 K where the saturated Co moment is reported to be of 0.4 Reehuis1994 ; Imai2015PRB ; Teruya_LaCo2P2 .
Magnetic ordering in Co-based compounds was also reported to be induced by Ca substitution for Sr in (Sr1-xCax)Co2P2 Jia2009 ; Imai2017 ; Sugiyama2015PRB and also by Ge substitution for P in SrCo2(P1-xGex)2 Moriyama2023 . In the case of (Sr1-xCax)Co2P2, although the Stoner-enhanced Pauli paramagnetic state is observed in the ucT phase with , the A-type AFM ordering appears in the cT phase with Jia2009 , indicating a strong relationship between the magnetism and crystal structure. It is interesting to point out that, in contrast to the Co compounds, no magnetic order has been observed in the cT phase in Fe-based compounds such as CaFe2As2 Kreyssig2008 ; Pratt2009 ; Prokes2010 ; Ran2011 where AFM fluctuations are also revealed to be completely suppressed Kawasaki2010 ; Kawasaki2011 ; Soh2013 ; Furukawa2014 . In the case of SrCo2(P1-xGex)2, a ferromagnetic ordered state has been observed in = 0.42-0.61 which is an intermediate region between the ucT (the SrCo2P2 side) and the cT (the SrCo2Ge2 side) phases and a ferromagnetic quantum criticality has been discussed Moriyama2023 .
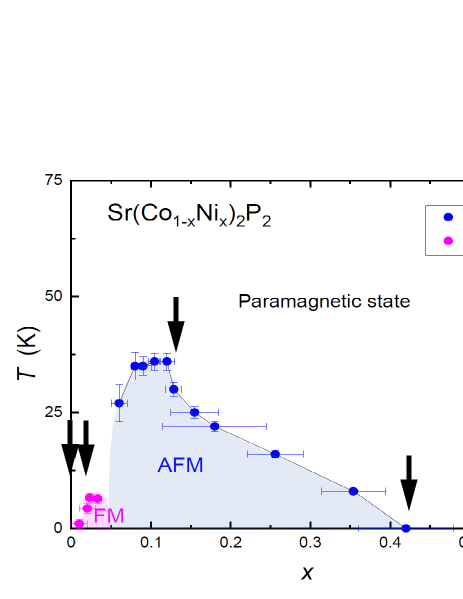
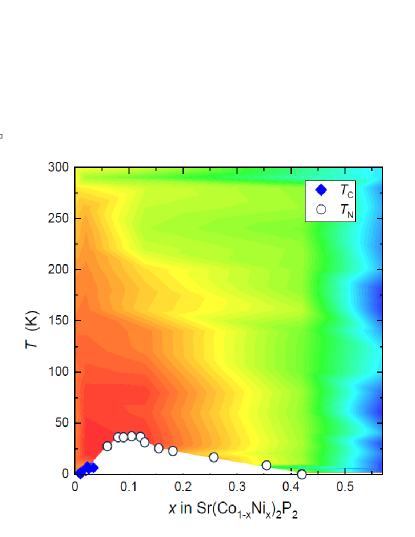
Recently it was shown that, from the detailed investigation of the Ni substituted SrCo2P2 compounds, Sr(Co1-xNix)2P2 can be systematically tuned to have one of three different magnetic ground states: AFM, FM and paramagnetic states by electron doping Schmidt2023 . Figure 1 shows a schematic phase diagram of Sr(Co1-xNix)2P2 determined by magnetization and resistivity measurements Schmidt2023 . Although = 1 (SrNi2P2) exhibits a one-third collapsed orthorhombic structure (tcO) Schmidt2023 , the tcO phase is rapidly suppressed with Co additions and the magnetically ordered phases appear only in the ucT phase, which is different from the aforementioned other systems (Sr1-xCax)Co2P2 and SrCo2(P1-xGex)2. With only a 2 % Ni substitution to the nonmagnetic SrCo2P2, ordering with a ferromagnetic component is induced with = 4.3-6.6 K. With further Ni substitution, the AFM state appears for 0.06 0.35 with the highest = 36 K around = 0.1-0.12. As the magnetic properties of Co compounds seem to largely depend on crystal structure as well as the valence number of Co ions, Sr(Co1-xNix)2P2 is a good system to investigate only the carrier doping effect on the magnetic properties without changing the ucT crystal structure. Up to now, no investigation of the magnetic properties from a microscopic point of view or magnetic fluctuations in Sr(Co1-xNix)2P2 has been reported. Since magnetic fluctuations are considered to be one of the key ingredients to characterize the physical properties of materials, it is crucial to reveal how magnetic fluctuations vary with Ni substitution in Sr(Co1-xNix)2P2. NMR is an ideal tool for the microscopic study of the magnetic properties and the low-energy magnetic fluctuations in correlated electron systems. It is known that the nuclear spin-lattice relaxation rate (1/) reflects the wave vector -summed dynamical susceptibility. On the other hand, NMR spectrum measurements, particularly the Knight shift (), give us information on the static magnetic susceptibility . Thus from the temperature dependence of 1/ and , one can obtain valuable insights into magnetic fluctuations in materials.
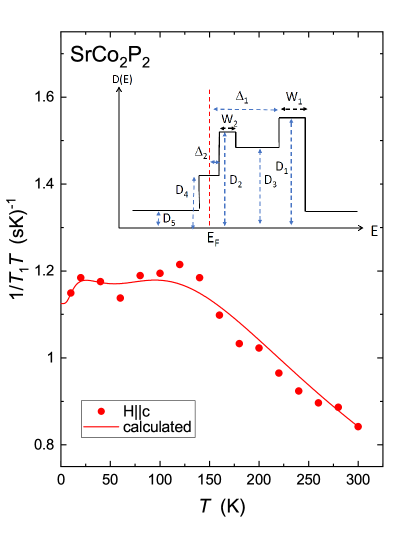
In this paper, we carried out 31P NMR measurements to examine the local magnetic properties of Sr(Co1-xNix)2P2. The characteristic temperature dependences of and 1/ exhibiting a double-maxima around 25 K and 125 K in the parent compound SrCo2P2 were reasonably explained by a model where a double-peak structure of the density of states (DOS) near the Fermi energy is assumed. Our analysis, based on the modified Korringa relation, reveals electron correlations enhanced around FM wavenumber = 0 in SrCo2P2. We find the FM spin fluctuations are strongly enhanced with the only 2 % Ni substitution in the ferromagnetic Sr(Co0.98Ni0.02)2P2. Similar strong FM spin fluctuations are also found to dominate in an antiferromagnet Sr(Co0.87Ni0.13)2P2 with = 30 K. With further Ni substitution up to = 0.57 through = 0.42, such FM spin fluctuations as well as the magnetic ordering completely disappear, leading to a noncorrelated metal where a typical Korringa behavior of 1/ = const. was observed without showing any indication of quantum critical behavior around = 0.42 in Sr(Co1-xNix)2P2. Before proceeding, we would like to point out that in Ref. Schmidt2023 samples were presented as Sr(Ni1-xCox)2P2; in this work we present our data based on the formula Sr(Co1-xNix)2P2 since the magnetic ordering we are interested in develops for as small as 0.02 and it disappears before = 0.50.
II Experimental details
The single crystals of Sr(Co1-xNix)2P2 ( = 0, 0.02, 0.13, 0.42 and 0.57) used in this study were grown out of Sn flux Schmidt2023 , using conventional high-temperature growth techniques Canfield2020 . The sizes of the crystals are similar ( mm3). The Ni substitution levels of the single crystals used in this study were determined by wavelength dispersive x-ray spectroscopy, and the crystals are characterized by magnetization and resistivity measurements Schmidt2023 . No magnetic ordering was observed for = 0 (pure SrCo2P2), = 0.42 or 0.57 for 2 K from the magnetization measurements, while a ferromagnetic ordering at = 4.3 K and an antiferromagnetic ordering at = 30 K were reported under a weak magnetic field of 100 Oe for our crystals = 0.02 and 0.13, respectively Schmidt2023 . Details of the characterization of the crystals are reported in Ref. Schmidt2023 .
31P (nuclear spin = 1/2 and gyromagnetic ratio = 17.237 MHz/T) NMR spectra were obtained either by fast Fourier transform (FFT) of the NMR echo signals or by plotting spin-echo intensity with changing resonance frequency under an external magnetic field of 7.4089 Tesla. When the 31P NMR spectra become very broad due to magnetic ordering for = 0.02 and 0.13, we measured the 31P NMR spectra by sweeping the external magnetic field at a constant resonance frequency. The NMR spectra for = 0.42 were also measured by sweeping the . The magnetic field was applied parallel to either the crystal axis or the plane, and the direction of the magnetic field in the plane was not controlled. The origin of the Knight shift, = 0, of the 31P nucleus was determined by the 31P NMR measurements of H3PO4.
The 31P spin-lattice relaxation rate was measured at the peak position of the the spectra with a saturation recovery method. at each temperature () was determined by fitting the nuclear magnetization versus time using the exponential function , where and are the nuclear magnetization at time after the saturation and the equilibrium nuclear magnetization at , respectively. All the nuclear magnetization recovery curves measured for all crystals of Sr(Co1-xNix)2P2 ( = 0, 0.02, 0.13, 0.42 and 0.57) were well fitted with the function as shown in the supplementary materials SM .
III Experimental results
III.1 31P NMR spectrum
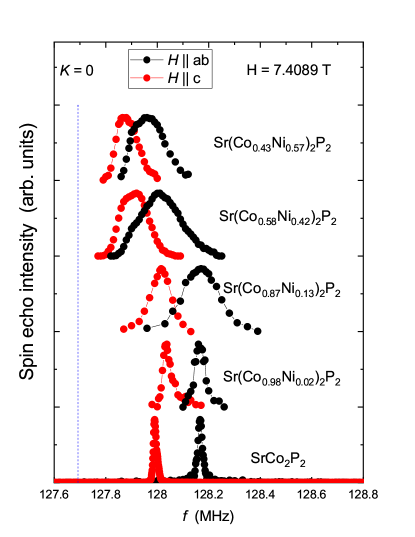
Figure 2 shows the frequency-swept 31P-NMR spectra of Sr(Co1-xNix)2P2 at near room temperature for magnetic fields parallel to the axis () and the plane (). Since 31P nucleus has = 1/2, a single line was observed as shown in the figure. In the case of SrCo2P2 ( = 0), relatively sharp lines are observed with the full-width at half maximum (FWHM) values of 13.6 kHz and 19.6 kHz for and , respectively, at room temperature. With the Ni substitution for Co in Sr(Co1-xNix)2P2, the observed spectra become broader to 34.0 kHz and 36.0 kHz for = 0.02, 92.0 kHz and 154 kHz for = 0.13, 132 kHz and 189 kHz for = 0.42 and 99.0 kHz and 150 kHz for = 0.57, for and , respectively. This is mainly due to a distribution of the hyperfine coupling constant produced by the Ni substitution and also a distribution of the Ni concentration. It is noted that the values of the FWHM for = 0.42 are slightly greater than those of others. This originates from a slightly larger distribution of Ni concentration for = 0.42 crystals than others reported in Ref. Schmidt2023 . It is worth mentioning that the NMR spectra indicate no obvious phase separation in our crystals, as we do not observe any separated lines in the spectra.
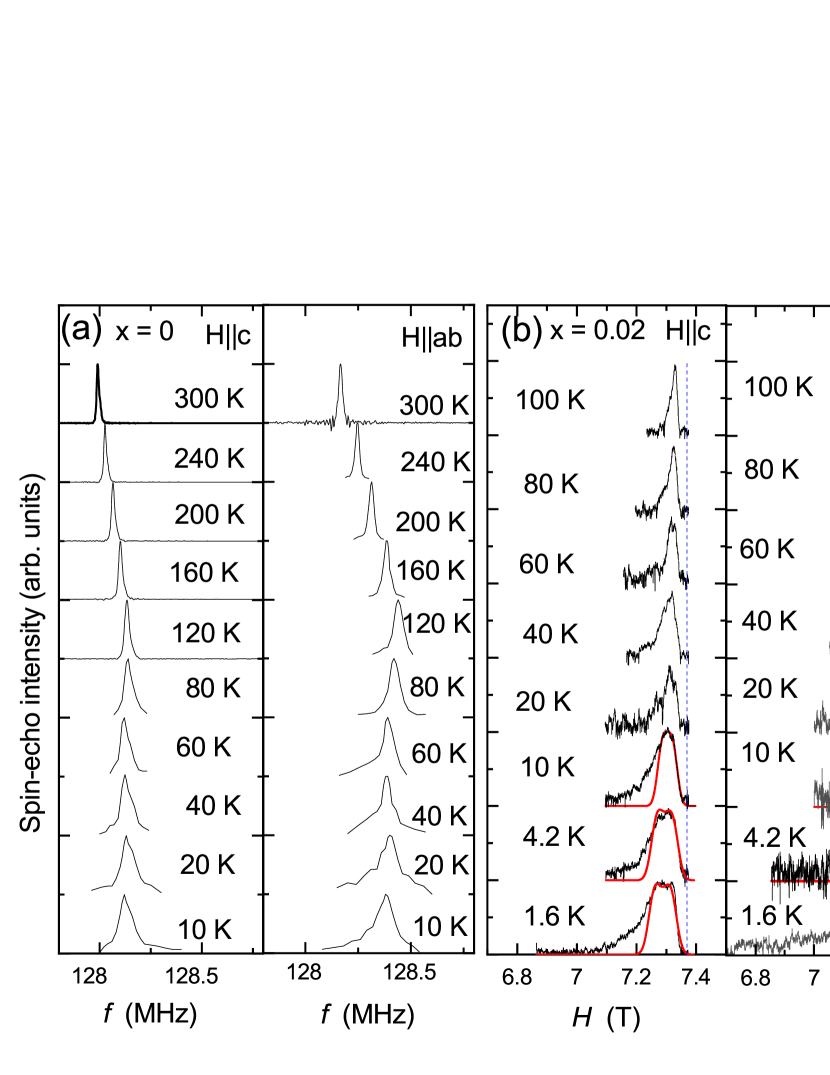
The typical temperature dependence of 31P NMR spectra in Sr(Co1-xNix)2P2 is shown in Fig. 3. For = 0 [Fig. 3(a)], although the NMR lines are relatively sharp at high temperatures, the spectra become slightly broader with decreasing temperature due to an inhomogeneous magnetic broadening. This probably originates from a slight inhomogeneity of the hyperfine coupling constant due to some defects. A similar inhomogeneous broadening was observed in 59Co NMR spectra of the isostructural compound SrCo2As2 Wiecki2015 . For the magnetically ordered compounds with = 0.02 and 0.13, the observed spectra become very broad at low temperatures due to the magnetic ordering as shown in Figs. 3(b) and 3(c), evidencing the the magnetic ordering in both samples from a microscopic point of view. We also note that the spectra become asymmetric. Since 31P nucleus has = 1/2 and we used single crystals for our measurements, the asymmetric shape indicates a distribution of the hyperfine coupling constants at the P sites. It is interesting to point out that the shape of the NMR line in the magnetically ordered state for = 0.13 shows a characteristic rectangular-like shape [for example, see the spectra at the bottom in Fig. 3(c)]. Such a rectangular shape of the NMR spectrum is expected for powder samples of antiferromagnets Yamada1986 ; Devi2022 . However, as we used singe crystals for our measurements, this cannot be invoked to explain the NMR line shape observed. It is also noted that, although the plateau region is less than that of = 0.13, a similar rectangular-like shape is observed in = 0.02 at low temperatures. We will discuss the shape of the NMR line below. For the non-magnetic compound with = 0.42 and 0.58, although the observed spectra are asymmetric due to the distribution of hyperfine coupling and Ni contents, no obvious change in the peak positions was observed, consistent with the non-magnetic ground state reported from the magnetization measurements Schmidt2023 .
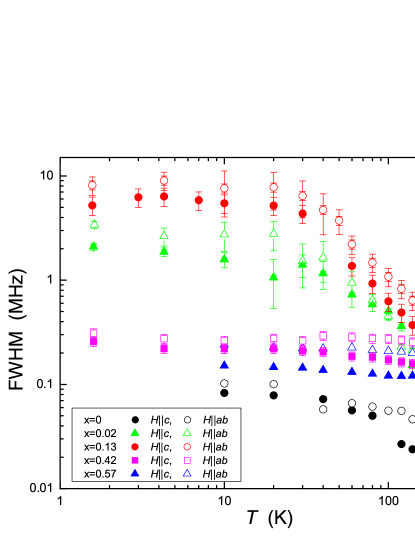
Figure 4 shows the temperature dependence of FWHM of 31P-NMR spectra under both magnetic field directions and for Sr(Co1-xNix)2P2. The values of FWHM of the field-swept NMR spectra for = 0.02, 0.13 and 0.42 were converted from Tesla to MHz by using the relation = . As described above, in the case of = 0.13, the values of FWHM for both directions increase with decreasing temperature and level off below = 30 K due to the magnetic ordering. Interestingly similar temperature dependence of FWHM, but with different magnitudes, is observed in = 0.02. This suggests that the magnetically ordered state at = 0.02 is well developed below 10 K under a magnetic field of 7.4 T, although the compound is reported to show a ferromagnetic ordered state below = 4.3 K under = 0.01 T.
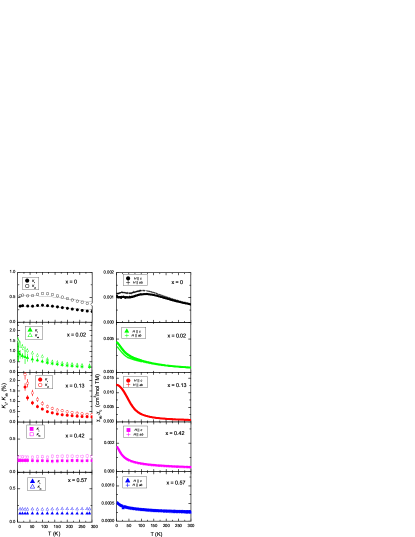
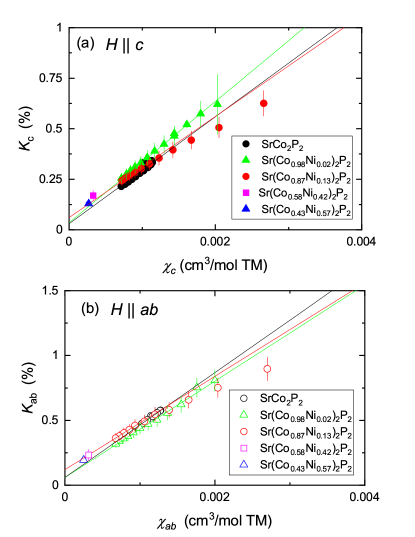
Figure 5 shows the temperature dependence of the NMR shift for axis () and plane () for Sr(Co1-xNix)2P2. For the case of = 0, both and show broad maxima around 25 K and 110 K, consistent with the temperature dependence of the magnetic susceptibility shown in the top panel in the right column. These results are consistent with the previous NMR measurements reported by Imai Imai2017 ; Imai2014 . For = 0.02 and 0.13, both and increase with decreasing temperature showing the Curie-Weiss-like behaviors, consistent with the temperature dependence of the magnetic susceptibility Schmidt2023 . In contrast, a nearly temperature-independent behavior of both and is observed in = 0.42 by which substitution value the AFM state has disappeared. This indicates that the magnetic susceptibility of the dominant part of the crystal is nearly independent of temperature, although the magnetic susceptibility data show an increase with decreasing temperature. Similarly, both and for = 0.57 are nearly temperature independent expected for non-magnetic metals, although again the magnetic susceptibility data show small increases with decreasing temperature. These results indicate that the increase in might be due to the distribution of Ni content and/or impurity spins .
The NMR shift is related to the local electron spin susceptibility through the hyperfine coupling constant by , where is the Bohr magneton, is Avogadro’s number, and is the temperature independent chemical shift originating from the core electrons of P atoms. As shown in Fig. 5 (the right column), the magnetic susceptibilities are nearly isotropic, although slight magnetic anisotropies can be seen below 200 K and 70 K for = 0 and 0.02, respectively. Therefore the clear difference between and is due to the different hyperfine coupling constants and which can be estimated from the so-called plot analysis.
Figures 6(a) and 6(b) plot and against and , respectively, for all compounds with as an implicit parameter where is chosen to be well above magnetic ordering temperatures for = 0.02 and 0.13 to avoid the effects of the magnetic ordering. and vary with the corresponding as expected, although one can see a slight deviation from the linear relationship. From the slopes of the fitted lines for the high-temperature regions above 100 K shown by the lines, we estimated the hyperfine coupling constants parallel to the axis T/ and parallel to the plane T/ for = 0, T/ and T/ for = 0.02, and T/ and T/ for = 0.13. Similar, but slightly different values of T/ and T/ have been reported for = 0 Imai2017 . The values of chemical shift were also estimated to be = 0.06 (0.03) for () for = 0, = 0.06 (0.035) for = 0.02, and = 0.12 (0.06) for = 0.13.
III.2 31P NMR spectrum in magnetically ordered state
As described above, we observed characteristic rectangular-like shape spectra in the magnetically ordered states in = 0.02 and 0.13. For = 0.13, the antiferromagnetic ground state has been reported under a small magnetic field of 0.01 T Schmidt2023 . Although such a rectangular-like line shape is expected for powder samples of antiferromagnets Yamada1986 ; Devi2022 , this can not be applied here since we used single crystals. In addition, the AFM state in = 0.13 is transformed into a forced ferromagnetic (saturated paramagnetic) state under strong magnetic fields. In fact, the magnetization measurements show a saturated magnetization of 0.15 per TM ions above 1.5 T under at 2 K and a similar saturated magnetization of 0.15 is observed above 3 T for Schmidt2023 . This indicates that all magnetic moments in the magnetic ordered state are aligned along the magnetic field direction. This can also be seen in the temperature dependence of magnetization of the = 0.13 crystal used in the present study at = 7 T shown in Fig. 5 (right middle panel) and replotted in the right inset of Fig. 7 on a semi-log scale where shows a saturation moment of 0.16 /TM below 10 K with no obvious magnetic anisotropy.
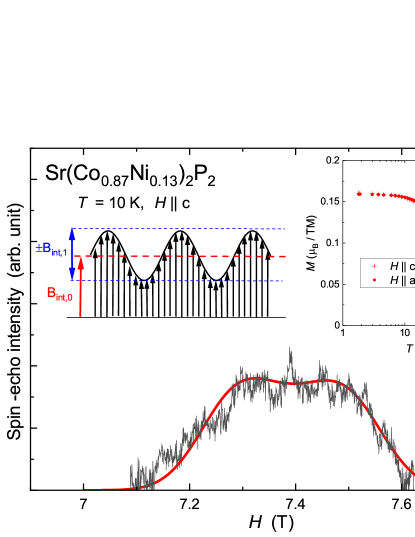
Therefore, as our NMR spectrum measurements have been performed above = 7 T, we consider that the NMR spectra were measured in the state where the magnetic moments are saturated in the = 0.13 compound by the application of the magnetic field. The broad NMR line is mainly due to the distribution of the hyperfine field at the P site due to the Ni substitution which generates different environments of the P site with respect to the number of nearest neighbors (NN) of a given Co occupied by Ni. From the estimate of the probability of finding (= 1-4) Ni at NN Co sites with = , we found that only the distribution of the hyperfine field cannot explain the rectangular-like shape of the spectrum. Therefore, one needs to introduce a distribution of Co ordered moments in order to explain the characteristic shape of the NMR line. Thus we conclude that the magnitude of the Co-ordered moments is not uniform and the magnetic states are inhomogeneous in the magnetic ordered state of the Ni-substituted SrCo2P2. To explain the observed spectra, we modeled that the Co ordered moments are not uniform and the magnitude is modulated with a sinusoidal function as shown in the inset of Fig. 7 which produces the uniform and distributed internal magnetic inductions and at the P site, respectively. Here it is noted that the modulation of the magnetic moment is assumed to be incommensurate with the lattice.
The red curve in Fig. 7 is a calculated result with = 0.22 T and = 0.14 T with an appropriate inhomogeneous magnetic broadening, which reasonably reproduces the observed spectrum (shown by the black curve) measured at = 10 K with for Sr(Co0.87Ni0.13)2P2 ( = 0.13). Thus we consider that the rectangular-like NMR spectra observed in the magnetically ordered state are due to the variation of the Co-ordered moments. Utilizing the values of = 1.48 T/, the uniform and the distribution components of the magnetic moment are estimated to be 0.150.01 and 0.100.01 , respectively. The value of the uniform magnetic moment is in great agreement with a value of 0.16 estimated from the measurements shown in the right inset of Fig. 7.
The red curves in the left column of Fig. 3(c) show calculated results where () = 0.22(0.14) T are nearly independent of temperature below 10 K, and decrease gradually above 10 K to 0.19(0.11) T at 20 K and 0.17(0.10) T at 30 K for . The temperature-dependent behavior is consistent with the temperature dependence of shown in the inset of Fig. 7.
For the case of [the right column of Fig. 3(c)], the calculated spectra also capture the characteristic shape of the observed spectra where we used () = 0.33(0.19), 0.31(0.20), 0.25(0.16), and 0.20(0.13) T for = 4.2, 10, 20, and 30 K, respectively, indicative of the variation of the Co ordered moments in the magnetically ordered state. The uniform and the distribution components of the Co ordered moments for the direction are estimated using = 2.01 T/ to be 0.160.01 and 0.100.01 at 4.2 K. These values are very close to those for . Again the estimated uniform magnetization from the NMR spectrum simulation is in excellent agreement with the magnetization data, indicating that the magnetization measurements picked up the average value of magnetization as expected.
It is noted that the model can also roughly reproduce the NMR spectra at low temperatures for = 0.02 as shown by the red curves in Fig. 3(b), although the tails of the spectra at the lower magnetic field side cannot be well reproduced. This is presumably due to the large inhomogeneous distribution of hyperfine field coming from the Ni substitution as described above. For example, () = 0.082(0.037) T for and 0.12(0.065) T for were used for the calculation for the spectra at 1.6 K. By using = 1.67(2.07) T/, the uniform and distribution components of the Co ordered moments are estimated to be 0.049(0.022) and 0.058(0.031) for and , respectively, for = 0.02. These are also in good agreement with 0.049 and 0.056 for for and determined by the magnetization measurements under 7 T shown in the right panel in Fig. 5 of the measured crystal of = 0.02. Thus we conclude that the magnetic states in Sr(Co1-xNix)2P2 are non-uniform and the distribution of the Co-ordered moments is incommensurate with the lattice.
We have tried to measure the 31P NMR spectrum around = 1 T in the AFM state for = 0.13. However, the signal intensity was too poor to measure, so we were not able to obtain the spectrum in the AFM state. Therefore, we cannot discuss the magnetic structure in the AFM state in Sr(Co1-xNix)2P2. Nevertheless, it is worth to mention that, in the isostructural As-system Sr(Co1-xNix)2As2, the AFM state appearing in = 0.013-0.25 with a maximum = 26.5 K at = 0.10 has been determined to be a planar helical magnetic state originating from FM interactions in the plane and weaker AFM interactions along the helix axis Sangeetha2019 ; Wilde2019 . As we describe below, this magnetic structure would be consistent with our observation of strong ferromagnetic spin fluctuations in = 0.13. Another possible magnetic structure is the A-type antiferromagnetic state observed in CaCo2P2 Reehuis1998 ; Imai2017 ; Baumbach2014PRB . Further experiments such as ND measurements are highly required to determine the magnetic structure in the AFM state in Sr(Co1-xNix)2P2.
III.3 31P spin-lattice relaxation time
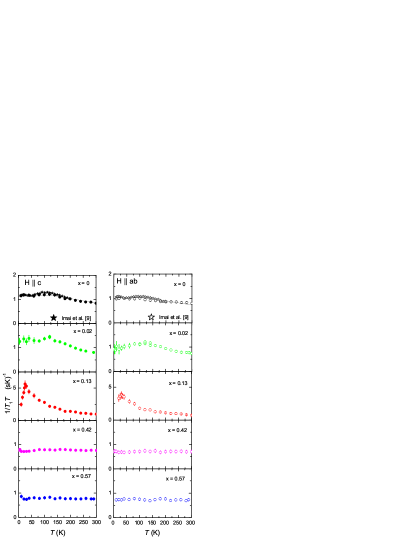
To investigate the dynamical magnetic properties, we have measured 1/ versus . Figure 8 shows the temperature and dependence of 1/ for both field directions (left: , right: ) in Sr(Co1-xNix)2P2. At = 0, similar to the case of , and thus , broad maxima are observed around 25 K and 120 K, as reported previously Imai2017 ; Imai2014 . For comparison, we show the 1/ data for = 0 reported from Imai et al. Imai2017 by closed and open stars in the figures, which show a relatively good agreement with our results. With Ni substitution of = 0.02, 1/ still shows a similar temperature dependence with those of 1/ for = 0 exhibiting a broad maximum around 120 K for both magnetic field directions where the broad maximum around 25 K is not clearly observed. No apparent anomaly due to ferromagnetic phase transition is observed around , which is probably broadened into a high temperature cross over into the saturated paramagnetic state by the application of the magnetic field of 7.4 T. On the other hand, at = 0.13, 1/ is enhanced and shows clear peaks around for both magnetic field directions. However, the peaks in 1/ should not be due to the AFM transition because the ground state of the compound is a forced ferromagnetic (saturated paramagnetic) state under = 7.4 T. It will be interpreted as a crossover from the paramagnetic to the forced ferromagnetic states. With further Ni substitution of = 0.42 and to 0.57, in contrast, the values of 1/ are suppressed and 1/ follows the Korringa law, = const. which is indicative of a paramagnetic metallic state without significant magnetic fluctuations.
First, we analyze the characteristic temperature dependence of 1/ showing the double-maxima observed in = 0. Since the characteristic temperature dependence of 1/ can be due to a band structure near the Fermi energy , we calculated it based on a model where we adopt a double-peak structure of the density of states (DOS) shown in the inset of Fig. 9.
In this model, the Fermi energy () is assumed to be just below the double peaks having the widths of and away from the by and , respectively. ( represent the DOS for the band structure near . Using the formula,
| (1) |
where is the Fermi distribution function, we calculated with a set of parameters of = 300 K, = 25 K, = 125 K, = 30 K, = 1, 0.82, 0.75, 0.55, and 0.15 for = 1, 2, 3, 4, and 5, respectively. The calculated result reasonably reproduces the experimental data, as shown by the red curve in Fig. 9. This indicates that the characteristic temperature dependence of exhibiting double maxima can be explained by the rigid peculiar band structure modeled. The calculated results are also shown in Fig. 8. It should be noted that, since the number of parameters is large (9 parameters) in the model, we cannot precisely determine the value of each parameter from the fitting. Therefore, there is relatively large uncertainty in the value of each parameter ( 25 %); however, again we point out that the model of the double-peak structure of the DOS qualitatively explains the characteristic temperature dependence of 1/. It is interesting to point out that such a double-peak DOS structure in SrCo2P2 has been reported from the density-function-theory band-structure calculations which reproduces the experimental data of de Haas-van Alphen effect experiments Gotze2021 . According to the calculations, the positions of the double peaks in the DOS are largely influenced by the crystal structure parameters such as lattice parameters and the Wyckoff position of P, and also different approximations used in the calculations Gotze2021 . Nevertheless, it is interesting to point out that the centers of the calculated two peaks are located around 0.005-0.011 eV and 0.02-0.035 eV above which are not far from the values obtained by the fit with = 25 K (0.0022 eV) and = 300 K (0.026 eV). In contrast, it is noted that the widths of each peak from the theoretical calculations are roughly estimated to be 0.011 eV and 0.005 eV for the peak around 0.005-0.011 eV and 0.02-0.035 eV, respectively, which are different from our fitting values of = 30 K (0.0026 eV) and = 125 K (0.011 eV).
We also calculated the temperature dependence of Knight shift using the same band structure model. The solid curves in Fig. 5 (the top panel on the left) are the calculated results with appropriate proportional constants utilizing the same set of parameters used for the fitting except for the small change in / from 0.55 to 0.45. Although the fits do not reproduce the data perfectly, the model seems to capture the behavior of qualitatively. The reason for the slight change in is not clear, but it may be due to magnetic fluctuations which do not follow the temperature dependence of the Knight shift.
From the calculations, it turns out that, as naturally expected, the broad maximum around 125 K in is mainly due to the peak in the DOS far away from the and the maximum around 25 K originates from the peak close to the . Therefore, the similar temperature dependence of 1/ observed in = 0.02 suggests that the DOS structure is not modified much by the Ni substitution although the system shows the ferromagnetic ground state. At present we do not have a clear idea to explain this. However, it may suggest that a very small change in DOS leads to the ferromagnetic long-range magnetic ordering and SrCo2P2 is located close to ferromagnetic instability. In contrast, for = 0.13, 1/ are enhanced, which cannot be explained by the simple band model. For = 0.42 and 0.57, the 1/ = const. behavior can be explained by a flat structure of the DOS near the expected for a normal metallic state. This indicates that the Ni substitution greater than = 0.42 completely smears out the double-peak structure, leading to a more itinerant nature of Co 3d electrons.
III.4 Magnetic fluctuations
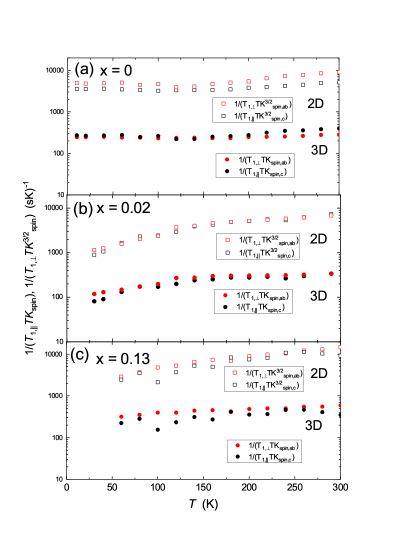
Now we discuss the magnetic fluctuations in Sr(Co1-xNix)2P2 based on a modified Korringa relation analysis using the and the electron spin part of Knight shift () data. Within a Fermi liquid picture, is proportional to the square of the DOS near the Fermi energy and ) is proportional to . In particular, = = , which is the Korringa relation. Deviations from can reveal information about electron correlations in materials Moriya1963 ; Narath1968 , which are expressed via the parameter . For instance, the enhancement of increases but has little or no effect on , which probes only the uniform with = 0. Thus for AFM correlations and for FM correlations.
Since 1/ probes magnetic fluctuations perpendicular to the magnetic field, it is natural to consider the Korringa ratio 1/(), where 1/() = 1/, when examining the character of magnetic fluctuations in the plane Wiecki2015-2 . We also consider the Korringa ratio 1/() for magnetic fluctuations along the axis. Here, 1/() is estimated from 2/ Wiecki2015-2 .
The temperature and dependences of 1/() and 1/() above the magnetic ordering temperatures in Sr(Co1-xNix)2P2 are shown in the left panels of Fig. 10. The calculated and are shown in the right panels of Fig. 10.
For = 0, () decrease from 0.4 (0.2) at 300 K to 0.08 (0.14) around 110 K and then become nearly temperature independent below that temperature, indicating dominant ferromagnetic spin correlations between Co spins at low temperatures in the compound. Furthermore, is less than suggesting the in-plane ferromagnetic fluctuations are stronger than those along the axis. The lowest values of and are almost comparable, or slightly greater than those isostructural compounds BaCo2As2 and SrCo2As2 in which dominant ferromagnetic spin fluctuations have also been reported Wiecki2015 ; BaCo2As2 . It is interesting to point out that the coexistence of ferromagnetic and antiferromagnetic spin fluctuations have been reported in SrCo2As2 Wiecki2015 ; Li2019 , although we do not have any clear evidence from the present 31P-NMR measurements for AFM spin fluctuations in SrCo2P2.
For = 0.02, although the values of and are nearly the same with the value (but slightly smaller than ) in = 0 at 300 K , and decrease rapidly down to 0.015, almost one order in magnitude less than the case of = 0, indicating a strong enhancement of ferromagnetic spin fluctuations at low temperatures in = 0.02. It is also interesting to note that the ferromagnetic spin fluctuations are nearly isotropic in = 0.02.
A similar enhancement of the isotropic ferromagnetic spin fluctuations at low temperatures is also observed in = 0.13. The values of and for = 0.13 are almost comparable with those in = 0.02. These results mean that the strong ferromagnetic spin fluctuations are induced with only a 2 % Ni substitution and are kept almost the same up to = 0.13 where the magnetic ground state changes from ferromagnetic ( = 0.02) to antiferromagnetic ( = 0.13). It is also interesting to point out that we do not observe any trace of AFM spin fluctuations in = 0.13, indicating that the magnetic fluctuations in = 0.13 are dominated by the ferromagnetic fluctuations. At present, the reason for no observation of the AFM spin fluctuations in = 0.13 is not well understood. However, it is interesting to point out that, in the A-type antiferromagnet CaCo2P2 where the Co moments are ferromagnetically aligned in the plane and the moments adjacent along the axis are aligned antiferromagnetically Reehuis1998 ; Imai2017 ; Baumbach2014PRB , no clear AFM spin fluctuations were observed and the magnetic fluctuations were found to be dominated by ferromagnetic ones Higa2018 . In addition, as described above, another possible AFM state of the planar helical magnetic state observed in Sr(Co1-xNix)2P2 Sangeetha2019 ; Wilde2019 would also provide dominant ferromagnetic spin fluctuations. Although the AFM structure in Sr(Co1-xNix)2P2 is still an open question, such magnetic states might lead to the dominant ferromagnetic spin fluctuations.
With Ni substitution of = 0.42, and increase and become temperature independent without showing any indication of quantum critical behavior. At = 0.57, the nearly temperature independent and become closer to unity, indicating that the magnetic fluctuations disappeared in the compound. Here we tentatively used = 0.03 (0.06) for () since the data points for = 0.42 and 0.57 in the plots [Figs. 6(a) and (b)] are well on the fitting lines showing the nearly independence of .
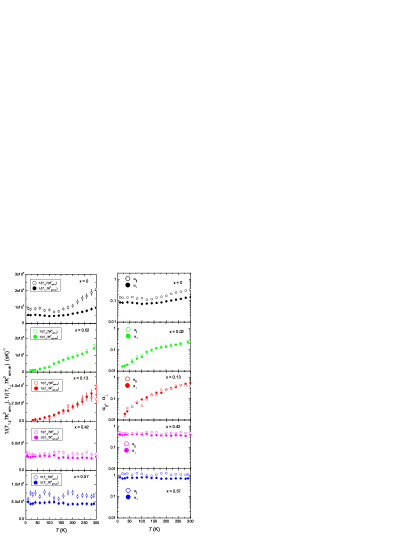
It should be noted that, however, the Korringa analysis usually applies to paramagnetic materials where electron-electron interaction is weak. Since the compounds with = 0.02 and 0.13 exhibit magnetic orders in contrast to = 0, 0.42 and 0.57, we also analyze NMR data based on self-consistent renormalization (SCR) theory, as Imai have performed in (Sr1-xCax)Co2P2 Imai2017 . As shown above, the magnetic fluctuations are governed by ferromagnetic spin correlations. In this case, according to SCR theory for weak itinerant ferromagnets, 1/ is proportional to or to for three dimensional (3D) or two-dimensional (2D) ferromagnetic spin fluctuations, respectively SCR1 ; SCR2 .
Figures 11(b) and 11(c) show the dependence of 1/( and 1/( for the two directions for = 0.02 and 0.13, respectively, together with those in = 0 (a). For both = 0.02 and 0.13, it seems that both the 1/() and 1/() are nearly constant in the temperature region of 150 - 300 K while both the 1/() and 1/() slightly increase with increasing temperature in that temperature region. This suggests the ferromagnetic spin fluctuations are most likely characterized by 3D in nature in the high-temperature region for both = 0.02 and 0.13. It is noted that both 1/( and 1/( decrease with decreasing temperature below 150 K, suggesting that the SCR theory may not be applicable to describe the dynamical properties of the Co moments in = 0.02 and 0.13 exhibiting long-range magnetic ordered states. As for = 0, although the SCR theory for the 3D FM model seems slightly better than that for the 2D model, it is difficult to conclude the dimensionality of the FM fluctuations from the present NMR data.
IV Summary
In conclusion, we conducted 31P NMR measurements on Sr(Co1-xNix)2P2 to investigate its static and dynamic magnetic properties. The characteristic temperature dependences of and 1/ exhibiting the double-maxima around 25 K and 125 K in the Stoner-enhanced paramagnetic metal SrCo2P2 were reasonably explained by a simple model where a double-peak structure of the density of states near the Fermi energy is assumed. We analyzed our and data based on the modified Korringa relation and discussed the evolution of magnetic fluctuations in the paramagnetic state in Sr(Co1-xNix)2P2. Figure 12 summarizes the evolution of the magnetic fluctuations where the dependence of the Korringa ratios of the longitudinal magnetic fluctuation vs. temperature is shown in the contour plot together with the magnetic phase transition temperatures from Ref. Schmidt2023 . Here we tentatively plotted the data of , but the in-plane magnetic fluctuations provide qualitatively the same behavior Korringa2 . The lower values in the magnitude of , much less than unity, qualitatively indicate the stronger ferromagnetic spin fluctuations. For = 0, is found to be much less than unity (the red-ish region in Fig. 12) evidencing that electron correlations are enhanced around FM wavenumber = 0 in the paramagnetic SrCo2P2. Such FM spin fluctuations are enhanced with only 2 % Ni substitution in the ferromagnetic Sr(Co0.98Ni0.02)2P2. Similar strong FM spin fluctuations are observed in the antiferromagnet Sr(Co0.87Ni0.13)2P2 with = 30 K. With further Ni substitution up to 0.42 and to 0.57, gradually increases and becomes close to unity (blue region in Fig. 12) indicating that such FM spin fluctuations completely disappeared, leading to a non-correlated metal. It is noted that no clear quantum critical behavior in Sr(Co1-xNix)2P2 can be observed around = 0.42 where the long-range magnetic state is not observed down to the lowest temperature (1.6 K) of our experiment. This is different from the As-system Sr(Co1-xNix)2As2 where a non-Fermi liquid behavior has been observed near = 0.3 when the long-range magnetic order disappeared Sangeetha2019 . Based on the analysis of the characteristic shape of the NMR spectra observed in the magnetically ordered state, we found that the ordered state is inhomogeneous where the magnitude of the ordered Co moments is modulated incommensurately with the lattice in Sr(Co1-xNix)2P2.
V Acknowledgments
We thank K. Rana for assistance in the initial stage of the NMR measurements. The research was supported by the U.S. Department of Energy, Office of Basic Energy Sciences, Division of Materials Sciences and Engineering. Ames National Laboratory is operated for the U.S. Department of Energy by Iowa State University under Contract No. DE-AC02-07CH11358.
References
- (1) Y. Kamihara, T. Watanabe, M. Hirano, and H. Hosono, Iron-Based Layered Superconductor La[O1-xFx]FeAs ( = 0.05 – 0.12) with = 26 K, J. Am. Chem. Soc. 130, 3296 (2008).
- (2) D. C. Johnston, The puzzle of high temperature superconductivity in layered iron pnictides and chalcogenides, Adv. Phys. 59, 803 (2010).
- (3) P. C. Canfield and S. L. Bud’ko, FeAs-Based Superconductivity: A Case Study of the Effects of Transition Metal Doping on BaFe2As2, Annu. Rev. Condens. Matter Phys. 1, 27 (2010).
- (4) G. R. Stewart, Superconductivity in iron compounds, Rev. Mod. Phys. 83, 1589 (2011).
- (5) S. Jia, A. J. Williams, P. W. Stephens, and R. J. Cava, Lattice collapse and the magnetic phase diagram of Sr1-xCaxCo2P2, Phys. Rev. B 80, 165107 (2009).
- (6) E. Morsen, B. Mosel, W. Muller-Warmuth, M. Reehuis, and W. Jeitschko, Mssbauer and magnetic susceptibility investigations of strontium, lanthanum and europium transition metal phosphides with ThCr2Si2 type structure, J. Phys. Chem. Solids 49, 785 (1988).
- (7) M. Imai, C. Michioka, H. Ohta, A. Matsuo, K. Kindo, H. Ueda, and K. Yoshimura, Anomalous itinerant-electron metamagnetic transition in the layered Sr1-xCaxCo2P2 system, Phys. Rev. B 90, 014407 (2014).
- (8) M. Imai, C. Michioka, H. Ueda, A. Matsuo, K. Kindo, and K. Yoshimura, Substitution Effects in the Itinerant Electron Metamagnetic Compound SrCo2P2, Phys. Procedia 75, 142 (2015).
- (9) M. Imai, C. Michioka, H. Ueda and K. Yoshimura, NMR investigation of spin fluctuations in the itinerant-electron magnetic compound Sr1-xCaxCo2P2, Phys. Rev. B 95, 054417 (2017).
- (10) R. E. Baumbach, V. A. Sidorov, Xin Lu, N. J. Ghimire, F. Ronning, B. L. Scott, D. J. Williams, E. D. Bauer, and J. D. Thompson, Suppression of antiferromagnetism by pressure in CaCo2P2, Phys. Rev. B 89, 094408 (2014).
- (11) M. Reehuis, W. Jeitschko, G. Kotzyba, B. Zimmer, and X. Hu, Antiferromagnetic order in the ThCr2Si2 type phosphides CaCo2P2 and CeCo2P2, J. Alloys Compd. 266, 54 (1998).
- (12) N. Higa, Q.-P. Ding, A. Teruya, M. Yogi, M. Hedo, T. Nakama, Y. Ōnuk, and Y. Furukawa, Magnetic properties of the itinerant -type antiferromagnet CaCo2P2 studied by 59Co and 31P nuclear magnetic resonance, Phys. Rev. B 98, 184433 (2018).
- (13) M. Reehuis, C. Ritter, R. Ballou, and W. Jeitschko, Ferromagnetism in the ThCr2Si2 type phosphide LaCo2P2, J. Magn. Magn. Mater. 138, 85 (1994).
- (14) M. Imai, C. Michioka, H. Ueda, and K. Yoshimura, Static and dynamical magnetic properties of the itinerant ferromagnet LaCo2P2, Phys. Rev. B 91, 184414 (2015).
- (15) A. Teruya, A.Nakamura, T. Takeuchi, F. Honda, D. Aoki, H. Harima, K. Uchima, M. Hedo, T. Nakama and Y. Ōnuki, De Haas-van Alphen Effect and Fermi Surface Properties in Ferromagnet LaCo2P2 and Related Compound, Phys. Procedia. 75, 876 (2015).
- (16) J. Sugiyama, H. Nozaki, I. Umegaki, M. Harada, Y. Higuchi, K. Miwa, E. J. Ansaldo, J. H. Brewer, M. Imai, and C. Michioka, K. Yoshimura, and M. Månsson, Variation of magnetic ground state of Sr1-xCaxCo2P2 determined with SR, Phys. Rev. B 91, 144423 (2015).
- (17) K. Moriyama, C. Michioka, H. Ueda, and K. Yoshimura, Ferromagnetic quantum critical phenomena in single-crystalline SrCo2(Ge1-xPx)2, Phys. Rev. B 107, 134427 (2023).
- (18) A. Kreyssig, M. A. Green, Y. B. Lee, G. D. Samolyuk, P. Zajdel, J. W. Lynn, S. L. Bud’ko, M. S. Torikachvili, N. Ni, S. Nandi, J. B. Leo, S. J. Poulton, D. N. Argyriou, B. N. Harmon, R. J. McQueeney, P. C. Canfield, and A. I. Goldman, Pressure-induced volume-collapsed tetragonal phase of CaFe2As2 as seen via neutron scattering, Phys. Rev. B 78, 184517 (2008).
- (19) D. K. Pratt, W. Tian, A. Kreyssig, J. L. Zarestky, S. Nandi, N. Ni, S. L. Bud’ko, P. C. Canfield, A. I. Goldman, and R. J. McQueeney, Coexistence of Competing Antiferromagnetic and Superconducting Phases in the Underdoped Ba(Fe0.953Co0.047)2As2 Compound Using X-ray and Neutron Scattering Techniques, Phys. Rev. Lett. 103, 087001 (2009).
- (20) K. Proke, A. Kreyssig, B. Ouladdiaf, D. K. Pratt, N. Ni, S. L. Bud’ko, P. C. Canfield, R. J. McQueeney, D. N. Argyriou, and A. I. Goldman, Evidence from neutron diffraction for superconductivity in the stabilized tetragonal phase of CaFe2As2 under uniaxial pressure, Phys. Rev. B 81, 180506(R) (2010).
- (21) S. Ran, S. L. Bud’ko, D. K. Pratt, A. Kreyssig, M. G. Kim, M. J. Kramer, D. H. Ryan, W. N. Rowan-Weetaluktuk, Y. Furukawa, B. Roy, A. I. Goldman, and P. C. Canfield, Stabilization of an ambient-pressure collapsed tetragonal phase in CaFe2As2 and tuning of the orthorhombic-antiferromagnetic transition temperature by over 70 K via control of nanoscale precipitates, Phys. Rev. B 83, 144517 (2011).
- (22) S. Kawasaki, T. Tabuchi, X. F. Wang, X. H. Chen, G-q. Zheng, Pressure-induced unconventional superconductivity near a quantum critical point in CaFe2As2, Supercond. Sci. Technol. 23, 054004 (2010).
- (23) S. Kawasaki, T. Oka, T. Tabuchi, X. F. Wang, X. H. Chen, G-q. Zheng, As-NMR/NQR study of pressure-induced superconductivity in CaFe2As2, J. Phys. Chem. Solids 72, 501 (2011).
- (24) J. H. Soh, G. S. Tucker, D. K. Pratt, D. L. Abernathy, M. B. Stone, S. Ran, S. L. Bud’ko, P. C. Canfield, A. Kreyssig, R. J. McQueeney, and A. I. Goldman, Inelastic Neutron Scattering Study of a Nonmagnetic Collapsed Tetragonal Phase in Nonsuperconducting CaFe2As2: Evidence of the Impact of Spin Fluctuations on Superconductivity in the Iron-Arsenide Compounds Phys. Rev. Lett. 111, 227002 (2013).
- (25) Y. Furukawa, B. Roy, S. Ran, S. L. Bud’ko, and P. C. Canfield, Suppression of electron correlations in the collapsed tetragonal phase of CaFe2As2 under ambient pressure demonstrated by 75As NMR/NQR measurements, Phys. Rev. B 89, 121109(R) (2014).
- (26) J. Schmidt, G. Gorgen-Lesseux, R. A. Ribeiro, S. L. Bud’ko, and P. C. Canfield, Effects of Co substitution on the structural and magnetic properties of Sr(Ni1-xCox)P2, Phys. Rev. B 108, 174415 (2023).
- (27) P. C. Canfield, New materials physics, Rep. Prog. Phys. 83, 016501 (2020).
- (28) See supplemental materials for typical nuclear magnetization recovery curves measured in Sr(Co1-xNix)2P2.
- (29) P. Wiecki, V. Ogloblichev, A. Pandey, D. C. Johnston, and Y. Furukawa, Coexistence of antiferromagnetic and ferromagnetic spin correlations in SrCo2As2 revealed by 59Co and 75As NMR, Phys. Rev. B 91, 220406(R) (2015).
- (30) Y. Yamada and A. Sakata, An Analysis Method of Antiferromagnetic Powder Patterns in Spin-Echo NMR under External Fields, J. Phys. Soc. Jpn. 55 1751 (1986).
- (31) D. Ambika, Q.-P. Ding, S. J. Sebastian, R. Nath, and Y. Furukawa, Static and dynamic magnetic properties of the spin- triangle lattice antiferromagnet Na3Fe(PO4)2 studied by 31P NMR, J. Phys. Condensed Matter. 51, 015803 (2022).
- (32) N. S. Sangeetha, L.-L. Wang, A. V. Smirnov, V. Smetana, A.-V. Mudring, D. D. Johnson, M. A. Tanatar, R. Prozorov, and D. C. Johnston, Non-Fermi-liquid types of behavior associated with a magnetic quantum critical point in Sr(Co1-xNix)2As2 single crystals, Phys. Rev. B 100, 094447 (2019).
- (33) J. M. Wilde, A. Kreyssig, D. Vaknin, N. S. Sangeetha, Bing Li, W. Tian, P. P. Orth, D. C. Johnston, B. G. Ueland, and R. J. McQueeney, Helical magnetic ordering in Sr(Co1-xNix)2As2, Phys. Rev. B 100 161113(R) (2019).
- (34) K. Götze, I. Kraft, J. Klotz, T. Förster, M. Uhlarz, V. Lorenz, C. Bergmann, Y. Prots, J. A. N. Bruin, A. McCollam, I. Sheikin, J. Wosnitza, C. Geibel, and H. Rosner, Highly sensitive band structure of the Stoner-enhanced Pauli paramagnet SrCo2P2, Phys. Rev. B 104, 085148 (2021).
- (35) T. Moriya, The Effect of Electron-Electron Interaction on the Nuclear Spin Relaxation in Metals, J. Phys. Soc. Jpn. 18, 516 (1963).
- (36) A. Narath and H. T. Weaver, Effects of Electron-Electron Interactions on Nuclear Spin-Lattice Relaxation Rates and Knight Shifts in Alkali and Noble Metals, Phys. Rev. 175, 378 (1968).
- (37) P. Wiecki, B. Roy, D. C. Johnston, S. L. Bud’ko, P. C. Canfield, and Y. Furukawa, Competing Magnetic Fluctuations in Iron Pnictide Superconductors: Role of Ferromagnetic Spin Correlations Revealed by NMR, Phys. Rev. Lett. 115, 137001 (2015).
- (38) K. Ahilan, T. Imai, A. S. Sefat, and F. L. Ning, NMR investigation of spin correlations in BaCo2As2, Phys. Rev. B 90, 014520 (2014).
- (39) B. Li, B. G. Ueland, W. T. Jayasekara, D. L. Abernathy, N. S. Sangeetha, D. C. Johnston, Q.-P. Ding, Y. Furukawa, P. P. Orth, A. Kreyssig, A. I. Goldman, and R. J. McQueeney, Competing magnetic phases and itinerant magnetic frustration in SrCo2As2, Phys. Rev. B 100, 054411 (2019).
- (40) M. Hatatani and T. Moriya, Ferromagnetic Spin Fluctuations in Two-Dimensional Metals, J. Phys. Soc. Jpn. 64, 3434 (1995).
- (41) T. Moriya, Spin Fluctuations in Itinerant Electron Magnetism, Vol. 56 (Springer-Verlag, 1985).
- (42) As the = 0.02 and 0.13 compounds exhibit the magnetically ordered states, the modified Korringa analysis may not be applicable to the compounds. However, here we tentatively show the Korringa ratio to provide the idea of the evolution of the magnetic fluctuations.