Distinguishing Isotropic and Anisotropic Signals for X-ray Total Scattering using Machine Learning
Abstract
Understanding structureproperty relationships is essential for advancing technologies based on thin film materials. X-ray pair distribution function (PDF) analysis can access relevant atomic structure details spanning local-, mid-, and long-range order. While X-ray PDF has been adapted for thin films on amorphous substrates, measurements of films on single crystal substrates are necessary for accurately determining structure origins for some thin film materials, especially those for which the substrate changes the accessible structure and properties. However, when measuring thin films on single crystal substrates, high intensity anisotropic Bragg spots saturate 2D detector images, overshadowing the thin films’ isotropic scattering signal. This renders previous data processing methods, developed for films on amorphous substrates, unsuitable for films on single crystal substrates. To address this measurement need, we developed IsoDAT2D, an innovative data processing approach using unsupervised machine learning algorithms. The program combines non-negative matrix factorization and hierarchical agglomerative clustering to effectively separate thin film and single crystal substrate X-ray scattering signals. We used SimDAT2D, a program we developed to generate synthetic thin film data, to validate IsoDAT2D, and also successfully use the program to isolate X-ray total scattering signal from a thin film on a single crystal Si substrate. The resulting PDF data are compared to similar data processed using previous methods, demonstrating superior performance relative to substrate subtraction with a single crystal substrate and similar performance to substrate subtraction from a film on an amorphous substrate. With IsoDAT2D, there are new opportunities to expand the use of PDF to a wider variety of thin films, including those on single crystal substrates, with which new structureproperty relationships can be elucidated to enable fundamental understanding and technological advances.
1 Introduction
Amorphous, nanocrystalline, and otherwise disordered thin film materials have distinct properties from their bulk states that can be beneficial in applications such as spintronics,1 phase change memory,2, 3 photonics,4 and broadly in semiconductor devices.5 The ever-increasing demand for high-performance computers and advanced electronic technologies necessitates the continual improvement of the materials that drive them.6 Atomic structure models of these materials are essential to enhance their properties, optimize their performance, and advance our fundamental understanding of the origins of compelling functional properties. However, current atomic structure characterization is limited for these types of thin films, specifically for local- and mid-range atomic structure features.
Part of the challenge arises from the relative volume of a thin film and its substrate. Thin films are typically deposited or grown on a substrate via chemical or physical vapor deposition processes,7, 8 resulting in films with thicknesses between 1 nm and several microns.9, 10, 11 The thin films intended for practical applications are typically deposited on single crystal substrates, such as Si, perovskites, and sapphire. This material selection for the substrate can affect the structure and properties of the films. These structureproperty relationships can be tuned directly for implementation into semiconductor manufacturing processes.12, 13, 14, 15, 16, 1 Substrates are typically 500 m thick single crystal wafers.17, 18, 19 As substrates are the majority of the volume of thin film samples, isolating the properties and structure of the relatively small volume of the film is complex.
X-ray diffraction (XRD) is a primary technique for determining the atomic structure of crystalline films, which is often used alone or in combination with transmission electron microscopy, especially for epitaxial films.20, 21, 22, 23 However, for amorphous or disordered materials, traditional crystallographic methods, such as XRD, can miss local structure motifs that are uncorrelated at long ranges and not captured in an average structure model.24, 25 By using only Bragg scattering, XRD analysis excludes information from diffuse scattering and is unsuitable for probing structural features of amorphous materials.26, 27
The pair distribution function (PDF), a sine Fourier transform of total scattering data, uniquely provides local-, mid-, and long-range atomic structural information, even for disordered materials.28, 29, 30 During PDF measurements of powdered samples, scattering data are collected over a wide range of momentum transfer, , in transmission geometry. This requires short sample-to-detector distances and high-energy radiation, typically using synchrotron X-ray or spallation neutron sources.24, 31, 32
Billinge and collaborators demonstrated that powder methods of X-ray total scattering, i.e., acquiring data in transmission geometry, could also be applied to thin film materials on amorphous substrates.33 This involves collecting total scattering data from a thin film sample on a substrate and a substrate without a film and subtracting the latter from the former to isolate the thin film signal.33, 34, 35 The total scattering data for the film is then Fourier transformed to yield the PDF.
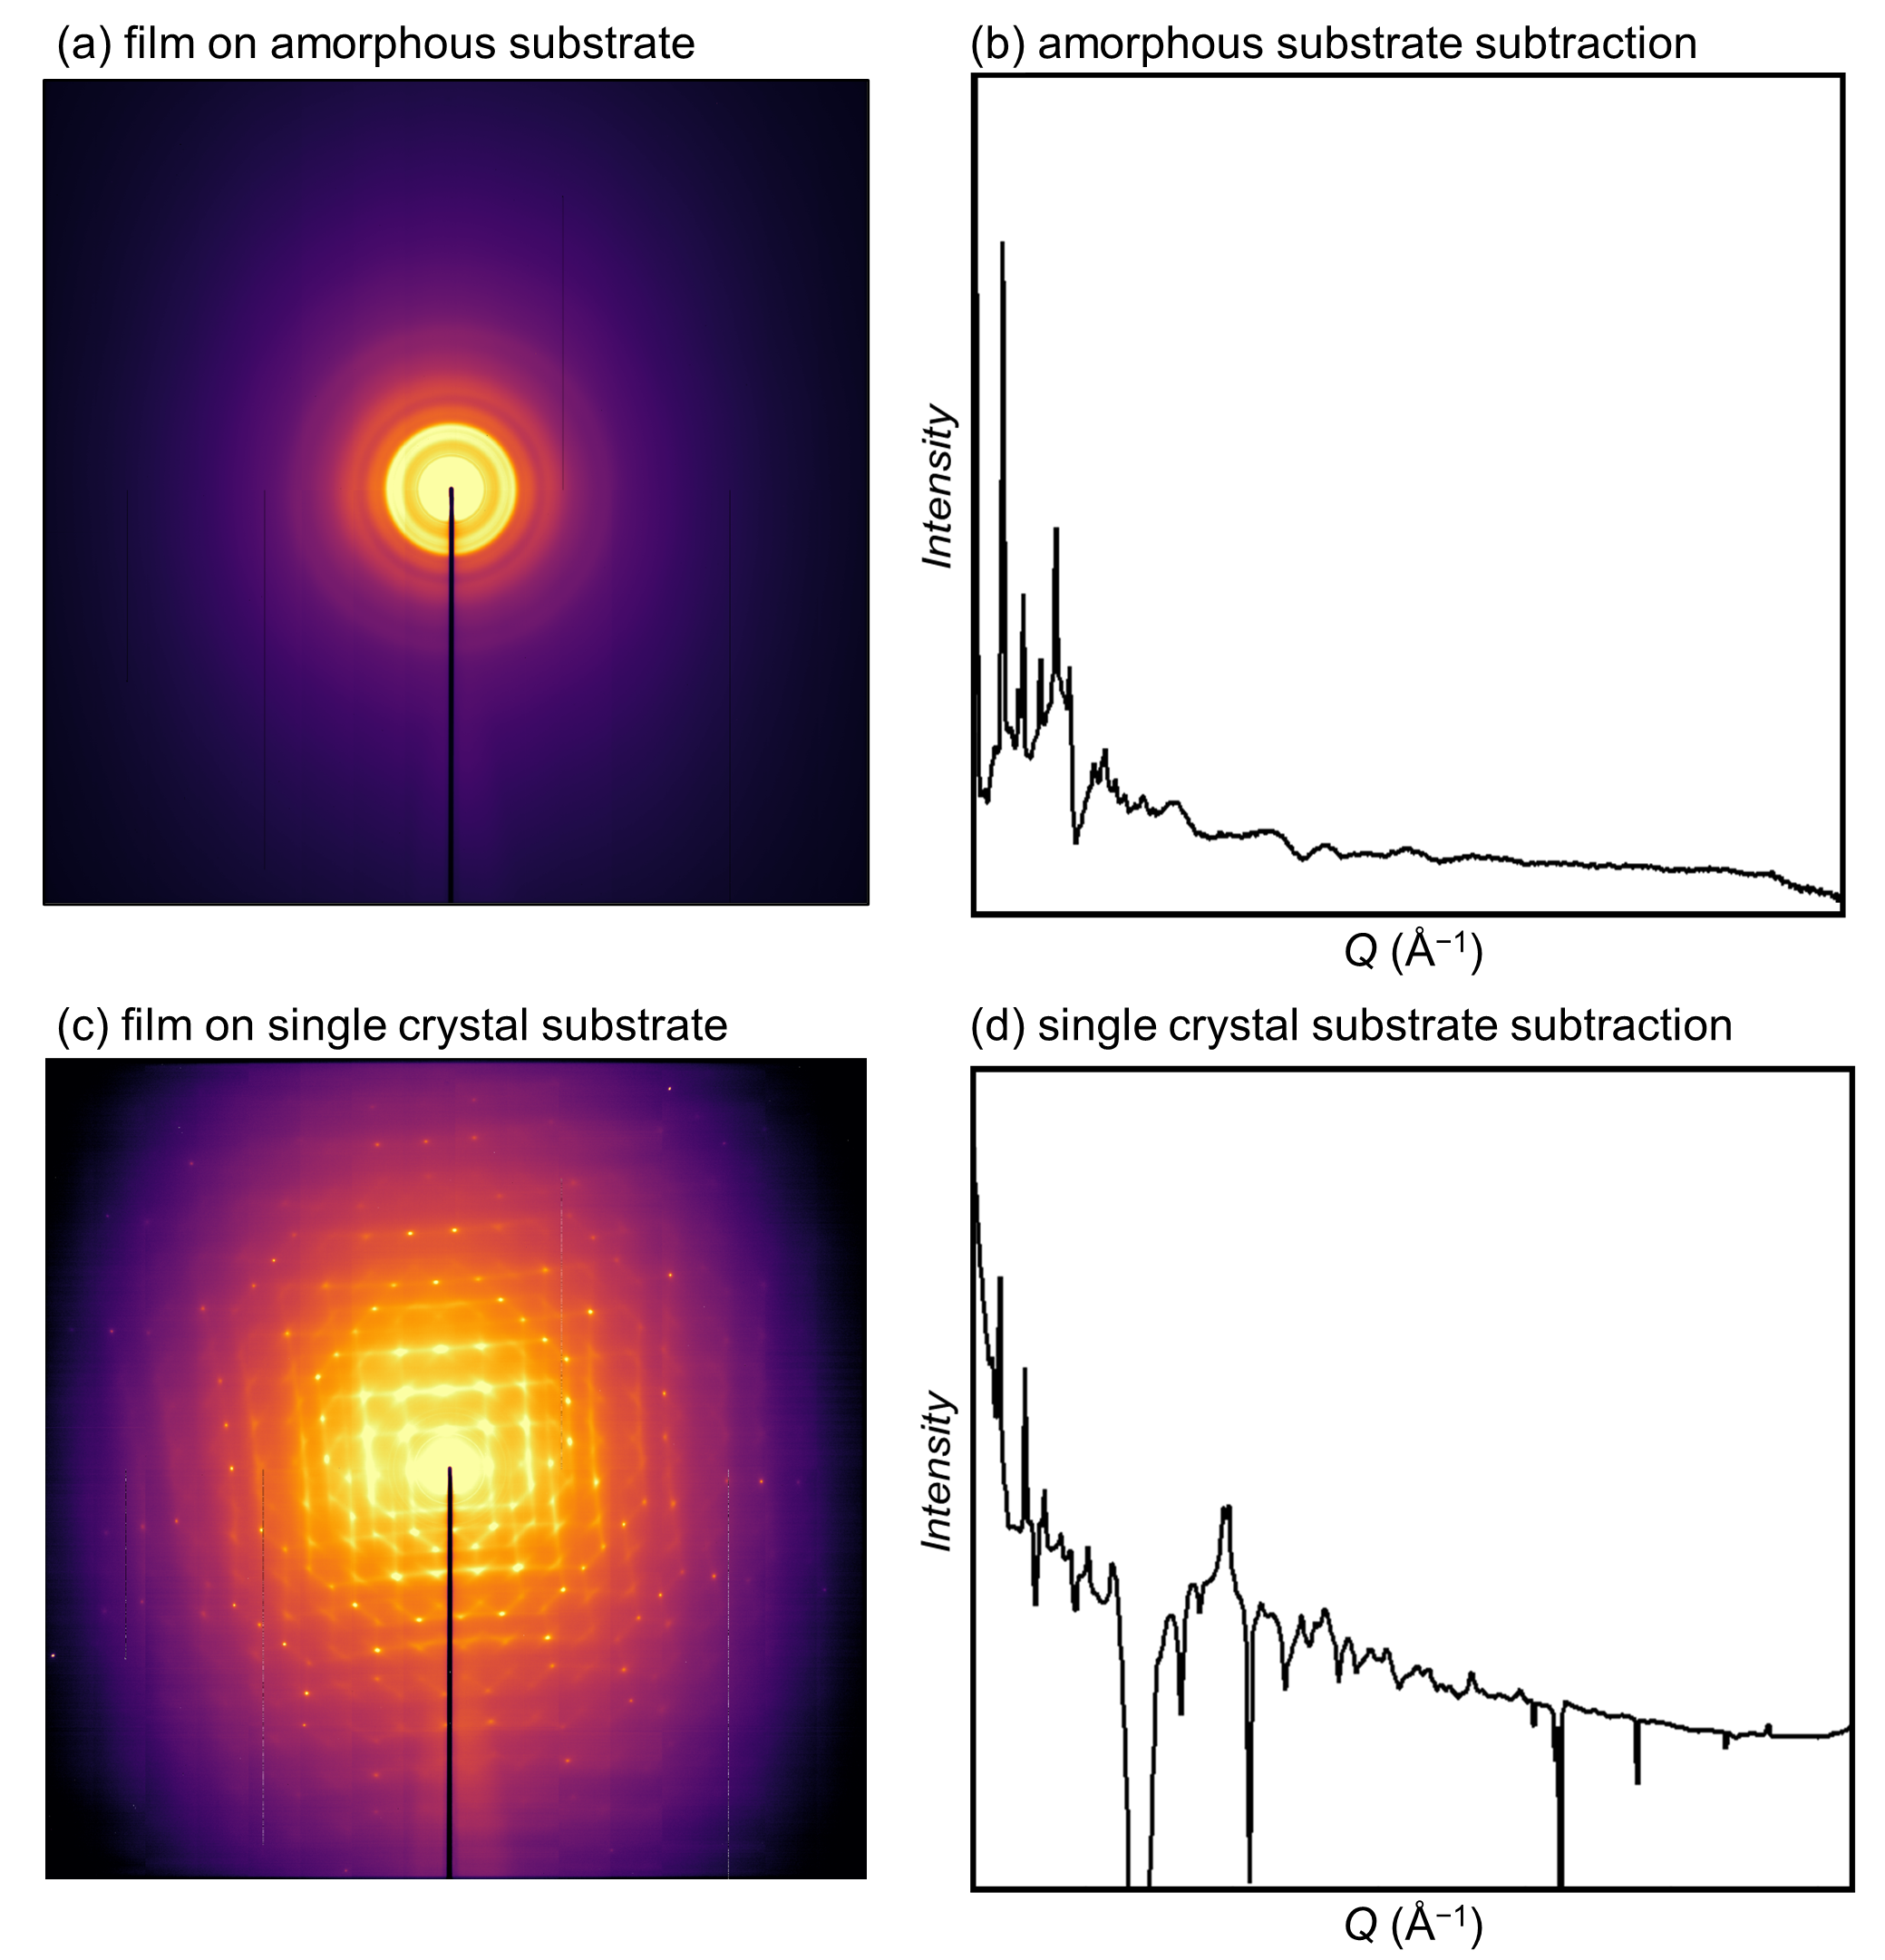
The smooth, directionally-independent scattering signal of amorphous substrates is advantageous for thin film PDF measurements, which makes the scaling and subtraction of substrate scattering relatively straight forward (Fig. 1a, b).33, 36 In contrast, scattering data for a similar thin film deposited on a (100)-oriented single crystal Si substrate has high intensity Si reflections that appear as spots in the two-dimensional (2D) image (Fig. 1c). With a single crystal substrate, subtraction of the scattering pattern from a blank substrate is ineffective, resulting in both residual signal and oversubtraction of the high intensity reflections. The resulting 1D scattered intensity, , as a function of momentum transfer, , [()]has contributions from the substrate in some places, and unphysical negative scattered intensity elsewhere (Fig. 1d). This is due to differences in the relative intensities of diffuse and Bragg scattering of the substrate with and without a thin film.37 The resulting subtracted signal would thus be inappropriate for generating PDF data. Therefore, an alternative to the subtraction process is needed to elucidate accurate structureproperty relationships for thin film samples on single crystal substrates, which alter their structure and properties.
To more effectively separate the X-ray total scattering signal of the thin film from that of its substrate, we use NMF to differentiate between the directionally-dependent and directionally-independent features. NMF and other machine learning algorithms have been previously applied in materials measurement science to classify and analyze data.38, 39, 40 Of particular relevance to this work, unsupervised machine learning algorithms excel in treating unlabeled input datasets and, in turn, generating organized or sorted datasets of interest.41, 42 Among these algorithms, non-negative matrix factorization (NMF) is a dimensionality reduction algorithm that accepts inputs from a non-negative matrix (composed solely of positive values) and produces feature and weight matrices that reconstruct the original data.43, 44 NMF is particularly useful for X-ray scattering data, which inherently only have positive values, especially for in situ experiments that generate 20 or more patterns.45, 46, 47, 48
We report a novel data processing method for X-ray total scattering data from thin films on single crystal substrates, IsoDAT2D. For an individual sample at ambient conditions, X-ray total scattering data are collected as a single 2D image, which is azimuthally integrated to a single, one-dimensional (1D) () dataset.49, 50, 51 A single dataset is incompatible with NMF, which identifies features across a series of individual datasets that occur with different weightings.52 The developed method uses a novel integration process that not only provides the data necessary for NMF, but also takes advantage of the differences of scattering features from the film and substrate. Using these input datasets for NMF results in many outputted ‘feature’ components. We use unsupervised machine learning clustering algorithms, specifically hierarchical agglomerative clustering (HAC), to group similar outputted components based on their features, which are expected to reflect their origin (i.e., film vs. substrate).53, 54 After clustering, components from one or more clusters are averaged and smoothed to thin film X-ray total scattering data of sufficiently quality for PDF analysis.
We developed and validated IsoDAT2D using synthetic data generated by our novel thin film X-ray scattering data creation program, SimDAT2D. We demonstrate IsoDAT2D on experimental X-ray total scattering thin film data, successfully isolating the isotropic scattering signal of a thin film on a single crystal substrate. Using the isolated signal, PDF data quality is significantly improved relative to substrate subtraction using a single crystal substrate. Further, PDF data from IsoDAT2D are of comparable quality to PDF data from amorphous substrate subtraction.
2 Developed Programs
2.1 SimDAT2D: Generating Synthetic 2D Scattering Data
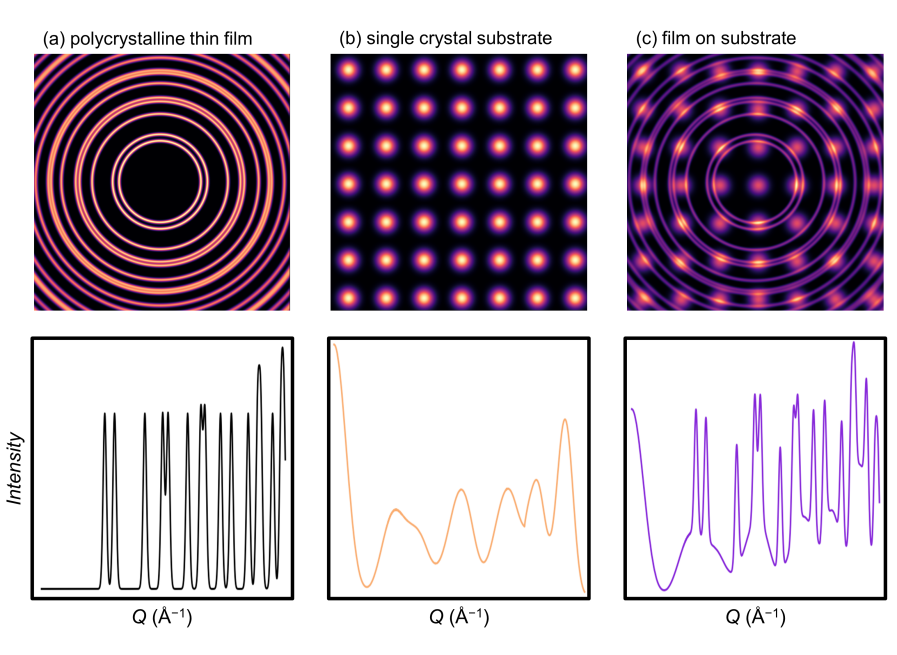
A key aspect of SimDAT2D is its use to generate synthetic X-ray scattering data from two or more distinct scattering contributions (e.g., isotropic, diffuse, anisotropic; Fig. 2). Each scattering contribution is generated individually and combined as a weighted linear combination into a single 2D detector image. This allows for the relative intensities to be varied and for each signal to be independently known. We created SimDAT2D to enable the generation of synthetic 2D X-ray scattering data and masks, as well as using those to perform azimuthal and rotational integrations of 2D data using the PyFAI Python library.51
Isotropic signals consisting of radially symmetric rings at discrete positions over a 2D detector image are created using PyFAI’s calibrant materials (30 unique options), taking into account user-defined wavelength, sample-to-detector distance, and detector type (e.g., PerkinElmer Silicon)(Fig. 2a). Anisotropic scattering signals, with diffraction spots at discrete positions on the 2D image, e.g., the scattering of a single crystal substrate, can be created manually as a grid of spots (Fig. 2b); for this, the user specifies the number of spots per line, the distance between spots, the diameter of spots (pixel width), and the Gaussian distribution of spot intensity. Alternatively, scattering patterns of any kind can be incorporated, for example, drawing upon existing tools to simulate patterns, such as SingleCrystalMaker®, which calculates single crystal diffraction patterns.55 Likewise, experimentally measured 2D detector images can be used.
Individual images are combined in a linear combination in with user defined relative weightings of each contribution (Fig. 2c). For example, to create an image that resembles a thin film on a single crystal substrate, increasing the relative weighting of the generated substrate signal results in intensity differences that qualitatively resemble experimental data. The images to be combined must have the same pixel dimensions; specifically, the program uses a 2048 2048 pixel grid, which is standard for many X-ray total scattering detectors.
In addition to combining multiple scattering patterns, SimDAT2D scattering patterns can incorporate noise of various levels, allowing for synthetic data that more closely resembles experimental data. Noise is generated as a 2D map as a randomized normal distribution of coefficients by which synthetic data are multiplied (Fig. S6).
2.2 IsoDAT2D: Identifying Isotropic Scattering Signals
We developed IsoDAT2D to identify isotropic scattering data from 2D detector images comprising isotropic and anisotropic contributions. From this, thin film PDF data can be acquired. The program processes thin film X-ray total scattering data using NMF and HAC (Fig. 3). This combination of machine learning algorithms eliminates the need for substrate subtraction, which is effective for films on amorphous substrates but not single crystal substrates.34, 33
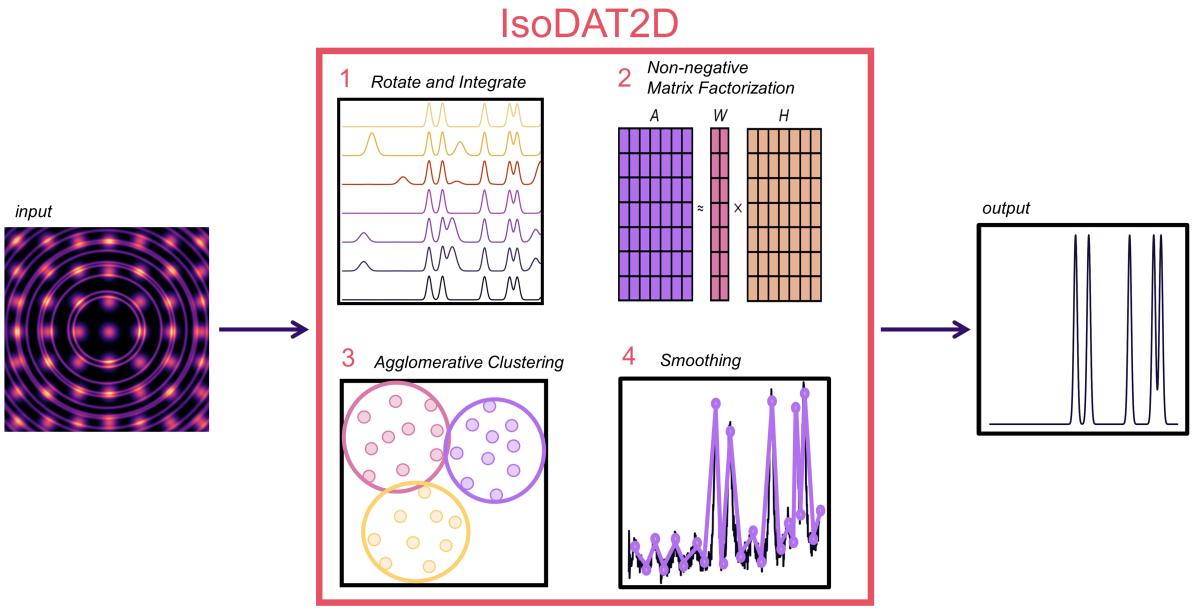
The first step of IsoDAT2D is a ‘rotation and integration’ (Fig. 3-1), which generates tens to thousands of 1D datasets from a single 2D image, as is needed for machine learning algorithms. These 1D datasets are inputs for NMF, (Fig. 3-2), which identifies recurring components over the series of datasets. Next, HAC is used to sort the components generated by NMF (Fig. 3-3), such that one or more of the resulting clusters contains components associated with the scattering pattern of the thin film. Of those clusters, one or more comprise components that resemble isotropic scattering (Fig. S4). The components in the cluster(s) are then averaged to a single () X-ray total scattering dataset. The dataset is smoothed to reduce noise introduced through the data processing (Fig. 3-4), ultimately returning an output of X-ray total scattering data from which PDF data can be derived. These steps and key parameters are further discussed following, with example inputs and outputs based on data generated using SimDAT2D. Details on data generation for the demonstrative example are described in Supplementary Information (Section S1.1).
2.2.1 Rotation and Integration
2D X-ray total scattering data are typically azimuthally integrated into a single 1D () dataset. In the current data processing workflow, multiple narrow integrations are used instead. These allow us to exploit the inherent difference between radially-dependent (anisotropic) patterns of Bragg spots from a single crystal substrate and radially-symmetric (isotropic) scattering from an amorphous or polycrystalline thin film (Fig. 4). These many discrete integrations also enable the use of machine learning methods for data processing, which require multiple input datasets.56, 57
Bragg diffraction from single crystals occurs at discrete points in space,58 resulting in high-intensity spots in patterns that reflect the symmetry of the crystal structure.59 In addition, high-quality single crystal substrates, such as single crystal Si, have phonon-phonon interactions that contribute weak–but detectable–diffuse scattering (Fig. 1c).60, 61 Powder samples can be approximated as a collection of small single crystals with random orientations relative to one another. This gives discrete points across all positions of scattering cones, creating isotropic rings in detector images.62, 32 Likewise, untextured thin films (e.g., polycrystalline, nanocrystalline, amorphous) have radially-symmetric scattering.
X-ray total scattering data for PDF analysis are typically acquired at synchrotron facilities in transmission geometries over a wide range using 2D detectors.63, 64, 65 Our rotational integration uses these 2D scattering images with other standard integration inputs, such as detector calibration parameters (e.g., PONI in PyFAI), sample-to-detector distance, and X-ray wavelength.51
For standard X-ray total scattering measurements, masks are used to exclude features from the integration, such as signals from a beam stop and dead detector pixels, covering no more than 20% of the image area. In contrast, we use masks to discretize the detector area to generate many 1D linescans. For this, masks leave only a small fraction of the detector area exposed, 1%; thus only small image areas are integrated at a time (Fig. 4, right). After an integration, the image is rotated by a user-defined angle and an integration is taken over the new exposed area. This is repeated until the whole 2D area is integrated.
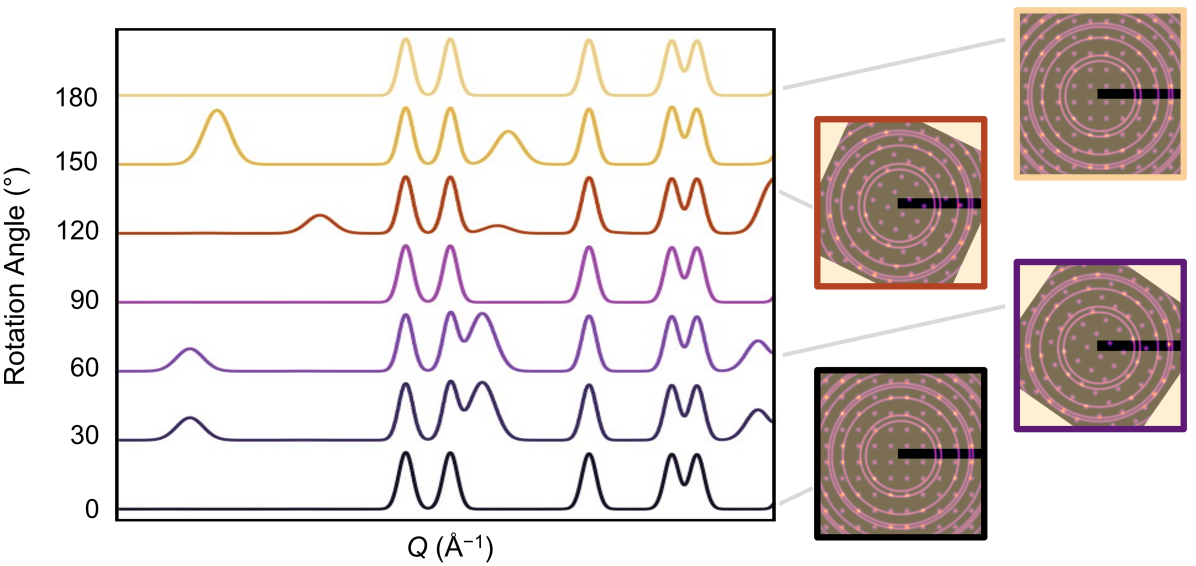
Figure 4 shows an example of line integrations taken at 30∘ rotational intervals. In the resulting integrated data, a set of peaks occurs at the same position and intensity in each dataset; this is the isotropic signal from the thin film. Other features change position and intensity between datasets; these are from the anisotropic Bragg spots from the single crystal substrate.
The shape and size of the integrated area can be modified by selecting the mask(s) and the number of integrations can be varied by the degree of rotation (see Supplementary Information, Section S1.2). For the NMF input, having a sufficient number of datasets is essential for identifying the isotropic scattering signal, which is enabled by the redundancy of those features across integrated input 1D datasets.
To generate larger data series with various contributions of isotropic and anisotropic signals, 1D datasets from a combination of mask geometries and rotational angles can also be used. For example, masks with various numbers of sectors and differences in their widths and offsets can be used. We investigated this ‘multi-mask’ approach in application to SimDAT2D-generated synthetic data, the results of which are described in the Supplementary Information (Section S1.3).
The frequent occurrence of features enhances the likelihood of the desired signal being successfully identified by NMF.66 To balance redundancy and computational expense we find that a minimum of 360 integrated datasets per 2D image should be used (Fig. S3). However, with access to computational resources, the use of more input datasets improves the efficacy of signal identification describes in the Supplementary Information (Section S1.3).
2.2.2 Non-Negative Matrix Factorization
NMF was originally developed to reduce the amount of data required to describe a system or phenomenon. Its ability to do this can be used to identify meaningful components in a series of data. The ‘non-negative’ in NMF reflects that inputted data, identified components, and the weights of those components contain only positive values.67
The mathematical process behind NMF is designed to decrease the Euclidean distances between separate non-negative matrices. To achieve this, a Frobenius norm loss function, , is implemented as a metric for the magnitude of the difference between the inputted and feature matrices. The features matrix, , contains components that, when weighted according to matrix , reproduce the original inputted matrix, .68 In the context of this work, the matrix contains components that correspond to scattering from specific sample elements, i.e., the single crystal substrate and the thin film.
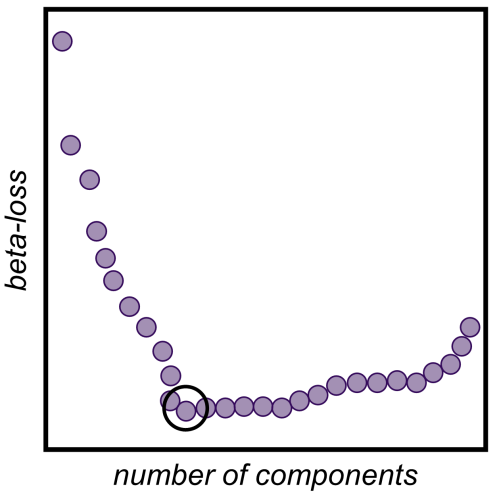
In our use of NMF, we employ a process that minimizes the Euclidean distance using beta-divergence as the metric to iterate through different numbers of output components in the feature matrix. 69 To illustrate, when the original input matrix contains 360 datasets, our application runs NMF with the number of component values from 2 to 360, and then selects the smallest number of components that produce the lowest beta divergence (Fig. 5).
We implement Scikit-learn’s NMF algorithm, which is initialized with randomized parameter variables, including initializer, solver, beta-loss, and tolerance.70 In our implementation of NMF, the series of 1D () integrations generated from rotation and integration are used as the original matrix, . We use the data as integrated, without normalization, which enables us to later sort the data based on variance that would be lost with normalization.71
The initializer defines the method selected to run the program, the solver determines which numerical optimizer is used, beta-loss specifies the beta-divergence minimization function, and the tolerance indicates the proximity to a specific value of beta-divergence that must be reached to end the process.72 The described NMF process is repeated for a user-defined number of iterations and returns the feature matrix, , with the minimum beta-divergence. The number of components at which the beta-divergence is minimized appears as a discontinuity in the beta-loss as a function of the number of components (Fig. 5). This ‘elbow’ indicates when the amount of components required to recreate the dataset has been identified.
Depending on the nature of the inputted data, the identified feature matrix may contain thousands of components. A challenge of NMF is appropriately sorting the identified components. To manage this, we implement data science tools to help identify the component(s) that correspond to the thin film X-ray total scattering signal.
2.2.3 Hierarchical Agglomerative Clustering
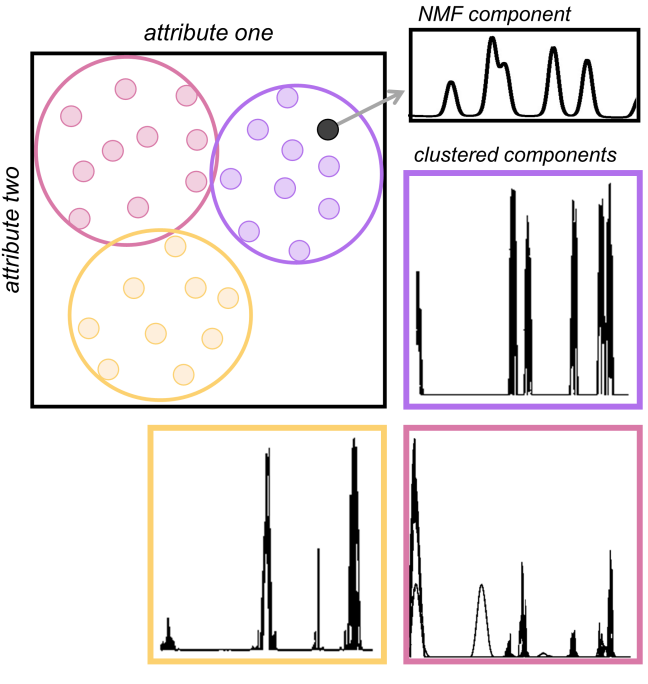
We use HAC to efficiently sort components identified by NMF (Fig. 6). The process groups NMF components based on similarities, creating ‘clusters’ of like components. As a ‘bottom-up’ approach, agglomerative clustering initiates many small clusters that are merged to create larger ones, unlike a ‘top-down’ approach, in which a single large cluster is progressively divided into smaller structures.73, 74 Using agglomerative clustering, we are able to assign the number of initial clusters into which outputted NMF components must converge.
For the implementation of agglomerative clustering in IsoDAT2D, the number of clusters is user-defined and informed by the number of scattering phenomena expected to contribute to the measured total scattering signal. The algorithm should produce separate clusters associated with each type of scattering, for example, at least two clusters for single crystal substrates, which have diffuse scattering and Bragg spots.
We use variance as the cluster sorting parameter, which supports the assignment of components to appropriate clusters in our unnormalized data. This leverages high variance of scattering intensity from features associated with the thin film and the substrate, which results from their relative volumes. Specifically, our clustering approach employs Ward’s method, a widely-used linkage criterion that minimizes the Euclidean distance between points in the parameter space.53, 75 Ward’s method is particularly effective for our data as it efficiently accounts for the variations in scattering intensities to ensure robust clustering. This allows us to identify and separate signals of interest from the NMF output matrix components, enhancing the quality of the resulting data and providing valuable insights into the scattering phenomena.
After HAC, the 1D datasets in each cluster are plotted and visually evaluated by the user to assess if the data in the cluster resemble isotropic scattering. We found there to typically be multiple clusters with these contributions (Fig. S3 & 4). Further, the identified components within the clusters contain moderate noise from previous data processing steps. To reduce processing noise and have a singular 1D dataset, an approach has been created to average and smooth the identified components.
2.2.4 Averaging and Smoothing
In typical total scattering data processing, azimuthally integrating 2D images improves counting statistics and the resulting data quality. Here, the individual line integrations do not have this benefit, but statistics are improved by merging clustered components, which, despite being in one cluster, are not identical. This averaging is reminiscent of the angular averaging inherent to the higher data quality achieved with azimuthal integration. 76
Components of the selected cluster(s) are normalized to uniform scaling and then averaged to a single 1D dataset. However, the narrow integrations and NMF results in more noise than an azimuthal integration. To address this, we implement a Savitzky-Golay filter from the SciPy library, which uses a polynomial fit to smooth high-variance regions in the data.77, 78 This reduces noise while preserving key features of the data. Additional considerations for working with noise are described in the Supplementary Information (Section S1.4).
3 Experiments and Results
We validated the capabilities of IsoDAT2D to separate signals of interest using synthetic data generated by our SimDAT2D program. Using these synthetic data, in which the ‘answer’ data could be simulated directly and compared to the identified signal, we assessed the effects of parameters such as masking, noise, and integration resolution (Supplementary Information, Section S1).79 Experiments using synthetic data, described in the Supplementary Information (Section S1.1) were used to qualitatively evaluate IsoDAT2D’s performance and inform parameters to minimize noise and optimize isotropic signal identification.
Building on the insights gained from synthetic data experiments, we applied IsoDAT2D to experimental X-ray total scattering data collected from a 300 nm thick polycrystalline film of Ge2Sb2Te5 (GST) on a 500 m single crystal Si substrate (synthesis and data acquisition information provided in Supplementary Information, Section S2.1). We qualitatively compare the () and () data for this film processed using IsoDAT2D and substrate subtraction. We also compare data from a film of the same composition and thickness on an amorphous SiO2 substrate processed using substrate subtraction.
3.1 Substrate Subtraction
Following previous methods, the X-ray total scattering data for GST on SiO2 and Si substrates were isolated by integrating 2D data collected of the thin film samples and of the substrates without films, then scaling and subtracting the latter from the former.33 For this process, 2D detector images were azimuthally integrated to 1D linescans with identical masks using PyFAI51, resulting in 1D linescans. The () of the substrates were scaled to maximize their intensity without exceeding the intensity of the corresponding thin film sample data. The scaled data from the substrate were then subtracted from the film-on-substrate data, leaving a signal comprising data from only the thin film (Fig. S9, Fig. 7). Using PDFgetX3,80 the substrate-subtracted 1D linescan was Fourier transformed to PDF data with = 14 Å-1 (Fig. 7).
3.2 IsoDAT2D Component Identification
X-ray total scattering data from the GST thin film on a single crystal Si substrate were also processed using IsoDAT2D. A single 2D detector image was sequentially rotated and integrated using several combinations of parameters (e.g., mask geometry, number of datasets, resolution, etc.). The resulting 1800 datasets with 2500 data points resulting from the use of five separate masks balanced the clarity of signal features and noise effects.
For rotation and integration, five iterations of single and multi-sector masks were used with 1, 2, 3, 4, and 5 slices of 0.5 px width rotated every 1∘ to produce 1800 1D datasets (Supplementary Information, Section S1.3). Similar to experiments with synthetic data, using these experimental data we found that this number of datasets balanced computational efficiency and data quality, especially the signal-to-noise ratio (Fig. S5).
We selected a data point resolution for integration of 2500 points, which balanced signal identification and noise effects (Supplementary Information, Section S1.4). With higher data point resolutions, the program’s output had significant noise. Using lower data point resolutions, the program identified signal features that were unphysical, especially peak widths and isolated signals that were not suitable for PDF analysis.
From the generated 1D datasets, NMF components that resemble the GST signal of interest were identified in several clusters. Data from these clusters were averaged and smoothed to a single () dataset. These data required some further processing for the intensity to approach zero with increasing due to processing effects. For this, the value of the lowest intensity point was subtracted from the data. Subsequently, the dataset was multiplied by a Gaussian function to mitigate unphysical high- features, resulting in () data suitable for PDF analysis. The () data were transformed to () with PDFgetX3 using a = 14 Å-1.80
3.3 Comparison of Data from Each Processing Method
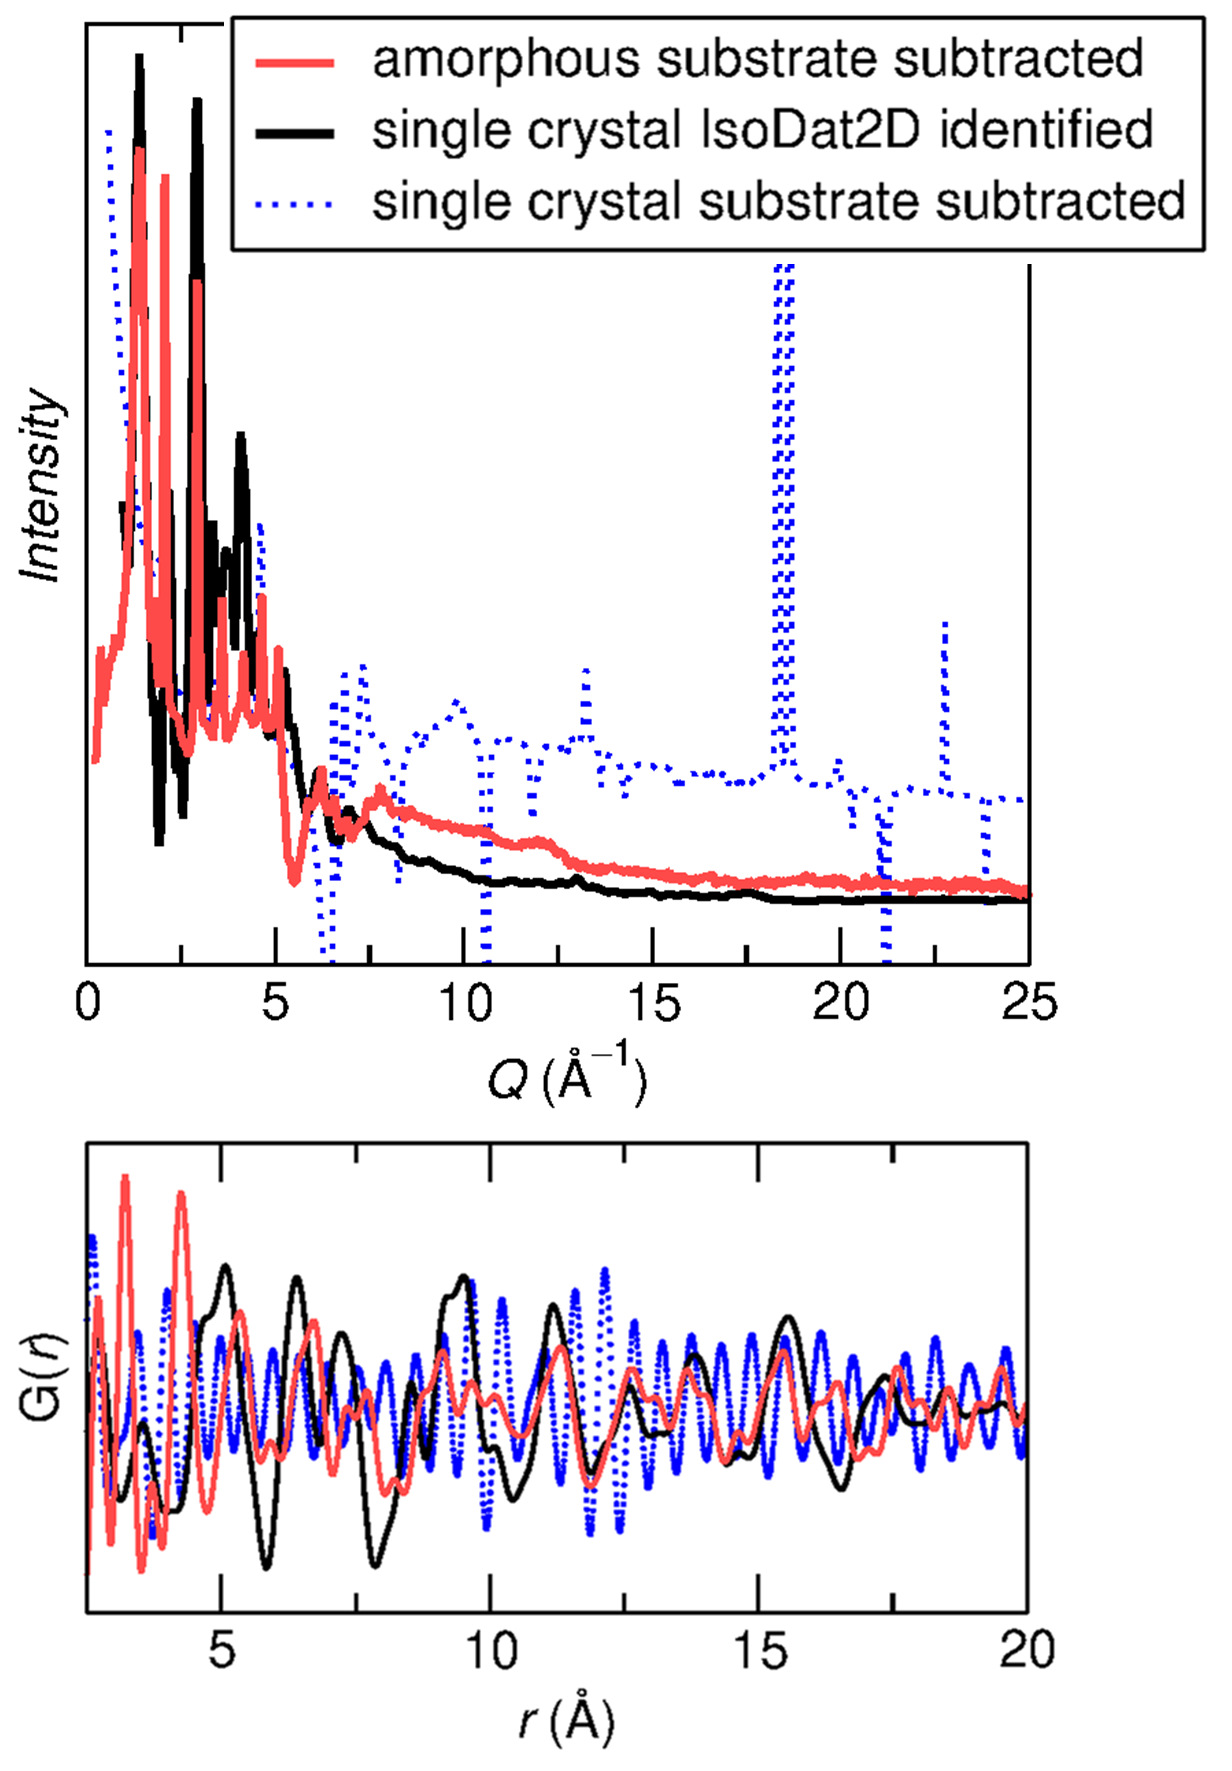
Identified X-ray total scattering data from amorphous substrate subtraction and IsoDAT2D are qualitatively similar (Fig. 7). In contrast, single crystal Si substrate subtraction data has unphysical features due to the oversubtraction of high intensity single crystal Bragg spots. Data for amorphous substrate subtraction are aligned with our expectations of X-ray total scattering data, especially the decrease of intensity of features with increasing . The IsoDAT2D-identified () signal is similar in its overall variation of intensity with , affirming the efficacy of the processing method. The positions of peaks in these two () signals are also consistent, with the primary difference between the identified signals being peak geometry, especially peak widths and the relative intensities of reflections in each pattern. Overall, this comparison highlights that the () data from IsoDAT2D are comparable with those from the previous method used for thin film PDF, highlighting the promise of accessing atomic structure information from thin films deposited on single crystal substrates using X-ray total scattering. 33
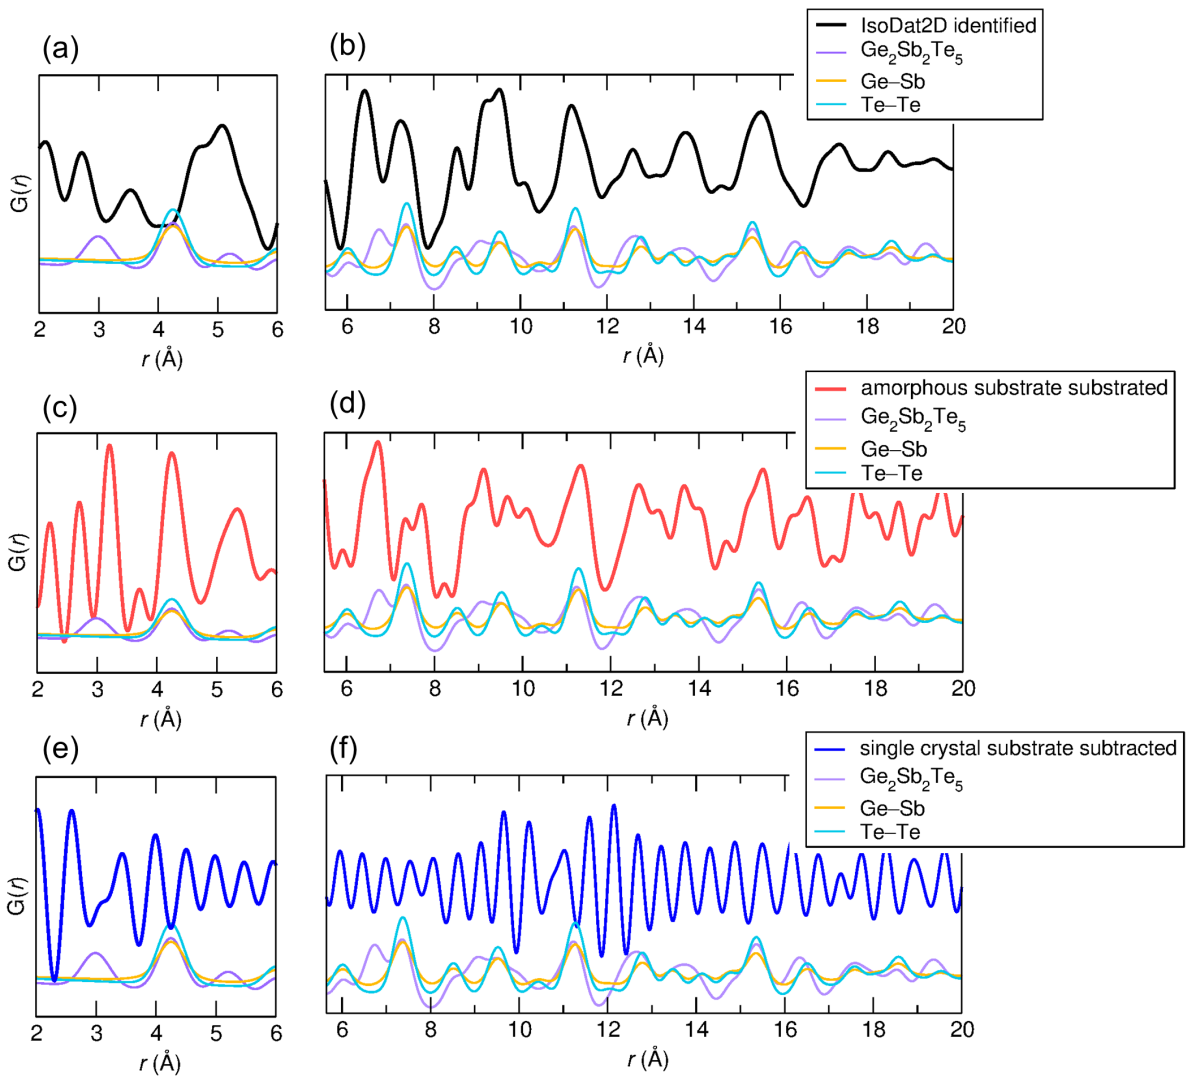
The () data from each processing method were Fourier transformed to generate PDF data (Fig. 7 bottom) using PDFGetX3.80 The PDF, (), were compared to one another, as well as to calculated PDFs and TeTe and GeSb partial PDFs for GST. Calculated data were based on a GST model from neutron PDF analysis81 and were calculated using PDFgui (Fig. 8) 82.
Similarities and differences between the () signals are reflected in the resulting PDF data. For amorphous substrate subtraction and IsoDAT2D, PDF data are qualitatively similar, with correlations consistent with our expectations for a polycrystalline material. In contrast, PDF data from the single crystal substrate subtraction show termination ripples and high-frequency noise, making it entirely unsuitable for deriving even qualitative information about atomic structure.
In the low range, PDF data from amorphous substrate subtraction and IsoDAT2D processes miss the first correlation centered at 3 Å (Fig. 8a & c). For the second and third correlations, the amorphous substrate-subtracted data match calculated correlations between 4 Å and 6 Å (Fig. 8c). Local structure correlations in IsoDAT2D-identified data are less consistent with calculated data (Fig. 8a), exhibiting a single broad correlation at 5 Å rather than the two correlations near 4.2 Å and 5.2 Å. At higher ranges, representing mid-range and average structure features, both the amorphous substrate-subtracted and IsoDAT2D-identified signals exhibit strong similarities with the calculated signal, accounting for most of the correlations (Fig. 8 b, d). Overall, the PDF data from the IsoDAT2D process is of similar quality to the data from amorphous substrate subtraction.
4 Discussion
While there are established methods for identifying the scattered signal from thin films on amorphous substrates, the same approach cannot be applied to films on single crystal substrates (Fig. S9). To address this mismatch between measurement needs and capabilities, we developed IsoDAT2D to enable the measurement of atomic structures for amorphous and nanocrystalline thin films on single crystal substrates, a class of materials that have not been previously measurable with transmission geometry X-ray total scattering. IsoDAT2D effectively isolates the total scattering signal from a thin film on a single crystal substrate, from which PDF data for the film can be generated. With this approach, we enable PDF analysis of polycrystalline, nanocrystalline, and amorphous thin films on single crystal substrates without compromising , as in grazing incidence experiments.34
The method we report leverages inherent differences in the 2D symmetry of the scattering patterns of the film and substrate, using hundreds to thousands of line integrations rather than a single azimuthal integration over the 2D detector image. The resulting 1D integrations are inputs for NMF, from which identified components are sorted using HAC, ultimately returning an output that is the X-ray total scattering of the isotropic component (i.e., the thin film).
Using synthetic data, we found that increasing the number and variety of features in 1D integrations by using a variety of mask geometries and orientations increases the likelihood of identifying the signal of interest and decreases the noise associated with these narrow integrations. However, increasing the amount of input data also increases computational expense, especially for the currently implemented NMF algorithm, which requires both significant memory and computational power.
In addition to high-fidelity identification from synthetic data, IsoDAT2D identified the thin film scattering signal from experimental data. The thin film scattering signal returned by the algorithm was consistent with that identified using conventional substrate subtraction methods from an analogous thin film on an amorphous substrate.
Thin film PDF data are challenging to collect, and we find that both the amorphous substrate-subtracted and IsoDAT2D-identified scattering signals deviate from expectations in the local structure. However, their mid-range structures were consistent with one another and simulated PDF data of the published structure.81 While the amorphous substrate subtraction and IsoDAT2D approaches effectively capture mid-range correlations, the local structure features from both methods differ from the calculated PDF. Since both methods have discrepancies between measured and calculated local structure, this could be a common limitation, or at least challenge, of applying PDF to thin film samples. Similarly, substrate subtraction and IsoDAT2D are so far limited to relatively thick films, with successful demonstration previously and here on films 300 thick.33 However, having validated the capabilities of this machine learning data processing approach, improvements can be made to further push the boundaries of the types of samples to which PDF analysis can be applied, such as thinner films.
Due to the similar strengths and shortcomings of both processing methods, we conclude that IsoDAT2D enables similar quality PDF data as the substrate subtraction method, but can uniquely be applied to films on single crystal substrates. In the illustrative example shown here, to probe the crystalline structure of a phase change material, differences in structure and, accordingly, properties are not expected to depend on the substrate. However, IsoDAT2D enables PDF data from thin film samples for which structure and function are directly affected by the substrate. 83, 84, 85
5 Conclusions
We developed IsoDAT2D to identify thin film X-ray total scattering signals from signal crystal anisotropic signals. Combining a novel approach for integrating 2D scattering images with NMF and HAC machine learning algorithms, IsoDAT2D effectively identifies isotropic scattering signals.
To validate the algorithm’s performance, we created SimDAT2D, which generates synthetic 2D images representative of scattering from thin films on single crystal substrates, allowing for the comparison of algorithm-identified signals with a known synthetic signal. Further, SimDAT2D is a valuable tool for exploring the effects of various parameters on algorithm performance, offering insights into IsoDAT2D’s capabilities and informing data processing approaches specific to the nature of the film and substrate.
Beyond thin film characterization, IsoDAT2D and similar approaches may be applicable to other materials systems and data in which there are constant and dynamic signals of interest, i.e., from in situ and operando scattering experiments. By advancing our understanding of structureproperty relationships in application-relevant thin film materials, these tools pave the way for fundamental and technological advancements.
6 Conflicts of Interest
None to report.
7 Acknowledgments
The authors acknowledge the University of Florida Research Computing for providing computational resources and support that have contributed to the research results reported in this publication. This research used the Pair Distribution Function Beamline (PDF) of the National Synchrotron Light Source II, a U.S. Department of Energy (DOE) Office of Science User Facility operated for the DOE Office of Science by Brookhaven National Laboratory under Contract No. DE-SC0012704. The authors would also like to acknowledge Dr. David Adams at Sandia National Laboratory for providing thin film samples.
References
- 1 Bauer, J. J.; Rosenberg, E. R.; Kundu, S.; Mkhoyan, K. A.; Quarterman, P.; Grutter, A. J.; Kirby, B. J.; Borchers, J. A.; Ross, C. A. Dysprosium Iron Garnet Thin Films with Perpendicular Magnetic Anisotropy on Silicon. Adv. Electron. Mater. 6, 1900820
- 2 Scott, E. A.; Ziade, E.; Saltonstall, C. B.; McDonald, A. E.; Rodriguez, M. A.; Hopkins, P. E.; Beechem, T. E.; Adams, D. P. Thermal conductivity of (GeSbTe)C phase change films. J. Appl. Phys. 128, 155106
- 3 Raoux, S.; Xiong, F.; Wuttig, M.; Pop, E. Phase change materials and phase change memory. MRS Bull. 39, 703–710
- Onbasli et al. 2016 Onbasli, M. C.; Beran, L.; Zahradník, M.; Kučera, M.; Antoš, R.; Mistrík, J.; Dionne, G. F.; Veis, M.; Ross, C. A. Optical and magneto-optical behavior of cerium yttrium iron garnet thin films at wavelengths of 200–1770 nm. Sci. Rep. 2016, 6, 23640
- Nishida et al. 2018 Nishida, J.; Breen, J. P.; Lindquist, K. P.; Umeyama, D.; Karunadasa, H. I.; Fayer, M. D. Dynamically disordered lattice in a layered PB-i-scn perovskite thin film probed by two-dimensional infrared spectroscopy. J. Am. Chem. Soc. 2018, 140, 9882–9890
- Mack 2011 Mack, C. A. Fifty Years of Moore’s Law. IEEE T-ASE 2011, 24, 202–207
- Dapkus 1982 Dapkus, P. D. Metalorganic chemical vapor deposition. Annu. Rev. Mater. Sci. 1982, 12, 243–269
- Kandel et al. 2024 Kandel, H.; Arndt, N.; Li, Z.; Lee, J.; Yao, Y.; Roy, S.; Cunliffe-Owen, H.; Reznik, D.; Eom, C.-B. Epitaxial growth and characterization of (110)-oriented YBCO/PBCGO bilayer and YBCO/PBCGO/YBCO trilayer heterostructures. J. Appl. Phys. 2024, 135, 135301
- Abegunde et al. 2019 Abegunde, O. O.; Akinlabi, E. T.; Oladijo, O. P.; Akinlabi, S.; Ude, A. U. Overview of thin film deposition techniques. AIMS Mater. Sci. 2019, 6, 174–199
- Kotsonis et al. 2020 Kotsonis, G. N.; Meisenheimer, P. B.; Miao, L.; Roth, J.; Wang, B.; Shafer, P.; Engel-Herbert, R.; Alem, N.; Heron, J. T.; Rost, C. M. Property and cation valence engineering in entropy-stabilized oxide thin films. Phys. Rev. Mater. 2020, 4, 100401
- Ceballos et al. 2021 Ceballos, A.; Pattabi, A.; El-Ghazaly, A.; Ruta, S.; Simon, C. P.; Evans, R. F. L.; Ostler, T.; Chantrell, R. W.; Kennedy, E.; Scott, M.; Bokor, J.; Hellman, F. Role of element-specific damping in ultrafast, helicity-independent, all-optical switching dynamics in amorphous (Gd,Tb)Co thin films. Phys. Rev. B 2021, 103, 024438
- Im et al. 1997 Im, J. S.; Sposili, R. S.; Crowder, M. A. Single-crystal Si films for thin-film transistor devices. Appl. Phys. Lett. 1997, 70, 3434–3436
- Seo et al. 2022 Seo, H. K.; Ryu, J. J.; Lee, S. Y.; Park, M.; Park, S.-G.; Song, W.; Kim, G. H.; Yang, M. K. Material and Structural Engineering of Ovonic Threshold Switch for Highly Reliable Performance. Adv. Electron. Mater. 2022, 8, 2200161
- Ivanov and Chelnokov 1992 Ivanov, P. A.; Chelnokov, V. E. Recent developments in SiC single-crystal electronics. Semicond. Sci. Technol. 1992, 7, 863
- McLellan et al. 2023 McLellan, R. A. et al. Chemical Profiles of the Oxides on Tantalum in State of the Art Superconducting Circuits. Adv. Sci. 2023, 10, 2300921
- Rosenberg et al. 2021 Rosenberg, E. R.; Litzius, K.; Shaw, J. M.; Riley, G. A.; Beach, G. S. D.; Nembach, H. T.; Ross, C. A. Magnetic Properties and Growth-Induced Anisotropy in Yttrium Thulium Iron Garnet Thin Films. Adv. Electron. Mater. 2021, 7
- Nishino et al. 1983 Nishino, S.; Powell, J. A.; Will, H. A. Production of large‐area single‐crystal wafers of cubic SiC for semiconductor devices. Appl. Phys. Lett. 1983, 42, 460–462
- Zhao 2004 Zhao, J. Recent advances of high-efficiency single crystalline silicon solar cells in processing technologies and substrate materials. Sol. Energy Mater. 2004, 82, 53–64
- Padiyath et al. 1993 Padiyath, R.; Seth, J.; Babu, S. V.; Matienzo, L. J. Deposition of copper films on silicon substrates: Film purity and silicide formation. J. Appl. Phys. 1993, 73, 2326–2332
- Hsu and Raj 1992 Hsu, W.-Y.; Raj, R. MgO epitaxial thin films on (100) GaAs as a substrate for the growth of oriented PbTiO3. Appl. Phys. Lett. 1992, 60, 3105–3107
- Osherov et al. 2007 Osherov, A.; Ezersky, V.; Golan, Y. The role of solution composition in chemical bath deposition of epitaxial thin films of PbS on GaAs(100). J. Cryst. Growth 2007, 308, 334–339
- dos Santos et al. 2003 dos Santos, A. F. M.; Cheetham, A. K.; Tian, W.; Pan, X.; Jia, Y.; Murphy, N. J.; Lettieri, J.; Schlom, D. G. Epitaxial growth and properties of metastable BiMnO3 thin films. Appl. Phys. Lett. 2003, 84, 91–93
- Kim et al. 2013 Kim, H.; Meng, Y.; Rouviére, J.-L.; Isheim, D.; Seidman, D. N.; Zuo, J.-M. Atomic resolution mapping of interfacial intermixing and segregation in InAs/GaSb superlattices: A correlative study. J. Appl. Phys. 2013, 113, 103511
- Egami and L. 2003 Egami, T.; L., B. S. J. Underneath the Bragg Peaks: Structural Analysis of Complex Materials; Pergamon, 2003
- Laurita et al. 2017 Laurita, G.; Fabini, D. H.; Stoumpos, C. C.; Kanatzidis, M. G.; Seshadri, R. Chemical tuning of dynamic cation off-centering in the cubic phases of hybrid tin and lead halide perovskites. Chem. Sci. 2017, 8, 5628–5635
- Ohara et al. 2021 Ohara, K.; Onodera, Y.; Murakami, M.; Kohara, S. Structure of disordered materials under ambient to extreme conditions revealed by synchrotron x-ray diffraction techniques at SPring-8—recent instrumentation and synergic collaboration with modelling and topological analyses. J. Condens. Matter Phys. 2021, 33, 383001
- Playford et al. 2014 Playford, H. Y.; Owen, L. R.; Levin, I.; Tucker, M. G. New insights into complex materials using reverse Monte Carlo modeling. Annu. Rev. Mater. Sci. 2014, 44, 429–449
- Butala et al. 2018 Butala, M. M.; Doan-Nguyen, V. V. T.; Lehner, A. J.; Göbel, C.; Lumley, M. A.; Arnon, S.; Wiaderek, K. M.; Borkiewicz, O. J.; Chapman, K. W.; Chupas, P. J.; Balasubramanian, M.; Seshadri, R. Operando Studies Reveal Structural Evolution with Electrochemical Cycling in Li–CoS2. J. Phys. Chem. C 2018, 122, 24559–24569
- Hartl et al. 2016 Hartl, M.; Gillis, R. C.; Daemen, L.; Olds, D. P.; Page, K.; Carlson, S.; Cheng, Y.; Hügle, T.; Iverson, E. B.; Ramirez-Cuesta, A. J. Hydrogen adsorption on two catalysts for the ortho- to parahydrogen conversion: Cr-doped silica and ferric oxide gel. Phys. Chem. Chem. Phys. 2016, 18, 17281–17293
- Chepkemboi et al. 2022 Chepkemboi, C.; Jorgensen, K.; Sato, J.; Laurita, G. Strategies and Considerations for Least-Squares Analysis of Total Scattering Data. ACS omega 2022, 7, 14402–14411
- Proffen et al. 2003 Proffen, T.; Billinge, S.; Egami, T.; Louca, D. Structural analysis of complex materials using the atomic pair distribution function — a practical guide. Z. Kristallogr. Cryst. Mater. 2003, 218, 132–143
- Sivia 2011 Sivia, D. Elementary Scattering Theory; Oxford University PressOxford, 2011
- Jensen et al. 2015 Jensen, K.; Blichfeld, A. B.; Bauers, S. R.; Wood, S. R.; Dooryhée, E.; Johnson, D. C.; Iversen, B. B.; Billinge, S. J. Demonstration of thin film pair distribution function analysis (tfPDF) for the study of local structure in amorphous and crystalline thin films. IUCrJ 2015, 2, 481–489
- Dippel et al. 2019 Dippel, A.-C.; Roelsgaard, M.; Boettger, U.; Schneller, T.; Gutowski, O.; Ruett, U. Local atomic structure of thin and ultrathin films via rapid high-energy X-ray total scattering at grazing incidence. IUCrJ 2019, 6, 290–298
- Wood et al. 2017 Wood, S. R.; Woods, K. N.; Plassmeyer, P. N.; Marsh, D. A.; Johnson, D. W.; Page, C. J.; Jensen, K. M.; Johnson, D. C. Same Precursor, Two Different Products: Comparing the Structural Evolution of In–Ga–O “Gel-Derived” Powders and Solution-Cast Films Using Pair Distribution Function Analysis. J. Am. Chem. Soc 2017, 139, 5607–5613
- Shyam et al. 2016 Shyam, B.; Stone, K. H.; Bassiri, R.; Fejer, M. M.; Toney, M. F.; Mehta, A. Measurement and Modeling of Short and Medium Range Order in Amorphous Ta2O5 Thin Films. Sci. Rep. 2016, 6, 32170
- Kabsch 1988 Kabsch, W. Evaluation of single-crystal X-ray diffraction data from a position-sensitive detector. J. Appl. Crystallogr. 1988, 21, 916–924
- Holm et al. 2020 Holm, E. A.; Cohn, R.; Gao, N.; Kitahara, A. R.; Matson, T. P.; Lei, B.; Yarasi, S. R. Overview: Computer vision and machine learning for microstructural characterization and analysis. Metall. Mater. Trans. A 2020, 51, 5985–5999
- Liu and Schenk 2020 Liu, S.; Schenk, G. Data filtering method for correlated X-ray scattering (CXS). Mod. Phys. Lett. B 2020, 34, 2050018
- Wang et al. 2017 Wang, B.; Yager, K.; Yu, D.; Hoai, M. X-ray scattering image classification using deep learning. 2017 IEEE Winter Conference on Applications of Computer Vision (WACV). 2017; pp 697–704
- Tetef et al. 2022 Tetef, S.; Kashyap, V.; Holden, W. M.; Velian, A.; Govind, N.; Seidler, G. T. Informed chemical classification of organophosphorus compounds via unsupervised machine learning of X-ray absorption spectroscopy and X-ray emission spectroscopy. J. Phys. Chem. A 2022, 126, 4862–4872
- Wei et al. 2019 Wei, J.; Chu, X.; Sun, X.-Y.; Xu, K.; Deng, H.-X.; Chen, J.; Wei, Z.; Lei, M. Machine learning in materials science. InfoMat 2019, 1, 338–358
- Wang and Zhang 2013 Wang, Y.-X.; Zhang, Y.-J. Nonnegative Matrix Factorization: A Comprehensive Review. IEEE Trans. Knowl. Data Eng. 2013, 25, 1336–1353
- Stanev et al. 2018 Stanev, V.; Vesselinov, V. V.; Kusne, A. G.; Antoszewski, G.; Takeuchi, I.; Alexandrov, B. S. Unsupervised phase mapping of X-ray diffraction data by nonnegative matrix factorization integrated with custom clustering. Npj Comput. Mater. 2018, 4
- Elton and Jackson 1966 Elton, L.; Jackson, D. F. X-ray diffraction and the Bragg law. Am. J. Phys. 1966, 34, 1036–1038
- Maffettone et al. 2021 Maffettone, P. M.; Daly, A. C.; Olds, D. Constrained non-negative matrix factorization enabling real-time insights of in situ and high-throughput experiments. Appl. Phys. Rev. 2021, 8, 041410, Publisher: American Institute of Physics
- Long et al. 2009 Long, C. J.; Bunker, D.; Li, X.; Karen, V. L.; Takeuchi, I. Rapid identification of structural phases in combinatorial thin-film libraries using x-ray diffraction and non-negative matrix factorization. Rev. Sci. Instrum. 2009, 80, 103902
- Thatcher et al. 2022 Thatcher, Z.; Liu, C.-H.; Yang, L.; McBride, B. C.; Tran, G. T.; Wustrow, A.; Karlsen, M. A.; Neilson, J. R.; Ravnsbæk, D. B.; Billinge, S. J. L. nmfMapping: a cloud-based web application for non-negative matrix factorization of powder diffraction and pair distribution function datasets. Acta Cryst. A 2022, 78, 242–248
- Filik et al. 2017 Filik, J.; Ashton, A. W.; Chang, P. C. Y.; Chater, P. A.; Day, S. J.; Drakopoulos, M.; Gerring, M. W.; Hart, M. L.; Magdysyuk, O. V.; Michalik, S.; Smith, A.; Tang, C. C.; Terrill, N. J.; Wharmby, M. T.; Wilhelm, H. Processing two-dimensional X-ray diffraction and small-angle scattering data in DAWN 2. J. Appl. Crystallogr. 2017, 50, 959–966
- Prescher and Prakapenka 2015 Prescher, C.; Prakapenka, V. B. DIOPTAS: a program for reduction of two-dimensional X-ray diffraction data and data exploration. High Press. Res. 2015, 35, 223–230
- Ashiotis et al. 2015 Ashiotis, G.; Deschildre, A.; Nawaz, Z.; Wright, J. P.; Karkoulis, D.; Picca, F. E.; Kieffer, J. The fast azimuthal integration Python library: pyFAI. J. Appl. Crystallogr. 2015, 48, 510–519
- Dou et al. 2023 Dou, B.; Zhu, Z.; Merkurjev, E.; Ke, L.; Chen, L.; Jiang, J.; Zhu, Y.; Liu, J.; Zhang, B.; Wei, G.-W. Machine Learning Methods for Small Data Challenges in Molecular Science. Chem. Rev. 2023, 123, 8736–8780
- Murtagh and Contreras 2011 Murtagh, F.; Contreras, P. Algorithms for hierarchical clustering: an overview. WIREs Data. Mining. Knowl. Discov. 2011, 2, 86–97
- Iwasaki et al. 2017 Iwasaki, Y.; Kusne, A. G.; Takeuchi, I. Comparison of dissimilarity measures for cluster analysis of X-ray diffraction data from combinatorial libraries. Npj Comput. Mater. 2017, 3, 1–9
- Palmer 2015 Palmer, D. C. Visualization and analysis of crystal structures using CrystalMaker software. Zeitschrift für Kristallographie-Crystalline Materials 2015, 230, 559–572
- Ramezan et al. 2021 Ramezan, C. A.; Warner, T. A.; Maxwell, A. E.; Price, B. S. Effects of Training Set Size on Supervised Machine-Learning Land-Cover Classification of Large-Area High-Resolution Remotely Sensed Data. Remote Sens. 2021, 13, 368
- Zhang and Ling 2018 Zhang, Y.; Ling, C. A strategy to apply machine learning to small datasets in materials science. Npj Comput. Mater. 2018, 4, 25
- Kabsch 1988 Kabsch, W. Evaluation of single-crystal X-ray diffraction data from a position-sensitive detector. J. Appl. Crystallogr. 1988, 21, 916–924
- Warren 1990 Warren, B. E. X-ray Diffraction; Courier Corporation, 1990
- Shestakov et al. 2018 Shestakov, A. E.; Kassan-Ogly, F. A.; Turkhan, Y. E. Diffuse Scattering from Single Crystal Cobalt. Phys. Met. Metallogr. 2018, 119, 229–240
- Lonsdale and Smith 1941 Lonsdale, K. Y.; Smith, H. An experimental study of diffuse X-ray reflexion by single crystals. Proc. R. Soc. Lond. A Math. Phys. Sci. 1941, 179, 8–50
- Harris et al. 2001 Harris, K. D. M.; Tremayne, M.; Kariuki, B. M. Contemporary Advances in the Use of Powder X-Ray Diffraction for Structure Determination. Angew. Chem. Int. Ed. 2001, 40, 1626–1651
- Jørgensen et al. 2018 Jørgensen, L. R.; Zhang, J.; Zeuthen, C. B.; Iversen, B. B. Thermal stability of Mg3SbBiTe high performance n-type thermoelectric investigated through powder X-ray diffraction and pair distribution function analysis. J. Mater. Chem. A 2018, 6, 17171–17176
- Nakamura et al. 2020 Nakamura, N.; Su, L.; Bai, J.; Ghose, S.; Reeja-Jayan, B. In situ synchrotron pair distribution function analysis to monitor synthetic pathways under electromagnetic excitation. J. Mater. Chem. A 2020, 8, 15909–15918
- Diaz-Lopez et al. 2020 Diaz-Lopez, M.; Cutts, G. L.; Allan, P. K.; Keeble, D. S.; Ross, A.; Pralong, V.; Spiekermann, G.; Chater, P. A. Fast operando X-ray pair distribution function using the DRIX electrochemical cell. J. Synchrotron Radiat. 2020, 27, 1190–1199
- Wang and Zhang 2013 Wang, Y.-X.; Zhang, Y.-J. Nonnegative Matrix Factorization: A Comprehensive Review. IEEE Trans. Knowl. Data Eng. 2013, 25, 1336–1353
- Gillis 2014 Gillis, N. The why and how of nonnegative matrix factorization. Reg., optimize., ker., SVMs 2014, 12, 257–291
- Lee and Seung 2000 Lee, D.; Seung, H. S. Algorithms for Non-negative Matrix Factorization. Advances in Neural Information Processing Systems. 2000
- Olaya and Otman 2021 Olaya, J.; Otman, C. Beta-divergence for Nonnegative Matrix Factorization. 2021 International Conference on Digital Age & Technological Advances for Sustainable Development (ICDATA). 2021; pp 15–22
- Pedregosa et al. 2011 Pedregosa, F. et al. Scikit-learn: Machine Learning in Python. J. Mach. Learn. Res. 2011, 12, 2825–2830
- Maisog et al. 2021 Maisog, J. M.; DeMarco, A. T.; Devarajan, K.; Young, S.; Fogel, P.; Luta, G. Assessing Methods for Evaluating the Number of Components in Non-Negative Matrix Factorization. Math. 2021, 9, 2840
- Flores et al. 2022 Flores, E.; Ouyang, J.; Lapointe, F.; Finnie, P. Nanotube abundance from non-negative matrix factorization of Raman spectra as an example of chemical purity from open source machine learning. Sci. Rep. 2022, 12, 11666
- Sasirekha and Baby 2013 Sasirekha, K.; Baby, P. Agglomerative hierarchical clustering algorithm. Int. J. Sci. Res. 2013, 83, 83
- Chowdhury et al. 2022 Chowdhury, M.; Ok, K.; Luo, Y.; Liu, Z.; Chen, S.; O’Halloran, T.; Kettimuthu, R.; Tekawade, A. Assessment of unsupervised clustering algorithms for label-free x-ray fluorescence microscopy data. Applications of Machine Learning. 2022; pp 152–158
- Szekely and Rizzo 2005 Szekely, G. J.; Rizzo, M. L. Hierarchical clustering via joint between-within distances: Extending Ward’s minimum variance method. J. Classif. 2005, 22, 151–184
- Brügemann and Gerndt 2004 Brügemann, L.; Gerndt, E. K. Detectors for X-ray diffraction and scattering: a user's overview. Nucl. Instrum. Methods Phys. Res. A 2004, 531, 292–301
- Press and Teukolsky 1990 Press, W. H.; Teukolsky, S. A. Savitzky-Golay smoothing filters. Comput. Phys. Rep. 1990, 4, 669–672
- Virtanen et al. 2020 Virtanen, P.; Gommers, R.; Oliphant, T. E.; Haberland, M.; Reddy, T.; Cournapeau, D.; Burovski, E.; Peterson, P.; Weckesser, W.; Bright, J., et al. SciPy 1.0: fundamental algorithms for scientific computing in Python. Nature methods 2020, 17, 261–272
- John et al. 2022 John, M.; Haselbeck, F.; Dass, R.; Malisi, C.; Ricca, P.; Dreischer, C.; Schultheiss, S. J.; Grimm, D. G. A comparison of classical and machine learning-based phenotype prediction methods on simulated data and three plant species. Frontiers in Plant Science 2022, 13
- Juhás et al. 2013 Juhás, P.; Davis, T.; Farrow, C. L.; Billinge, S. J. PDFgetX3: a rapid and highly automatable program for processing powder diffraction data into total scattering pair distribution functions. J. Appl. Crystallogr. 2013, 46, 560–566
- Shamoto et al. 2006 Shamoto, S.-i.; Kodama, K.; Iikubo, S.; Taguchi, T.; Yamada, N.; Proffen, T. Local crystal structures of Ge2Sb2Te5 revealed by the atomic pair distribution function analysis. Jpn. J. Appl. Phys. 2006, 45, 8789
- Farrow et al. 2007 Farrow, C.; Juhas, P.; Liu, J.; Bryndin, D.; Božin, E.; Bloch, J.; Proffen, T.; Billinge, S. PDFfit2 and PDFgui: computer programs for studying nanostructure in crystals. J. Condens. Matter Phys. 2007, 19, 335219
- Saha and Nix 2002 Saha, R.; Nix, W. D. Effects of the substrate on the determination of thin film mechanical properties by nanoindentation. Acta Mater. 2002, 50, 23–38
- Ghosh et al. 2004 Ghosh, R.; Basak, D.; Fujihara, S. Effect of substrate-induced strain on the structural, electrical, and optical properties of polycrystalline ZnO thin films. Journal of applied physics 2004, 96, 2689–2692
- Li et al. 2002 Li, Y.; Hu, S.; Liu, Z.; Chen, L. Effect of substrate constraint on the stability and evolution of ferroelectric domain structures in thin films. Acta Mater. 2002, 50, 395–411
See pages - of DNA_NMFAC_SI.pdf