Dr. Karl Remeis-Sternwarte, Erlangen Centre for Astroparticle Physics, Friedrich-Alexander-Universität Erlangen-Nürnberg, Sternwartstrasse 7, 96049, Bamberg, Germany
11email: sara.saeedi@fau.de
HamburgerSternwarte, Gojenbergsweg112, 21029, Hamburg, Germany
eROSITA (eRASS1) study of the Canis Major overdensity: Developing a multi-wavelength algorithm for classifying faint X-ray sources
Abstract
Aims.
Methods.
Results.
Abstract
Context. Using data from eROSITA (extended Roentgen Survey with an Imaging Telescope Array) on board Spektrum-Roentgen-Gamma (Spektr-RG, SRG) taken during the first eROSITA all-sky survey (eRASS1), we performed the first X-ray classification and population study in the field of the Canis Major overdensity (CMa OD), which is an elliptical-shaped stellar overdensity located at .
Aims. This study aims to identify the X-ray sources in CMa OD. We developed a classification algorithm using multi-wavelength criteria as a preliminary method for the classification of faint X-ray sources, specifically in regions with a high source number density.
Methods. We used the brightness of the multi-wavelength counterparts (mainly from infrared and optical catalogues), along with the X-ray flux and X-ray hardness ratios (HRs) to classify the sources.
Results. Out of a total number of 8311 X-ray sources, we classified 1029 sources as Galactic stars and binaries in the foreground, 946 sources as active galactic nuclei (AGNs) and galaxies in the background, and 435 sources with stellar counterparts that may belong to either the MW or CMa OD. Among the sources with a stellar counterpart, we identified 34 symbiotic star candidates, plus 335 sources, of which the infrared (IR) counterparts have properties of M-giants in CMa OD. Moreover, there is a known high-mass X-ray binary (HMXB, 4U 0728-25) in the field of our study; according to the Gaia parallax of its companion, it appears to be a member of CMa OD. There is also a recently detected transient low-mass X-ray binary (LMXB, SRGt J071522.1-191609) is also present; it may be a member of CMa OD based on its companion, which is most likely highly absorbed and is thus located behind the Galactic disk. In addition, we present the X-ray luminosity function (XLF) of members and candidate members of CMa OD. It is dominated by sources with luminosities of – erg s-1 in the energy range of 0.2–2.3 keV. These sources are expected to be either accreting white dwarfs or quiescent LMXBs.
Key Words.:
Galaxy:X-rays: binaries, stars: binaries: symbiotics, stars: binaries: cataclysmic variables1 Introduction
Today, we know of almost 60 satellite galaxies of the Milky Way (MW) and 40 satellite galaxies of M31 (McConnachie 2012). With the most prominent exception of the Large and Small Magellanic Clouds, which are dwarf irregular galaxies with copious star formation, most of these systems are metal-poor dwarf spheroidal galaxies (dSphs) with metallicities as low as (e.g. Frebel et al. 2010; McConnachie 2012). This population of extremely metal-poor stars makes the dSphs ideal laboratories for the study of the stellar populations in the earliest epochs of chemical enrichment in the universe. Unlike other types of nearby galaxies, the X-ray population of these old, low-mass satellite galaxies of the MW has been poorly studied. We expect that the main population of late-type stars of dSphs have formed white dwarfs (e.g. Tolstoy et al. 2009). Therefore, we would expect a mixed population of accreting with dwarfs (AWDs) and transient low-mass X-ray binaries (LMXBs) with , which is very important for two reasons. First, the close distance of nearby dSphs provides a unique opportunity to study the X-ray luminosity function (XLF) of AWDs, which is not well understood in the case of Galactic sources due to the varying distances and selection effects. Second, it will improve our understanding of transients, which are expected to have luminosities between X-ray binaries (XRBs) and AWDs (Sazonov et al. 2006). On the other hand, the population of low-luminous X-ray sources is a mix of cataclysmic variables (CVs), symbiotic stars, quiescent LMXBs, and magnetically active binaries (ABs) More details are provided in the literature(e.g. Saeedi et al. 2022). A deep multi-wavelength study of these X-ray sources in a nearby dSph will provide us with a pristine sample of each type of the low-luminosity X-ray sources and allow us to constrain the contribution of each type to the total low-luminosity population and thus to better understand the XLF.
We started a study of the X-ray source population of dSphs around the Milky Way. We measured the XLF in the hard and soft X-ray bands for Draco dSph, as one of the oldest nearby dSphs with an age of yr (e.g. Bellazzini et al. 2002).The XLF of sources in the soft energy range (0.2–2.0 keV) shows an excess above the AGN distribution for low luminosity X-ray sources (). Our additional, more detailed classification of the X-ray population of Draco dSph has shown that the main X-ray sources in the Draco dSph are AWDs (Saeedi et al. 2018, 2019). Following up on the significant detection of AWDs in the Draco dSph, we have applied a similar analysis method to other dSphs with different stellar masses and star formation histories to verify the differences of the population of AWDs in these galaxies. We studied the X-ray sources of the Willman 1 dSph, one of the least massive dSphs, using three archival XMM-Newton observations, confirming the presence of a -type symbiotic binary and some candidates of transient LMXBs (Saeedi & Sasaki 2020). We also confirmed the presence of multiple AWDs and transient LMXBs in Sculptor dSph, which is more massive than Draco,(Saeedi & Sasaki 2022). Now, the eROSITA all-sky survey (eRASS) gives us a unique opportunity to study the X-ray population of the satellite galaxies of the Milky Way.
CMa OD is a stellar population, which has been suggested to be the main core of a dSph. It is located very close to the Galactic plane RA=, Dec= [J2000]) (McConnachie 2012), and at a distance of 7.01.0 kpc from the Sun. This distance measurement has been also confirmed by the later study of (Carballo-Bello et al. 2021). In fact, the origin of the CMa OD is unclear. One hypothesis is that this overdesity is the main part of the core of the most massive and the closet dwarf galaxy to the MW. This hypothesis is supported by a certain degree of evidence; for instance, the old stellar population of M-giant in this overdesity is similar to that of other nearby dSphs (Martin et al. 2004). In addition, the presence of some globular clusters around the CMa OD reinforces the idea of a possible accreted galaxy within the inner Galactic halo (e.g.. Forbes & Bridges 2010) as well as the excess of bright blue stars in the central regions of CMa, with respect to the Galactic plane, shows the extra-Galactic origin of CMa OD (e.g. de Jong et al. 2007). The subtracted-density map, where the Galactic stars have been filtered out, indicates a dense M-giant population of 4500 stars kpc-2 in the core of the CMa dSph (Bellazzini et al. 2006). Deep optical and infrared (IR) population studies show that the luminosity, dimensional properties, and the population of the red giant branch of CMa dSph is very similar to that of Sagittarius dSph, in a way that Sagittarius dSph would look like CMa dSph if it was placed at the distance of CMa OD. On the other hand, there are studies on the stellar population, metallicity of this overdensity, and special distribution of blue stars, which weaken the above evidence and show that the CMa OD can be a part of the Galactic wrap (see more details in de Boer et al. 2018; Momany et al. 2006; Carballo-Bello et al. 2021). Therefore, it seems that no ultimate conclusion has yet been confirmed for CMa OD.
In general, the classification of low-luminosity X-ray sources with large positional uncertainties is a complicated task. Hence, the classification of X-ray sources in the field of CMa OD, which is located behind the Galactic disk with a very high population density of Galactic stars and binary systems in the foreground is challenging. Therefore, we decided to develop an algorithm to carry out a systematic analysis and thus increase the probability of the classification of faint X-ray sources using the multi-wavelength data. Recently, two different approaches of big data analysis and machine learning have tried to improve the classification of X-ray sources. First, Yang et al. (2022) have provided a machine learning method based on the properties of known X-ray sources to classify the unknown sources in the Chandra Source Catalogue. It provides the first machine learning approach to analyse the different properties of the different classes of X-ray sources. Other studies have presented more general approaches for source classification (e.g. Salvato et al. 2018; Mukai 2017; Stiele et al. 2011). Yang et al. (2022) selected optical and IR counterparts of the X-ray sources within a circle with a radius of 10” as the positional uncertainty and assumed the nearest optical or IR source as the counterpart(s) or the X-ray source. This is not as reliable as the method from Salvato et al. (2018), a code known as NWAY that was developed to determine the most probable counterpart of an X-ray source from cross-matching multiple catalogues. For the source classification, we have used the NWAY method searching for IR and optical counterparts supporting with multi-wavelength algorithm as it is explained in Sects. 2.2 and 4.
In this paper, we first explain the characteristics of sources of the first eROSITA (Predehl et al. 2021) all-sky survey (eRASS1) catalogue (Merloni et al. 2024) in the field of CMa OD (Sect. 2). Next, we present the details of the multi-wavelength catalogues, which have been used in this study (Sect. 3). Section 4 explains the algorithm of the multi-wavelength classification, which has been developed in this work. Section 5 discusses the X-ray properties used for the classification. Section 6 presents the results of the classification and the XLF of the low-luminosity X-ray sources of CMa OD.
2 Data selection and methodology
2.1 eRASS1 data of CMa
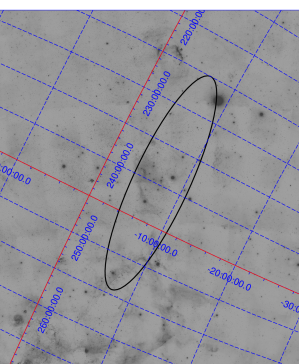
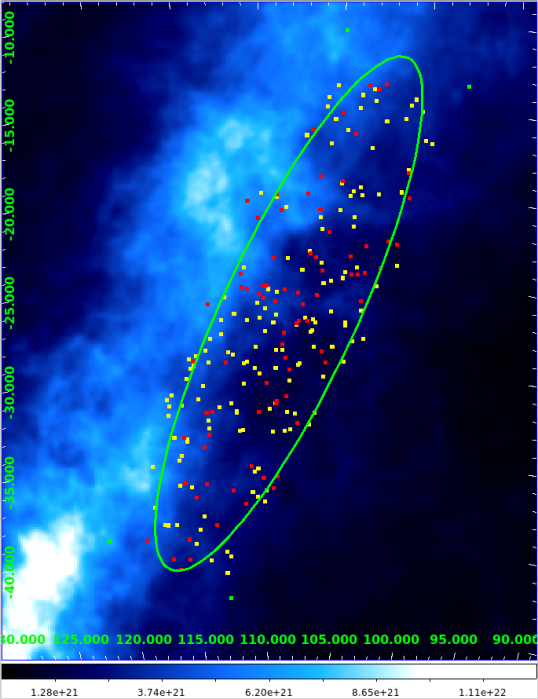
In our study of CMa OD, we considered all detected eRASS1 sources located in the field of CMa OD ( deg2). Figure 1 shows the region of the core of CMa OD. This area has been determined as the core of CMa dSph in the IR study of Martin et al. (2004) and the same area has been applied in the work of Carballo-Bello et al. (2021). We have a total of 8311 eRASS1 sources. The sources in the field of CMa OD were directly taken from the main catalogue of eRASS1, which includes sources with a detection maximum likelihood of ML 6 (¿3) 111The detection likelihood () is calculated from Poissonian probability (), based on aperture count extraction. This probability is calculated using the raw counts of the source and the raw counts of the background maps taken from an aperture representing of the encircled-energy fraction radius of the point speared function (see Merloni et al. 2024; Brunner et al. 2022).. According to Merloni et al. (2024), 14 of these sources are potentially spurious, while the probability of spurious sources decreases to 1 if the criterion is changed to ML (¿4). In the first step, we have started our work selecting all catalogue sources with ML 6. More than half of these sources are in the range of 6 ML 10, the majority being AGNs or Galactic stars, which are useful for classification based on multi-wavelength counterparts (as explained in Sect. 4). For those sources, which our analysis has identified as potential members of CMa OD (see Sect. 4), we applied the more strict criterion of ML10 (¿4). Otherwise, these sources have been flagged as candidate members of CMa OD. Using a similar approach to the way Merloni et al. (2024) performed a systematic astrometry correction based on quasars in the WISE catalogue, we used the eRASS1 catalogue coordinates to search for counterparts.
2.2 Probabilistic cross-matching method
We have used NWAY to search for the optical and IR counterparts of the X-ray sources (as explained in Sect. 4). It is based on Bayesian statistics and computes the matching probability by taking into account such parameters as the positional uncertainties of the X-ray source and its counterpart, the distance of a counterpart from the X-ray source, and the number densities of available counterparts (Salvato et al. 2018). The NWAY code provides a (p-i) parameter for each match (Salvato et al. 2018), which gives the probability to be the likely counterpart of a source. Using the NWAY, Salvato et al. (2022) performed a multi-wavelength study to classify the point-like X-ray sources detected in the eROSITA Final Equatorial-Depth Survey. Their main aim was to establish criteria for the classification of background sources and to present a clean sample of active galactic nuclei (AGNs). Therefore, they have excluded the sources, which are near the Galactic plane (—— ¡ 15 deg) and only have taken to account the sources with optical or IR counterparts with a high NWAY match probability (p-i¿90). However, using only the parameter of match probability to select the counterpart is not practical in a crowded field close to the Galactic plane. Therefore, we have developed an algorithm based on the multi-wavelength investigation of probable counterparts, which is tailored for the classification of (particularly) faint X-ray sources in a dense and crowded field such as the field of CMa OD (See Sect. 4).
2.3 Problem of optical loading
It is known that bright objects in the optical and IR can cause spurious signals in X-ray observations, where optical and IR photons can trigger X-ray CCDs and wrongly recorded as X-ray photon events; this is is referred to as the optical loading problem. Therefore, we have filtered out optical and IR bright objects, which falsely show very soft X-ray emission, following the method from Merloni et al. (2024), as shown in Fig. 2. We have a total of 17 sources in our full sample and all of them are bright stars in SIMBAD Astronomical Database (hereafter, SIMBAD, Wenger et al. 2000). These sources, which are potentially affected by optional loading are mainly identified based on their mag value of mag. Five additional ones were flagged due to their IR () magnitude and in one case this was due to the blue () magnitude. These sources are excluded in our study, however they were kept in the catalogue and have been flagged with ”opt.loading” label in the comment column of Table A. The list of the excluded sources with the ID of our catalogue and their astronomical names is presented in Table. 1. The magnitude of the sources is provided. If the or magnitudes are caused by the optical loading, these magnitudes have also been presented.
| Source No. | Astronomical name | Optical magnitude(s)∗ |
|---|---|---|
| 178 | alf CMa, | = -1.46 |
| 917 | omi 01 CMa | =3.78 |
| 1147 | mu. CMa A | =5.09, =2.64 |
| 1488 | eps CMa | =1.50 |
| 1915 | sig CMa | =3.47 |
| 2095 | omi02 CMa | =3.02 |
| 2197 | gam CMa | =4.12 |
| 2871 | del CMa | =1.84 |
| 3809 | 27 CMa | =4.65, =4.45 |
| 3893 | ome CMa | =3.82 |
| 3894 | HD 56618 | =4.64, =1.30 |
| 4171 | 145 CMa | =4.79, =1.91 |
| 4527 | tau CMa | =4.40 |
| 4939 | V MZ CMa | =5.88, =2.26 |
| 5417 | eta CMa | =2.45 |
| 7642 | l Pup | =3.93 |
| 7781 | c Pup | =3.61 |
A sample of the X-ray source catalogue of this work is shown in Appendix A, while the full catalogue is available online. Our catalogue presents the information of each source including eRASS1 ID, right ascension (RA), declination,(Dec), positional uncertainty (), the source rate and its corresponding flux in 0.2–2.3 keV, total detection ML in the same energy range, hardness ratios (HR) (see sect. 5.2), the class of the sources based on this study, and a comment column; these comments mainly give the astronomical name of a source if it is an already known source according to SIMBAD or some additional necessary information related to (e.g. optical loading problem, pile-up, etc). Our source list is sorted based on RA and a number (No.) is given to each source for presentation in this work.
3 Multi-wavelength catalogues
For the multi-wavelength studies, we considered the most recent available all-sky catalogues. The X-ray sources have been checked via SIMBAD to identify the known sources in the field of the study. Also, the most updated AGN or galaxy catalogues helped to identity the known background counterparts. No matter whether a source has been already classified or not, the optical and IR properties of maximum three counterparts of the X-ray source were collected for further analysis (see Sect. 4). The details of the catalogues used in this work are presented below.
3.1 IR counterparts of the sources
We searched for mid-infrared (MIR) counterparts in the WISE all-sky survey catalogue in four energy bands (3.4, 4.6, 12, and 22 m, known as , , , and , respectively; Cutri & et al. 2014). The catalogue of Cutri & et al. (2014) includes the near-infrared (NIR) counterpart of the 2MASS All-Sky Survey Catalogue in the three , , standard bands (Cutri et al. 2003). In the direction of CMa OD, we applied the average extinction of 0.28, 0.17, and 0.12 for the , , bands, respectively (Schlafly & Finkbeiner 2011). The extinction for the IR WISE bands was negligible (Schlafly & Finkbeiner 2011). The IR counterparts are crucial for the source classification as discussed in Sect. 4.
3.2 Optical counterparts of the sources
The main catalogue of our optical investigation is from third Gaia data release (DR3, Gaia Collaboration et al. 2023). The advantage of Gaia is that it has parallax measurements which can be used for identifying Galactic foreground stars. Source distances based on the Gaia parallax have been taken from Bailer-Jones et al. (2021), who applied a probabilistic approach using a three-dimensional model for the Milky Way to measure the distance. The model considers the interstellar extinction and Gaia’s magnitude limit, which varies from 19.2 mag in the Galactic center to 20.7 mag for most of the rest of the sky. Gaia Collaboration et al. (2023) reported the magnitudes of the sources in three filters of mag (roughly =300–1050 nm), (=330–680 nm) mag, and (=640–1050 nm), which have been used in our study. To identify Galactic binary systems, we use the results of El-Badry et al. (2021), who has provided a catalogue of a million Galactic binary systems within a distance of 1kpc.
Moreover, the data of Pan-STARRS1 survey have been used to check the characteristics of background sources. The survey presents the optical data in 5 bands of (495.7, 621.1, 752.2, 867.1, and 970.7 nm, respectively). Salvato et al. (2022) used The Kilo-Degree Survey (KiDs) (Kuijken et al. 2019), DESI Legacy Imaging Surveys (LS8) (Dey et al. 2019), and Hyper Suprime-Cam (HSC) (Aihara et al. 2018) data for the optical studies of background sources. None of these surveys cover the field of CMa OD. However, the similar sensitivity of and bands of Pan-STARRS to those of the catalogues, which have been used by Salvato et al. (2022), allows us to apply the same criteria as Salvato et al. (2022) for our sources (see Sect. 4).
3.3 Catalogues of AGNs and galaxies
The Million Quasars (Milliquas) catalogue (Flesch 2021) is the main catalogue, which was used to flag the background sources. Almost all known AGN have been already included in these catalogues, but to include probably neglected candidates we run source matching on the catalogues of following studies as well: the SWIFT AGN and Cluster Survey (Dai et al. 2015), the identification of 1.4 Million AGNs in the MIR using WISE Data (Secrest et al. 2015), and the identifications of AGNs from the WISE, 2MASS, and ROSAT All-Sky Surveys (Edelson & Malkan 2012).
4 Algorithm for the source classification
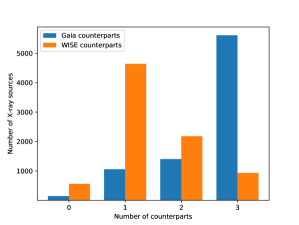
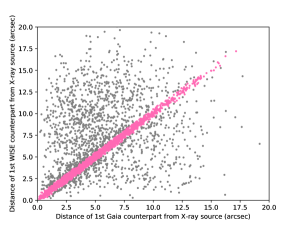
We searched for the optical and IR counterparts of the X-ray sources (within their 3 positional error) using the NWAY code Salvato et al. (2018) (See Sect. 2.2). However, when the number density of counterparts in a catalogue is high in a field (i.e. as in the Galactic disk), a single X-ray source may have multiple counterparts. Therefore, the match probability reduces and consequently, it is very hard to find a significant counterpart for an X-ray source. The situation is even more dramatic in cases of faint X-ray sources with a large positional error and this is similar to what we have seen for many of the eROSITA sources. The weighted average of the positional error of point-like sources (flagged with EXT=0 Merloni et al. 2024) of our catalogue is 4.5”. As Fig. 3 shows, 37 of sources have at least two WISE counterparts and 67 have 3 Gaia counterparts. Moreover, the majority of these counterparts cannot be considered as a significant match according to the match probability of NWAY. Results of the cross-match of X-ray sources in the field of CMa OD shows that only 25 of sources have a significant WISE counterpart (p-i¿90) and only 0.7 of sources have a significant Gaia counterpart. To find the likely counterpart and, thus, a classification of the unknown and faint sources, we developed an algorithm for the classification of X-ray sources.
We focussed on the study of fields including a nearby galaxy, where the contribution of X-ray background sources and Galactic foreground sources has to be removed before we can identify the candidates of X-rays sources belonging to the galaxy. This algorithm is based on the available multi-wavelength data and criteria, which have been already applied for the data, plus the X-ray properties of the eROSITA sources. As mentioned in Sects. 3.1 and 3.2, we used the two most updated all-sky catalogues in the optical (Gaia) and IR (WISE). Using these surveys offers two benefits. First, they cover the whole sky and this allows our algorithm to be applied to other classification studies as well. Second, these surveys have already been frequently used for the population study of different types of sources based on their available bands or colours; thus, the results of these previous studies can be applied to our study for the classification of the eROSITA sources. Our algorithm does not define a limit with respect to accepting a counterpart based on its match probability; instead, it starts with the most probable optical and/or IR counterparts (as we call it the first counterpart); afterwards, if the first counterpart does not satisfy the classification criteria, it checks the next probable counterpart (if it exists within the 3 positional circle error of the source) based on considerations explained below.
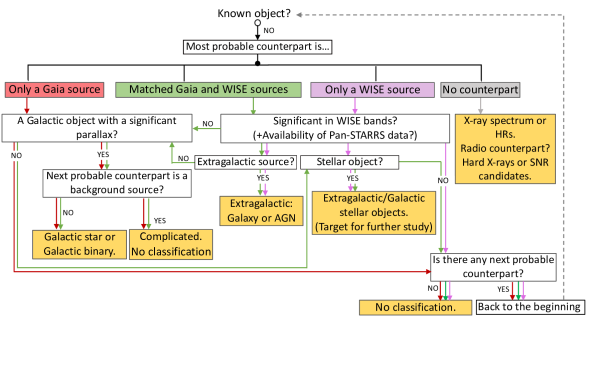
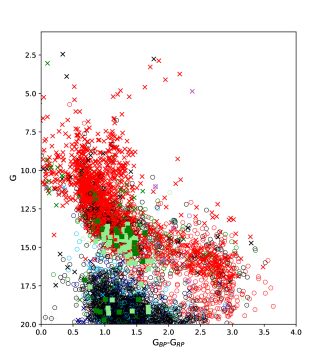
Figure 4 shows the schematic of the algorithm. An unknown X-ray source, which completes the pipeline, will be classified as a background source, a Galactic foreground star or binary, or a stellar object; sources that are a star candidate according to the WISE colours, but the Gaia information is not significant enough to clarify whether they belong to the MW or they are extra Galactic sources (e.g. they belong to the CMa OD) or it stays unclassified. Figures 5 and 6 show the results of the algorithm pipeline, as explained in Sect. 4. In the very first step, the pipeline checks whether an X-ray source is a known object according to SIMBAD or the most updated available catalogues of AGNs or galaxies. The used catalogues of background sources are listed in Sect. 3.3. Overall, 1901 sources have been identified as known sources in SIMBAD and 507 sources exist in AGN or quasar catalogues. If a source is unknown, in the second step, the algorithm checks the first optical and first IR counterparts of an X-ray source are identical (i.e. if they are located at the same position within the positional uncertainty of Gaia and WISE). For many X-ray sources, the most probable optical and IR counterparts are not identical (see Fig. 3).
4.1 Counterparts of a source
After recognising the first optical and IR counterparts, there are four possibilities:
No counterpart: the X-ray source has neither an optical nor an IR counterpart within its positional error. These sources are considered for further investigations if, for instance, any ultraviolet (UV) or radio counterpart exists. Otherwise the study is limited to the spectral analysis of the X-ray source. Spectral analysis or the hardness ratios (HRs, see Sect. 5.2) are helpful to find candidates with soft X-ray emission (e.g. supernova remnants) or hard sources (e.g. XRBs with an obscured companion). Here, we have 95 sources without any counterparts. None of these sources had a matching radio or UV source, while a significant HR (See Sect. 5.2) was available for 10 of these sources. They are labeled with black squares in the HR plots (see Figs. 7 and 8) and are further discussed in Sect. 6.
Only Gaia counterpart: The most probable counterpart is only a single Gaia source. First, this Gaia counterpart (as the most probable counterpart) is checked for the parallax information. However, if the Gaia counterpart is confirmed as a foreground Galactic source, still we cannot be sure that the X-ray emission is from a Galactic source. Since the most numerous and bright X-ray sources are AGNs, we can expect that there still might be an AGN within the X-ray positional error (as second or third counterpart), which is partially or fully responsible for the X-ray emission. For this reason, a foreground Galactic object is only accepted after checking the second and third optical or IR counterparts. An X-ray source with both a foreground and a background counterpart would remains unclassified or marked as a foreground Galactic source (see Fig. 4).
Only WISE counterpart: The most probable counterpart is only a single WISE source, without any Gaia counterpart. If the WISE counterpart is significant in terms of its bands, it is checked if it is a candidate for a background source or a stellar object (see Sect. 4.2).
Matched WISE and Gaia counterparts: The first Gaia counterpart is within the positional uncertainty of the first WISE counterpart. First, the source is checked to see whether it is a background object (see Sect. 4.2). If it is not a background source, it is checked to see whether it fulfills the condition for Galactic sources. If a source is neither a background nor a Galactic source, the last step is a check to see whether it fulfills the conditions for stellar objects. A stellar object can either be a Galactic source or belong to the nearby galaxy (here CMa OD). To show that a source belongs to CMa OD, additional IR or optical criteria are needed, as explained in Sect. 6.
If the first counterpart(s) of a source remains without any classification through the algorithm, the algorithm starts from the beginning to check whether the second optical or IR counterparts can be classified and, in the next step, the third counterparts.
4.2 Criteria for the classification
The criteria for the classification of different types of X-ray sources are explained in the following.
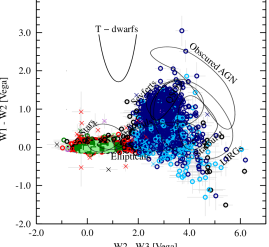
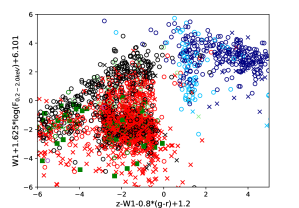
Background objects: There are deep studies in both IR and optical aimed at classifying AGNs combined with X-ray studies. We applied the following three criteria to classify a source as a background source. If a source satisfies one (or more) of these conditions it is considered as a background object. 1) Wright et al. (2010) have shown that background objects are usually expected to be red (i.e. ¿1.5). This condition is checked only for the sources, which have been significantly detected in and . Figure 5 shows the separation of background sources and stellar objects based on the WISE colours; 2) On the other hand, if we have a significant optical counterpart for an X-ray source in the Pan-STARRS1 Survey, the deep study of the eROSITA Final Equatorial-Depth Survey (eFEDS) by Salvato et al. (2022) shows that extra-galactic sources are characterised by and . This set of criteria are useful for sources that do not have a significant or detection; therefore, the first criterion cannot be applied. However, these criteria cannot be applied as the main criteria in our work, because the number of sources that have a Pan-STARRS1 counterpart is limited to 15 of the sources, which is much lower than the counterparts in the WISE catalogue (see left plot of Fig. 3). Overall, of sources have at least one WISE counterpart.
Galactic single stars and binary systems: To identify the Galactic objects, the parallax measurement of Gaia is crucial. We have taken into account the significance of the Gaia parallax measurement following these three criteria suggested by the Gaia collaboration for DR3: ruwe (re-normalised unit weight error) ¡ 1.4, ipdfracmultipeak (percentage of CCD transits where additional images were seen) 2, and ipdgofharmonicamplitude (scan angle dependent variation of goodness of fit for the image fitting) ¡ 0.1 (see also Fabricius et al. 2021). However, some more recent works (e.g. Andriantsaralaza et al. 2022) show that the ruwe parameter is not fully reliable for filtering unreliable parallax measurements. For this reason, in cases where significant WISE measurements are available, we have also taken into account the condition of stellar objects for Galactic sources as well (i.e. ¡1.5). If the IR colour and the Gaia parallax measurement of a counterpart are not compatible, the X-ray source remains unclassified. Moreover, the aforementioned conditions of Gaia parameters do not cover Galactic binary systems. To identify Galactic binary systems, we cross-matched our source list with the catalogue of El-Badry et al. (2021), which lists binary systems up to a distance of 1 kpc.
Stellar objects: When Galactic sources are excluded, we expect that the IR counterpart of an X-ray source, which is an accreting binary system in a nearby galaxy (e.g. CMa OD, satisfies the condition of stellar objects. According to Wright et al. (2010), these object have a colour of ¡1.5.
The details of the magnitudes of WISE and Gaia counterparts, which have been considered in source classification using the algorithm are presented in Table B.
5 X-ray analysis
For the classification of the X-ray sources, we also used the information of the ratio between the X-ray flux and the optical magnitude and the spectral properties given as hardness ratios (HRs).
5.1 X-ray to optical flux ratio
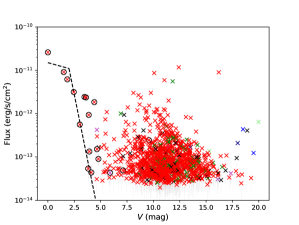
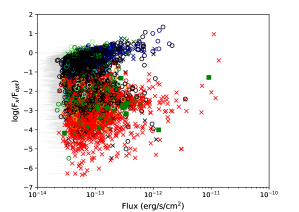
The X-ray-to-optical-flux ratio, calculated as the ratio between the X-ray flux and the optical magnitude of the counterpart, is a useful tool for identifying, for instance, optically bright stars versus X-ray bright accreting compact objects. We plotted X-ray to optical flux ratio over the X-ray flux in Fig. 6 (left). The following equation shows how was calculated (see Maccacaro et al. 1988), adapted to the Gaia bands:
| (1) |
where is the X-ray flux, and and are the Gaia magnitudes of the optical counterpart associated with the X-ray source.
In addition, Salvato et al. (2022) provided criteria to distinguish between the background sources (AGNs) and Galactic sources using the X-ray flux and the IR and optical magnitudes (see Sect. 4). The right plot of Fig. 6 shows that sources, which were classified in our work based on PanSTARRS1 and WISE, satisfy the conditions of Salvato et al. (2022) as well.
5.2 Hardness ratios
The count rate of majority of X-ray sources in the field of our study is not enough for the spectral analysis. There are many X-ray sources (including stellar objects or unclassified sources) that are too faint for a spectral analysis. Therefore, we calculated the hardness ratios, which give information about the spectral properties of the sources. Hardness ratios were calculated from the rate (counts/s) of sources in the five available energy bands of the eRASS1 catalogue, namely, 0.2–0.5 keV, 0.5,–1.0 keV, 1.0–2.0 keV, 2.0–5.0 keV, and 5.0–8.0 keV. To increase the accuracy, we considered an HR measurement significant only when the detection likelihood in the two corresponding energy bands is higher than 6 (i.e. ¿3). The HRs and HR errors are calculated as:
| (2) |
respectively, where is the count rate and is corresponding error in the energy band, .
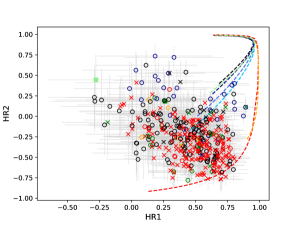
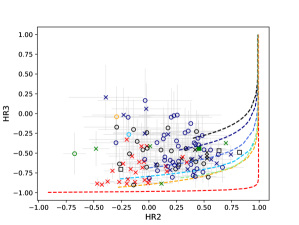
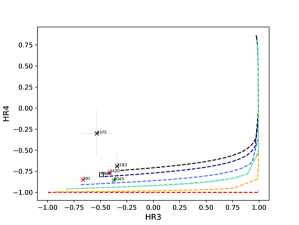
The hardness ratio plots HR2 versus HR1 and HR3 versus HR2 (Fig. 7) show that the population of foreground Galactic stars are mainly consistent with models of collisionally ionized thermal plasma (apec, Smith et al. 2001) in comparison to background sources, which are mainly consistent with power-low models. There are a few very hard sources in the HR4 versus HR3 diagram (Fig. 7). The details of these objects are discussed in Sect. 6.
6 Discussion
The aim of this work is to provide a primary view about the population of X-ray sources, which belong to the CMa OD. We did not present any X-ray spectral analysis of bright background AGNs or Galactic systems, as these sources are addressed by other teams in the eROSITA consortium. Here, bright X-ray sources in the field of CMa OD are considered for further studies to verify whether they can be classified as systems belonging to CMa OD (based on our algorithm); otherwise, they remain unclassified.
6.1 Members of CMa OD
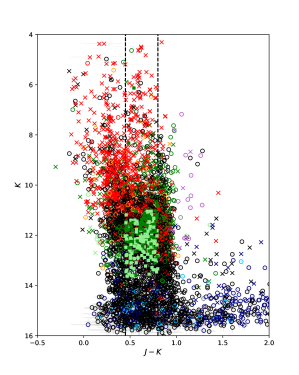
In our classification process, we found 95 sources without any optical or IR counterpart and 435 sources, which are stellar systems. Due to the higher distance and thus the lack of accurate parallax measurements for stars in CMa OD it is difficult to distinguish the members of CMa OD from faint Galactic stars. However, the IR red-clump population of CMa OD shows a colour of 0.45 0.75 and the main population has a magnitude of 12.3 13.7 (Bellazzini et al. 2006). We checked this colour and magnitude using the data of 2MASS (see Fig. 9) for sources classified as stellar objects. We classified these sources as CMa OD members if they fulfil these criteria along with ML ¿ 10, whereas they were only determined to be as member candidates when ML ¡ 10. We classified 100 sources as members of CMa OD and 235 as member candidates of CMa OD. They are shown with green filled squares in all plots.
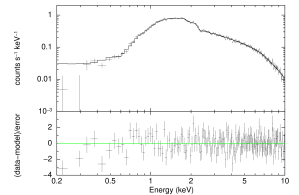
Moreover we checked the X-ray HRs and X-ray flux of the brighter sources. The HR plots (Fig. 7) show that there are a few stellar systems (green circles) in HR1-HR2 and HR2-HR3 diagrams, which mainly show soft X-ray emission ¡ 2.0 keV. The HR plot of higher energies (HR3-HR4) shows a few bright and hard X-ray sources, which are two known bright quasars (source No. 4375 and No. 3183) and two known Galactic cataclysmic variables (CVs, source No. 191 and source No. 1420, see Sect. A). Moreover, source No. 6043 is a well-known Be HMXB V* V441 Pup (also known as 3A 0726–260 or 4U 0728–25), which has a Be star companion with a distance of 8 kpc (Gaia Collaboration et al. 2023). Thus, the source seems to belong to CMa OD and there is a possibility that it is part of the population of blue giant stars in CMa OD (Carballo-Bello et al. 2021). The last source in HR3-HR4 plot is source No. 3986 (SRGEt J071522.1-191609), which has been discovered by eROSITA via the Near Real Time Analysis (NRTA) when the position entered the eROSITA field of view on 2020-04-19 (MJD 58958.06) (Gokus et al. 2020). The eROSITA flux is erg s-1 cm2 assuming an absorbed power-law model with photon index () for the source. The source was not detected by ROSAT and considering its upper limit flux in ROSAT data ( erg s-1 cm2), it has brightened by a factor of 12 over the last 30 years. van den Eijnden et al. (2020) analysed follow-up observations of this source carried out with Swift and the Very Large Array (VLA). The spectrum of Swift/XRT is fitted with an absorbed power-law model with a photon index of , resulting in an unabsorbed flux of erg s-1 cm-2. The VLA observation confirms a radio counterpart for the source. According to the spectral index of =0.180.25, calculated from fluxes of 19322 Jy and 1767 Jy at 4.5 (GHz) and 7.5 (GHz) bands, respectively (where the flux density is ), van den Eijnden et al. (2020) suggested that the spectrum is similar to that of a compact jet of X-ray binaries. Moreover, they concluded that assuming a distance of kpc for the source, its X-ray luminosity matches either a black hole X-ray binary or a radio-bright neutron star X-ray binary. Furthermore, by assuming a distance of 7 kpc, the X-ray and radio luminosities support an X-ray binary nature for a low-luminosity transient (van den Eijnden et al. 2020). In addition, available optical catalogues show no counterpart for the source, while the optical follow-up observation of iTelescope in Siding Spring, Australia confirms an optical counterpart for the source with a magnitude of (Kong 2020). We note that the source was observed by XMM-Newton in 2021. Figure 10 shows the spectrum of XMM-Newton EPIC-pn camera. The spectrum is fitted well with an absorbed (black-body+power law) model. The value of cm-2 is comparable to the Galactic column density in the direction of SRGEt J071522.1-191609, therefore, no intrinsic absorption for the system has been confirmed in the spectrum. The black-body has a temperature of keV and the power law has a photon index of . The spectrum indicates an unabsorbed flux of erg s-1 cm-2 (consistent with the Swift flux) and a luminosity of erg s-1 assuming a distance of 7 kpc. The light curve of SRGEt J071522.1-191609 shows no dimming, flare, or significant variability over the XMM-Newton observing time. A Z2-analysis (Buccheri et al. 1983) using the first and the second harmonic values of , 2 on the barycentrically corrected event files to search for periodic signals in the period range 0.114 s–25 ks to a period corresponding to the length of observation (25 ks) and a Lomb-Scargle periodogram fail to reveal a significant periodicity for the source. Assuming a typical luminosity for transient LMXBs (i.e, –; e.g. Saeedi et al. 2022), the source can be a member of CMa OD with a distance of 7. kpc.
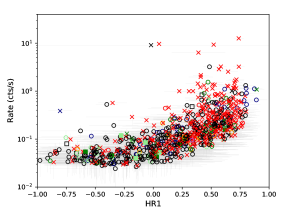
So far, neither super-soft sources nor supernova remnants (SNRs) have been identified in CMa OD. Figure 8 presents the count rate of the X-ray sources over the HR1. The bright and soft X-ray sources are typically Galactic sources (in red). There are a few very soft X-ray sources (HR1¡0) that might belong to CMa OD (green). However, they are too faint for a spectral analysis using eROSITA data and follow-up X-ray observations are required.
Moreover, we have also identified symbiotic star candidates using the criteria based on the machine learning method of Akras et al. (2019). With respect to the sources for which WISE and 2MASS counterparts were found and which have been classified as stellar objects, we have checked the following IR colours. Akras et al. (2019) showed that the majority of symbiotic stars appear to have and only a small fraction of S-type symbiotics behave differently. The second criterion is , which separates the symbiotic stars significantly from the other types of sources. The second criterion might not apply for dusty symbiotic stars. In this case, there are two other criteria for the colours: and . We applied all the above conditions to classify symbiotic stars in the field of CMa OD. We found 34 sources as symbiotic star candidates, which are marked with a purple colour in all plots. None of these sources were bright enough to perform an X-ray spectral analysis, so they belong to either CMa OD or to the Milky Way. However, due to the lack of significant parallax measurements, their distances remain unknown.
6.2 XLF
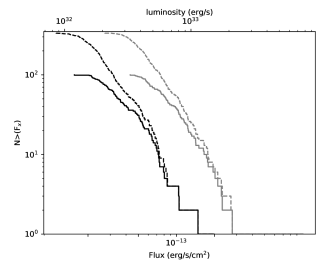
In a population of low-mass stars as in CMa OD, we would expect the majority of X-ray sources to form the three classes of AWDs, transient LMXBs, and active binaries. To understand the luminosity of the X-ray sources in CMa OD, we have to consider that it is the closest dSph to the Milky Way and is located behind the Galactic disk; therefore, not only is the apparent size of this galaxy large, but the foreground column density is not homogeneous over the entire dSph (see the left plot of Fig. 11).We used the measurements of the HI4PI Collaboration et al. (2016). However, for the absorption of X-ray sources we need an estimate of the molecular hydrogen column density () as well to calculate the total column density of +. We estimated the using the equation provided by (Willingale et al. 2013), which allows us to estimate the using and the extinction values (E()).We calculated the flux of each source in the energy range of 0.2–2.0 keV assuming a power-law model, with a photon index of this is the value typically considered for the contribution of unknown sources to the XLFs that are most likely to be AGNs (e.g. Cappelluti et al. 2009). For each source, the absorbed and the unabsorbed flux were estimated using the cflux model of Xspec (V.12.13.0). Figure 11 shows the result of the XLF of CMa OD members and member candidates. It presents a population of X-ray sources with an unabsorbed luminosity between – erg s-1, which is expected to be mainly a population of AWDs or transient LMXBs. Only 10 sources have a luminosity erg s-1, which are candidates for either symbiotic stars or transient X-ray sources. We do not have a population of active binaries as eRASS1 is not sensitive enough to detect sources with luminosities of erg s-1 at the distance presented by CMa OD.
7 Summary
With the goal of classifying X-ray sources detected with eROSITA, we performed a multi-wavelength analysis of the counterparts of X-ray sources in the field of CMa OD. The majority of the faint sources exhibit a large X-ray positional error, which leads to the association of multiple optical or IR counterparts for each source. Therefore, we have developed an algorithm to select the most probable class for a source in a systematic way based on the available information of optical and IR counterparts.
From a total number of 8311 sources, 1901 have entries in SIMBAD with classification (see Table. 3). 507 sources have been already identified as background sources in other catalogues. In this study, we have successfully identified 946 new background sources and 274 candidates. We classified 1029 sources as Galactic foreground objects, 20 sources as Galactic foreground candidates, 435 sources as stellar objects (which may either be Galactic sources or members of CMa OD), and 189 sources as stellar object candidates. Out of the stellar objects, 100 sources are considered to be members of CMa OD and 235 to be candidate members of CMa OD. They are expected to be mainly AWD systems according to their X-ray luminosities. Finally, 2936 sources remained unclassified.
Due to the short exposure time of eRASS1 (average of 250 s in the field of CMa OD) that results in poor photon statistics, the study of the spectral properties of the sources was limited to the HRs. There was no SNR, nor any super-soft source found in the CMa OD. Moreover, a few hard sources were detected, which are all known sources. As discussed in Sect. 6.1, one source is a known HMXB and another is a new transient LMXB candidate. Our results show a significant number of low-luminosity X-ray sources that are candidates for different types of AWDs. None of these sources were bright enough for their spectra to be studied in detail. The X-ray sources in CMa OD are ideal targets for follow-up X-ray studies and surveys given the likelihood that they are transient X-ray sources.
Acknowledgements.
This work was supported by the Deutsche Forschungsgemeinschaft through the project SA 2131/15-1. This work is based on data from eROSITA, the soft X-ray instrument aboard SRG, a joint Russian-German science mission supported by the Russian Space Agency (Roskosmos), in the interests of the Russian Academy of Sciences represented by its Space Research Institute (IKI), and the Deutsches Zentrum für Luft- und Raumfahrt (DLR). The SRG spacecraft was built by Lavochkin Association (NPOL) and its subcontractors, and is operated by NPOL with support from the Max Planck Institute for Extraterrestrial Physics (MPE). The development and construction of the eROSITA X-ray instrument was led by MPE, with contributions from the Dr. Karl Remeis Observatory Bamberg & ECAP (FAU Erlangen-Nuernberg), the University of Hamburg Observatory, the Leibniz Institute for Astrophysics Potsdam (AIP), and the Institute for Astronomy and Astrophysics of the University of Tübingen, with the support of DLR and the Max Planck Society. The Argelander Institute for Astronomy of the University of Bonn and the Ludwig Maximilians Universität Munich also participated in the science preparation for eROSITA. This research has made use of the SIMBAD and VIZIER database, operated at CDS, Strasbourg, France, and of the NASA/IPAC Extra-galactic Database (NED), which is operated by the Jet Propulsion Laboratory, California Institute of Technology, under contract with the National Aeronautics and Space Administration. This publication makes use of data products from the Wide field Infrared Survey Explorer, which is a joint project of the University of California, Los Angeles, and the Jet Propulsion Laboratory/California Institute of Technology, funded by the National Aeronautics and Space Administration. This publication has made use of data products from the Two Micron All Sky Survey, which is a joint project of the University of Massachusetts and the Infrared Processing and Analysis Center, funded by the National Aeronautics and Space Administration and the National Science Foundation. This research has made use of SAO Image DS9, developed by Smithsonian Astrophysical Observatory. The Digitized Sky Surveys were produced at the Space Telescope Science Institute under U.S. Government grant NAG W-2166. The images of these surveys are based on photographic data obtained using the Oschin Schmidt Telescope on Palomar Mountain and the UK Schmidt Telescope. The plates were processed into the present compressed digital form with the permission of these institutions. The National Geographic Society - Palomar Observatory Sky Atlas (POSS-I) was made by the California Institute of Technology with grants from the National Geographic Society. The Second Palomar Observatory Sky Survey (POSS-II) was made by the California Institute of Technology with funds from the National Science Foundation, the National Geographic Society, the Sloan Foundation, the Samuel Oschin Foundation, and the Eastman Kodak Corporation. The Oschin Schmidt Telescope is operated by the California Institute of Technology and Palomar Observatory. The UK Schmidt Telescope was operated by the Royal Observatory Edinburgh, with funding from the UK Science and Engineering Research Council (later the UK Particle Physics and Astronomy Research Council), until 1988 June, and thereafter by the Anglo-Australian Observatory. The blue plates of the southern Sky Atlas and its Equatorial Extension (together known as the SERC-J), as well as the Equatorial Red (ER), and the Second Epoch [red] Survey (SES) were all taken with the UK Schmidt.References
- Aihara et al. (2018) Aihara, H., Armstrong, R., Bickerton, S., et al. 2018, PASJ, 70, S8
- Akras et al. (2019) Akras, S., Leal-Ferreira, M. L., Guzman-Ramirez, L., & Ramos-Larios, G. 2019, MNRAS, 483, 5077
- Andriantsaralaza et al. (2022) Andriantsaralaza, M., Ramstedt, S., Vlemmings, W. H. T., & De Beck, E. 2022, A&A, 667, A74
- Bailer-Jones et al. (2021) Bailer-Jones, C. A. L., Rybizki, J., Fouesneau, M., Demleitner, M., & Andrae, R. 2021, AJ, 161, 147
- Bellazzini et al. (2002) Bellazzini, M., Ferraro, F. R., Origlia, L., et al. 2002, AJ, 124, 3222
- Bellazzini et al. (2006) Bellazzini, M., Ibata, R., Martin, N., et al. 2006, MNRAS, 366, 865
- Brunner et al. (2022) Brunner, H., Liu, T., Lamer, G., et al. 2022, A&A, 661, A1
- Buccheri et al. (1983) Buccheri, R., Bennett, K., Bignami, G. F., et al. 1983, A&A, 128, 245
- Cappelluti et al. (2009) Cappelluti, N., Brusa, M., Hasinger, G., et al. 2009, A&A, 497, 635
- Carballo-Bello et al. (2021) Carballo-Bello, J. A., Martínez-Delgado, D., Corral-Santana, J. M., et al. 2021, MNRAS, 501, 1690
- Cutri & et al. (2014) Cutri, R. M. & et al. 2014, VizieR Online Data Catalog, II/328
- Cutri et al. (2003) Cutri, R. M., Skrutskie, M. F., van Dyk, S., et al. 2003, VizieR Online Data Catalog, II/246
- Dai et al. (2015) Dai, X., Griffin, R. D., Kochanek, C. S., Nugent, J. M., & Bregman, J. N. 2015, ApJS, 218, 8
- de Boer et al. (2018) de Boer, T. J. L., Belokurov, V., & Koposov, S. E. 2018, MNRAS, 473, 647
- de Jong et al. (2007) de Jong, J. T. A., Butler, D. J., Rix, H. W., Dolphin, A. E., & Martínez-Delgado, D. 2007, ApJ, 662, 259
- Dey et al. (2019) Dey, A., Schlegel, D. J., Lang, D., et al. 2019, AJ, 157, 168
- Ducati (2002) Ducati, J. R. 2002, VizieR Online Data Catalog
- Edelson & Malkan (2012) Edelson, R. & Malkan, M. 2012, ApJ, 751, 52
- El-Badry et al. (2021) El-Badry, K., Rix, H.-W., & Heintz, T. M. 2021, MNRAS, 506, 2269
- Fabricius et al. (2021) Fabricius, C., Luri, X., Arenou, F., et al. 2021, A&A, 649, A5
- Flesch (2021) Flesch, E. W. 2021, VizieR Online Data Catalog, VII/290
- Forbes & Bridges (2010) Forbes, D. A. & Bridges, T. 2010, MNRAS, 404, 1203
- Frebel et al. (2010) Frebel, A., Kirby, E. N., & Simon, J. D. 2010, Nature, 464, 72
- Gaia Collaboration et al. (2023) Gaia Collaboration, Vallenari, A., Brown, A. G. A., et al. 2023, A&A, 674, A1
- Gokus et al. (2020) Gokus, A., Rau, A., Wilms, J., et al. 2020, The Astronomer’s Telegram, 13657, 1
- HI4PI Collaboration et al. (2016) HI4PI Collaboration, Ben Bekhti, N., Flöer, L., et al. 2016, A&A, 594, A116
- Kong (2020) Kong, A. K. H. 2020, The Astronomer’s Telegram, 13669, 1
- Kuijken et al. (2019) Kuijken, K., Heymans, C., Dvornik, A., et al. 2019, A&A, 625, A2
- Maccacaro et al. (1988) Maccacaro, T., Gioia, I. M., Wolter, A., Zamorani, G., & Stocke, J. T. 1988, ApJ, 326, 680
- Martin et al. (2004) Martin, N. F., Ibata, R. A., Bellazzini, M., et al. 2004, MNRAS, 348, 12
- McConnachie (2012) McConnachie, A. W. 2012, AJ, 144, 4
- McLean et al. (2000) McLean, B. J., Greene, G. R., Lattanzi, M. G., & Pirenne, B. 2000, in Astronomical Society of the Pacific Conference Series, Vol. 216, Astronomical Data Analysis Software and Systems IX, ed. N. Manset, C. Veillet, & D. Crabtree, 145
- Merloni et al. (2024) Merloni, A., Lamer, G., Liu, T., et al. 2024, A&A, 682, A34
- Momany et al. (2006) Momany, Y., Zaggia, S., Gilmore, G., et al. 2006, A&A, 451, 515
- Mukai (2017) Mukai, K. 2017, PASP, 129, 062001
- Predehl et al. (2021) Predehl, P., Andritschke, R., Arefiev, V., et al. 2021, A&A, 647, A1
- Saeedi et al. (2022) Saeedi, S., Liu, T., Knies, J., et al. 2022, A&A, 661, A35
- Saeedi & Sasaki (2020) Saeedi, S. & Sasaki, M. 2020, MNRAS, 499, 3111
- Saeedi & Sasaki (2022) Saeedi, S. & Sasaki, M. 2022, MNRAS, 512, 5481
- Saeedi et al. (2018) Saeedi, S., Sasaki, M., & Ducci, L. 2018, MNRAS, 473, 440
- Saeedi et al. (2019) Saeedi, S., Sasaki, M., Stelzer, B., & Ducci, L. 2019, A&A, 627, A128
- Salvato et al. (2018) Salvato, M., Buchner, J., Budavári, T., et al. 2018, MNRAS, 473, 4937
- Salvato et al. (2022) Salvato, M., Wolf, J., Dwelly, T., et al. 2022, A&A, 661, A3
- Sazonov et al. (2006) Sazonov, S., Revnivtsev, M., Gilfanov, M., Churazov, E., & Sunyaev, R. 2006, A&A, 450, 117
- Schlafly & Finkbeiner (2011) Schlafly, E. F. & Finkbeiner, D. P. 2011, ApJ, 737, 103
- Secrest et al. (2015) Secrest, N. J., Dudik, R. P., Dorland, B. N., et al. 2015, ApJS, 221, 12
- Smith et al. (2001) Smith, R. K., Brickhouse, N. S., Liedahl, D. A., & Raymond, J. C. 2001, ApJ, 556, L91
- Stiele et al. (2011) Stiele, H., Pietsch, W., Haberl, F., et al. 2011, A&A, 534, A55
- Tolstoy et al. (2009) Tolstoy, E., Hill, V., & Tosi, M. 2009, ARA&A, 47, 371
- van den Eijnden et al. (2020) van den Eijnden, J., Degenaar, N., Wijnands, R., et al. 2020, The Astronomer’s Telegram, 13716, 1
- Wenger et al. (2000) Wenger, M., Ochsenbein, F., Egret, D., et al. 2000, A&AS, 143, 9
- Willingale et al. (2013) Willingale, R., Starling, R. L. C., Beardmore, A. P., Tanvir, N. R., & O’Brien, P. T. 2013, MNRAS, 431, 394
- Wright et al. (2010) Wright, E. L., Eisenhardt, P. R. M., Mainzer, A. K., et al. 2010, AJ, 140, 1868
- Yang et al. (2022) Yang, H., Hare, J., Kargaltsev, O., et al. 2022, ApJ, 941, 104
Appendix A Source catalogue
| NO | eROSITA SRC-Name | RA | DEC | r1 | Flux (0.2–5. keV) | ML | HR1 | HR2 | HR3 | HR4 | Classification∗ | Comment∗∗ |
| (J2000) | (J2000) | () | erg s-1 cm-2) | |||||||||
| 1 | 1eRASS J063832.0-164540 | 06 38 32.03 | -16 45 40.8 | 4.00 | 8.94E-143.09E-14 | 20.82 | – | – | – | – | AGN | |
| 2 | 1eRASS J063838.3-164956 | 06 38 38.39 | -16 49 56.5 | 3.25 | 1.41E-133.90E-14 | 38.36 | – | 0.090.28 | – | – | AGN | |
| 3 | 1eRASS J063839.6-164412 | 06 38 39.63 | -16 44 12.9 | 4.91 | 3.66E-141.91E-14 | 7.74 | – | – | – | – | FG | SIMBAD: TYC 5948-2725-1 |
| 4 | 1eRASS J063847.8-172310 | 06 38 47.82 | -17 23 10.1 | 5.10 | 5.32E-142.41E-14 | 10.54 | – | – | – | – | AGN | |
| 5 | 1eRASS J063851.0-161150 | 06 38 51.00 | -16 11 50.7 | 5.05 | 3.06E-141.78E-14 | 6.30 | – | – | – | – | – | |
| 6 | 1eRASS J063858.1-164847 | 06 38 58.10 | -16 48 47.4 | 4.53 | 3.59E-141.95E-14 | 6.78 | – | – | – | – | – | |
| 7 | 1eRASS J063859.7-174517 | 06 38 59.79 | -17 45 17.5 | 4.81 | 4.92E-142.31E-14 | 10.90 | – | – | – | – | FG | SIMBAD: ATO J099.7479-17.7554 |
| 8 | 1eRASS J063907.5-155410 | 06 39 07.57 | -15 54 10.2 | 3.86 | 7.76E-142.96E-14 | 19.20 | – | 0.050.41 | – | – | AGN | SIMBAD: PMN J0639-1554 |
| 9 | 1eRASS J063908.2-155555 | 06 39 08.22 | -15 55 55.4 | 5.67 | 3.90E-142.09E-14 | 6.48 | – | – | – | – | – | |
| 10 | 1eRASS J063908.5-165212 | 06 39 08.58 | -16 52 12.4 | 4.18 | 4.07E-142.08E-14 | 9.28 | – | – | – | – | STRL | |
| 11 | 1eRASS J063920.0-155101 | 06 39 20.07 | -15 51 01.3 | 4.84 | 5.30E-142.49E-14 | 9.23 | – | – | – | – | FG | SIMBAD: TYC 5948-2389-1 |
| 12 | 1eRASS J063924.7-163408 | 06 39 24.78 | -16 34 08.8 | 5.28 | 4.17E-142.24E-14 | 7.03 | – | – | – | – | – | |
| 13 | 1eRASS J063925.0-163635 | 06 39 25.06 | -16 36 35.6 | 7.59 | 3.82E-142.09E-14 | 6.18 | – | – | – | – | AGN | |
| 14 | 1eRASS J063925.1-164145 | 06 39 25.14 | -16 41 45.2 | 5.73 | 5.98E-143.00E-14 | 10.81 | – | – | – | – | AGN | |
| 15 | 1eRASS J063928.1-165406 | 06 39 28.10 | -16 54 06.5 | 7.99 | 4.14E-142.22E-14 | 6.16 | – | – | – | – | AGN | |
| 16 | 1eRASS J063935.4-155944 | 06 39 35.50 | -15 59 44.6 | 3.66 | 5.42E-142.41E-14 | 14.53 | – | – | – | – | FG | SIMBAD: ASAS J063936-1559.8 |
| 17 | 1eRASS J063936.8-180249 | 06 39 36.89 | -18 02 49.8 | 4.53 | 3.52E-142.04E-14 | 6.28 | – | – | – | – | – | |
| 18 | 1eRASS J063937.2-163926 | 06 39 37.23 | -16 39 26.1 | 5.04 | 3.65E-142.13E-14 | 6.39 | – | – | – | – | FG | SIMBAD: TYC 5948-1925-1 |
| 19 | 1eRASS J063947.3-175218 | 06 39 47.33 | -17 52 18.8 | 5.28 | 5.17E-142.40E-14 | 11.63 | – | 0.120.43 | – | – | – | |
| 20 | 1eRASS J063949.4-154343 | 06 39 49.44 | -15 43 43.4 | 4.82 | 3.24E-141.89E-14 | 6.04 | – | – | – | – | – | |
| … | ||||||||||||
| :The full catalogue is available at the CDS. The table presents the ID of source in this work (NO), eROSITA source name in Merloni et al. (2024) catalogue, Right ascension (RA), | ||||||||||||
| Declination (DEC), 1 positional error of the source (r), source flux, Detection maximum likelihood (ML), significant hardness ratios of sources based on the energy bands which are | ||||||||||||
| defined in Sect. 5.2, classification of the source based on this work, and comments column presents the SIMBAD ID of the sources as exist in SIMBAD data base. | ||||||||||||
| *: AGN: Active galactic nuclei; FG: Foreground star; SYM: Symbiotic star; STRL: stellar object; Can: Candidate | ||||||||||||
Appendix B Source WISE-Gaia counterpart
| NO | W1 | W2 | W3 | W4 | G-mag | RG-0mag | BG-mag |
|---|---|---|---|---|---|---|---|
| 1 | 14.070.02 | 12.85 0.02 | 9.94 0.05 | 7.30 0.11 | 18.810.01 | 18.28 0.03 | 19.09 0.05 |
| 2 | 15.74 0.05 | 14.80 0.06 | 12.00 0.29 | 8.28 | 20.39 0.02 | 19.64 0.12 | 20.84 0.24 |
| 3 | 10.13 0.02 | 10.16 0.02 | 10.11 0.06 | 8.95 0.46 | 11.94 0.01 | 11.36 0.01 | 12.36 0.01 |
| 4 | 15.53 0.04 | 14.910.07 | 12.080.34 | 8.96 0.51 | 21.01 0.02 | 19.88 0.24 | 20.64 0.13 |
| 5 | 15.24 0.04 | 15.13 0.07 | 12.10 | 8.88 | 17.76 0.01 | 17.09 0.02 | 18.18 0.02 |
| 6 | – | – | – | – | – | – | – |
| 7 | 8.29 0.02 | 8.33 0.02 | 8.23 0.02 | 8.34 0.27 | 11.35 0.01 | 10.49 0.01 | 12.080.01 |
| 8 | 14.490.02 | 13.320.03 | 10.56 0.08 | 8.11 0.21 | – | – | – |
| 9 | 12.35 0.02 | 12.39 0.02 | 12.36 | 9.02 | 14.76 0.01 | 14.040.01 | 15.32 0.01 |
| 10 | 11.730.02 | 11.71 0.02 | 11.28 0.15 | 8.60 | 14.34 0.01 | 13.430.01 | 14.760.01 |
| 11 | 10.420.02 | 10.42 0.02 | 10.29 0.06 | 8.84 | 11.83 0.01 | 11.35 0.01 | 12.140.01 |
| 12 | 14.66 0.03 | 14.53 0.05 | 12.71 | 9.02 | 19.08 0.01 | 17.70 0.01 | 20.59 0.13 |
| 13 | 14.620.03 | 14.330.05 | 12.23 0.34 | 8.86 | 12.490.01 | 11.48 0.01 | 13.310.01 |
| 14 | – | – | – | – | 20.480.02 | 9.840.14 | 20.800.20 |
| 15 | 13.73 0.033 | 12.61 0.02 | 9.95 0.05 | 7.70 0.14 | 18.920.01 | 19.160.10 | 18.170.05 |
| 16 | 10.780.02 | 10.80 0.02 | 10.800.11 | 8.88 | 13.10 0.01 | 12.370.03 | 13.54 0.04 |
| 17 | 16.79 0.10 | 17.01 0.35 | 12.486 | 8.822 | – | – | – |
| 18 | 8.64 0.02 | 8.66 0.02 | 8.60 0.02 | 8.120.21 | 9.70 0.01 | 9.32 0.01 | 9.930.01 |
| 19 | 12.040.02 | 12.07 0.021 | 12.57 0.43 | 8.88 | 14.30 0.01 | 13.62 0.01 | 14.83 0.01 |
| 20 | 11.550.02 | 11.56 0.02 | 11.49 0.18 | 9.12 | 18.95 0.01 | 18.20 0.02 | 19.58 0.03 |
| … | |||||||
| : Full catalogue is available at the CDS. The table shows the magnitudes of WISE and Gaia counterpart of the X-ray sources | |||||||
| (see Sects. 3.1 and 3.2) The magnitudes without errors are only upper limits. | |||||||