Conditional Quantile Estimation for Uncertain Watch Time in Short-Video Recommendation
Abstract.
Accurately predicting watch time is crucial for optimizing recommendations and user experience in short video platforms. However, existing methods that estimate a single average watch time often fail to capture the inherent uncertainty and diversity in user engagement patterns. In this paper, we propose the Conditional Quantile Estimation (CQE) framework to model the entire conditional distribution of watch time. Using quantile regression, CQE characterizes the complex watch-time distribution for each user-video pair, providing a flexible and comprehensive approach to understanding user behavior. We further design multiple strategies to combine the quantile estimates, adapting to different recommendation scenarios and user preferences. Extensive offline experiments and online A/B tests demonstrate the superiority of CQE in watch time prediction and user engagement modeling. In particular, the online deployment of CQE in a short-video platform serving hundreds of millions of daily active users has led to significant improvements in key evaluation metrics, including active days, active users, engagement duration, and video view counts. These results highlight the practical impact of our proposed approach in enhancing the user experience and overall performance of the short video recommendation system. The code will be released after publication.
1. Introduction
The rapid growth of online video platforms has revolutionized the way users consume digital content, and short videos are emerging as one of the most popular formats (Liu et al., 2021, 2019; Davidson et al., 2010; Zhou et al., 2010). Recommender systems play a crucial role in these platforms by providing personalized content recommendations to enhance user engagement and satisfaction. Unlike traditional recommendation problems (e.g., e-commerce and news recommendation), a key metric for measuring user interest and engagement in short video recommendation is watch time, which comprehensively reflects users’ preferences and involvement. Therefore, accurately predicting watch time is vital for optimizing recommendation strategies and improving user experience.
However, predicting watch time remains a challenging task due to the inherent uncertainty and heterogeneity in user behavior. In real-world scenarios, it is often infeasible to obtain multiple observations of watch time for the same user-video pair under identical conditions, as users rarely watch the same video multiple times in the exact same context. This limitation prevents us from directly estimating the true conditional watch time distribution from the data.
Existing methods (Zhan et al., 2022; Tang et al., 2023; Zheng et al., 2022; Zhao et al., 2023) often focus on predicting a single-point estimate of watch time (e.g., mean or median), overlooking the complexity and diversity of the watch time distribution. These methods fail to fully capture the behavioral differences across various user-video pairs, leading to limitations in recommendation performance. The inadequacy of using a single average value to characterize these complex distribution patterns underscores the need to model the entire conditional distribution of watch time.
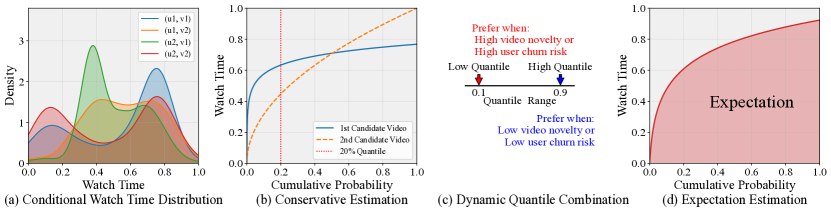
To address these challenges, we propose the Conditional Quantile Estimation (CQE) framework, which learns to predict the conditional distribution of watch time given the user-video pair and its associated context. As shown in Figure 2, CQE leverages quantile regression technique to estimate multiple quantiles of the watch time distribution, providing a comprehensive view of potential user engagement patterns. As illustrated in Figure 1(a), the conditional watch time distributions predicted by our CQE model for different user-video pairs exhibit significant diversity in their shapes, peak positions, and dispersion levels. This heterogeneity reflects the intrinsic uncertainty and variability in user preferences and engagement across different contexts.
Modeling the conditional distribution of watch time is crucial to understanding user engagement patterns and designing effective recommendation strategies. By considering the detailed characteristics of the watch time distribution, we can gain insight into the diverse watching behaviors of different user groups. This granular understanding enables us to tailor recommendation strategies for various scenarios and user preferences.
Based on the CQE model, we design three primary recommendation strategies. The conservative estimation strategy (Figure 1(b)) prioritizes user satisfaction by selecting videos with higher lower quantiles when the expected watch times are similar, mitigating disengagement risks for users. The dynamic quantile combination strategy (Figure 1(c)) adapts the choice of quantiles based on factors such as the user’s churn risk and video novelty. It assigns more weight to the Low Quantile for high-churn-risk users or novel videos, ensuring a satisfactory experience, and more weight to the High Quantile for low-churn-risk users or familiar videos, potentially offering more engaging recommendations. Finally, the expectation estimation strategy (Figure 1(d)) provides a global optimization perspective, aiming to maximize overall user engagement considering the entire watch time distribution. The diversity of these strategies allows our recommendation system to adapt to different scenarios and user needs, enhancing the quality of personalized recommendations and user experience.
The main contributions of this paper are as follows: :
-
•
We propose the CQE framework, which employs quantile regression technique to model the conditional distribution of watch time in short video recommendation, offering a principled approach to capture the uncertainty in user behavior.
-
•
We design multiple strategies to combine the quantile estimates from CQE, adapting to different recommendation scenarios and user preferences, enhancing the personalization and diversity of the recommendation system.
-
•
We conduct extensive offline experiments and online A/B tests to demonstrate the superiority of CQE in watch time prediction and user engagement modeling, significantly improving key evaluation metrics, including active days, active users, engagement duration, and video view counts.
2. Related Work
2.1. Video Recommendation and Watch-time Prediction
Video recommendation systems have evolved to cater to the growing demand for personalized content delivery. With the advent of online video platforms like YouTube and TikTok, the importance of accurate video recommendation has been underscored by the significant impact on user retention and satisfaction (Liu et al., 2021, 2019; Davidson et al., 2010; Zhou et al., 2010; Tang et al., 2023). In the realm of video recommendation systems, accurately predicting user engagement through watch time is a critical challenge. Watch time serves as a key metric for gauging user interest and engagement with recommended videos. The initial study (Covington et al., 2016) centered on enhancing video recommendations for the YouTube platform, introducing the Weighted Logistic Regression (WLR) technique for predicting watch time. This approach has since been recognized as an advanced method in its field. Nevertheless, the WLR’s applicability is not straightforward to full-screen video recommendation systems, and it could encounter significant bias problems attributable to its weighted calculation system. D2Q (Zhan et al., 2022) mitigates the duration bias through the implementation of backdoor adjustments and modeling the watch-time quantile under different duration groups. Co (Zhao et al., 2023) tackles the problem of bias in video recommendation watch times by using a model that corrects for both duration bias and noisy watching, providing a more accurate measure of user interest. DVR (Zheng et al., 2022) introduces a new metric called WTG (Watch Time Gain) and uses adversarial learning to learn unbiased user preferences. Our method can be seamlessly integrated into a wide array of duration debiased methods, thereby significantly improving their predictive accuracy. TPM (Lin et al., 2023) breaks down the task into a series of interconnected classification problems arranged in a tree-like structure. Although TPM considers watch-time variance, it does not capture the full breadth of the watch-time distribution as our method does.
The watch-time prediction task also faces the critical problem of duration bias (Zhao et al., 2023; Zhan et al., 2022; Zheng et al., 2022; Lin et al., 2023). This bias indicates that users prefer to spend more time watching longer-duration videos, skewing the average watch time in favor of longer content. This preference for duration over shorter alternatives complicates the task of accurately predicting user engagement. Our methodology integrates seamlessly with most duration debiasing methods, significantly improving their predictive ability, as shown in Table 3.
2.2. Quantile Regression
Quantile regression is a type of regression analysis widely used in statistics, econometrics, and ecology (Koenker, 2005). Unlike traditional mean/linear regression—which focuses on estimating the average outcome, quantile regression seeks to estimate the conditional median and other quantiles of the random variable. This flexible feature provides a more comprehensive understanding of the variable’s distributional effects that mean regression may overlook(Cade and Noon, 2003; Wei et al., 2006; Wei and He, 2006). In the context of machine learning, quantile regression has been extended beyond linear models. Representative approaches (Rodrigues and Pereira, 2018; Petneházi, 2021; Tang et al., 2022) integrate quantile regression into neural networks, offering means to forecast conditional quantiles in non-linear and high-dimensional settings. QRF (Meinshausen, 2006) further deploys quantile regression within random forests, further exemplifying its adaptability and the enhancement of predictive capabilities across diverse models.
The solution presented in this paper intends to integrate the principles of quantile regression into the domain of video recommendation systems. By adapting this statistical approach to account for the uncertainty and variability in watch time, we propose a novel application that enhances the predictive performance of recommendation systems. This advancement promotes a more nuanced understanding of user engagement, driving toward more personalized and satisfactory user experiences.
3. Method
3.1. Problem Formulation
In video recommendation systems, our primary objective is to predict user engagement, typically measured by watch time. Let denote a user-video pair under context . We define a feature mapping function that extracts an -dimensional feature vector . This vector encapsulates user characteristics, video attributes, contextual information, and historical interaction data.
Let be a random variable representing the watch time. Our goal is to estimate the probability distribution of conditioned on the input features:
| (1) |
Unlike traditional approaches (Zhao et al., 2023; Zheng et al., 2022; Covington et al., 2016; Zhan et al., 2022; Tang et al., 2023) that focus on estimating a single point (e.g., the expected watch time ), we aim to characterize the entire conditional distribution. This allows us to capture the inherent uncertainty and variability in user engagement patterns, providing a more comprehensive understanding of potential user behaviors.
3.2. Conditional Quantile Estimation Model
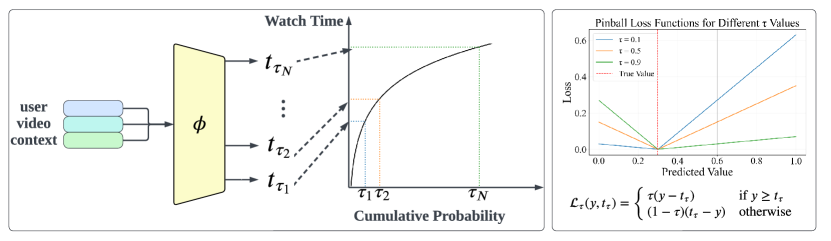
To capture the full distribution of watch time, we propose a Conditional Quantile Estimation (CQE) model. As shown in the left part of Figure 2, this approach allows us to estimate multiple quantiles of the watch time distribution simultaneously, providing a more comprehensive view of potential user engagement.
Let be a set of N predefined quantile levels, where . Our CQE model aims to estimate the corresponding watch time values for each quantile level, given the input features :
| (2) |
where is a neural network parameterized by . To ensure the monotonicity of quantile estimates, we implement the following architecture:
| (3) |
Here, and are neural network components, is an intermediate hidden representation, and is a vector of non-negative elements. The final quantile estimates are obtained through cumulative summation, naturally enforcing the ordering constraint .
This formulation allows our model to capture complex, non-linear relationships between input features and watch time quantiles, while maintaining the necessary monotonicity property of quantile functions.
To provide a clear overview of our CQE approach, we present the algorithm pseudocode in Algorithm 1.
The computational complexity of the CQE model is comparable to traditional point estimation methods, with only a marginal increase due to the estimation of multiple quantiles. In large-scale recommendation systems, the number of unique users and items often reaches hundreds of millions or even billions. These users and items are typically represented by high-dimensional embeddings retrieved using their respective IDs. In contrast, the number of quantiles required for effective estimation is typically around 100. Therefore, the additional computational cost of CQE is negligible compared to the massive computations required to process the massive features.
3.3. Training Objective
To train our CQE model effectively, we employ the pinball loss function, which is tailored for quantile regression tasks. For a single quantile level , the pinball loss is defined as:
| (4) |
where is the actual watch time and is the predicted -th quantile.
As illustrated in the right part of Figure 2, the pinball loss function has several key properties:
-
(1)
Asymmetry: The loss is asymmetric around the true value , with the degree of asymmetry determined by .
-
(2)
Linearity: The loss increases linearly with the distance between the predicted and actual values, but with different slopes on each side of .
-
(3)
Quantile-specific penalties: For , overestimation is penalized more heavily than underestimation, and vice versa for .
These properties make the pinball loss particularly suitable for quantile estimation. For our multi-quantile model, we aggregate the pinball losses across all quantile levels:
| (5) |
This aggregated loss function encourages the model to learn accurate quantile estimates across the entire distribution, capturing the full spectrum of potential watch times for each user-video pair.
3.4. Inference Strategies
Once we have trained our CQE model to estimate multiple quantiles of the watch time distribution, we can employ various strategies for inference. We propose three main approaches: Conservative Estimation, Dynamic Quantile Combination, and Conditional Expectation. Each strategy offers different advantages and is suitable for specific recommendation scenarios.
3.4.1. Conservative Estimation
In environments where user satisfaction is paramount and the cost of overestimation is high, we adopt a conservative estimation (CSE) strategy. This approach focuses on the lower quantiles of the watch time distribution to ensure a satisfactory user experience.
As illustrated in Figure 1(b), when the expected watch times are similar, we prioritize user satisfaction by selecting videos with higher lower quantiles. This strategy helps mitigate the risks of user disengagement.
Formally, we select a lower quantile (e.g. ) and use its corresponding watch time prediction:
| (6) |
This strategy helps mitigate the risk of user disappointment due to overly optimistic recommendations, as the actual watch time is likely to exceed this conservative estimate.
3.4.2. Dynamic Quantile Combination
To adapt to varying user preferences and content characteristics, we propose a dynamic quantile combination (DQC) strategy. This approach combines predictions from different quantiles based on contextual factors.
As shown in Figure 1(c), the DQC strategy adapts the choice of quantiles based on the user’s churn risk and video novelty. It assigns more weight to the Low Quantile for high churn risk users or novel videos, ensuring a satisfactory experience, and more weight to the High Quantile for low churn risk users or familiar videos, potentially offering more engaging recommendations. This dynamic approach allows the system to balance between safe recommendations and potentially more rewarding ones based on the user’s current state and content familiarity.
Let be a context-dependent blending parameter. We compute the final prediction as:
| (7) |
where and represent conservative and optimistic quantile predictions, respectively.
The blending parameter can be adjusted based on factors such as user risk profile, video novelty, or platform objectives. For instance, we might use a higher (favoring conservative estimates) for new users or novel content, and a lower for established users or familiar content types.
3.4.3. Conditional Expectation
For scenarios in which our goal is to optimize the expected watch time, we employ a conditional expectation strategy. This approach estimates the mean watch time by interpolating between the predicted quantiles.
As depicted in Figure 1(d), the conditional expectation estimation (CDE) strategy provides a global optimization perspective, aiming to maximize overall user engagement considering the entire watch time distribution.
As shown in the left part of Figure 2, these output watch-time values exemplify the watch-time distribution. To recover the mean estimation through the conditional expectation, we face the challenge of not having output values for between any two consecutive quantiles. To circumvent this lack of information, we use the interpolation method to approximate the conditional distribution.
We adopt a linear interpolation between consecutive quantiles, so the expected watch-time between and becomes . For the two endpoints, we assume and . Then, we can approximate the overall watch-time expectation as:
| (8) |
Theoretically, this expectation gives the most accurate prediction in general and it would achieve the optimal prediction when . Empirically, we will verify its superiority with our experimental analysis in section 4.2. Yet, we remind readers that this strategy may not be well-suited for scenarios where users are not tolerant of bad recommendations or the recommender system requires dynamic controls.
Each of these inference strategies offers unique benefits, allowing the recommendation system to adapt to different objectives and user contexts. By leveraging the rich information provided by our CQE model, we can make more informed and flexible recommendation decisions.
4. Experiments and Results
In this section, we present a comprehensive evaluation of our Conditional Quantile Estimation (CQE) framework through both online A/B tests and offline experiments. Our experimental design aims to address several interconnected research questions:
-
•
RQ1: How do different CQE strategies perform in real-world scenarios?
-
•
RQ2: How does CQE compare with state-of-the-art methods in watch time prediction and user interest modeling?
-
•
RQ3: What is the impact of the number of quantiles on CQE’s performance?
By exploring these questions, we seek to provide a holistic view of CQE’s capabilities, its practical impact, and its potential for generalization across different recommendation contexts.
4.1. Online Experiments (RQ1)
To validate the real-world impact of our Conditional Quantile Estimation (CQE) framework, we conducted extensive online A/B tests on a short video platform with hundreds of millions of users. These experiments allowed us to assess the practical effectiveness of all three CQE strategies in a live environment with a substantial user base.
4.1.1. Experiment Setup
Users were randomly assigned to control and experimental groups, with a minimum of 10% of daily user traffic allocated to the experimental group to ensure statistical significance. Each online A/B test ran for over a week, providing ample time for data collection and reliable result analysis.
The recommendation system operates in a two-stage process: candidate retrieval followed by ranking. We incorporated the CQE model into the ranking stage to predict watch time, a crucial component of the recommendation process.
We evaluated the performance of the recommendation system using four key metrics:
-
(1)
Average Watch Time per User: This core metric directly measures user engagement by quantifying the average time users spend watching recommended videos.
-
(2)
Total Play Count: This metric accounts for the cumulative number of video plays across all users, reflecting the frequency of user interactions with the recommended content.
-
(3)
Active Days per User: This metric measures the number of days users engage with the platform, indicating user retention.
-
(4)
Active Users per Day: This metric represents the number of unique users who interact with the platform, reflecting the system’s ability to maintain and grow its user base.
4.1.2. Experiment Results
| Active dyas | Active Users |
| +0.033% | +0.031% |
| Strategy | Watch Time | Play Count |
|---|---|---|
| Conservative Estimation | +0.008% | +0.346% |
| Dynamic Quantile Combination | +0.106% | +0.177% |
| Conditional Expectation | +0.165% | -0.088% |
Table 2 and Table 1 summarize the performance of the CQE strategies relative to the baseline across all four metrics:
Conservative Estimation (CSE): CSE yielded a balanced improvement across all metrics. It achieved a modest 0.008% increase in ”Average Watch Time per User” while simultaneously boosting ”Total Play Count” by 0.346%. Furthermore, CSE led to a 0.033% increase in active days and a 0.031% growth in active users. These results indicate that CSE successfully encourages users to interact with more videos, visit the platform more frequently, and maintain longer-term engagement.
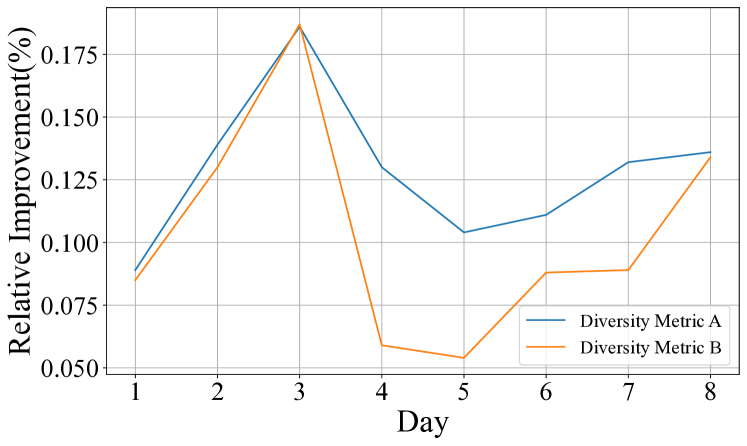
Dynamic Quantile Combination (DQC): By setting the blending parameter k based on content novelty, DQC achieved improvements across both engagement and interaction metrics. It increased ”Average Watch Time per User” by 0.106% and ”Total Play Count” by 0.177%. Figure 3 illustrates that it increased two core diversity metrics over the course of the experiment.
Conditional Expectation (CDE): The CDE methodology demonstrated a statistically significant increase of 0.165% in the ”Average Watch Time per User” metric. However, it showed a slight decrease of 0.088% in ”Total Play Count”. This suggests that CDE effectively increased the depth of user engagement with individual videos, albeit at the cost of slightly reduced breadth of interaction.
These results collectively demonstrate the effectiveness of our CQE framework in improving various aspects of the recommendation system. Each strategy offers unique benefits:
-
•
CSE provides a balanced approach, improving all metrics and particularly excelling at encouraging broader platform interaction and user retention.
-
•
DQC offers a middle ground, improving both depth and breadth of engagement while enhancing content diversity.
-
•
CDE excels at deepening user engagement with individual content pieces.
The choice between these strategies would depend on specific platform goals, such as prioritizing deep engagement, broad interaction, user retention, or content diversity. Moreover, these strategies could potentially be combined or dynamically applied based on user segments or content types to optimize overall system performance.
4.2. Offline Experiments (RQ2 and RQ3)
| Backbone | Method | KuaiRand | |||||||
|---|---|---|---|---|---|---|---|---|---|
| GAUC | nDCG@1 | nDCG@3 | nDCG@5 | GAUC | nDCG@1 | nDCG@3 | nDCG@5 | ||
| DeepFM | PCR + MSE | 0.592 | 0.411 | 0.465 | 0.502 | 0.537 | 0.565 | 0.572 | 0.578 |
| PCR + CE | 0.635 | 0.435 | 0.486 | 0.521 | 0.553 | 0.584 | 0.586 | 0.591 | |
| PCR + CQECDE(Ours) | 0.638 | 0.438 | 0.488 | 0.523 | 0.593 | 0.654 | 0.649 | 0.649 | |
| WTG + MSE | 0.601 | 0.417 | 0.470 | 0.506 | 0.537 | 0.578 | 0.579 | 0.585 | |
| WTG + CE | 0.647 | 0.440 | 0.491 | 0.526 | 0.545 | 0.565 | 0.569 | 0.576 | |
| WTG + CQECDE(Ours) | 0.654 | 0.444 | 0.495 | 0.529 | 0.577 | 0.621 | 0.622 | 0.625 | |
| Co + MSE | 0.606 | 0.416 | 0.473 | 0.509 | 0.528 | 0.578 | 0.577 | 0.580 | |
| Co + CE | 0.656 | 0.447 | 0.496 | 0.530 | 0.531 | 0.570 | 0.571 | 0.576 | |
| Co + CQECDE(Ours) | 0.662 | 0.452 | 0.500 | 0.533 | 0.557 | 0.635 | 0.626 | 0.625 | |
| AutoInt | PCR + MSE | 0.595 | 0.414 | 0.467 | 0.503 | 0.536 | 0.565 | 0.572 | 0.578 |
| PCR + CE | 0.639 | 0.437 | 0.488 | 0.522 | 0.554 | 0.579 | 0.583 | 0.588 | |
| PCR + CQECDE(Ours) | 0.640 | 0.441 | 0.489 | 0.524 | 0.593 | 0.655 | 0.649 | 0.649 | |
| WTG + MSE | 0.602 | 0.419 | 0.470 | 0.507 | 0.536 | 0.568 | 0.573 | 0.578 | |
| WTG + CE | 0.648 | 0.441 | 0.492 | 0.526 | 0.546 | 0.563 | 0.570 | 0.576 | |
| WTG + CQECDE(Ours) | 0.652 | 0.448 | 0.495 | 0.528 | 0.576 | 0.631 | 0.625 | 0.627 | |
| Co + MSE | 0.610 | 0.420 | 0.474 | 0.510 | 0.527 | 0.582 | 0.580 | 0.583 | |
| Co + CE | 0.658 | 0.447 | 0.497 | 0.531 | 0.531 | 0.570 | 0.571 | 0.576 | |
| Co + CQECDE(Ours) | 0.661 | 0.455 | 0.500 | 0.534 | 0.557 | 0.635 | 0.626 | 0.624 | |
While our online A/B tests demonstrated the practical impact of CQE in real-world scenarios, offline experiments allow us to conduct more controlled and detailed analyses of our approach. Our offline experiments focus on two closely related tasks: watch time prediction and user interest prediction. Together, these tasks provide a comprehensive perspective for evaluating the effectiveness of the CQE framework in recommendation systems.
Watch time prediction directly captures the duration of user engagement with content, a key indicator of user involvement. However, predicting watch time alone may not fully capture user interest. Therefore, we introduce the user interest prediction task, which combines watch time with video duration to provide a more nuanced measure of user interest. These two tasks complement each other: watch time prediction offers direct behavioral forecasting, while user interest prediction helps us understand the motivations behind these behaviors.
4.2.1. Watch-Time Prediction.
In this task, our primary objective is to accurately predict the duration of user watch time.
Datasets. Following TPM(Lin et al., 2023), we used two public datasets: Kuaishou (collected from Kuaishou App111https://kuairec.com/) and CIKM16 (from CIKM16 Cup 222https://competitions.codalab.org/competitions/11161) for our experiments. While CIKM16 is primarily an e-commerce search query dataset, we include it to demonstrate the potential generalizability of our CQE approach across different recommendation contexts. The prediction of page dwell time in e-commerce shares similarities with video watch time prediction in terms of modeling user engagement duration, although we acknowledge the differences in content type and user behavior patterns. In CIKM16 dataset, each item in the session is used as a single feature for input. Kuaishou dataset contains 7,176 users, 10,728 items, and 12,530,806 impressions; and CIKM16 dataset contains 310,302 sessions, and 122,991 items and the average length of each session is 3.981.
Metrics. We used two metrics to evaluate the model’s performance: Mean Average Error (MAE) and XAUC(Zhan et al., 2022).
-
•
MAE: This metric is a typical measurement for evaluating regression accuracy. Denote the prediction as and the true watch time as ,
(9) -
•
XAUC: Evaluates if the predictions of two samples are in the same order as their true watch time. It aligns well with the ranking nature of recommendation systems. In practice, the relative order of predictions often matters more than their absolute values, making XAUC particularly relevant to our research goals. It helps us assess whether CQE can effectively capture the nuanced differences in user engagement across different content items.
Baselines. Four state-of-the-art methods for watch time prediction were selected for comparison, including WLR(Weighted Logistic Regression) (Covington et al., 2016), D2Q(Duration-Deconfounded Quantile) (Zhan et al., 2022), OR(Ordinal Regression) (Niu et al., 2016) and TPM(Tree-based Progressive regression Model) (Lin et al., 2023). The first three methods are deterministic, while the latter introduces an element of uncertainty, offering both an estimate of the mean and the variance.
4.2.2. User Interest Prediction.
This task combines watch time with video duration, providing a more comprehensive indicator of user interest. By doing so, we consider not just how long a user spent watching a video, but also how this time relates to the total video length, thus more accurately reflecting the user’s true level of interest.
Following Co (Zhao et al., 2023), in detail, we define the user interest for a given user-video pair as:
| (10) |
where is video duration and is watch-time. We adopted the same training configuration as Co and used the classical deep recommendation model DeepFM (Guo et al., 2017) and the state-of-the-art recommendation model AutoInt (Song et al., 2019) as our backbone recommendation model.
Datasets. Following Co, we leveraged two publicly available real-world datasets: WeChat333https://algo.weixin.qq.com/ and KuaiRand444http://kuairand.com/. These datasets are sourced from prominent micro-video platforms, namely WeChat Channels and Kuaishou. WeChat dataset contains 20,000 users, 96,418 items, 7,310,108 interactions. This dataset, provided through the WeChat Big Data Challenge 2021, encompasses logs from WeChat Channels spanning a two-week period. KuaiRand dataset is a newly released sequential recommendation dataset collected from KuaiShou. As suggested in (Gao et al., 2022), we utilized one of the subsets KuaiRand-pure in this study. It contains 26,988 users, 6,598 items, and 1,266,560 interactions.
Metrics. GAUC(Group Area Under Curve)(Zhu et al., 2017) and nDCG@k (normalized Discounted Cumulative Gain at rank k) (Järvelin and Kekäläinen, 2002) are utilized as the evaluation metric of recommendation performance.
-
•
GAUC: this metric is calculated by weighted averaging the Area Under the ROC Curve (AUC) across different user groups, reflecting the model’s ability to rank items accurately.
-
•
nDCG@k: this metric measures the gain of a recommendation list based on the relevance of items and their positions up to the kth rank, offering insight into the quality of the top recommended items and their ordering.
Baselines. We used the weighted binary cross-entropy loss defined in Co and Mean Squared Loss (MSE) as our baseline. The binary cross-entropy loss is defined as
| (11) |
where is the sigmoid function and is the user’s interest defined by PCR, WTG (Zheng et al., 2022) or Co (Zhao et al., 2023). Following Co, in PCR and WTG, we treat all samples with less than 5 seconds of watch time as 0 values after calculating the value of labels. This can help remove the noise in watch time.
By default, we set the number of quantiles to 100. The value of is selected empirically from 0.2, 0.25, and 0.3. Similarly, the value of is selected empirically from 0.6, 0.7, and 0.8.
| Methods | Kuaishow | CIKM16 | ||
|---|---|---|---|---|
| MAE | XAUC | MAE | XAUC | |
| WLR | 6.047 | 0.525 | 0.998 | 0.672 |
| D2Q | 5.426 | 0.565 | 0.899 | 0.661 |
| OR | 5.321 | 0.558 | 0.918 | 0.664 |
| TPM | 4.741 | 0.599 | 0.884 | 0.676 |
| CQECDE(Ours) | 4.437 | 0.610 | 0.823 | 0.694 |
4.2.3. Experimental Results
We summarize the results as follows:
Comparison between CQECDE and other methods: We compared the performances of different approaches in the watch-time prediction task, and the results are listed in Table 4. Both TPM and CQECDE outperform other methods in both MAE and XAUC metrics, thereby highlighting the significance of incorporating uncertainty into the models. Furthermore, our approach demonstrates superior performance on both metrics compared to TPM, thereby emphasizing the advantages of employing quantile modeling technique. Additionally, the consistent behavior between MAE and XAUC metrics also verifies the feasibility of the watch-time estimation serving as ranking metrics. As for the user interest prediction task, we compare different frameworks across backbone models (DeepFM and AutoInt) and various label designs (PCR, WTG, and Co) and present the results in Table 3, our proposed CQECDE consistently outmatches the alternatives in all cases, indicating the robustness and effectiveness of CQECDE. In terms of the optimization framework, CE generally performs better than MSE, indicating the correctness of including the ordinal categorical information as guidance. And CQECDE can improve over CE across all the designs of user interest metrics (PCR, WTG, and Co), which means that the proposed framework is generalizable to different label settings.
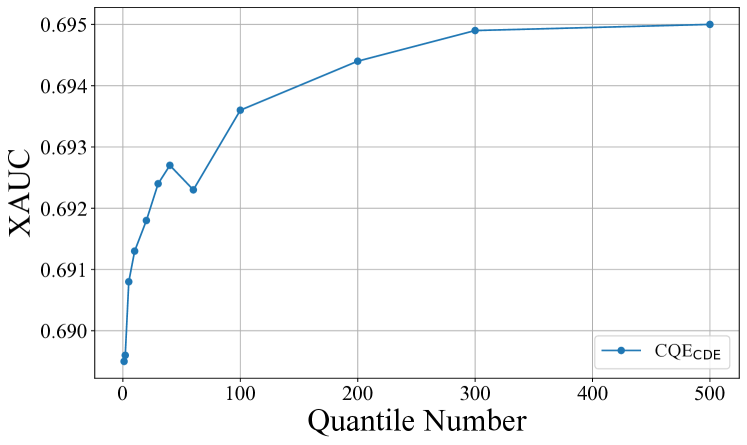
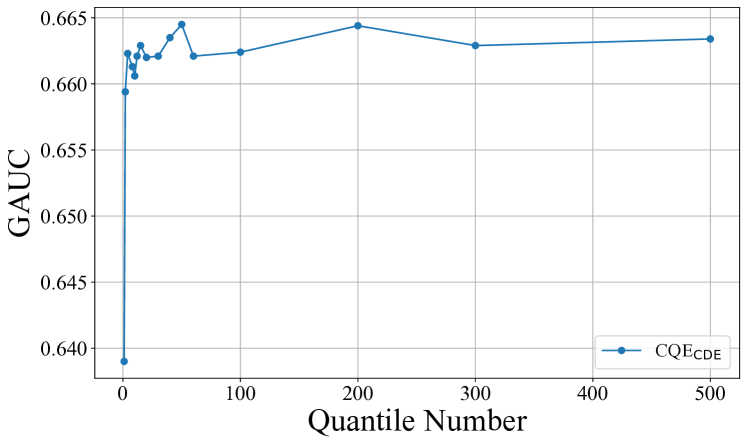
The Effect of Hyper-Parameters in CQECDE: To better investigate the characteristics of the proposed CQE framework, we further conduct an ablation study on the number of quantiles by varying its value from 1 to 500. Theoretically, larger generates a more accurate approximation of the truth expectation and in turn achieves better recommendation performance in general. This is attributed to the fact that more quantiles yield a distribution that closely mirrors the actual one. In the context of the watch time prediction task, as evidenced by Figure 4, the model performance improves with an increase in predicted quantiles. In contrast, for the user interest prediction task, it was observed (shown in Figure 5) that model performance was relatively weak when the number of quantiles was under 10. Beyond 10, the results oscillated around 0.663. Interestingly, unlike the watch time prediction task, more quantiles did not necessarily lead to better results. This discrepancy suggests that there is a gap between the training objective and the user interest label as defined in the testing set. In general, increasing would potentially improve the prediction accuracy under the Conditional Expectation strategy.
In summary, our offline experiments comprehensively demonstrate the superiority of the CQE method in predicting user behavior and interest through these two complementary tasks. The watch time prediction task validates CQE’s accuracy in direct behavioral prediction, while the user interest prediction task further proves CQE’s ability to effectively capture more complex user preferences. The combination of these tasks not only validates the effectiveness of our method but also highlights the flexibility and adaptability of the CQE framework in addressing different yet related challenges in recommendation systems.
A woman and a girl in white dresses sit in an open car.
A woman and a girl in white dresses sit in an open car.
5. Conclusion
This paper introduced the Conditional Quantile Estimation (CQE) framework for modeling uncertain watch time in short-video recommendations. By estimating the entire conditional distribution of watch time, CQE addresses the variability in user engagement patterns. Extensive experiments demonstrated CQE’s superiority in watch time and user interest prediction. It outperformed state-of-the-art baselines and showed significant improvements in key performance indicators on a short-video platform that serves hundreds of millions of daily active users. CQE bridges the gap between theoretical modeling and practical application in recommendation systems, enabling more informed decision-making. Future work could focus on optimizing CQE’s configuration and integrating it with other advanced recommendation techniques.
References
- (1)
- Cade and Noon (2003) Brian S. Cade and Barry R. Noon. 2003. A gentle introduction to quantile regression for ecologists. Frontiers in Ecology and the Environment 1, 8 (2003), 412–420. https://doi.org/10.2307/3868138
- Covington et al. (2016) Paul Covington, Jay Adams, and Emre Sargin. 2016. Deep Neural Networks for YouTube Recommendations. In Proceedings of the 10th ACM Conference on Recommender Systems, Boston, MA, USA, September 15-19, 2016, Shilad Sen, Werner Geyer, Jill Freyne, and Pablo Castells (Eds.). ACM, 191–198. https://doi.org/10.1145/2959100.2959190
- Davidson et al. (2010) James Davidson, Benjamin Liebald, Junning Liu, Palash Nandy, Taylor Van Vleet, Ullas Gargi, Sujoy Gupta, Yu He, Mike Lambert, Blake Livingston, and Dasarathi Sampath. 2010. The YouTube video recommendation system. In Proceedings of the 2010 ACM Conference on Recommender Systems, RecSys 2010, Barcelona, Spain, September 26-30, 2010, Xavier Amatriain, Marc Torrens, Paul Resnick, and Markus Zanker (Eds.). ACM, 293–296. https://doi.org/10.1145/1864708.1864770
- Gao et al. (2022) Chongming Gao, Shijun Li, Yuan Zhang, Jiawei Chen, Biao Li, Wenqiang Lei, Peng Jiang, and Xiangnan He. 2022. Kuairand: an unbiased sequential recommendation dataset with randomly exposed videos. In Proceedings of the 31st ACM International Conference on Information & Knowledge Management. 3953–3957.
- Guo et al. (2017) Huifeng Guo, Ruiming Tang, Yunming Ye, Zhenguo Li, and Xiuqiang He. 2017. DeepFM: A Factorization-Machine based Neural Network for CTR Prediction. In Proceedings of the Twenty-Sixth International Joint Conference on Artificial Intelligence, IJCAI 2017, Melbourne, Australia, August 19-25, 2017, Carles Sierra (Ed.). ijcai.org, 1725–1731. https://doi.org/10.24963/IJCAI.2017/239
- Järvelin and Kekäläinen (2002) Kalervo Järvelin and Jaana Kekäläinen. 2002. Cumulated gain-based evaluation of IR techniques. ACM Trans. Inf. Syst. 20, 4 (2002), 422–446. https://doi.org/10.1145/582415.582418
- Koenker (2005) Roger Koenker. 2005. Quantile Regression. Cambridge University Press. 146–147 pages.
- Lin et al. (2023) Xiao Lin, Xiaokai Chen, Linfeng Song, Jingwei Liu, Biao Li, and Peng Jiang. 2023. Tree based Progressive Regression Model for Watch-Time Prediction in Short-video Recommendation. In Proceedings of the 29th ACM SIGKDD Conference on Knowledge Discovery and Data Mining, KDD 2023, Long Beach, CA, USA, August 6-10, 2023, Ambuj K. Singh, Yizhou Sun, Leman Akoglu, Dimitrios Gunopulos, Xifeng Yan, Ravi Kumar, Fatma Ozcan, and Jieping Ye (Eds.). ACM, 4497–4506. https://doi.org/10.1145/3580305.3599919
- Liu et al. (2019) Shang Liu, Zhenzhong Chen, Hongyi Liu, and Xinghai Hu. 2019. User-Video Co-Attention Network for Personalized Micro-video Recommendation. In The World Wide Web Conference, WWW 2019, San Francisco, CA, USA, May 13-17, 2019, Ling Liu, Ryen W. White, Amin Mantrach, Fabrizio Silvestri, Julian J. McAuley, Ricardo Baeza-Yates, and Leila Zia (Eds.). ACM, 3020–3026. https://doi.org/10.1145/3308558.3313513
- Liu et al. (2021) Yiyu Liu, Qian Liu, Yu Tian, Changping Wang, Yanan Niu, Yang Song, and Chenliang Li. 2021. Concept-Aware Denoising Graph Neural Network for Micro-Video Recommendation. In CIKM ’21: The 30th ACM International Conference on Information and Knowledge Management, Virtual Event, Queensland, Australia, November 1 - 5, 2021, Gianluca Demartini, Guido Zuccon, J. Shane Culpepper, Zi Huang, and Hanghang Tong (Eds.). ACM, 1099–1108. https://doi.org/10.1145/3459637.3482417
- Meinshausen (2006) Nicolai Meinshausen. 2006. Quantile Regression Forests. J. Mach. Learn. Res. 7 (2006), 983–999. http://jmlr.org/papers/v7/meinshausen06a.html
- Niu et al. (2016) Zhenxing Niu, Mo Zhou, Le Wang, Xinbo Gao, and Gang Hua. 2016. Ordinal Regression with Multiple Output CNN for Age Estimation. In 2016 IEEE Conference on Computer Vision and Pattern Recognition, CVPR 2016, Las Vegas, NV, USA, June 27-30, 2016. IEEE Computer Society, 4920–4928. https://doi.org/10.1109/CVPR.2016.532
- Petneházi (2021) Gábor Petneházi. 2021. Quantile convolutional neural networks for Value at Risk forecasting. Machine Learning with Applications 6 (2021), 100096.
- Rodrigues and Pereira (2018) Filipe Rodrigues and Francisco C. Pereira. 2018. Beyond expectation: Deep joint mean and quantile regression for spatio-temporal problems. CoRR abs/1808.08798 (2018). arXiv:1808.08798 http://arxiv.org/abs/1808.08798
- Song et al. (2019) Weiping Song, Chence Shi, Zhiping Xiao, Zhijian Duan, Yewen Xu, Ming Zhang, and Jian Tang. 2019. AutoInt: Automatic Feature Interaction Learning via Self-Attentive Neural Networks. In Proceedings of the 28th ACM International Conference on Information and Knowledge Management, CIKM 2019, Beijing, China, November 3-7, 2019, Wenwu Zhu, Dacheng Tao, Xueqi Cheng, Peng Cui, Elke A. Rundensteiner, David Carmel, Qi He, and Jeffrey Xu Yu (Eds.). ACM, 1161–1170. https://doi.org/10.1145/3357384.3357925
- Tang et al. (2023) Shisong Tang, Qing Li, Dingmin Wang, Ci Gao, Wentao Xiao, Dan Zhao, Yong Jiang, Qian Ma, and Aoyang Zhang. 2023. Counterfactual Video Recommendation for Duration Debiasing. In Proceedings of the 29th ACM SIGKDD Conference on Knowledge Discovery and Data Mining, KDD 2023, Long Beach, CA, USA, August 6-10, 2023, Ambuj K. Singh, Yizhou Sun, Leman Akoglu, Dimitrios Gunopulos, Xifeng Yan, Ravi Kumar, Fatma Ozcan, and Jieping Ye (Eds.). ACM, 4894–4903. https://doi.org/10.1145/3580305.3599797
- Tang et al. (2022) Wenlu Tang, Guohao Shen, Yuanyuan Lin, and Jian Huang. 2022. Nonparametric Quantile Regression: Non-Crossing Constraints and Conformal Prediction. CoRR abs/2210.10161 (2022). https://doi.org/10.48550/ARXIV.2210.10161 arXiv:2210.10161
- Wei and He (2006) Y. Wei and X. He. 2006. Conditional Growth Charts (with discussions). Annals of Statistics 34, 5 (2006), 2069–2097 and 2126–2131. https://doi.org/10.1214/009053606000000623
- Wei et al. (2006) Y. Wei, A. Pere, R. Koenker, and X. He. 2006. Quantile Regression Methods for Reference Growth Charts. Statistics in Medicine 25, 8 (2006), 1369–1382. https://doi.org/10.1002/sim.2271
- Zhan et al. (2022) Ruohan Zhan, Changhua Pei, Qiang Su, Jianfeng Wen, Xueliang Wang, Guanyu Mu, Dong Zheng, Peng Jiang, and Kun Gai. 2022. Deconfounding Duration Bias in Watch-time Prediction for Video Recommendation. In KDD ’22: The 28th ACM SIGKDD Conference on Knowledge Discovery and Data Mining, Washington, DC, USA, August 14 - 18, 2022, Aidong Zhang and Huzefa Rangwala (Eds.). ACM, 4472–4481. https://doi.org/10.1145/3534678.3539092
- Zhao et al. (2023) Haiyuan Zhao, Lei Zhang, Jun Xu, Guohao Cai, Zhenhua Dong, and Ji-Rong Wen. 2023. Uncovering User Interest from Biased and Noised Watch Time in Video Recommendation. In Proceedings of the 17th ACM Conference on Recommender Systems, RecSys 2023, Singapore, Singapore, September 18-22, 2023, Jie Zhang, Li Chen, Shlomo Berkovsky, Min Zhang, Tommaso Di Noia, Justin Basilico, Luiz Pizzato, and Yang Song (Eds.). ACM, 528–539. https://doi.org/10.1145/3604915.3608797
- Zheng et al. (2022) Yu Zheng, Chen Gao, Jingtao Ding, Lingling Yi, Depeng Jin, Yong Li, and Meng Wang. 2022. DVR: Micro-Video Recommendation Optimizing Watch-Time-Gain under Duration Bias. In MM ’22: The 30th ACM International Conference on Multimedia, Lisboa, Portugal, October 10 - 14, 2022, João Magalhães, Alberto Del Bimbo, Shin’ichi Satoh, Nicu Sebe, Xavier Alameda-Pineda, Qin Jin, Vincent Oria, and Laura Toni (Eds.). ACM, 334–345. https://doi.org/10.1145/3503161.3548428
- Zhou et al. (2010) Renjie Zhou, Samamon Khemmarat, and Lixin Gao. 2010. The impact of YouTube recommendation system on video views. In Proceedings of the 10th ACM SIGCOMM Internet Measurement Conference, IMC 2010, Melbourne, Australia - November 1-3, 2010, Mark Allman (Ed.). ACM, 404–410. https://doi.org/10.1145/1879141.1879193
- Zhu et al. (2017) Han Zhu, Junqi Jin, Chang Tan, Fei Pan, Yifan Zeng, Han Li, and Kun Gai. 2017. Optimized Cost per Click in Taobao Display Advertising. In Proceedings of the 23rd ACM SIGKDD International Conference on Knowledge Discovery and Data Mining, Halifax, NS, Canada, August 13 - 17, 2017. ACM, 2191–2200. https://doi.org/10.1145/3097983.3098134