Fairly Accurate: Optimizing Accuracy Parity in Fair Target-Group Detection
Abstract
In algorithmic toxicity detection pipelines, it is important to identify which demographic group(s) are the subject of a post, a task commonly known as target (group) detection. While accurate detection is clearly important, we further advocate a fairness objective: to provide equal protection to all groups who may be targeted. To this end, we adopt Accuracy Parity (AP) — balanced detection accuracy across groups — as our fairness objective. However, in order to align model training with our AP fairness objective, we require an equivalent loss function. Moreover, for gradient-based models such as neural networks, this loss function needs to be differentiable. Because no such loss function exists today for AP, we propose Group Accuracy Parity (GAP): the first differentiable loss function having a one-on-one mapping to AP. We empirically show that GAP addresses disparate impact on groups for target detection. Furthermore, because a single post often targets multiple groups in practice, we also provide a mathematical extension of GAP to larger multi-group settings, something typically requiring heuristics in prior work. Our findings show that by optimizing AP, GAP better mitigates bias in comparison with other commonly employed loss functions.
1 Introduction
Toxic Language in social media is often associated with various risks and harms: cyber-bullying, discrimination, mental health problems, and even hate crimes. Given the massive volume of user generated content online, manual review of all posts by human moderators simply does not scale. Consequently, Natural Language Processing (NLP) methods have been developed to fully or partially automate toxic language detection [53]. However, studies have also found that model accuracy can vary greatly across demographic attributes, such as race or gender [45, 52, 10] when optimizing an overall measure without considering the demographic groups present in the data.
In addition to detecting toxic language itself, an important related task is target (group) detection: identifying which demographic group(s) are the subject of a given post. In general, the ability to detect which demographic group(s) are the subject of a post has broad value (e.g., supporting search for demographic-related posts). In the context of toxic language detection, identifying which group(s) are being discussed or targeted is important in striving to provide equal protection to all groups. In addition, because the language of toxicity can vary by targeted group (e.g., racial slurs), annotating training data for targeted groups can enable more accurate and fairer detection of toxicity [23].
To date, research on target detection has traditionally assumed that each post discusses only one group [6, 52, 61]. However, recent work [33, 21] has relaxed this assumption with the realization that even a single post can target multiple groups simultaneously, emphasizing the practical need for target detection methods to support this real-world setting.
Algorithmic fairness tasks that have received most attention in the past years are typically associated with allocating goods or burdens (e.g. college admission is a good, and denying bail is a burden). In such settings, it is easy to identify a “positive" and a “negative" class, and errors typically have asymmetric costs. For example, errors in being mistakenly granted admission (false positive) vs. being mistakenly denied (false negative) are not equal. However, target detection presents a multi-label prediction task where labels correspond to demographic groups (e.g., Latinx, Black, and Native American). As such, there is no notion of “positive" and “negative" label, and the motivation of providing equal protection to all groups results in considering errors as symmetric. If a toxic post truly targets group-Latinx but is mistakenly detected as targeting group-Black, this would be equally undesirable as a toxic post targeting group-Black but mistakenly detected as targeting group-Latinx. Thus, a fair target detection model involves equalizing accuracy across all groups, i.e. Accuracy Parity (AP) [62].
A particular challenge while optimizing for a fairness (or any standard) evaluation measure is the need for an equivalent loss function during model training, to align model training with one’s fairness objective. Without such alignment, we run the risk potential divergence from our true objective, a phenomenon known as Metric Divergence [41, 39, 55]. For gradient-based models such as neural networks, the loss function needs to be differentiable.
Conceptually, AP is often mentioned as a fairness metric of potential interest [40, 25, 4]. However, perhaps because it is rarely of empirical interest in allocation tasks, there has been scant research in optimization methods to actually operationalize it. In particular, we know of no differentiable loss function (optimizer) for AP. Additionally, prior works [13, 25, 4, 10] have strictly considered AP as an evaluation measure only, and under a 2-group (binary) setting, with heuristic extensions for more than 2 groups.
In this work, we propose a novel loss function, Group Accuracy Parity (GAP), providing a direct, one-on-one mapping to the AP evaluation measure. While our motivating task is target (group) detection, our GAP loss function is model, task, and dataset agnostic, being generally aligned with AP as a fairness objective to prevent disparate impact across groups. Because GAP is differentiable, it can be directly used to optimize descent-based models. Moreover, because a single post can actually target multiple groups, we provide a mathematical, non-heuristic extension of GAP to generalize to larger multi-group settings beyond binary. We provide both a theoretical derivation (from basic cross-entropy) and an empirical support for GAP. Empirical results show a clear benefit of optimizing GAP for the target measure AP, rather than using alternative loss functions, such as cross entropy or other differentiable fairness losses [54, 61].
Our key contributions include:
-
•
A novel, differentiable loss (GAP) that optimizes AP measure, i.e. balanced accuracy across groups.
-
•
A theoretical derivation of GAP with correctness checks and extension to real-world, multi-group scenarios.
-
•
Experiments with GAP in fair target-group detection, showing that it mitigates disparate impact across groups.
-
•
A comparison over fairness losses, demonstrating that GAP achieves the best AP value compared to others.
-
•
For reproducibility and adoption, we our source code will be available soon.111Source code at https://github.com/smjtgupta/GAP..
2 Related Work
Toxicity Detection and Fairness.
Detection of toxic language in its various forms [16] has attracted signficant attention due to its prevalence in online social media platforms. To date, many datasets have been created to support model training and evaluation [47, 57, 59, 58, 12, 17, 31, 48]. While NLP/ML methods tend to optimize for overall performance, recent studies highlight the racial bias induced in such classification tasks, when group identifiers are not considered during model training [52, 11, 61]. Here, fairness concerns with respect to multiple stakeholders arise, including the author of the post [52] and the groups targeted by a post. We focus our attention on fairness with respect to demographic groups targeted in the content.
To address the problem of bias in toxic language detection, a variety of work has sought to improve the training and testing data [45, 52, 49, 33, 22, 50, 27], with the expectation that fairer data will lead to fairer models. Sap et al. [52] propose to resolve the problem by using race and dialect priming during annotation. Park et al. [45] propose a data-focused fairness approach for the closely related problem of gender bias. They create contrastive examples by using gender swap data augmentation. Röttger et al. [49] framed a set of functional tests and argued that automated toxicity detection models should be evaluated on all functionalities. Like Sap et al. [52], the other works above also consider annotator identity and task design in mitigating label bias.
Fairness Measures.
Measures based on confusion matrices (e.g. accuracy, precision, recall, and F1) help measuring performance of machine learning systems. However, several studies unveil ML systems can be discriminatory based on different sensitive attributes (race, gender etc.). The amplification of systemic unfairness through AI applications has been pronounced across different critical application areas such as hiring, finance, legal applications, and content moderation [2]. To address this, several methods have been introduced to quantitatively measure and mitigate unfairness in machine learning systems borrowing from legal literature on anti-discrimination [14].
Friedler et al. [18] show that these different worldviews can lead to conflicting statistical targets, which makes it impossible to simultaneously achieve conflicting fairness targets. Because fairness measures can be at odds with each other based on the underlying assumptions and statistical choices [42], selecting an appropriate fairness metrics often depends on the task, use case, and stakeholder priorities [19, 3, 28].
Differentiable Fairness Losses.
Typically, toxicity detection systems are trained with a single objective of minimizing cross-entropy [17, 45, 49], which is differentiable. For imposing a fairness constraint in the optimization problem, a standard approach is to add a differentiable regularization term with a hyper-parameter , as shown in Eq. 1. While decreasing cross-entropy leads to decreasing Overall Error (OE), effectively increasing Overall Accuracy (OA), we typically need a fairness loss function whose decrease leads to increase in a corresponding fairness evaluation measure.
| (1) |
While many fairness evaluation measures exists, our survey of existing fairness-related loss functions, that strictly optimizes for an equivalent measure during model training, finds only few variants. For e.g. the CLA [54] loss has one-on-one correspondence for optimizing False Negative Rates across groups. Other adversarial losses like ADV [61] tries to optimize for False Positive Rates, but suffers from metric divergence. Ranking literature suffers from lack of equivalent optimizers owing to the discontinuous nature of rank order, hence they focus on designing surrogates with close asymptotic bounds [44, 55].
Same Usage, Very Many Monikers.
In this work we focus on optimizing for Accuracy Parity (AP) [62], which refers to equal performance of a model across different demographic groups, ensuring that accuracy remains consistent irrespective of group membership. This is a popular fairness measure and has been proposed in literature, yet with very many different names. The ones we found include Accuracy Equity [13], Equality of Accuracy [25], Accuracy Parity [62], Equal Accuracy [40], Overall Accuracy Equality [4] and Accuracy Difference [10]. However, note that all these work have used AP as an evaluation measure in their classification protocol to evaluate degrees of un-fairness.
3 Group Accuracy Parity (GAP)
In this work, we focus on balancing accuracy across groups, known as Accuracy Parity (AP) [62], motivated by its relevance to the problem of fair target-group detection. We provide the first differentiable loss function for AP and its extension to accommodate multiple (beyond binary) groups. If a fairness task demands symmetric error costs, it can be directly optimized via our Group Accuracy Parity (GAP) loss without metric divergence [41] w.r.t. the AP evaluation measure.
3.1 Accuracy Difference
While AP is an equality condition, we still need to quantify the deviation from equality in cases of unequal performance across groups. We therefore use Accuracy difference (AD) Das et al. [10], a continuous version of AP to measure this deviation. AD is shown in (Eq. 2), where are the predicted label, true label, and group attribute respectively. Thus AD is defined based on the confusion matrix. Since the formulation is probabilistic in nature, i.e. ratio of numbers over the dataset, and not distribution over variable, AD becomes non-differentiable. That is, AD can only be used in a post-hoc manner and cannot be directly used for gradient-based back propagation. Furthermore, Eq. 2 inherently assumes that the majority group accuracy will always be higher than the vulnerable group , which might not always hold true, resulting in potential negative values of AD in the range [-1,1]. Naturally, as a post-hoc measure, AD is disconnected from the optimization objective of the model used during training.
| (2) |
These limitations motivated us to define a differentiable loss function for AD, which we refer as Group Accuracy Parity (GAP), allowing any descent-based model during training to optimize for equal accuracy across group-attribute, and addresses the range issue of AD.
3.2 GAP Formulation, Usage and Properties
Cross-Entropy (CE) loss is commonly used as a loss function in classification tasks and is designed to measure the difference between probability distribution () predicted by the model and the true distribution () of the data. CE is a general differentiable loss that can be used to optimize over the entire data or independently across groups (). Although not a strict one-to-one correspondence, it is generally observed that minimizing CE leads to minimizing Overall Error (OE), thereby maximizing Overall Accuracy (OA), due to CE providing non-asymptotic guarantees and placing an upper boundary on the estimation error of the actual loss [36].
| (3) |
For balanced classification across groups, e.g. demographic information of post subject, we formulate our GAP loss function as follows: we first calculate the CE across each group, then minimize the difference across them and finally frame it as a Single Objective Optimization problem corresponding to Eq. 1. The GAP loss function in Eq. 4 is equal to overall cross entropy loss () in Eq. 3 only when both CE errors are equal across the groups.
| (4) |
Remark.
GAP optimizes for AP, to reduce the accuracy gap across groups, therefore minimizing this type of disparate impact across groups. Additionally, GAP formulation is flexible with different weighted variants of accuracy w.r.t. chosen entropy, depending on the evaluation need.
The formulation of the GAP loss in Eq. 4 is generalizable to different weighted variants of accuracy. For e.g. Binary Cross Entropy (BCE) in Eq. 5 is used as a loss function for optimizing a binary classifier i.e. labels of s and s. BCE, however, does not take into account the label imbalance.
| (5) |
Weighted Binary Cross Entropy (wBCE) re-weights the error for the class labels proportional to their inverse frequency in the data. The class re-weighting strategy in Eq. 6 is available in packages like SkLearn [46] and discussed in detail by Lin et al. [34]. Since most real-world datasets often have label imbalance, wBCE aims to penalize both labels (1s and 0s) equally. Thus, minimizing wBCE leads to maximizing balanced accuracy (BA), a better measure than accuracy, in presence of label imbalance.
| (6) |
Remark.
In this implementation we choose the weighted Binary Cross Entropy () variant in the GAP terms to account for binary label imbalance within each group. Consequently, we use Balanced Accuracy (BA) to evaluate performance of each group, to maintain functional mapping.
The GAP function has the following properties:
-
1.
GAP maps to AD. GAP has a one-to-one correspondence to AD i.e. minimizing GAP also minimizes AD.
-
2.
GAP is differentiable. GAP is defined as the summation of overall error and the squared 2-norm difference between the wBCE across the groups. Since wBCE is differentiable, so is the 2-norm difference. Hence GAP can be optimized for any descent based model.
-
3.
GAP is smooth. GAP has a 2-norm formulation, thus the range of attainable evaluation values are within , avoiding the negativity issue in AD. Being a squared 2-norm measure, the surface of GAP is smoother than other comparable measures like CLA [54], which uses 1-norm. A smoother surface leads to better descent rates and has a better chance of avoiding shallow optima [7].
3.3 Extension of GAP beyond Binary Groups
It is sometimes the case that a post may target multiple groups, thus we need a measure that accommodates a multi-group setting. As noted in Das et al. [10], the binary AD concept can be extended for multi-class and multi-group tasks. However, it is left as an heuristic exercise for the reader. To make our GAP formulation non-heuristic, we provide a mathematical extension (see Appendix for proof) of it to accommodate multiple (beyond binary) groups of cardinality , while keeping the formulation similar to interpret.
| (7) |
The multi-group extension of GAP in Eq. 7 has terms in the regularization factor, corresponding to all combinations of distinct group pairs within the dataset of group cardinality , while being smooth in nature due to the squared 2-norm. This formulation allows us to account for practical scenarios where a post can potentially target multiple group(s) simultaneously.
3.4 Code Flow
Alg. 1 presents the logic of the loss in Eq. 6, where the weights represent inversely scaled values of labels (0s and 1s), within each group . Thus equivalently maps to Balanced Accuracy (BA), an evaluation measure widely used in datasets with label imbalance. Absence of this weighting term would strictly map to standard accuracy, following the mapping from . The overall error is then defined as summation of errors across groups. Note that we do not weight groups while adding their errors since: a) we want to treat all groups equally; and b) TensorFlow’s function is scale independent, i.e. it produces same error value for equal ratios of mispredictions w.r.t. total samples, irrespective of sample size. For e.g. value over 5 samples with 1 misprediction is equal to value over 15 samples with 3 misprediction.
Loss function for optimizing Overall Error
Alg. 2 presents the logic of our proposed GAP loss. After computing overall error via Alg. 1, GAP computes the group-pairwise errors. The errors are squared to enforce positive values and allow for a smooth loss surface. The final SOO error as per Eq. 1 is the summation of the overall error and a regularized sum of group-pair errors.
Loss function for optimizing Group Balanced Error
4 Experimental Details
We describe the dataset used for validation, the problem formulation, the neural architecture, the baseline loss, and two other fairness losses used for comparing performance of our proposed GAP loss. Implementation details regarding setup, data pre-processing, and related items are included in Appendix B.
4.1 Dataset
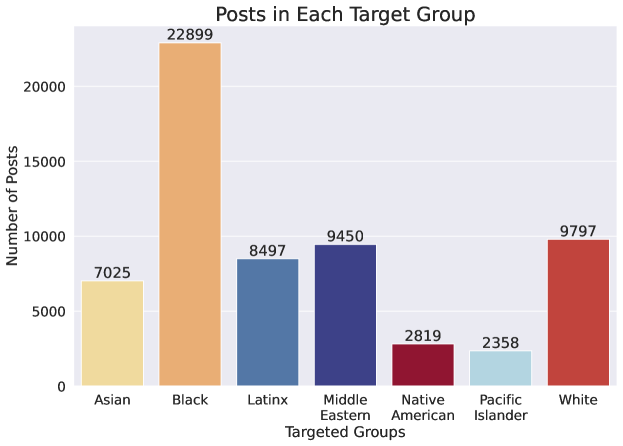
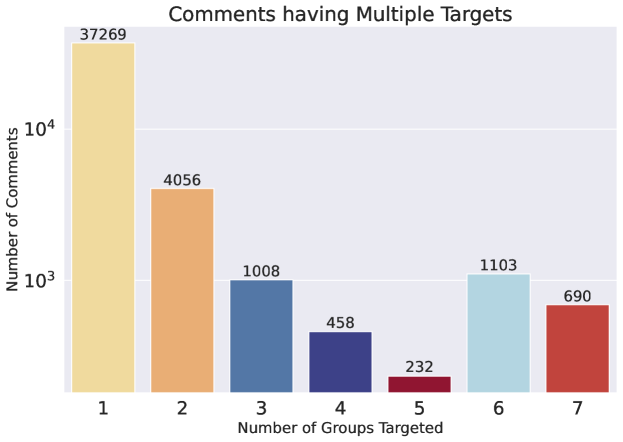
To assess fair target-group detection we use the HuggingFace DLab dataset [15] originally open-sourced in [29] as the MHS corpus. The dataset has posts, where each post has an explicit annotation for the target group(s) i.e. demographics of the target entity (target_race). We select posts having the target-demographics flag as True, where a post targets one or more groups, irrespective of the toxicity label of the post. We have boolean scores on annotator consensus for seven demographic groups: Asian, Black, Latinx, Middle-Eastern, Native-American, Pacific-Islander and White. Fig. 1 shows the split of the targeted groups by posts. Fig. 2 shows the split of posts by the number of groups targeted222For groups of cardinality six and seven, the posts are targeted towards most groups, hence the increase in number.. We do a 80%-20% split for training and testing data respectively.
4.2 Problem Setup
In our fair target-group detection problem, we are given a dataset , with samples (posts) and features. These dimensional features can be extracted for each post using any off-the-shelf NLP model. Let denote the label space, where represents the set of all possible combinations of binary labels, indicating whether each of the groups is targeted () or not () by the post . The objective is to learn a function that maps each post to its corresponding label vector . This leads to a multi-label classification problem setting [38, 26].
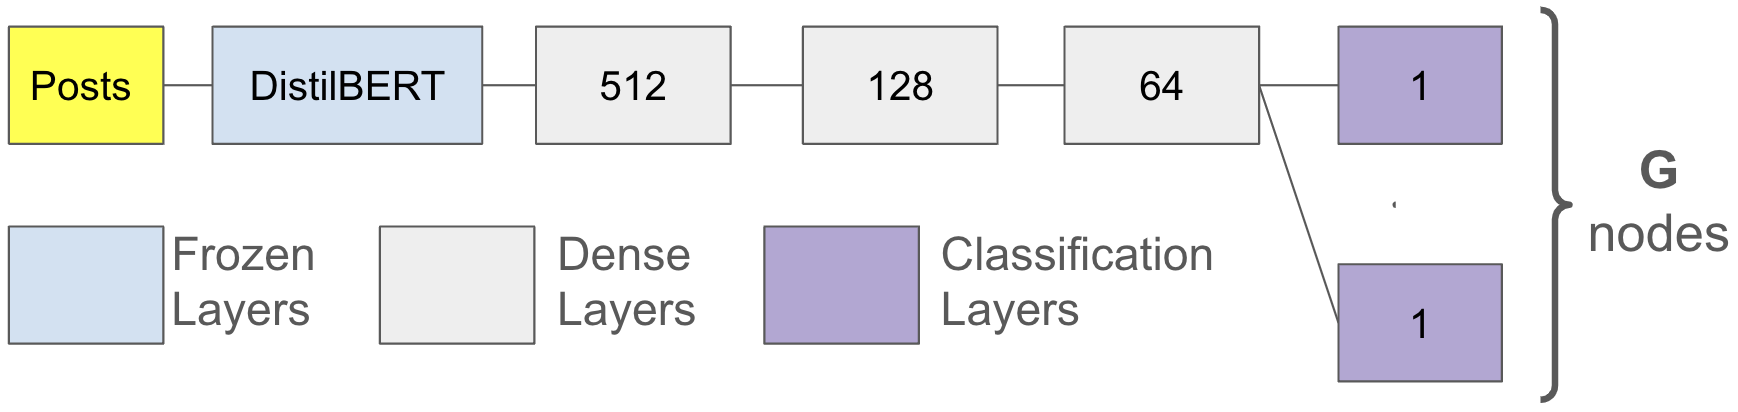
4.3 Neural Model and Baseline Measure
We use the DistilBERT [51] representation layer to extract numerical features from posts. This is followed by layers of dense neurons with relu activation and biases, ending in classification nodes with sigmoid activation with 0.5 classification threshold. For experiments, we freeze the weights of the DistilBERT layer. The only trainable parameters in the models are the dense neuron units that follow the DistilBERT layer until the output nodes. Given the multi-label binary classification setup of our problem, we use weighted Binary Cross Entropy (wBCE) as our baseline loss to optimize Overall Error (OE) for the output nodes. One can replace the DistilBERT layer with any other feature representation without altering the rest of the model.
| Balanced Accuracy (BA) () | ||||||||||
|---|---|---|---|---|---|---|---|---|---|---|
| Loss | Asian | Black | Latinx | Middle Eastern | Native American | Pacific Islander | White | Max. Diff. () | Avg. BA () | #Best BA () |
| OE | 80.31 | 86.91 | 81.07 | 84.87 | 64.99 | 67.91 | 75.01 | 21.91.3 | 77.290.29 | 2/7 |
| CLA | 82.51 | 85.34 | 81.67 | 84.62 | 73.91 | 74.92 | 80.44 | 11.40.8 | 80.490.14 | 0/7 |
| GAP | 83.18 | 83.86 | 83.47 | 83.42 | 78.95 | 78.32 | 82.58 | 5.50.5 | 81.970.13 | 5/7 |
4.4 Other Differentiable Fairness Measures
Since no differentiable variant of AP exists, we additionally do comparisons using two differentiable fairness losses, CLA and ADV. Both losses optimize for certain asymmetric error rates across groups highlighting the deviation from symmetry when using AP for evaluation.
The first fairness loss CLAss-wise equal opportunity (CLA) [54] seeks to balance False Negative Rate (FNR) across protected groups [9], also known as equality of opportunity [24]. CLA minimizes the error in absolute differences between error w.r.t. a label and error w.r.t. a label given the group attribute .
| (8) |
5 Results
All reported results in the main material are for the 7-group setting. For group performance on all possible isolated pairs, please refer to Appendix C. ADV did not run for 7-group setting, its isolated pair values are in Appendix.
5.1 Evaluation Measures Considered
Balanced Accuracy (BA)
Unlike standard accuracy, which can be misleading in the presence of label imbalance, BA provides a more reliable model assessment when dealing with imbalanced datasets. It computes the average accuracy of each label, thereby offering a balanced perspective to account for the unequal label distribution. By considering both the sensitivity (TPR: true positive rate) and specificity (TNR: true negative rate) of each label, BA effectively captures the model’s ability to correctly classify instances across all labels, regardless of their prevalence.
| (10) |
Average Balanced Accuracy (Avg. BA).
When optimizing accuracy across groups, we report the average over the group-specific BAs (known as macro-averaging) as a summary statistics. The Avg. BA (macro) treats each group equally, ensuring that the classifier’s performance is evaluated in a balanced manner across all demographic groups.
| (11) |
Hamming Loss (HL)
It is a widely employed metric for assessing the performance of multi-label classifiers. Formally, for a dataset with instances and labels, the Hamming Loss (HL) quantifies the fraction of incorrectly predicted labels across all instances in the dataset, with as an indicator function of 1, if the -th label for instance is incorrectly predicted, 0 otherwise. Specifically, it measures the average fraction of labels that are misclassified in comparison to the true label set. HL and Subset Accuracy Loss are comparable under small label cases [60], hence we just report HL.
| (12) |
Other measures of interest
Although we are strictly optimizing for similar BA across groups, it is imperative to state that the gain in fairness does not come at a strict trade-off to other measures of interest like Precision, Recall, F1. Given our multi-label setup, we report the macro variants (average over group-specific numbers) of the mentioned measures.
| (13) | ||||
| (14) | ||||
| (15) |
5.2 Evaluation & Loss Performance
The values presented in Table 1 illustrate the achieved BA values across various groups during a single run for the test set, for the two baseline losses (OE and CLA) vs. our GAP. Notably, the Black group, constituting the statistical majority in the dataset as outlined in Kennedy et al. [29], demonstrates the maximum BA values for the three losses.
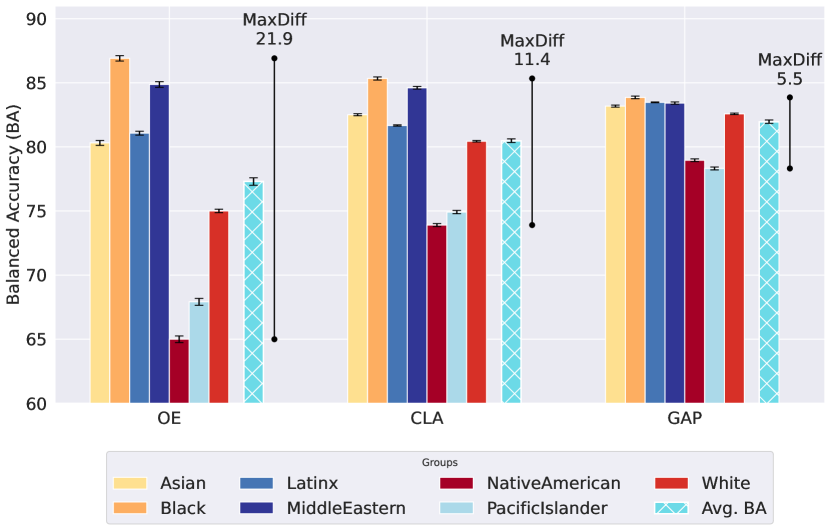
We show the maximum difference (Max. Diff.) between the groups in Table 1, to highlight the performance gap when the optimization method does not align with the intended evaluation. Specifically, optimizing for overall error (OE) fails to account for variations in group performance, resulting in the highest difference values (Max. Diff. of 21.9). In contrast, both the GAP and CLA approaches incorporate considerations of group performance alongside overall error, leading to substantially lower Max. Diff. compared to OE. Notably, given that GAP optimizes for balanced error rates across groups, it exhibits the smallest difference (Max. Diff. of 5.5), indicating least disparities across groups.
We report the average BA (macro) score obtained in all three losses in Table 1, with GAP having the highest value (Avg. BA = 81.97). We hypothesize that by incorporating the additional group information in the loss while model training, both the group-informed losses (CLA and GAP) are able to find better local optima compared to OE. The Best BA is a group performance measure indicating how many amongst the 7 groups are performing best across the three losses. For this measure, we observe OE to have the highest group BA values for 2 groups (Black, Middle Eastern), while GAP performs best for rest of the five groups. This also emphasizes the fact that GAP does not prioritize the performance of one group over others in its optimization criteria, thereby being the best performing loss across the groups.
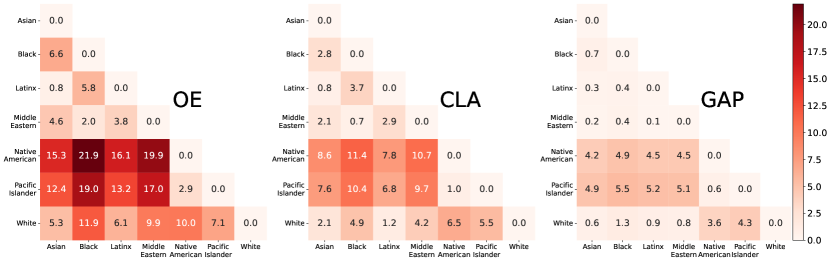
To further highlight performance disparities between demographic groups in our target-group detection setting, we present Fig. 4. This figure displays the pairwise absolute differences in evaluated Balanced Accuracy (BA) across various demographic groups (). Notably, as each group is inherently equivalent to itself, all diagonal entries are naturally . Higher values in the heatmap indicate the classifier’s bias towards one group compared to another. Through the color gradient in the heatmap, we observe consistent patterns of unequal group performance, particularly evident in the optimization for overall error rates (OE). This illustrates that solely optimizing for overall performance may result in disproportionate and inequitable performances across the internal groups within the dataset.
Apart from the (Black, Native American) pair which has a Max. Diff. of 21.9, we see other group pairs as well with a wide range of performance disparity, when group indicators aren’t considered in OE. Two key observations can be drawn from the figure: a) The Black group being the statistical majority has a dominant performance gap over the Native American group being one of the statistical minorities. b) Even for group pairs with similar statistical population, for e.g. the (Middle Eastern, White) pair, there can be performance disparities (BA gap of 9.9) because one group might be simply easier to classify than the other. CLA, which optimizes for FNR, has improved performance over OE, however, since it’s optimization criteria (minimizing false negatives)does not align with out intended evaluation (having similar performance across groups) its heatmap lies in-between that of OE and GAP.
In contrast, our GAP loss, which is explicitly designed to achieve similar (balanced) performance across groups while optimizing overall performance, shows substantially fewer extremes in group performance gaps. The heatmap reveals smoother transitions between groups, indicating a more equitable distribution of the performance of the classifier. Moreover, the extreme values of Maximum Difference (Max. Diff.) presented in Table 1 are reflected as outliers in these heatmaps, corresponding to specific group pairs.
| OE | CLA | GAP | |
| Hamming Loss (HL) % () | 7.65 | 12.10 | 6.85 |
We present the HL (Eq. 12) values in Table 2 as a summary statistic in out multi-label classification setup. The HL metric quantifies the average fraction of misclassified labels, with lower HL values indicating enhanced classifier performance. While the CLA loss prioritizes minimizing FNR, which inherently involves asymmetry, there may be instances where it disproportionately optimizes for this aspect at the expense of other performance metrics. Consequently, CLA may exhibit poorer HL performance compared to OE loss. In contrast, the GAP loss maintains symmetry, resulting in a balanced trade-off while jointly minimizing TPR and TNR. As a result, GAP consistently achieves the lowest HL values, indicative of superior classifier performance.
| Loss | () | () | () |
|---|---|---|---|
| OE | 0.7083 | 0.5808 | 0.6383 |
| CLA | 0.5418 | 0.7143 | 0.6162 |
| GAP | 0.7854 | 0.6837 | 0.7310 |
Table 3 presents summary statistics of evaluation measures like Precision, Recall and F1, in our multi-label classification setup at the macro level. The CLA approach, characterized by its emphasis on minimizing the False Negative Rate (FNR), inherently yields the highest Recall, however, this optimization strategy comes at the expense of Precision and F1, both being lower than OE. Our GAP loss, designed to jointly minimize True Positive Rate (TPR) and True Negative Rate (TNR), emerges as the optimal performer in terms of both Precision and F1 score across the evaluated losses.
5.3 Runtime Performance
The numbers shown in Table 4 are over the training dataset of 36k posts, where we report the average time per epoch, number of epochs till convergence, total runtime, and the extra time () for losses compared to OE.
|
|
|
|
|||||||||
| OE | 154 | 21 | 3234 | 0 | ||||||||
| CLA | 158 | 41 | 6478 | 3244 | ||||||||
| GAP | 163 | 27 | 4401 | 1167 |
Since OE in Alg. 1 is weighted Binary Cross Entropy (wBCE), it takes the least amount of time per epoch and also number of epoch to converge. GAP in Alg. 2 takes all the steps of Alg. 1 for computing the overall loss in addition to calculating losses and finally the balanced loss. Thereby GAP takes additional compute time for solving its intended optimization. The same argument holds true for CLA and ADV as well, since all of them are variants of the Single Objective Optimization format in Eq. 1.
Although GAP does the extra computation, hence the extra runtime (), it is not that significant (extra 9s per epoch) compared to OE, while gaining much more in terms of optimization improvement. While OE and GAP operate on smooth losses (Eq. 6, 4) their convergence epoch is relatively fast (21, 27). CLA uses a 1-norm loss (Eq. 8), hence the empirical loss surface is not as smooth as the previous two. As such, it is observable that CLA on average takes more epochs (41) to converge with a higher .
6 Analysis and Discussions
Differentiable Measures.
While important fairness measures have been proposed in the literature, catering to evaluate different scenarios, many lack an equivalent differentiable loss, making these measures difficult to optimize. Model training with approximate loss functions might lead to potential metric divergence [41, 39] between optimization criteria used in training vs. evaluation measure of interest. “No matter what measure is chosen for optimization, an inexact metric necessarily leads to a divergence between the goal and the metric in the tail.” [35]. Continuing formulation of equivalent differentiable loss functions w.r.t. other important fairness measures could yield better performance for them.
Goodhart’s Law and Over-optimization.
Goodhart’s Law states that “When a measure becomes a target, it ceases to be a good measure” [20]. Thomas and Uminsky [56] detail problems arising overly-narrow focus on metrics in the broader field of AI. Fairness measures are not an exception to this challenge. Over-optimizing for any one metric in isolation risks degrading performance on others. For example, Table 3 shows that CLA’s optimization for FNR leads to large drops in Precision and F1, where it underperforms w.r.t. to both OE and GAP.
As Friedler et al. [18] and others have noted, different worldviews lead to conflicting definitions of fairness that are mutually incompatible. Since one cannot have it all, specific fairness measures must be selected (suitable to the given task, context, and stakeholders at hand). In this work, given the nature of the symmetric errors, we optimize a model to provide balanced Accuracy Parity (AP) across demographic groups [62] via our GAP loss function.
Balanced Measure vs. Overall Performance.
As its name reflects, OE optimizes for cross-entropy (wBCE); it does not consider group (sub-population) performance. Overall accuracy will be driven by several factors. First, under-represented groups may suffer at the cost of benefiting the over-represented groups (i.e. group prevalance). Second, even when groups are balanced, some groups may be intrinsically more difficult to model for a given task, and thus sacrificed in optimization to benefit other groups. Since we train directly on the data (no over-/under- sampling), using the training objective to achieve AP across groups, we are able to accommodate both of the the cases above. Readers are referred to 2-group setting: For e.g. Asian vs. Black and White vs. Latinx group-pairs in Appendix C as an illustration of both cases.
Improved Overall Performance with Balancing.
For the 7-group setting in Table 1, we notice that by optimizing for group-related errors alongside overall error (OE), both GAP and CLA driven classifiers achieve better overall performance (in terms of Avg. BA), as well as achieving their intended group-specific objective. This observation goes a bit beyond traditional ML where the nature of Single Objective Optimization (Eq. 1) forces one objective to be better at the expense of the other objective, in absence of any alternate dominated solution sets [37]. Given that our problem setup is Multi-Label classification (and correspondingly the architectural setup is a series of one-vs rest classifier nodes), we hypothesize that the group indicator gives an extra feature dimension for the classifier to consider, boosting it to learn something more about the data than it would have without the group label. By considering the group-associated terms, both loss functions have a modified surface compared to OE, allowing convergence to a better optima. We see this pattern emerging in some of the 2-group setting: For e.g. the Latinx vs. Middle Eastern group-pair in Appendix C.
Model Multiplicity [5] highlights the ability of a task to have variability in the predictions generated by different models, although they perform with equal accuracy. Such effects arise due to factors like data imbalance, inherent biases etc. A simple case in our target-group detection setting could have three classifiers — trained with three losses (OE, CLA and our GAP) — performing equally well in terms of overall accuracy, yet differing widely in group-accuracy performance. In such a scenario, AP provides valuable insight as a fairness measure by highlighting the amount of disparate impact across groups, with GAP having the least pairwise performance gap across groups, amongst the three losses.
Task Agnostic Measure.
While in this work we explicitly focus around fair target-group detection, our proposed measure GAP is model, task, and dataset agnostic i.e. it is designed to push for equal accuracy numbers across groups with arbitrarily defined groups. Thus, balancing between accuracy vs. fairness is not exclusive to the task of Toxic Language Detection, and can be extended to other problems, datasets, and models. It can also be used to for classifiers involving groups, sets or categories.
Exploring Fairness tasks with Symmetric Errors.
By recognizing and incorporating symmetric error (i.e. type I and type II errors are equally harmful) considerations into fairness tasks, we not only enhance the fairness of our target-group detection model but also open avenues to explore real-life scenarios addressing similar scenarios, challenges and needs in other domains. By acknowledging and addressing the symmetric nature of errors across different groups, we can achieve a balanced perspective on fairness and more equitable outcomes in algorithmic decision-making processes.
Author Demographics vs. Target Demographics.
While author demographics [6] focuses on identifying group tags about the post’s author, identifying Target Demographics involves determining group tags of post when its directed towards specific groups or communities [31, 15]. In scenarios involving sensitive topics or potentially toxic language, such group identification becomes crucial. For e.g. a post containing racially charged language maybe indicative of targeting a particular demographic group as a slur. However, the interpretation of such language may vary depending on the context of the interaction. If both the author and the target belong to the same demographic groups, the use of such language may be considered as a friendly banter or colloquial communication within that group only. Conversely, if the author does not belong to the targeted group, the same language may be considered more likely as toxic, reflecting potential discriminatory behavior. Thus, both author and target demographics need to be considered jointly in NLP modeling to combat toxic language.
Target group identification and Large Language Models.
The task of fair target group detection can also be relevant in the context of training and deploying Large Language Models (LLMs). Existing studies have found that LLMs contain bias with respect to protected characteristics such as gender and race [43, 32]. Explicitly incorporating target group detection during training and fine-tuning via reinforcement learning from human feedback (RLHF) is a promising direction for reducing LLM bias.
7 Conclusion
In this work we made contributions towards algorithmic fairness by designing a differentiable loss optimizer, with a specific focus on providing fair protections to all potentially targeted groups in social media posts. Our novel loss function Group Accuracy Parity (GAP) successfully achieves balanced detection accuracy across groups, thereby mitigating risks of disparate impact. GAP is differentiable and provides direct means of optimizing descent-based models while maintaining alignment with the Accuracy Parity (AP) evaluation measure, thus avoiding metric divergence. Furthermore, we propose an extension of GAP to accommodate multi-group settings, increasing the metric impact and coverage. Empirical validation of GAP confirms our theoretical claim that optimizing for GAP achieves the best AP scores, compared to other losses.
A variety of important directions remain for future work. In the context of toxic language detection pipelines, one could explore the impact of fair target-group detection on downstream tasks, such as conversational assistants, recommendation systems, emotion and sentiment detection systems. In addition, the task of target-group detection could be extended to include all participants in the discussion or social media thread. This would provide additional context to researchers and machine learning models and will allow for a more fine-grained implementation of fairness criteria.
As we noted at the outset, algorithmic fairness tasks that have received the most attention in the past years are typically associated with the allocation of goods or burdens (e.g. college admission is a good, and denying bail is a burden). However, for scenarios that do not have a concept of ’positive’ and ’negative’ labels (as considered here), the goal of providing equal protection to all groups leads to considering errors as symmetric. We believe GAP thus stands to benefit a variety of other domains with symmetric errors in which AP could now be optimized (for neural networks or other models of interest).
References
- [1]
- Angwin et al. [2016] Julia Angwin, Jeff Larson, Surya Mattu, and Lauren Kirchner. 2016. Machine bias. In Ethics of Data and Analytics. Auerbach Publications, 254–264.
- Bellamy et al. [2018] Rachel KE Bellamy, Kuntal Dey, Michael Hind, Samuel C Hoffman, Stephanie Houde, Kalapriya Kannan, Pranay Lohia, Jacquelyn Martino, Sameep Mehta, Aleksandra Mojsilovic, et al. 2018. AI Fairness 360: an extensible toolkit for detecting, understanding, and mitigating unwanted algorithmic bias. arXiv preprint. arXiv preprint arXiv:1810.01943 (2018).
- Berk et al. [2021] Richard Berk, Hoda Heidari, Shahin Jabbari, Michael Kearns, and Aaron Roth. 2021. Fairness in criminal justice risk assessments: The state of the art. Sociological Methods & Research 50, 1 (2021), 3–44.
- Black et al. [2022] Emily Black, Manish Raghavan, and Solon Barocas. 2022. Model multiplicity: Opportunities, concerns, and solutions. In Proceedings of the 2022 ACM Conference on Fairness, Accountability, and Transparency. 850–863.
- Blodgett et al. [2017] Su Lin Blodgett, Johnny Wei, and Brendan O’Connor. 2017. A dataset and classifier for recognizing social media english. In Proceedings of the 3rd Workshop on Noisy User-generated Text. 56–61.
- Boyd et al. [2004] Stephen Boyd, Stephen P Boyd, and Lieven Vandenberghe. 2004. Convex optimization. Cambridge university press.
- Chollet [2015] François Chollet. 2015. keras. https://github.com/fchollet/keras.
- Chouldechova [2017] Alexandra Chouldechova. 2017. Fair prediction with disparate impact: A study of bias in recidivism prediction instruments. Big Data 5, 2 (2017), 153–163.
- Das et al. [2021] Sanjiv Das, Michele Donini, Jason Gelman, Kevin Haas, Mila Hardt, Jared Katzman, Krishnaram Kenthapadi, Pedro Larroy, Pinar Yilmaz, and Muhammad Bilal Zafar. 2021. Fairness Measures for Machine Learning in Finance. The Journal of Financial Data Science 3, 4 (2021), 33–64.
- Davidson et al. [2019] Thomas Davidson, Debasmita Bhattacharya, and Ingmar Weber. 2019. Racial bias in hate speech and abusive language detection datasets. arXiv preprint arXiv:1905.12516 (2019).
- Davidson et al. [2017] Thomas Davidson, Dana Warmsley, Michael Macy, and Ingmar Weber. 2017. Automated hate speech detection and the problem of offensive language. In Proceedings of the International AAAI Conference on Web and Social Media.
- Dieterich et al. [2016] William Dieterich, Christina Mendoza, and Tim Brennan. 2016. COMPAS risk scales: Demonstrating accuracy equity and predictive parity. Northpointe Inc 7, 4 (2016).
- Ekstrand et al. [2022] Michael D Ekstrand, Anubrata Dass, Robin Burke, Fernando Diaz, et al. 2022. Fairness in Information Access Systems. Foundations and Trends® in Information Retrieval 16, 1-2 (2022), 1–177.
- Face [2022] Hugging Face. 2022. ucberkeley-dlab/measuring-hate-speech. https://huggingface.co/datasets/ucberkeley-dlab/measuring-hate-speech
- Fortuna et al. [2020] Paula Fortuna, Juan Soler, and Leo Wanner. 2020. Toxic, hateful, offensive or abusive? what are we really classifying? an empirical analysis of hate speech datasets. In Proceedings of the Twelfth Language Resources and Evaluation Conference. 6786–6794.
- Founta et al. [2018] Antigoni-Maria Founta, Constantinos Djouvas, Despoina Chatzakou, Ilias Leontiadis, Jeremy Blackburn, Gianluca Stringhini, Athena Vakali, Michael Sirivianos, and Nicolas Kourtellis. 2018. Large scale crowdsourcing and characterization of Twitter abusive behavior. https://open.bu.edu/handle/2144/40119
- Friedler et al. [2021] Sorelle A Friedler, Carlos Scheidegger, and Suresh Venkatasubramanian. 2021. The (im) possibility of fairness: Different value systems require different mechanisms for fair decision making. Commun. ACM 64, 4 (2021), 136–143.
- Friedler et al. [2019] Sorelle A Friedler, Carlos Scheidegger, Suresh Venkatasubramanian, Sonam Choudhary, Evan P Hamilton, and Derek Roth. 2019. A comparative study of fairness-enhancing interventions in machine learning. In Proceedings of the conference on fairness, accountability, and transparency. 329–338.
- Goodhart [1984] Charles AE Goodhart. 1984. Problems of monetary management: the UK experience. Springer.
- Gordon et al. [2022] Mitchell L Gordon, Michelle S Lam, Joon Sung Park, Kayur Patel, Jeff Hancock, Tatsunori Hashimoto, and Michael S Bernstein. 2022. Jury learning: Integrating dissenting voices into machine learning models. In Proceedings of the 2022 CHI Conference on Human Factors in Computing Systems. 1–19.
- Goyal et al. [2022] Nitesh Goyal, Ian D Kivlichan, Rachel Rosen, and Lucy Vasserman. 2022. Is your toxicity my toxicity? exploring the impact of rater identity on toxicity annotation. Proceedings of the ACM on Human-Computer Interaction 6, CSCW2 (2022), 1–28.
- Gupta et al. [2023] Soumyajit Gupta, Sooyong Lee, Maria De-Arteaga, and Matthew Lease. 2023. Same Same, But Different: Conditional Multi-Task Learning for Demographic-Specific Toxicity Detection. In Proceedings of the ACM Web Conference 2023. 3689–3700.
- Hardt et al. [2016] Moritz Hardt, Eric Price, and Nati Srebro. 2016. Equality of opportunity in supervised learning. Advances in neural information processing systems 29 (2016).
- Heidari et al. [2019] Hoda Heidari, Michele Loi, Krishna P Gummadi, and Andreas Krause. 2019. A moral framework for understanding fair ml through economic models of equality of opportunity. In Proceedings of the conference on fairness, accountability, and transparency. 181–190.
- Herrera et al. [2016] Francisco Herrera, Francisco Charte, Antonio J Rivera, María J Del Jesus, Francisco Herrera, Francisco Charte, Antonio J Rivera, and María J del Jesus. 2016. Multilabel classification. Springer.
- Hettiachchi et al. [2023] Danula Hettiachchi, Indigo Holcombe-James, Stephanie Livingstone, Anjalee de Silva, Matthew Lease, Flora D. Salim, and Mark Sanderson. 2023. How Crowd Worker Factors Influence Subjective Annotations: A Study of Tagging Misogynistic Hate Speech in Tweets. In Proceedings of the 11th AAAI Conference on Human Computation and Crowdsourcing (HCOMP). 38–50.
- Hu and Chen [2018] Lily Hu and Yiling Chen. 2018. Welfare and distributional impacts of fair classification. arXiv preprint arXiv:1807.01134 (2018).
- Kennedy et al. [2020] Chris J Kennedy, Geoff Bacon, Alexander Sahn, and Claudia von Vacano. 2020. Constructing interval variables via faceted Rasch measurement and multitask deep learning: a hate speech application. arXiv preprint arXiv:2009.10277 (2020).
- Kingma and Ba [2014] Diederik P Kingma and Jimmy Ba. 2014. Adam: A method for stochastic optimization. arXiv preprint arXiv:1412.6980 (2014).
- Koh et al. [2021] Pang Wei Koh, Shiori Sagawa, Henrik Marklund, Sang Michael Xie, Marvin Zhang, Akshay Balsubramani, Weihua Hu, Michihiro Yasunaga, Richard Lanas Phillips, Irena Gao, et al. 2021. Wilds: A benchmark of in-the-wild distribution shifts. In International Conference on Machine Learning. PMLR, 5637–5664.
- Kotek et al. [2023] Hadas Kotek, Rikker Dockum, and David Sun. 2023. Gender bias and stereotypes in Large Language Models. In Proceedings of The ACM Collective Intelligence Conference (<conf-loc>, <city>Delft</city>, <country>Netherlands</country>, </conf-loc>) (CI ’23). Association for Computing Machinery, New York, NY, USA, 12–24. https://doi.org/10.1145/3582269.3615599
- Kumar et al. [2021] Deepak Kumar, Patrick Gage Kelley, Sunny Consolvo, Joshua Mason, Elie Bursztein, Zakir Durumeric, Kurt Thomas, and Michael Bailey. 2021. Designing toxic content classification for a diversity of perspectives. In Seventeenth Symposium on Usable Privacy and Security (SOUPS 2021). 299–318.
- Lin et al. [2017] Tsung-Yi Lin, Priya Goyal, Ross Girshick, Kaiming He, and Piotr Dollár. 2017. Focal loss for dense object detection. In Proceedings of the IEEE international conference on computer vision. 2980–2988.
- Manheim and Garrabrant [2018] David Manheim and Scott Garrabrant. 2018. Categorizing variants of Goodhart’s Law. arXiv preprint arXiv:1803.04585 (2018).
- Mao et al. [2023] Anqi Mao, Mehryar Mohri, and Yutao Zhong. 2023. Cross-entropy loss functions: Theoretical analysis and applications. In International Conference on Machine Learning. PMLR, 23803–23828.
- Marler and Arora [2004] R Timothy Marler and Jasbir S Arora. 2004. Survey of multi-objective optimization methods for engineering. Structural and multidisciplinary optimization 26, 6 (2004), 369–395.
- McCallum [1999] Andrew Kachites McCallum. 1999. Multi-label text classification with a mixture model trained by EM. In AAAI’99 workshop on text learning.
- Metzler and Croft [2007] Donald Metzler and W.B̃ruce Croft. 2007. Linear feature-based models for information retrieval. Information Retrieval 10, 3 (2007), 257–274.
- Mitchell et al. [2021] Shira Mitchell, Eric Potash, Solon Barocas, Alexander D’Amour, and Kristian Lum. 2021. Algorithmic fairness: Choices, assumptions, and definitions. Annual Review of Statistics and Its Application 8 (2021), 141–163.
- Morgan et al. [2004] William Morgan, Warren Greiff, and John Henderson. 2004. Direct maximization of average precision by hill-climbing, with a comparison to a maximum entropy approach. In Proceedings of HLT-NAACL 2004: Short Papers. 93–96.
- Narayanan [2018] Arvind Narayanan. 2018. 21 Fairness Definitions and Their Politics: A Tutorial. In Proceedings of the ACM FAccT Conference on Fairness, Accountability and Transparency. Association for Computing Machinery, New York, NY, USA. https://shubhamjain0594.github.io/post/tlds-arvind-fairness-definitions/.
- Navigli et al. [2023] Roberto Navigli, Simone Conia, and Björn Ross. 2023. Biases in Large Language Models: Origins, Inventory, and Discussion. 15, 2, Article 10 (jun 2023), 21 pages. https://doi.org/10.1145/3597307
- Oosterhuis and de Rijke [2018] Harrie Oosterhuis and Maarten de Rijke. 2018. Differentiable unbiased online learning to rank. In Proceedings of the 27th ACM international conference on information and knowledge management. 1293–1302.
- Park et al. [2018] Ji Ho Park, Jamin Shin, and Pascale Fung. 2018. Reducing Gender Bias in Abusive Language Detection. In Proceedings of the 2018 Conference on Empirical Methods in Natural Language Processing. Association for Computational Linguistics, Brussels, Belgium, 2799–2804. https://doi.org/10.18653/v1/D18-1302
- Pedregosa et al. [2011] F. Pedregosa, G. Varoquaux, A. Gramfort, V. Michel, B. Thirion, O. Grisel, M. Blondel, P. Prettenhofer, R. Weiss, V. Dubourg, J. Vanderplas, A. Passos, D. Cournapeau, M. Brucher, M. Perrot, and E. Duchesnay. 2011. Scikit-learn: Machine Learning in Python. Journal of Machine Learning Research 12 (2011), 2825–2830.
- Poletto et al. [2021] Fabio Poletto, Valerio Basile, Manuela Sanguinetti, Cristina Bosco, and Viviana Patti. 2021. Resources and benchmark corpora for hate speech detection: a systematic review. Language Resources and Evaluation 55, 2 (2021), 477–523.
- Rahman et al. [2021] Md Mustafizur Rahman, Dinesh Balakrishnan, Dhiraj Murthy, Mucahid Kutlu, and Matthew Lease. 2021. An Information Retrieval Approach to Building Datasets for Hate Speech Detection. In Proceedings of the Thirty-fifth Conference on Neural Information Processing Systems (NeurIPS): Datasets and Benchmarks Track.
- Röttger et al. [2021] Paul Röttger, Bertie Vidgen, Dong Nguyen, Zeerak Waseem, Helen Margetts, and Janet Pierrehumbert. 2021. HateCheck: Functional Tests for Hate Speech Detection Models. In Proceedings of the 59th Annual Meeting of the Association for Computational Linguistics and the 11th International Joint Conference on Natural Language Processing (Volume 1: Long Papers). Association for Computational Linguistics, Online, 41–58. https://doi.org/10.18653/v1/2021.acl-long.4
- Sachdeva et al. [2022] Pratik S Sachdeva, Renata Barreto, Claudia von Vacano, and Chris J Kennedy. 2022. Assessing annotator identity sensitivity via item response theory: A case study in a hate speech corpus. In Proceedings of the 2022 ACM Conference on Fairness, Accountability, and Transparency. 1585–1603.
- Sanh et al. [2019] Victor Sanh, Lysandre Debut, Julien Chaumond, and Thomas Wolf. 2019. DistilBERT, a distilled version of BERT: smaller, faster, cheaper and lighter. arXiv preprint arXiv:1910.01108 (2019).
- Sap et al. [2019] Maarten Sap, Dallas Card, Saadia Gabriel, Yejin Choi, and Noah A Smith. 2019. The risk of racial bias in hate speech detection. In Proceedings of the 57th annual meeting of the association for computational linguistics. 1668–1678.
- Schmidt and Wiegand [2017] Anna Schmidt and Michael Wiegand. 2017. A Survey on Hate Speech Detection using Natural Language Processing. In Proceedings of the Fifth International Workshop on Natural Language Processing for Social Media. Association for Computational Linguistics, Valencia, Spain, 1–10. https://doi.org/10.18653/v1/W17-1101
- Shen et al. [2022] Aili Shen, Xudong Han, Trevor Cohn, Timothy Baldwin, and Lea Frermann. 2022. Optimising Equal Opportunity Fairness in Model Training. In Proceedings of the 2022 Conference of the North American Chapter of the Association for Computational Linguistics: Human Language Technologies. Association for Computational Linguistics, Seattle, United States, 4073–4084. https://doi.org/10.18653/v1/2022.naacl-main.299
- Swezey et al. [2021] Robin Swezey, Aditya Grover, Bruno Charron, and Stefano Ermon. 2021. Pirank: Scalable learning to rank via differentiable sorting. Advances in Neural Information Processing Systems 34 (2021), 21644–21654.
- Thomas and Uminsky [2022] Rachel L Thomas and David Uminsky. 2022. Reliance on metrics is a fundamental challenge for AI. Patterns 3, 5 (2022), 100476.
- Vidgen and Derczynski [2020] Bertie Vidgen and Leon Derczynski. 2020. Directions in abusive language training data, a systematic review: Garbage in, garbage out. Plos one 15, 12 (2020), e0243300.
- Waseem [2016] Zeerak Waseem. 2016. Are You a Racist or Am I Seeing Things? Annotator Influence on Hate Speech Detection on Twitter. In Proceedings of the First Workshop on NLP and Computational Social Science. Association for Computational Linguistics, Austin, Texas, 138–142. https://doi.org/10.18653/v1/W16-5618
- Waseem and Hovy [2016] Zeerak Waseem and Dirk Hovy. 2016. Hateful Symbols or Hateful People? Predictive Features for Hate Speech Detection on Twitter. In Proceedings of the NAACL Student Research Workshop. Association for Computational Linguistics, San Diego, California, 88–93. https://doi.org/10.18653/v1/N16-2013
- Wu and Zhu [2020] Guoqiang Wu and Jun Zhu. 2020. Multi-label classification: do Hamming loss and subset accuracy really conflict with each other? Advances in Neural Information Processing Systems 33 (2020), 3130–3140.
- Xia et al. [2020] Mengzhou Xia, Anjalie Field, and Yulia Tsvetkov. 2020. Demoting Racial Bias in Hate Speech Detection. In Proceedings of the Eighth International Workshop on Natural Language Processing for Social Media. Association for Computational Linguistics, Online, 7–14. https://doi.org/10.18653/v1/2020.socialnlp-1.2
- Zhao et al. [2020] Han Zhao, Amanda Coston, Tameem Adel, and Geoffrey J Gordon. 2020. Conditional Learning of Fair Representations. In 8th International Conference on Learning Representations, ICLR 2020.
Appendix A Mapping of GAP from CE
Cross-Entropy (CE) loss is commonly used as a differntiable and smooth loss function in classification tasks and is designed to measure the difference between probability distribution predicted by the model () and the true distribution () of the data. Although not a strict one-to-one correspondence, it is generally observed that minimizing CE leads to minimizing Overall Error (OE), thereby maximizing Overall Accuracy (OA), due to CE providing non-asymptotic guarantees. While asymptotic errors provide an exact bound at infinity, CE being non-asymptotic simply upper bounds on the estimation error of the actual loss [36], theoretical analysis of which helps in tightening the gap.
CE can be computed over the entire data or independently across each group (). For balanced classification accuracy across groups, e.g. demographic information of post subject, we need to ensure that the cross entropy for each group (CE(g)) roughly equates as closely as possible. Hence, from an optimization standpoint, we first calculate the CE across each group, then minimize the difference across them under the term pairwise-group error . The squared 2-norm formulation in ensures that all pairwise-group differences are positive and the loss surface is smooth. allowing for a better descent trajectory.
Finally frame it as a Single Objective Optimization problem by combining the overall error and with a regularization term to form the GAP loss function. The GAP loss equates to overall cross entropy loss (OE) if and only if both CE(g) errors are equal across the groups.
The GAP loss is differentiable since all the CE-related terms associated with it are differentiable. The GAP formulation is generalizable to different variants of accuracy. As the situation demands, one might switch out one weighted variant of accuracy for another with an equivalent change in corresponding entropy loss. For our experiments we use the weighted binary cross entropy variant.
If the measure of interest in balanced accuracy (BA), we suggest replacing the CE terms with wBCE. Weighted Binary Cross Entropy (wBCE) re-weights the error for the class labels proportional to their inverse frequency in the data. Since most real-world datasets often have label imbalance, wBCE aims to penalize both labels (1s and 0s) equally. Thus, minimizing wBCE leads to maximizing balanced accuracy (BA), a better measure than accuracy, in presence of label imbalance.
Extension of GAP beyond Binary Groups.
It is sometimes the case that a post may target multiple groups, thus we need a GAP variant that accommodates a multi-group setting. The term defined before can be extended from a binary setting (2-groups) to a multi-group setting (-groups) by considering all possible combination of pairwise errors of distinct group pairs within the dataset of group cardinality .
This updated version allows us to account for scenarios where a post can potentially target multiple group(s).
One can make similar substitutions for BCE or wBCE in place of CE in the multi-group formulation of GAP, depending on the evaluation measure of interest and problem setup.
Appendix B Experimental Details
B.1 Setup
Experiments use a Nvidia 2060 RTX Super 8GB GPU, Intel Core i7-9700F 3.0GHz 8-core CPU and 16GB DDR4 memory. We use the Keras [8] library on a Tensorflow 2.0 backend with Python 3.7 to train the networks in this paper. For optimization, we use AdaMax [30] with parameters (lr=0.001) and steps per epoch.
B.2 Data Pre-processing
From the set of all posts, we filter out ones that target at least one or more demographic group(s), resulting in a dataset size of 44,816 posts. From there we perform a 80%-20% split for training vs. testing data, for all cluster sizes that allowed for a SkLearn’s [46] stratified sampling following the label split ratio. This resulted in a train set of size 36,412 posts and test set of size 8,404 posts.
B.3 Class Balancing Strategy
In our multi-label classification setup, we have binary class labels for each group. 1 indicates that a post targets that specific group, 0 otherwise. As common in most real-world datasets, the DLab dataset has a class label imbalance across most groups, with majority of the labels being 0s. To account for this, we perform a class balancing strategy to assign more weight to the targeted examples during model training. We use a weighted version of Binary Cross Entropy (BCE) measure that re-weights the error for the binary classes proportional to their inverse frequency in the data [34].
We use SKLearn’s [46] compute_class_weights=‘balanced’ flag for extracting weights () for classes in each group, given as333https://scikit-learn.org/stable/modules/generated/sklearn.utils.class_weight.compute_class_weight.html:
| (16) |
B.4 Model Training
For our neural model, we consider a fixed architecture in Fig. 5 across the three losses. We use DistilBERT (Sanh et al. 2019) representation layer to extract numerical features from posts. This is followed by layers of dense neuron connections with relu activation and added biases. The dense layers are of (512, 128, 64) neurons respectively, with a dropout rate of 0.1, to prevent model overfitting. The layers end in G (7 for the all-group case) classification nodes, each with sigmoid activation, no biases and 0.5 classification threshold. For experiments, we freeze the weights of the DistilBERT layer, hence the only trainable parameters are the nodes in the dense layers and the final classification layer. We also setup an EarlyStopping criteria in case the with a min_delta of 1e-4 and patience of 5.
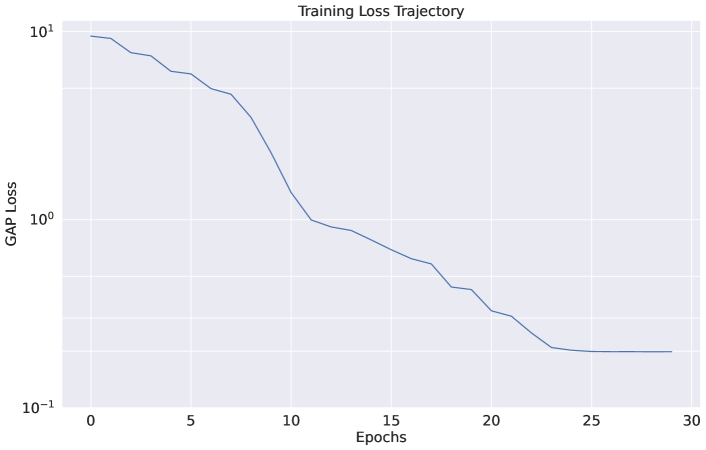
B.5 Training Loss Trajectory
We show the loss trajectory over the training data in Fig. 6. Since we are using Adamax, we achieve fast drops in the GAP loss in Eq. 4. The loss stabilizes around 23 epochs and then does some additional epochs before self terminating as per the patience limit set.
B.6 Variance across Runs
Table 1 (main material) shows the variance of Max Diff. and Avg. BA over five runs of the model using the three different losses. We observe that OE has the most variance while GAP has the least variance across runs. Note that all the five runs were independent i.e. their network weights were randomly initialized at start of each training run.
Appendix C Pairwise Group Classifiers
Since ADV cannot accommodate multiple groups, we were unable to report ADV numbers for the 7-group case in the main material. We present the performance across all four losses (OE, CLA, ADV and our GAP) for some of the 2-group case to show different scenarios and performances. Best values are bolded (higher for BA, lower for Diff.).
| Balanced Accuracy (BA) | ||||
|---|---|---|---|---|
| Loss | Latinx | Middle Eastern | Avg. BA | Diff. |
| OE | 90.98 | 83.67 | 87.33 | 7.31 |
| CLA | 91.52 | 88.73 | 90.12 | 2.79 |
| ADV | 91.04 | 84.20 | 87.62 | 6.84 |
| GAP | 92.34 | 91.79 | 92.06 | 0.55 |
| Balanced Accuracy (BA) | ||||
|---|---|---|---|---|
| Loss | Asian | Black | Avg. BA | Diff. |
| OE | 86.59 | 92.32 | 89.46 | 5.73 |
| CLA | 87.02 | 92.22 | 89.62 | 5.20 |
| ADV | 87.49 | 92.10 | 89.79 | 4.61 |
| GAP | 89.65 | 90.82 | 90.23 | 1.17 |
| Balanced Accuracy (BA) | ||||
|---|---|---|---|---|
| Loss | White | Latinx | Avg. BA | Diff. |
| OE | 88.89 | 82.19 | 85.54 | 6.70 |
| CLA | 88.20 | 85.55 | 86.87 | 2.65 |
| ADV | 88.18 | 82.19 | 85.18 | 5.99 |
| GAP | 88.36 | 86.23 | 87.29 | 2.13 |