On the universality of star formation efficiency in galaxies
Abstract
We analyze high-resolution hydrodynamics simulations of an isolated disk dwarf galaxy with an explicit model for unresolved turbulence and turbulence-based star formation prescription. We examine the characteristic values of the star formation efficiency per free-fall time, , and its variations with local environment properties, such as metallicity, UV flux, and surface density. We show that the star formation efficiency per free-fall time in pc star-forming regions of the simulated disks has values in the range , similar to observational estimates, with no trend with metallicity and only a weak trend with the UV flux. Likewise, estimated using projected patches of pc size does not vary with metallicity and shows only a weak trend with average UV flux and gas surface density. The characteristic values of arise naturally in the simulations via the combined effect of dynamical gas compression and ensuing stellar feedback that injects thermal and turbulent energy. The compression and feedback regulate the virial parameter, , in star-forming regions, limiting it to . Turbulence plays an important role in the universality of because turbulent energy and its dissipation are not sensitive to metallicity and UV flux that affect thermal energy. Our results indicate that the universality of observational estimates of can be plausibly explained by the turbulence-driven and feedback-regulated properties of star-forming regions.
keywords:
Galaxies – Star formation — numerical simulations1 Introduction
It has been known for about five decades that the efficiency with which gas is converted into stars in star-forming regions (the star formation efficiency) is small (e.g., Zuckerman & Evans, 1974). Over the past two decades, observations showed that star formation efficiency per free-fall time is only a few percent for a wide range of environments and scales (e.g., Krumholz & Tan, 2007; Krumholz et al., 2012; García-Burillo et al., 2012; Evans et al., 2014; Utomo et al., 2018; Pokhrel et al., 2021; Hu et al., 2022; Sun et al., 2023; Mattern et al., 2024, see Section 3.2 of Krumholz et al. 2019 for a review).
Theoretical models aiming to explain the low efficiency on the scales of star-forming regions (see McKee & Ostriker, 2007; Krumholz, 2014, for reviews) include magnetic pressure support against collapse of gas (e.g., Mouschovias, 1976a, b; Price & Bate, 2009; Krumholz & Federrath, 2019) and supersonic turbulence (e.g., Elmegreen, 2002; Krumholz & McKee, 2005), possibly mediated by magnetic fields (e.g., Padoan et al., 2012; Federrath & Klessen, 2013; Federrath, 2015; Girma & Teyssier, 2024).
On the kiloparsec and larger scales galaxies also form stars inefficiently, which is partly related to the local efficiency per free-fall time (e.g., Krumholz et al., 2012; Semenov et al., 2018). The connection between efficiency in star-forming regions and star formation rate measured on large scales arises because the local inefficiency of star-forming regions and their short lifetimes result in only a small fraction of gas being converted into stars in each star-forming region. Therefore, a given gas parcel has to go through a large number of star formation-dispersal cycles, each taking Myr as ISM atoms make their way into a star-forming region (Semenov et al., 2017).
In this paper, we examine the dependence of the star formation efficiency per free-fall time, , on local properties (metallicity, UV radiation field, and density of gas and stars) in a suite of high-resolution simulations that recover observed star formation properties of nearby dwarf galaxies (Kruijssen et al., 2019; Semenov et al., 2021). We show that simulations naturally produce values of in the range close to the values estimated for observed star-forming clouds in regions of very different metallicity, UV flux, and density. We show that turbulence and stellar feedback play a key role in producing universal values as they regulate the virial parameter of star-forming regions to a fairly narrow range. This is consistent with a picture of self-regulation of star formation via rapid dispersal of star-forming gas in a turbulent ISM.
The paper is laid out as follows: in Section 2, we describe the simulation used in this analysis; in Section 3, we examine the relationship between star formation parameters and local galaxy properties; and in Appendix A, we investigate the role of turbulence in regulating star formation. We discuss and summarize our results in sections 4 and 5, respectively.
1.2 \plotoneeff_pdf.pdf
1.2 \plotonesfparams_volmetals_summary.pdf
1.2 \plotonesfparams_volumw_summary.pdf
2 Simulations
We use a suite of simulations of an isolated disk galaxy adopting the initial conditions similar to the properties of the NGC 300 galaxy (Semenov et al., 2021). These simulations are run using the ART N-bodyhydrodynamics code (Kravtsov, 1999; Kravtsov et al., 2002; Rudd et al., 2008; Gnedin & Kravtsov, 2011) and include self-consistent modeling of radiative transfer (RT; Gnedin 2014), non-equilibrium chemistry of hydrogen, helium, and molecular hydrogen, as well as realistic prescriptions for star formation and feedback. The latter is sufficiently realistic to replicate detailed properties of star forming regions in NGC 300 (Semenov et al., 2021).
In these simulations, the star particles form stochastically using the rate , where is gas density, is the free-fall time, and is the star formation efficiency per free-fall time. The latter is assumed to be an exponential function of the local virial parameter (Padoan et al., 2012):
| (1) |
Here the virial parameter, , is defined following Bertoldi & McKee (1992) such that
| (2) |
where the total sub-grid velocity dispersion, , includes contributions of both turbulence and the thermal energy of the gas. Thus, the local value of in simulation cells evolves with the evolution of the interstellar medium, based on its density and the level of turbulence on small scales. The latter is modeled using an explicit subgrid turbulence model (Semenov et al., 2016).
To isolate the dependence of the results on gas metallicity, we ran a series of simulations in which metallicity in all cells is fixed throughout the simulation. Specifically, we ran simulations in which metallicity of all cells was fixed to , , , , , , and at all times during the run (Polzin et al., 2024). This is in addition to the original run initialized with the metallicity profile matching the observed radial metallicity profile of NGC 300 and with on-the-fly enrichment turned on (Semenov et al., 2021). For comparison, we also re-ran these simulations without the subgrid turbulence model, so that the contribution of turbulence to is ignored.
3 Results
3.1 Star formation efficiency as a function of metallicity on pc scale
The main result of our analyses is that the values of star formation efficiency per free-fall time in the star-forming regions of our simulations are confined to the range with no or little dependence on the local metallicity and UV flux. Figure 1 shows the probability density distribution of values in the simulations of different gas phase metallicity. The distribution of arises from the distribution of values in the simulations. The figure shows that the peak of the pdf and its medians occur in similar ranges at different metallicities.
Although the distribution extends to very low values, the contribution of low- regions to the total star formation rate is small. Moreover, results of star-forming cloud simulations of Padoan et al. (2012) used to set local in our simulations were calibrated only at . Thus, in the rest of our analysis we focus on the star-forming grid cells contributing the bulk of star formation in regions of or .
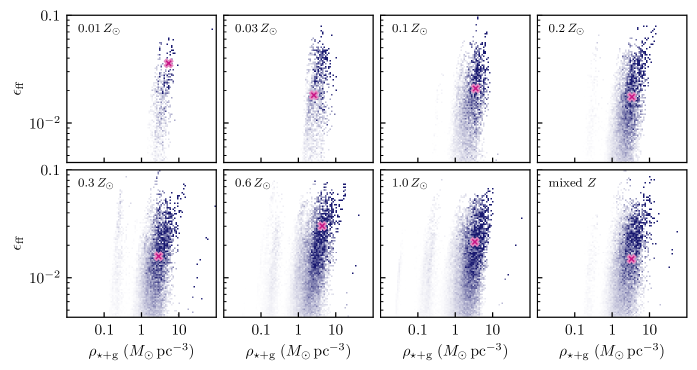
Figure 2 shows the distribution of star formation efficiency per free-fall time as a function of the baryon density (defined here as the density of stars and gas) in our simulation in grid cells (with sizes of pc). These 2D histograms are weighted by the local SFR in each cell to show the parameter space that contributes most to the total star formation rate.
The figure shows that the star-formation weighted efficiency per free-fall time has typical values of , which is similar to the range estimated in observations (e.g., Krumholz & Tan, 2007; García-Burillo et al., 2012; Evans et al., 2014; Agertz & Kravtsov, 2015), and that the range of efficiencies does not depend on the density.
We note these characteristic efficiency values are not a result of tuning but arise naturally in simulations (see Section 4 for discussion). Furthermore, the top panels in Figures 3 and Figure 4 show that the characteristic range does not depend on gas metallicity and depends only very weakly on free-space111Free-space UV flux is the flux at a given location not attenuated by local extinction. Krumholz et al. (2009), for example, use free-space flux to mean the flux incident on molecular clouds. In our simulations, the radiative transfer calculations do not include absorption by H2 lines and thus do not model radiation field self-consistently inside molecular-rich regions and have to rely on the subgrid model. In this case, the free-space flux is the flux returned by the radiative transfer solver and has the physical meaning of the incident field on the molecular gas. UV flux, , normalized by the Milky Way value at 1000 Å (Draine, 1978; Mathis et al., 1983).
Remarkably, while the amount of star-forming gas decreases with decreasing metallicity due to increasingly inefficient cooling (see Polzin et al., 2024, for a detailed discussion), the range of remains the same for all simulated metallicities. In what follows we show that also has no or very weak dependence on the averaging scale and other properties of the local galactic environment.
Figures 3 and Figure 4 also show the averages and characteristic range of the local depletion time of the gas in simulations cells, as a function gas metallicity and UV flux. Typical depletion time in star-forming cells in the simulation ( Myr) is similar to that measured in the individual star-forming regions in the Milky Way (e.g., Heiderman et al., 2010; Lada et al., 2010, 2012; Evans et al., 2014). The figures show that characteristic depletion time does not depend on gas metallicity and exhibits only a weak trend with the UV flux.
1.2 \plotonesfparams_proj500pc_summary.pdf
3.2 Star formation efficiency as a function of local environment properties on 500 pc scale
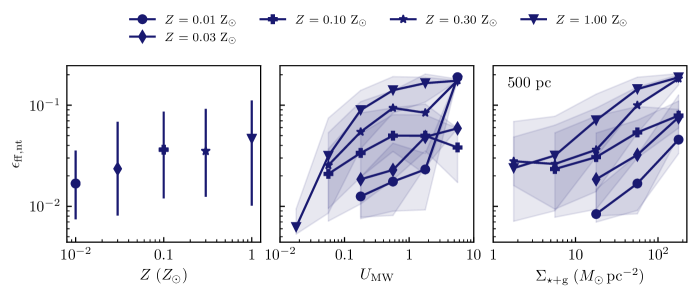
We examine the star formation efficiency per free-fall time (), the free-fall time (), and the depletion time (), averaged in patches of 500 pc size, as a function of metallicity, UV flux, and baryon (stars and gas) surface density. Namely, we compute the weighted medians222We define weighted quantiles by the value corresponding to the percentile of the cumulative distribution of weights ordered by the product of the values and the weights. of these quantities using the normalized local star formation rate in each cell as a weight. We also only use the cells with , which contribute the bulk of the total star formation in each simulated galaxy. Note that we actually compute the SFR-weighted averages of and because the star formation rate is proportional to these quantities. However, we plot their inverses and the free-fall time and the depletion time values are more easily interpretable.
The left column of Figure 5 shows the SFR-weighted median , , and for all star-forming grid cells in 500 pc patches in the runs of different metallicity. Similar to the on pc scale, the figure shows that the median efficiency per free-fall time on pc scale does not exhibit any trend with gas metallicity and ranges in – the values broadly consistent with efficiencies inferred from observations on similar scales (e.g., McKee & Ostriker, 2007; Schinnerer & Leroy, 2024, and references therein). The free-fall time and depletion time also do not exhibit strong trends with metallicity.
The middle column of Figure 5 shows the dependence of , , and on the UV flux. The median exhibits a trend with , but the trend is very weak with increasing by a factor of three as UV flux increases by three orders of magnitude. Also, over the entire range, the median values of the efficiency are in the range . Note that this range of values is a bit different than the range of in the panel quoted above because averaging in bins of is over somewhat different gas elements than averaging in bins of .
There is also a weak anti-correlation of and , which can arise because decreases with increasing density, while increases with increasing gas density due to the increase of star formation rate with density. Finally, there is a weak trend of increasing and with increasing metallicity at a given .
1.2 \plotonemaps_summary_500_binned.pdf
The right column of panels of Figure 5 shows the SFR-weighted medians of , , in the projected patches as a function of the baryon surface density of the patches. The density of gas and stars is directly integrated along the line-of-sight, while the statistics of , , and are computed using grid cells with and a refinement level with pc.
The efficiency shows only a weak trend with surface density. Our results thus indicate that in the simulations with the turbulence-based SFR model with realistic stellar feedback the natural result is the universality of characteristic values of star-forming gas in environments with a wide range of metallicities, UV fluxes, and densities and over a wide range of averaging scales. This is further illustrated in Figure 6, which shows the face-on projected maps of along with the maps of baryon surface density. The figure visually shows that while surface density varies by more than an order of magnitude in the inner regions of the disk, the values of stay in a narrow range around .
The median free-fall time of star-forming gas, on the other hand, shows tight, nearly metallicity-independent correlations with the UV flux and baryon surface density. This indicates that star-forming gas is denser in denser regions of the galaxy. This may be because gas in high surface density regions experiences a stronger gravitational pull by the disk compressing it to higher densities. The trend with UV flux may reflect the positive correlation of the UV flux and star formation rate, which, in turn, correlates with gas density. These trends of result in similar trends of the depletion time with and .
4 Discussion
As noted above, the characteristic values of in our simulations arise naturally from the specific star-formation prescription based on the simulations of star formation in turbulent molecular clouds (see eq. 1 above; Padoan et al., 2012). The efficiency in this simulation-calibrated prescription is an exponential function of , where is the virial parameter given by eq. 2, which measures the relative importance of turbulent and thermal pressure relative to gravitational force. The characteristic values of measured in the simulations thus correspond to the characteristic values of , which are set by the dynamics of the ISM gas and stellar feedback that affects the thermal and turbulent pressure of the gas.
Large-scale ISM flows lead to compression and expansion of the gas and fluctuations of (e.g., Semenov et al., 2017). As a local compression decreases locally, grows as . This growth is accompanied by the growth of star formation rate and associated stellar feedback, which increases local thermal and, importantly, turbulent pressure. This limits the decrease of and leads to self-regulation of its values to the characteristic range of . The characteristic values of in our simulations are thus the result of the star formation prescription and the stellar feedback model adopted in our simulations.
This also allows us to interpret the universality of in environments of different metallicity, UV flux, and densities demonstrated above. The pressure and in star-forming regions in these simulations are dominated by turbulent contribution and turbulent pressure. The turbulence is driven by the dynamics of the gas (mainly compression and expansion) and the dissipation of supersonic turbulence, which dominates in star-forming regions, is set by the local turbulent crossing time and does not depend on the metallicity, UV flux, or density. In contrast, the gas cooling and heating, and therefore thermal pressure, do depend on these properties and thus, when is dominated by the thermal pressure, the efficiency per free-fall time varies more strongly with the properties of the environment. This is illustrated explicitly in the Appendix A, where we show as a function of metallicity, UV flux, and surface density in simulations, in which subgrid turbulence is not modeled and its contribution to is ignored. The turbulence thus plays an important role in making value range universal.
The values of and their universality exhibited in our simulations are consistent with the typical values of estimated for observed gas in diverse environments and averaging scales (e.g., García-Burillo et al., 2012; Utomo et al., 2018; Sun et al., 2023). Estimates of from the star-forming sub-pc cores to giant molecular clouds on tens of pc scales are (e.g., Krumholz & Tan, 2007; Evans et al., 2014; Pokhrel et al., 2021; Hu et al., 2022). Similar values of are estimated on the scales of hundreds of pc in other galaxies with a diverse range of metallicities and surface densities (e.g., Leroy et al., 2008; Utomo et al., 2018; Teng et al., 2024). Our results indicate that these characteristic values of and their universality can be plausibly explained by the turbulence-driven and feedback-regulated properties of star-forming regions.
We note, however, that comparing detailed distribution of estimated in observations and simulations is not straightforward. In simulations, instantaneous values of are considered, while in observations, these values are estimated using instantaneous gas properties and star formation rate indicators that are sensitive to star formation over a certain time scale. The gas density is expected to evolve strongly as the star formation and feedback proceed in a given region (Feldmann & Gnedin, 2011). The large apparent scatter of observational estimates of thus largely reflects diverse evolutionary stages of the regions in which these estimates are made (e.g., Feldmann & Gnedin, 2011; Lee et al., 2016; Grisdale et al., 2019). Nevertheless, the simulations shed the light why the characteristic average values of do not vary with environment properties.
5 Summary and conclusions
In this study, we analyze high-resolution simulations of gas dynamics and star formation in an isolated disk dwarf galaxy with an explicit model for unresolved turbulence and turbulence-based star formation prescription calibrated on MHD simulations of turbulent molecular clouds. As demonstrated by Semenov et al. (2021), the star formation and feedback model used in the simulations reproduces star formation and gas correlations in observed galaxy NGC 300 in fine detail. We use a suite of simulations at different metallicities to examine the characteristic values of the star formation efficiency per free-fall time, , and its variations with local environment properties, such as metallicity, UV flux, and surface density. Our results and conclusions can be summarized as follows.
-
1.
We show that the star formation efficiency per free-fall time in pc star-forming regions of the simulated disks has characteristic values in the range (Figures 1 and 2). We show that the characteristic values of do not vary with metallicity and exhibit only very weak trend with UV flux (Figures 3 and 4).
- 2.
-
3.
The characteristic values of arise naturally in the simulations as a result of the gas dynamics leading to gas compression and ensuing stellar feedback that injects thermal and turbulent energy into the gas. The compression and feedback regulate the virial parameter, , in star-forming regions, limiting it to the range (see discussion in Section 4). Turbulence plays an important role in the universality of because turbulent energy driven by gas dynamics and feedback and its dissipation are not sensitive to the standard metallicity and UV flux cooling and heating processes that affect thermal energy.
-
4.
We show explicitly that values are do depend on the metallicity and UV flux in simulations where turbulent pressure contribution to the virial parameter is ignored (Figure 7).
The efficiency per free-fall time and its universality are similar to the values of observed star-forming regions in different environments and galaxies. This indicates that the universality of observational estimates of can be plausibly explained by the turbulence-driven and feedback-regulated properties of star-forming regions. In the future, it will be important to forward model observational measurements using simulations taking into account evolutionary effects on the estimates of .
Acknowledgements.
A.K. was supported by the National Science Foundation grant AST-1911111 and NASA ATP grant 80NSSC20K0512. V.S. is grateful for the support provided by Harvard University through the Institute for Theory and Computation Fellowship. The simulations used in this work were carried out on the Midway cluster maintained by the University of Chicago Research Computing Center. Analyses presented in this paper were greatly aided by the following free software packages: NumPy (Harris et al., 2020), SciPy (Jones et al., 2001–), Matplotlib (Hunter, 2007), AstroPy (Astropy Collaboration et al., 2013, 2018, 2022) and yt (Turk et al., 2011). We have also used the Astrophysics Data Service (ADS) and arXiv preprint repository extensively during this project and the writing of the paper.Appendix A Turbulence-free star formation
To better understand the mechanism driving the uniformity of the star formation efficiency with varying ISM properties (metallicity, UV field strength, and surface density of gas and stars), we re-run five of the single metallicity simulations ( and ) from the same initial conditions as the fiducial simulations introduced in Section 2, turning off subgrid turbulence and any tracking of turbulent energy. The non-turbulent virial parameter, , is then defined taking , rather than as in the default Padoan et al. (2012) model (see Eq. 2), effectively isolating the behavior and effects of thermal motions in star-forming gas. After the runs each proceed for Myr (approximately a crossing time), is then recomputed using for the non-turbulent case. We denote this non-turbulent star formation efficiency per free-fall time as . Similarly, the turbulence-free star formation rate is defined as .
All other analysis is done in the same way as in Section 3.1, and we do not change any of the physics associated with star formation or feedback within the simulation. For direct comparison between Figure 5 and 7, we make the same cut of , with cells weighted by their star formation rates.
The dependence of on gas phase metallicity is shown on the left in Figure 7. In the turbulence-free case, dependence on metallicity is noticeably stronger than in the fiducial simulations. This is likely due to the importance of thermal motions in defining . Even selecting only for star-forming regions (), low metallicity gas will be warmer than higher gas given the less efficient cooling in low metallicity gas. In this case, the thermal motions defined by will be greater in low gas, increasing and driving down compared with . This leads to varying increasing steadily with increasing gas phase metallicity.
Likewise, Figure 7 shows that in the simulations without subgrid turbulence depends significantly on the local UV flux and gas surface density (the middle and right panels). The middle panel of Figure 7. The figure shows that increases with increasing and surface density of gas and stars (averaged on 500 pc) due to the positive correlation between and density and star formation rate. The significant dependence of the efficiency on metallicity at specific values of and surface density are also apparent in these panels.
References
- Agertz & Kravtsov (2015) Agertz, O., & Kravtsov, A. V. 2015, ApJ, 804, 18, doi: 10.1088/0004-637X/804/1/18
- Astropy Collaboration et al. (2013) Astropy Collaboration, Robitaille, T. P., Tollerud, E. J., et al. 2013, A&A, 558, A33, doi: 10.1051/0004-6361/201322068
- Astropy Collaboration et al. (2018) Astropy Collaboration, Price-Whelan, A. M., Sipőcz, B. M., et al. 2018, AJ, 156, 123, doi: 10.3847/1538-3881/aabc4f
- Astropy Collaboration et al. (2022) Astropy Collaboration, Price-Whelan, A. M., Lim, P. L., et al. 2022, apj, 935, 167, doi: 10.3847/1538-4357/ac7c74
- Bertoldi & McKee (1992) Bertoldi, F., & McKee, C. F. 1992, ApJ, 395, 140, doi: 10.1086/171638
- Draine (1978) Draine, B. T. 1978, ApJS, 36, 595, doi: 10.1086/190513
- Elmegreen (2002) Elmegreen, B. G. 2002, ApJ, 577, 206, doi: 10.1086/342177
- Evans et al. (2014) Evans, Neal J., I., Heiderman, A., & Vutisalchavakul, N. 2014, ApJ, 782, 114, doi: 10.1088/0004-637X/782/2/114
- Federrath (2015) Federrath, C. 2015, MNRAS, 450, 4035, doi: 10.1093/mnras/stv941
- Federrath & Klessen (2013) Federrath, C., & Klessen, R. S. 2013, ApJ, 763, 51, doi: 10.1088/0004-637X/763/1/51
- Feldmann & Gnedin (2011) Feldmann, R., & Gnedin, N. Y. 2011, ApJ, 727, L12, doi: 10.1088/2041-8205/727/1/L12
- García-Burillo et al. (2012) García-Burillo, S., Usero, A., Alonso-Herrero, A., et al. 2012, A&A, 539, A8, doi: 10.1051/0004-6361/201117838
- Girma & Teyssier (2024) Girma, E., & Teyssier, R. 2024, MNRAS, 527, 6779, doi: 10.1093/mnras/stad3640
- Gnedin (2014) Gnedin, N. Y. 2014, ApJ, 793, 29, doi: 10.1088/0004-637X/793/1/29
- Gnedin & Kravtsov (2011) Gnedin, N. Y., & Kravtsov, A. V. 2011, ApJ, 728, 88, doi: 10.1088/0004-637X/728/2/88
- Grisdale et al. (2019) Grisdale, K., Agertz, O., Renaud, F., et al. 2019, MNRAS, 486, 5482, doi: 10.1093/mnras/stz1201
- Harris et al. (2020) Harris, C. R., Millman, K. J., van der Walt, S. J., et al. 2020, Nature, 585, 357, doi: 10.1038/s41586-020-2649-2
- Heiderman et al. (2010) Heiderman, A., Evans, Neal J., I., Allen, L. E., Huard, T., & Heyer, M. 2010, ApJ, 723, 1019, doi: 10.1088/0004-637X/723/2/1019
- Hu et al. (2022) Hu, Z., Krumholz, M. R., Pokhrel, R., & Gutermuth, R. A. 2022, MNRAS, 511, 1431, doi: 10.1093/mnras/stac174
- Hunter (2007) Hunter, J. D. 2007, Computing in Science & Engineering, 9, 90, doi: 10.1109/MCSE.2007.55
- Jones et al. (2001–) Jones, E., Oliphant, T., Peterson, P., et al. 2001–, SciPy: Open source scientific tools for Python. http://www.scipy.org/
- Kravtsov (1999) Kravtsov, A. V. 1999, PhD thesis, New Mexico State University
- Kravtsov et al. (2002) Kravtsov, A. V., Klypin, A., & Hoffman, Y. 2002, ApJ, 571, 563, doi: 10.1086/340046
- Kruijssen et al. (2019) Kruijssen, J. M. D., Schruba, A., Chevance, M., et al. 2019, Nature, 569, 519, doi: 10.1038/s41586-019-1194-3
- Krumholz (2014) Krumholz, M. R. 2014, Phys. Rep., 539, 49, doi: 10.1016/j.physrep.2014.02.001
- Krumholz et al. (2012) Krumholz, M. R., Dekel, A., & McKee, C. F. 2012, ApJ, 745, 69, doi: 10.1088/0004-637X/745/1/69
- Krumholz & Federrath (2019) Krumholz, M. R., & Federrath, C. 2019, Frontiers in Astronomy and Space Sciences, 6, 7, doi: 10.3389/fspas.2019.00007
- Krumholz & McKee (2005) Krumholz, M. R., & McKee, C. F. 2005, ApJ, 630, 250, doi: 10.1086/431734
- Krumholz et al. (2019) Krumholz, M. R., McKee, C. F., & Bland-Hawthorn, J. 2019, ARA&A, 57, 227, doi: 10.1146/annurev-astro-091918-104430
- Krumholz et al. (2009) Krumholz, M. R., McKee, C. F., & Tumlinson, J. 2009, ApJ, 693, 216, doi: 10.1088/0004-637X/693/1/216
- Krumholz & Tan (2007) Krumholz, M. R., & Tan, J. C. 2007, ApJ, 654, 304, doi: 10.1086/509101
- Lada et al. (2012) Lada, C. J., Forbrich, J., Lombardi, M., & Alves, J. F. 2012, ApJ, 745, 190, doi: 10.1088/0004-637X/745/2/190
- Lada et al. (2010) Lada, C. J., Lombardi, M., & Alves, J. F. 2010, ApJ, 724, 687, doi: 10.1088/0004-637X/724/1/687
- Lee et al. (2016) Lee, E. J., Miville-Deschênes, M.-A., & Murray, N. W. 2016, ApJ, 833, 229, doi: 10.3847/1538-4357/833/2/229
- Leroy et al. (2008) Leroy, A. K., Walter, F., Brinks, E., et al. 2008, AJ, 136, 2782, doi: 10.1088/0004-6256/136/6/2782
- Mathis et al. (1983) Mathis, J. S., Mezger, P. G., & Panagia, N. 1983, A&A, 128, 212
- Mattern et al. (2024) Mattern, M., André, P., Zavagno, A., et al. 2024, arXiv e-prints, arXiv:2405.15713, doi: 10.48550/arXiv.2405.15713
- McKee & Ostriker (2007) McKee, C. F., & Ostriker, E. C. 2007, ARA&A, 45, 565, doi: 10.1146/annurev.astro.45.051806.110602
- Mouschovias (1976a) Mouschovias, T. C. 1976a, ApJ, 206, 753, doi: 10.1086/154436
- Mouschovias (1976b) —. 1976b, ApJ, 207, 141, doi: 10.1086/154478
- Padoan et al. (2012) Padoan, P., Haugbølle, T., & Nordlund, Å. 2012, ApJ, 759, L27, doi: 10.1088/2041-8205/759/2/L27
- Pokhrel et al. (2021) Pokhrel, R., Gutermuth, R. A., Krumholz, M. R., et al. 2021, ApJ, 912, L19, doi: 10.3847/2041-8213/abf564
- Polzin et al. (2024) Polzin, A., Kravtsov, A. V., Semenov, V. A., & Gnedin, N. Y. 2024, ApJ, 966, 172, doi: 10.3847/1538-4357/ad32cb
- Price & Bate (2009) Price, D. J., & Bate, M. R. 2009, MNRAS, 398, 33, doi: 10.1111/j.1365-2966.2009.14969.x
- Rudd et al. (2008) Rudd, D. H., Zentner, A. R., & Kravtsov, A. V. 2008, ApJ, 672, 19, doi: 10.1086/523836
- Schinnerer & Leroy (2024) Schinnerer, E., & Leroy, A. K. 2024, arXiv e-prints, arXiv:2403.19843, doi: 10.48550/arXiv.2403.19843
- Semenov et al. (2016) Semenov, V. A., Kravtsov, A. V., & Gnedin, N. Y. 2016, ApJ, 826, 200, doi: 10.3847/0004-637X/826/2/200
- Semenov et al. (2017) —. 2017, ApJ, 845, 133, doi: 10.3847/1538-4357/aa8096
- Semenov et al. (2018) —. 2018, ApJ, 861, 4, doi: 10.3847/1538-4357/aac6eb
- Semenov et al. (2021) —. 2021, ApJ, 918, 13, doi: 10.3847/1538-4357/ac0a77
- Sun et al. (2023) Sun, J., Leroy, A. K., Ostriker, E. C., et al. 2023, ApJ, 945, L19, doi: 10.3847/2041-8213/acbd9c
- Teng et al. (2024) Teng, Y.-H., Chiang, I.-D., Sandstrom, K. M., et al. 2024, ApJ, 961, 42, doi: 10.3847/1538-4357/ad10ae
- Turk et al. (2011) Turk, M. J., Smith, B. D., Oishi, J. S., et al. 2011, ApJS, 192, 9, doi: 10.1088/0067-0049/192/1/9
- Utomo et al. (2018) Utomo, D., Sun, J., Leroy, A. K., et al. 2018, ApJ, 861, L18, doi: 10.3847/2041-8213/aacf8f
- Zuckerman & Evans (1974) Zuckerman, B., & Evans, N. J., I. 1974, ApJ, 192, L149, doi: 10.1086/181613