Accelerated by dark matter: a high-redshift pathway to efficient galaxy-scale star formation
Abstract
In the local Universe, star formation is typically inefficient both globally and when considered as the fraction of gas converted into stars per local free-fall time. An important exception to this inefficiency is regions of high gravitational accelerations , or equivalently surface densities , where stellar feedback is insufficient to overcome the self-gravity of dense gas clouds. In this paper, I explore whether dark matter can play an analogous role in providing the requisite accelerations on the scale of entire galaxies in the early cosmos. The key insight is that characteristic accelerations in dark matter halos scale as at fixed halo mass. I show this is sufficient to make dark matter the source of intense accelerations that might induce efficient star formation on galactic scales at cosmic dawn in sufficiently massive halos. The mass characterizing this regime scales as and corresponds to a relatively constant comoving number density of at . For somewhat rarer halos, this model predicts stellar masses of can form in regions that end up with sizes over time-scales at ; these numbers compare well to measurements for some of the brightest galaxies at that epoch from James Webb Space Telescope (JWST) observations. Dark matter and standard cosmological evolution may therefore be crucial for explaining the surprisingly high levels of star formation in the early Universe revealed by JWST.
keywords:
galaxies: formation – galaxies: high-redshift – dark matter – cosmology: theory1 Introduction
Star formation is generally regulated by stellar feedback: young, massive stars have prodigious UV output, leading to a variety of physical mechanisms that inhibit further star formation. The star formation efficiency — the fraction of gas converted into stars on a free-fall time — is therefore low, typically , even in molecular clouds (Kennicutt, 1998; Murray et al., 2010; Krumholz et al., 2019). An important exception is dense regions where baryons experience high accelerations: in this case, momentum injection from massive stars, , is insufficient to overcome gravity and star formation becomes efficient:
, with . Observational, theoretical, and numerical results (Fall et al., 2010; Colín et al., 2013; Geen et al., 2017; Kim et al., 2018; Kruijssen et al., 2019; Grudić et al., 2020; Polak et al., 2023) all point to a critical acceleration of separating the
regimes where stellar feedback removes most of the potentially star-forming gas () and where gravity overcomes the effects of feedback (). For historical reasons, this is usually expressed in terms of a surface mass density111It is therefore sometimes useful to express in relevant units as
or ,
; in these terms, the critical value is .
In principle, this acceleration can be provided by any kind of matter. In practice, regions in the local Universe where large amounts of gas experience high enough accelerations to undergo efficient star formation are dense concentrations of baryons, typically in the form of molecular clouds. The vast majority of dark matter must be effectively dissipationless on scales relevant for galaxy formation, meaning that it is unable to cool to high enough densities to contribute to high accelerations given the measured cosmological mean value of the dark matter density at . As I discuss in more detail in Sec. 2, the acceleration at the outer edge of a galaxy-scale dark matter halo at is while the acceleration at its center is typically times higher (), still well below .
However, at fixed halo mass, the acceleration at the virial radius scales roughly as , which means halos of a fixed mass are subject to accelerations times higher at than at . Dark matter may then provide the high accelerations needed for efficient star formation. As I demonstrate below, the potential wells of dark matter halos at redshifts can subject large masses of baryons to these high accelerations, providing a potential avenue for efficient star formation on a galaxy-wide scale.
Galaxy formation efficiency at these redshifts has recently shifted from purely theoretical speculation to an urgent observational and theoretical puzzle. JWST has revealed an epoch of strikingly and unexpectedly active galaxy and black hole growth at cosmic dawn (Bezanson et al. 2022; Castellano et al. 2022; Arrabal Haro et al. 2023; Bouwens et al. 2023; Chworowsky et al. 2023; Finkelstein et al. 2022; Franco et al. 2023; Eisenstein et al. 2023; Finkelstein et al. 2023; Greene et al. 2023; Labbé et al. 2023; Pérez-González et al. 2023; Akins et al. 2024; Casey et al. 2024; Donnan et al. 2024; Dressler et al. 2024; for a recent review, see Adamo et al. 2024b), and a variety of models have been used to interrogate or explain these surprising results (Boylan-Kolchin, 2023; Dekel et al., 2023; Ferrara et al., 2023; Li et al., 2023; Mason et al., 2023; Mirocha & Furlanetto, 2023; Prada et al., 2023; Shen et al., 2023; Feldmann et al., 2024; Lu et al., 2024; Nusser, 2024; Shen et al., 2024; van Dokkum & Conroy, 2024). The goal of this paper is to point out that efficient star formation on large scales — significantly exceeding the mass scales of giant molecular clouds — is a simple but unavoidable consequence of the evolution of dark matter densities in an expanding Universe, which produce much more intense gravitational accelerations in galaxy-scale halos at high redshift than are possible in the local Universe, and to explore some of the attendant implications for galaxy formation.
When necessary, I assume a standard CDM cosmology with , , , , and (Planck Collaboration et al., 2020). I adopt for concreteness. The precise value of does not matter for the qualitative picture I describe, as the relationship between acceleration or total surface density and integrated star formation efficiency increases quickly for and saturates for (Fall et al., 2010; Grudić et al., 2020). Quantitative predictions will be sensitive to the precise value of , a point to which I return in Sec. 4.
2 Background
The virial radius of a dark matter halo of mass at redshift is defined via
| (1) |
where is the overdensity calculated using the spherical top-hat collapse model (Bryan & Norman, 1998). The acceleration at the virial radius — the virial acceleration — is then
| (2) |
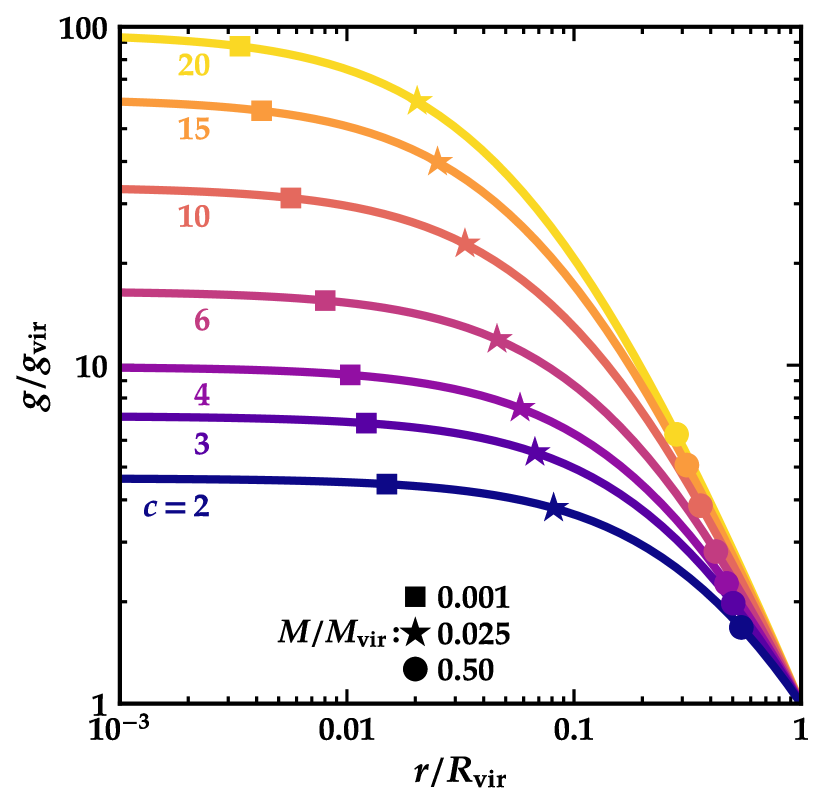
The acceleration profile of a dark matter halo interior to the virial radius follows from its mass profile; for a Navarro, Frenk & White (1996, 1997, hereafter, NFW) profile, the acceleration at radius depends only on the virial acceleration and the halo concentration:
| (3) |
where . As , the density profile is , giving a mass profile of and an acceleration profile that approaches a constant, maximum value:
| (4) |
The left panel of Fig. 1 shows the acceleration profile for NFW halos with a variety of concentrations ranging from to plotted as a function of . Symbols mark the indicated fixed fractions of enclosed mass relative to . For very concentrated halos, 50% of the mass experiences an acceleration that is greater than , extending over of the halo, while none of the mass in halos experiences an acceleration exceeding .
3 Accelerations at high redshift
3.1 Relating halo mass, virial accelerations, and halo abundances across redshifts
Within a halo’s virial radius, the range of accelerations experienced due to dark matter alone is therefore relatively narrow, a factor of for a fiducial concentration of . The Milky Way (, ) has , so the maximum acceleration from dark matter is or , well below . Even in galaxy-cluster-mass halos with , is only and . However, at fixed halo mass, the virial radius scales inversely with :
| (5) |
The virial acceleration therefore increases as :
| (6) | ||||
| (7) |
The centers of galaxy-scale halos with can therefore reach or even exceed at high redshifts; even halos can have at
To further emphasize this point, we can invert Eq. 7 to obtain the virial mass as a function of the virial acceleration (or surface density) and redshift:
| (8) |
The virial mass giving a fixed virial acceleration scales as .
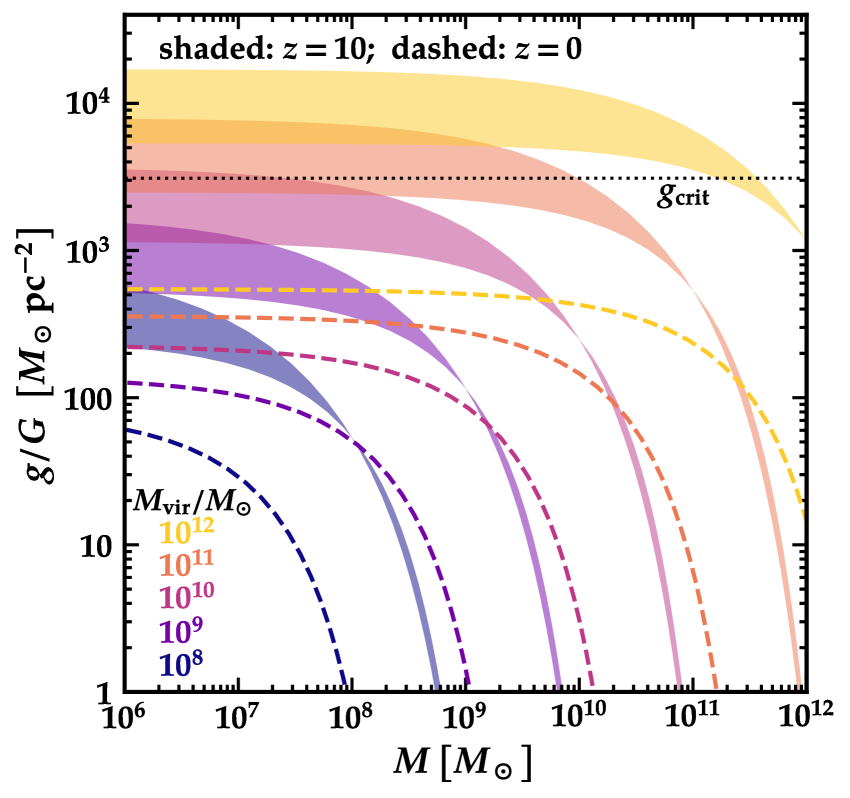
This point is emphasized in the right panel of Fig. 1. It shows the relationship between enclosed mass and acceleration at (dashed lines) and (shaded regions) for . I assume the mean relation from Ishiyama et al. (2021) as implemented in Colossus (Diemer, 2018); at , the shaded region corresponds to concentrations between and , which approximately spans the symmetric 68% interval around the median concentration found in the cosmological simulations of Yung et al. (2024). It is straightforward to see that virtually all of the mass in a halo lies above , while a halo can have as much as or as little as no mass above .
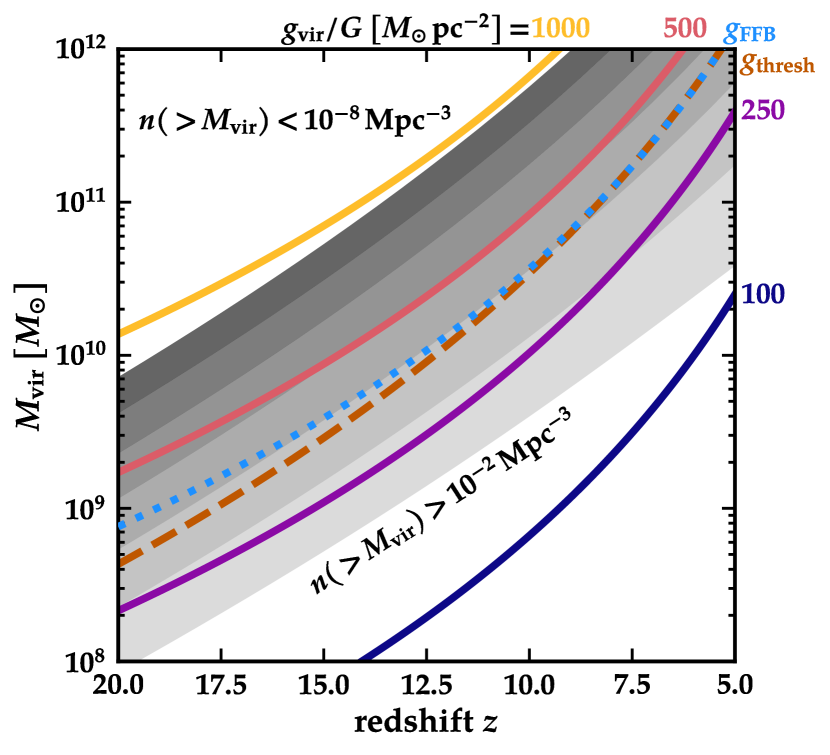
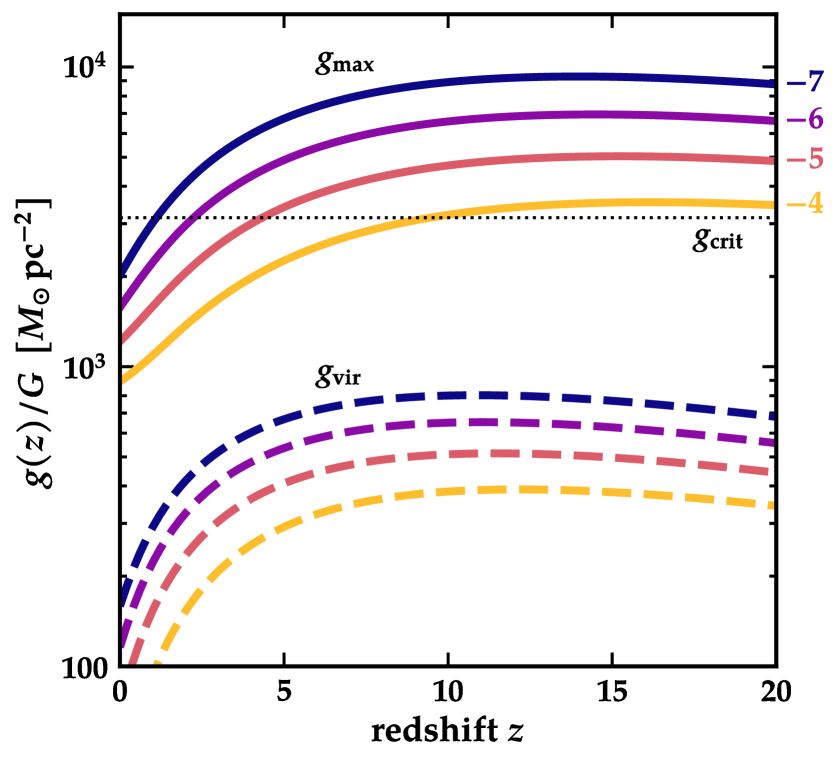
To understand whether dark matter can play a role in efficient star formation, therefore, we must understand how likely it is to find halos with appreciable mass above at high redshift. Figure 2 contains this information: it shows the virial mass at redshift corresponding to cumulative abundances ranging from (the upper boundary of the darkest gray region) to (the lower boundary of lightest gray region). It is immediately apparent that we cannot use halos to explain efficient star formation at revealed by JWST via high (dark matter) surface density: the expected abundance of objects at least this massive is at and drops precipitously as redshift increases, while the observed number density of surprisingly bright galaxies at high redshift is at least an order of magnitude larger.
The solid colored lines in Figure 2 show the evolution of halo mass corresponding to fixed . These curves are defined by Eq. 8 and therefore evolve as . Intriguingly, they track the evolution of halos at fixed cumulative abundance quite closely for : halos of a fixed cumulative comoving number density have nearly fixed virial accelerations. The dashed orange line shows a threshold acceleration , defined via , i.e., the virial acceleration where a halo’s central acceleration achieves . This is the minimum requirement for having a non-zero quantity of gas exceeding owing to accelerations from high dark matter densities. This threshold is not a constant value with redshift because halo concentrations at a given evolve somewhat with time, but the figure shows this evolution has a very minor effect on : it closely follows the contour for a constant cumulative comoving number density of from .
The blue dotted curve in Figure 2 shows the redshift evolution of giving , which has . This virial mass and redshift combination is noteworthy because it was derived by Dekel et al. (2023) for conditions conducive to feedback-free bursts (FFBs) in the early Universe, where star formation is postulated proceed in a highly efficient manner222I have ignored the slight difference in cosmology and virial mass definition adopted by D23 in computing the virial acceleration for the characteristic FFB mass; this can lead to changes in the value of at the few percent level, meaning the exact correspondence seen at the lowest redshifts in Figure 2 is coincidental. In any case, the mass scale of was not (and cannot be) characterized to percent-level accuracy in D23.. The values of and and their evolution with redshift are nearly identical, reinforcing the possibility that efficient galaxy-wide star formation in the high-redshift Universe can be catalyzed by the gravity from dark matter in halos that exceed a threshold virial acceleration.
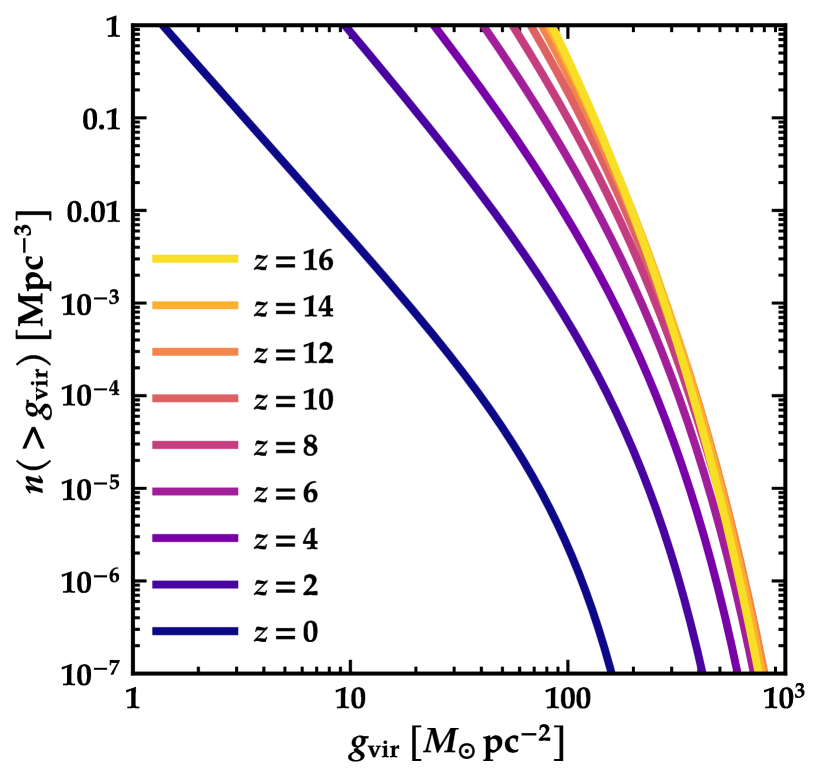
An alternate way to look at the evolution of accelerations within halos at high redshift is to plot the cumulative number density of halos as a function of (recall that is straightforwardly related to via Eq. 6). The left panel of Figure 3 shows this cumulative comoving number density as a function of for redshifts from to . The number density at fixed increases quickly from to . At higher redshift, however, the evolution at fixed is almost negligible. Once again, we see that halos of a fixed number density correspond very closely to halos of a fixed at high redshift.

The right panel of Figure 3 emphasizes this point further. The dashed lines show the evolution of at fixed number densities of , revealing the near constancy of at fixed number density for . The solid lines in the right panel of Figure 3 show how evolves at the same cumulative number densities; the relation adopted for this figure assume the model of Ishiyama et al. (2021) which predicts at all redshifts for the number densities shown in the figure. The abundance of halos as a function of is also roughly constant in redshift above . The value of at high redshifts notably exceeds for the four number densities plotted here. Dark matter halos at high redshift may have sufficient internal accelerations to overcome momentum injection from stellar feedback, resulting in efficient galaxy formation on galaxy-wide scales. An additional important result from Figure 3 is that halos at a fixed number density lying above have been above since at least , indicating the efficient mode of star formation posited here is likely the first mode of star formation these halos undergo: there is no chance for feedback from earlier generations of star formation to lower the central densities (and therefore central accelerations) of these halos.
3.2 From halo properties to baryons
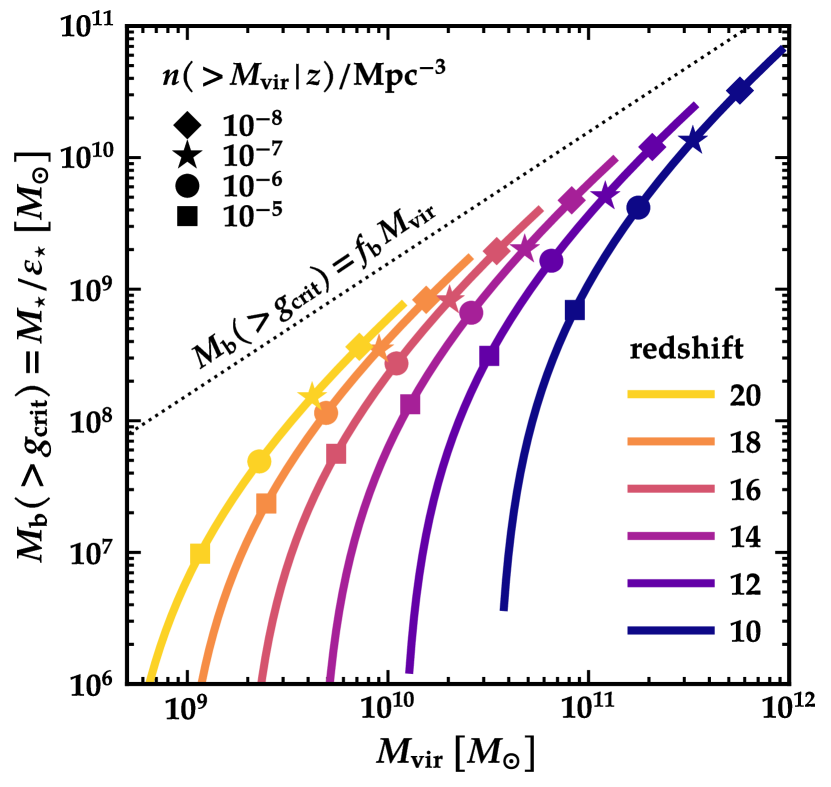
The remaining question, therefore, is how much mass in baryons experiences accelerations above at high redshifts? The left panel of Figure 4 shows the evolution with redshift of the baryonic mass above ; the gray-scale contours show the evolution of the same fixed number densities as in Figure 2 while the dashed orange line once again shows . For the purposes of this plot, I assume that each halo has its cosmic fraction of baryons, , and that the baryons have a spatial distribution matching that of the dark matter. This gives an upper limit to the stellar mass content of a halo that can come from efficient conversion of baryons in a dark matter halo via the mechanism described here. The plot emphasizes the difficulty of getting efficient star formation at high redshift even in the high acceleration regime. At , the number density of halos containing in baryons above is ; halos with are rarer than . Even with very efficient star formation in this regime — a conversion of all available baryonic mass above into stars, meaning for this material — halos with of stars will be very rare and halos with should not exist at .
The right panel of Figure 4 provides an alternate way to understand the available baryon reservoirs for efficient star formation at high redshift. It shows the mass in baryons above as a function of halo mass at six different redshifts. The symbols mark cumulative comoving number densities as noted on the plot. For surveys probing effective volumes of , the rarest objects expected on average have , corresponding to the squares in the figure. At , the most massive object in such a survey should be no more than ; by , objects with may be present. Surveys probing 100x larger volumes will be able to see objects that are an order of magnitude more massive at a fixed redshift. Note that even for extremely rare halos with , the baryon content at high accelerations does not approach the theoretical maximum of , underlining the extreme difficulty of converting anything close to a halo’s cosmic fraction of baryons into stars at high redshift.
3.3 Star formation rates and stellar masses
The region of efficient star formation has a size that is defined by . For my choice of , the size, density and free-fall time in this region are:
| (9) |
| (10) |
| (11) |
where I have evaluated the free-fall time at the mean total density . The baryonic mass available within this radius is , where parameterizes the concentration of the baryons relative to the dark matter within ; corresponds to my fiducial assumption that baryons trace the total matter distribution.
The time-averaged star formation rate in this region is then
| (12) | ||||
| (13) |
i.e., a mass of stars will form per free-fall time, with the total star formation persisting for a period of free-fall times, producing a total stellar mass of with . Numerical and observational arguments point to , i.e., star formation will persist for approximately 3 free-fall times (e.g., Elmegreen 2000; Grudić et al. 2018; Kim et al. 2018). The integrated star formation efficiency333Note the definition of differs from Boylan-Kolchin (2023): there, it was defined as the fraction of a halo’s baryons that have been converted into stars, whereas here it is the fraction of baryons within the high acceleration region of a halo – typically a small fraction of a halo’s total baryonic content, as shown in the right panel of Fig. 4 – that have been converted into stars. should be high () since these systems are in the high acceleration regime where feedback is ineffective; the efficiency per free-fall time will be lower by a factor of . The total duration of star formation is predicted to be at most for ( for ); star formation indicators that are sensitive to longer timescales will therefore underestimate the true instantaneous star formation rate in these regions of efficient star formation.
Using Eq. 11, the star formation rate can be written as
| (14) |
yielding a specific star formation rate of at for the fiducial values of star formation parameters and a stellar mass dependence of . In this regime, the stellar mass dependence of the specific star formation rate is set simply by , which is the time it takes to convert gas into stars in the region of high acceleration or (total) surface density.
Equation 14 can be expressed in terms of UV magnitudes as well; assuming no attenuation, the result is
| (15) |
where is the conversion factor between specific luminosity and star formation rate (e.g., Kennicutt 1998) and is the value for a Salpeter (1955) IMF; for a Chabrier (2003) IMF, (Madau & Dickinson, 2014), making a given brighter by in the UV.
3.4 Comparison with Observations
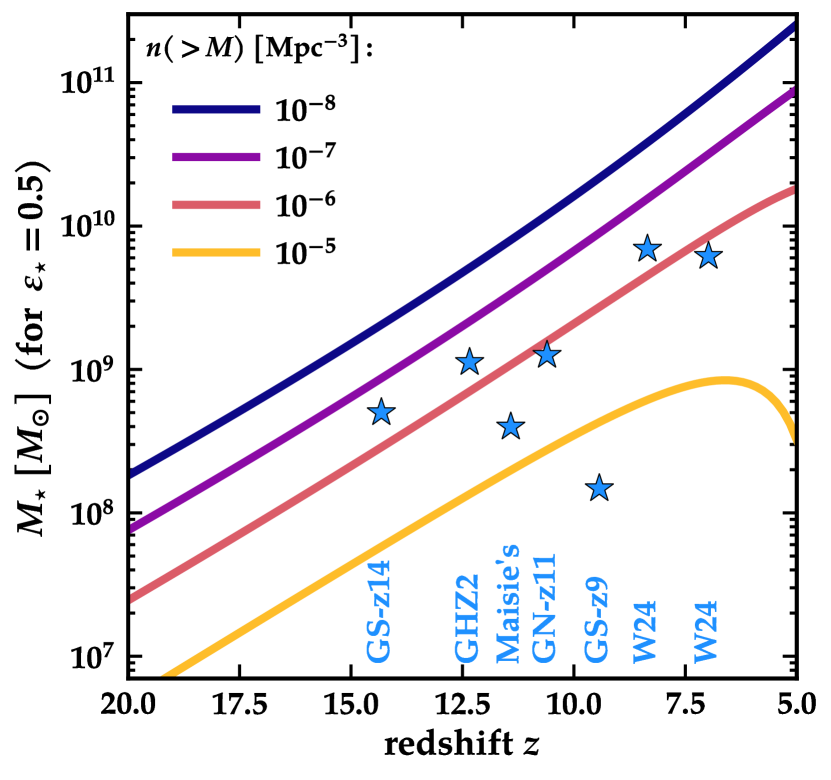
Figure 5 shows the evolution of in systems with fixed cumulative comoving number densities of as a function of redshift. The figure assumes halos lie on the mean relation from Ishiyama et al. (2021) and that the stellar mass is formed in the region of high acceleration as in the previous subsection, i.e., with ; for the purposes of the figure, I assume an integrated star formation efficiency in this phase of . Several high-redshift galaxies with redshifts that have been spectroscopically confirmed by JWST are also shown on the plot. These galaxies have inferred stellar masses that are consistent with the predictions of efficient galaxy formation in the high (dark matter) acceleration regime, as they lie close to the volumes surveyed by CEERS (Finkelstein et al., 2023) and JADES (Eisenstein et al., 2023) of . Equations 9 and 10 indicate that roughly of baryons will reside in a region of for halos with or ( for . If the baryons collapse by a factor of , their density will be in a region of ; this gives a rough estimate of the resulting size of the region that will undergo intense star formation.
The numbers in the previous paragraph compare reasonably well with observations: for example, Tacchella et al. (2023) find that GN-z11 has a stellar mass of within a half-light radius of and a star formation rate of . All of these values, as well as its observed value of with of obscuration, agree very well with the expectations of the model described here. From Figure 4, the expected halo mass is , again consistent with the value estimated by Tacchella et al. (2023). GN-z11 is the brightest of the galaxies in Fig 5, perhaps indicating it has been caught directly during its maximally efficient star formation phase; many of the other galaxies may be observed at a time somewhat offset from the maximum efficiency, reducing their brightnesses and inferred star formation rates. GHZ12 has an effective radius of , a stellar mass of , , and (Castellano et al., 2024). The predictions of this work would put it magnitudes brighter and with a star formation rate that is times higher if all of its stellar mass were formed in a single burst of efficient star formation. If, instead, roughly 20% of the mass was formed very recently in the regime facilitated by high dark matter accelerations — or if star formation persisted for closer to — then the model described here would provide a good match to the observations.
Based on Figures 4 and 5, the mass in baryons within the region of efficient star formation should drop by a factor of from to and an additional factor of 2 at at a fixed halo number density. The detection of GS-z14 (Carniani et al., 2024) therefore augurs well for possible future confirmation of similar or slightly less bright/massive galaxies out to in the context of the dark-matter-driven star formation model described here.
4 Discussion
The idea at the heart of this paper is very simple: at fixed virial mass, dark matter halos at high redshift are much denser than at low redshift, and this higher density can lead to large quantities of baryons experiencing accelerations high enough that stellar feedback should become ineffective. In this regime, dark matter is the source of high acceleration needed for efficient star formation, which can occur on a scale much larger than at low redshift, where such high accelerations are only realized in dense cores of molecular clouds from the self-gravity of baryons. Some halos at high redshift therefore should be able to form stars very efficiently owing simply to their high densities. This general picture appears unavoidable.
The details of this process will depend on a number of factors, including the concentrations of dark matter halos (which control the amount of mass above ) and the value of itself. However, should not be thought of as a threshold but rather as a characteristic value that roughly separates inefficient star formation (at ) from highly efficient star formation (at ; see, e.g., Grudić et al. 2020; Hopkins et al. 2022). The overall picture described here appears robust so long as there is no mechanism for reducing the central densities of halos at very high redshifts. One such candidate would be star formation feedback, but as demonstrated in Figure 3, the halos in the high acceleration regime enter this regime early enough that it appears implausible that they have formed any significant amount of stars before efficient star formation begins. If the stellar IMF differs substantially in bright systems at early cosmic times relative to lower redshifts, could vary as well: for example, a more top-heavy IMF, as has been invoked to explain JWST observations (Inayoshi et al., 2022; Steinhardt et al., 2023; Lu et al., 2024; Menon et al., 2024; van Dokkum & Conroy, 2024), would increase and therefore . It would be interesting to consider extensions of this work that take into account possible variations in the IMF.
Modifying the assumed cold and collisionless nature of dark matter could also affect the distribution of matter in the centers of dense dark matter halos: for example, dark matter self-interactions tend to reduce the central densities of halos (Spergel & Steinhardt, 2000; Bullock & Boylan-Kolchin, 2017; Buckley & Peter, 2018; Tulin & Yu, 2018). However, this process is likely to be very inefficient in the regime considered here, where halos are undergoing rapid mass assembly that serves as a heat supply, preventing efficient core creation (Davé et al., 2001). AGN feedback can provide stronger outward accelerations than stellar feedback, but this requires massive black holes; it is likely to operate only after an epoch of efficient galaxy formation and black hole growth.
It is important to note that while the process discussed here is posited to lead to high galaxy-wide star formation efficiency, the efficiency does not approach the theoretical maximum of (Steinhardt et al., 2016; Behroozi & Silk, 2018; Boylan-Kolchin, 2023), as is demonstrated in the right panel of Figure 4. This reflects the difficulty — likely impossibility — of converting virtually all baryons in a halo into stars, as most baryons reside at low densities far from the halo’s center. Any significant population of galaxies that require integrated star formation efficiencies of would remain very difficult to understand within CDM. Nevertheless, high acceleration from dark matter alone appears to be an attractive and natural mechanism for explaining the surprisingly abundant and bright galaxies in the infant cosmos revealed by JWST as well as why this sort of efficient star formation on large scales cannot continue to lower redshifts.
From Figure 3, however, it is clear that many halos in the efficient galaxy formation regime of will remain there for a substantial period of time. This may lead to repeated cycles of efficient bursts of star formation followed by (temporary) quiescence as gas re-accumulates at the centers of halos. A rough estimate of the time-scales involved is that the efficient bursts should occur on a local free-fall time (Eq. 11), which is very close to a local crossing time, while the resupply timescale is comparable to the crossing time at the virial radius, which is at independent of halo mass and scales as at high redshift. Rarer halos will have higher values of at all epochs, meaning the duration of efficient starbursts will be a larger fraction of the re-accretion time scale; as a result, very rare and massive halos of may go through cycles of efficient bursts with a duty cycle of , whereas halos with will have duty cycles of at most . The star formation histories of the most massive and rarest galaxies therefore may show evidence of more continuous efficient star formation than more typical galaxies.
As shown in Figure 2 and discussed in Sec. 3.1, the redshift dependence of the threshold mass for efficient star formation in my model is eerily close to the threshold for feedback-free bursts posited by Dekel et al. (2023) and discussed further in Li et al. (2023). While some similarities certainly exist, the two models rely on very different assumptions and make substantively different predictions: for example, Dekel et al. (2023) quote an expected stellar mass of at in halos of with a star formation rate of ; at the same halo mass, the model described here would result in an order of magnitude lower stellar mass (see Fig. 4) as well as a star formation rate that is lower by a factor of . An avenue of future interest is a more detailed comparison of the two models and an exploration of whether their predictions are in conflict or concordance.
At the high accelerations considered here, the high efficiency of star formation is not the only expected change: stars should form preferentially in self-bound clusters (Hills, 1980; Krumholz et al., 2019; Li et al., 2019), with Grudić et al. (2021) finding that the fraction of stars forming in bound clusters approaches unity at integrated star formation efficiencies of in excess of . The result of the star formation process postulated here should therefore be a region of a galaxy dominated by young star clusters. This scenario is supported by JWST observations that have revealed lensed systems with a large number of infant clusters dominating the light (e.g., Adamo et al. 2024a; Bradley et al. 2024; Fujimoto et al. 2024. Figure 4 indicates that sufficient collections of baryons ( may be subjected to high enough accelerations to form individual globular clusters as early as in halos with volume densities of .
Massive, dense clusters are potentially the sites of top-heavy IMFs (e.g., Haghi et al. 2020) and may host supermassive stars (a leading candidate to explain anomalous chemical abundances observed in massive globular clusters in the Milky Way; Denissenkov & Hartwick 2014; Bastian & Lardo 2018), which means the mode of star formation proposed here might be conducive to the formation of IMF variations and massive black hole seeds (the remnants of the supermassive stars). An additional change relative to standard theories of star formation at high surface density in the dark-matter-driven high efficiency regime described here is that escape velocity from star-forming regions will be much higher than for typical molecular clouds owing both to their greater masses and to the large reservoirs of dark matter on somewhat larger scales. This may result in more efficient self-enrichment of galaxies — and possibly even star clusters — formed in this way at early cosmic epochs, potentially imprinting a signature of this mode of efficient galaxy formation and helping to explain abundance anomalies observed in a subset of stars in massive globular clusters. Another intriguing possibility is that the mechanism discussed here could be conducive to the formation direct collapse black holes in metal-free gas at higher redshift. Figure 4 hints that this may be possible; it will be the subject of a future paper.
One final point of interest relates to the evolution of densities under hierarchical assembly. The high densities at high redshifts described here occur within a fixed physical radius; the fact that similar densities do not typically occur in more massive halos at lower redshifts indicates that either (1) there must be a mechanism for reducing dark matter densities through hierarchical assembly, or (2) the descendants of these halos with high accelerations at high redshift survive to the present day with similarly high physical densities at their centers.
Option (1) would be somewhat surprising, as controlled simulations of dark matter halo mergers indicate that central densities increase in physical units as a result of the merger process (Boylan-Kolchin & Ma, 2004; Kazantzidis et al., 2006; Drakos et al., 2019). Diemand et al. (2007) also demonstrate the relative constancy of at small radii within fixed physical apertures for the cosmological evolution of an individual Milky-Way-mass halo. However, the required effect need only operate in rare halos with number densities less than ; it is not surprising that it has not been observed in zoom-in cosmological simulations focusing on Milky-Way-mass systems, which are substantially more common. Zoom-in simulations of dark matter halos at the scale of galaxy clusters (e.g., Gao et al. 2012) are therefore of great interest in this context. Moreover, the models of Loeb & Peebles (2003) and Gao et al. (2004) do point to a reduction of physical densities in the centers of halos with fixed over cosmic time; investigating possible mechanisms for such a reduction an important avenue for future work.
Option (2) could be realized if the high acceleration halos end up with high concentrations for their mass at , as the mass within fixed physical apertures in the inner regions of such halos will be larger than for typical halos, or as dense substructure in more massive systems (see also Ishiyama 2014; Errani et al. 2018; van den Bosch & Ogiya 2018; Delos & White 2023). This possibility is intriguing, as it points to galaxies living in the earliest-forming massive halos as excellent sites for probing efficient galaxy formation at high redshift. A more detailed analysis that folds in the full distribution of halo concentrations at fixed virial mass and its evolution with time would be highly valuable in evaluating whether option (2) is a viable explanation.
5 Conclusions
While star formation is generally inefficient when considered as the fraction of gas turned into stars on a local dynamical time or integrated over the lifetime of a star-forming region, efficient star formation can happen when stellar feedback cannot overcome the gravity of star-forming gas. This regime is characterized by acceleration that exceed (or ), which is set by the momentum flux per unit mass from a young stellar population. In the low-redshift Universe, the only regions where such accelerations are realized are in the baryon-dominated cores of molecular clouds. However, I point out in this paper that at high redshift, the significantly higher mean density of the Universe results in regions within galaxy-mass halos where dark matter can provide the necessary accelerations for efficient formation of galaxy-scale quantities of stars ().
This straightforward but surprising result has important implications for our understanding of galaxy formation at high redshifts (, where JWST has revealed unexpectedly bright and massive galaxies. The basic picture I describe in this paper can be summarized as follows. The virial mass corresponding to a fixed virial acceleration scales as (Eq. 8), tracking roughly constant cumulative comoving number densities of halos at early times. Assuming that dark matter halos have NFW profiles with concentrations that follow the mean relations measured in cosmological simulations, there is a threshold virial acceleration of : above this value, the central portion of the halo will experience accelerations in excess of (Figure 2). This threshold virial acceleration corresponds to . The amount of baryonic mass contained in the region of high acceleration is at the threshold mass; for more massive (and therefore rarer) halos, the mass in baryons subject to high accelerations can be comparable to the observed masses of the highest redshift galaxies (Figure 4 and 5).
The regions of where dark matter provides acceleration in excess of are characterized by initial sizes of , baryonic densities of , and free-fall times of for baryonic content of (Equations 9-11). Assuming an integrated star formation efficiency of in this region results in a stellar mass of that will be formed in , a star formation rate of over this period, and an unattenuated UV magnitude of (assuming a Salpeter IMF). The specific star formation rate is expected to scale as . To reach densities required for star formation, the baryons in a region such as this must collapse by a factor of , giving a size of . These properties are in reasonable agreement with observations of luminous systems at high redshift such as GN-z11 (Sec. 3.4), with the prediction that they reside in halos with number densities of (Figure 5).
The dependence of the threshold virial acceleration on redshift is nearly identical to what was predicted for feedback-free bursts in Dekel et al. (2023), an intriguing similarity given the differences in the underlying physical models. In detail, the predictions here differ non-trivially from those for feedback-free bursts, with dark-matter-driven efficient galaxy formation predicting lower global star formation efficiencies and lower stellar masses at fixed halo mass. Future avenues for exploration include folding in a full relation as described in, e.g., Fall et al. (2010), Grudić et al. (2018), or Hopkins et al. (2022) and a cosmological distribution of concentrations at fixed halo mass and redshift (as the central gravitational acceleration at a given halo mass and redshift depends only on concentration via Eq. 4). Understanding the fate of the predicted regions of high galaxy formation efficiency will also be important, as within the basic paradigm described in this paper, they must either become less dense with time or represent the high-concentration tail of massive halos (or their substructure) in the local Universe, as described at the end of Section 4. Nevertheless, the simplicity and predictive power of the model presented here for efficient dark-matter-driven star formation on galactic scales make it a promising explanation for the highly active earliest epochs of galaxy formation revealed by JWST.
6 Data availability.
No new data were generated or analyzed in support of this research.
Acknowledgments
I thank Volker Bromm, James Bullock, Phil Hopkins, Pawan Kumar, Eliot Quataert, Stella Offner, and Jenna Samuel for helpful conversations that informed this work. I acknowledge support from NSF CAREER award AST-1752913, NSF grants AST-1910346 and AST-2108962, NASA grant 80NSSC22K0827, and HST-GO-16686, HST-AR-17028, and HST-AR-17043 from the Space Telescope Science Institute, which is operated by AURA, Inc., under NASA contract NAS5-26555. I am very grateful to the developers of the python packages that I used in preparing this paper: numpy (Harris et al., 2020), scipy (Virtanen et al., 2020), matplotlib (Hunter, 2007), ipython (Pérez & Granger, 2007), hmf (Murray et al., 2013; Murray, 2014), and colossus (Diemer, 2018). This research has made extensive use of NASA’s Astrophysics Data System (http://adsabs.harvard.edu/) and the arXiv e-Print service (http://arxiv.org).
References
- Adamo et al. (2024a) Adamo A., et al., 2024a, arXiv:2401.03224 [astro-ph], p. arXiv:2401.03224
- Adamo et al. (2024b) Adamo A., et al., 2024b, arXiv:2405.21054 [astro-ph], p. arXiv:2405.21054
- Akins et al. (2024) Akins H. B., et al., 2024, arXiv:2406.10341 [astro-ph], p. arXiv:2406.10341
- Arrabal Haro et al. (2023) Arrabal Haro P., et al., 2023, Nature, 622, 707
- Bastian & Lardo (2018) Bastian N., Lardo C., 2018, ARA&A, 56, 83
- Behroozi & Silk (2018) Behroozi P., Silk J., 2018, MNRAS, 477, 5382
- Bezanson et al. (2022) Bezanson R., et al., 2022, arXiv:2212.04026 [astro-ph], p. arXiv:2212.04026
- Bouwens et al. (2023) Bouwens R. J., et al., 2023, MNRAS, 523, 1036
- Boylan-Kolchin (2023) Boylan-Kolchin M., 2023, Nature Astronomy, 7, 731
- Boylan-Kolchin & Ma (2004) Boylan-Kolchin M., Ma C.-P., 2004, MNRAS, 349, 1117
- Bradley et al. (2024) Bradley L. D., et al., 2024, arXiv:2404.10770 [astro-ph], p. arXiv:2404.10770
- Bryan & Norman (1998) Bryan G. L., Norman M. L., 1998, ApJ, 495, 80
- Buckley & Peter (2018) Buckley M. R., Peter A. H. G., 2018, Phys. Rep., 761, 1
- Bullock & Boylan-Kolchin (2017) Bullock J. S., Boylan-Kolchin M., 2017, ARA&A, 55, 343
- Bunker et al. (2023) Bunker A. J., et al., 2023, A&A, 677, A88
- Carniani et al. (2024) Carniani S., et al., 2024, arXiv:2405.18485 [astro-ph], p. arXiv:2405.18485
- Casey et al. (2024) Casey C. M., et al., 2024, ApJ, 965, 98
- Castellano et al. (2022) Castellano M., et al., 2022, ApJ, 938, L15
- Castellano et al. (2024) Castellano M., et al., 2024, arXiv:2403.10238 [astro-ph], p. arXiv:2403.10238
- Chabrier (2003) Chabrier G., 2003, PASP, 115, 763
- Chworowsky et al. (2023) Chworowsky K., et al., 2023, arXiv:2311.14804 [astro-ph], p. arXiv:2311.14804
- Colín et al. (2013) Colín P., Vázquez-Semadeni E., Gómez G. C., 2013, MNRAS, 435, 1701
- Curti et al. (2024) Curti M., et al., 2024, arXiv:2407.02575 [astro-ph], p. arXiv:2407.02575
- Davé et al. (2001) Davé R., Spergel D. N., Steinhardt P. J., Wandelt B. D., 2001, ApJ, 547, 574
- Dekel et al. (2023) Dekel A., Sarkar K. C., Birnboim Y., Mandelker N., Li Z., 2023, MNRAS, 523, 3201
- Delos & White (2023) Delos M. S., White S. D. M., 2023, MNRAS, 518, 3509
- Denissenkov & Hartwick (2014) Denissenkov P. A., Hartwick F. D. A., 2014, MNRAS, 437, L21
- Diemand et al. (2007) Diemand J., Kuhlen M., Madau P., 2007, ApJ, 667, 859
- Diemer (2018) Diemer B., 2018, ApJS, 239, 35
- Donnan et al. (2024) Donnan C. T., et al., 2024, arXiv:2403.03171 [astro-ph], p. arXiv:2403.03171
- Drakos et al. (2019) Drakos N. E., Taylor J. E., Berrouet A., Robotham A. S. G., Power C., 2019, MNRAS, 487, 1008
- Dressler et al. (2024) Dressler A., et al., 2024, ApJ, 964, 150
- Eisenstein et al. (2023) Eisenstein D. J., et al., 2023, arXiv:2306.02465 [astro-ph], p. arXiv:2306.02465
- Elmegreen (2000) Elmegreen B. G., 2000, ApJ, 530, 277
- Errani et al. (2018) Errani R., Peñarrubia J., Walker M. G., 2018, MNRAS, 481, 5073
- Fall et al. (2010) Fall S. M., Krumholz M. R., Matzner C. D., 2010, ApJ, 710, L142
- Feldmann et al. (2024) Feldmann R., et al., 2024, arXiv:2407.02674 [astro-ph], p. arXiv:2407.02674
- Ferrara et al. (2023) Ferrara A., Pallottini A., Dayal P., 2023, MNRAS, 522, 3986
- Finkelstein et al. (2022) Finkelstein S. L., et al., 2022, ApJ, 940, L55
- Finkelstein et al. (2023) Finkelstein S. L., et al., 2023, ApJ, 946, L13
- Franco et al. (2023) Franco M., et al., 2023, arXiv:2308.00751 [astro-ph], p. arXiv:2308.00751
- Fujimoto et al. (2024) Fujimoto S., et al., 2024, arXiv:2402.18543 [astro-ph], p. arXiv:2402.18543
- Gao et al. (2004) Gao L., Loeb A., Peebles P. J. E., White S. D. M., Jenkins A., 2004, ApJ, 614, 17
- Gao et al. (2012) Gao L., Frenk C. S., Jenkins A., Springel V., White S. D. M., 2012, MNRAS, 419, 1721
- Geen et al. (2017) Geen S., Soler J. D., Hennebelle P., 2017, MNRAS, 471, 4844
- Greene et al. (2023) Greene J. E., et al., 2023, arXiv:2309.05714 [astro-ph], p. arXiv:2309.05714
- Grudić et al. (2018) Grudić M. Y., Hopkins P. F., Faucher-Giguère C.-A., Quataert E., Murray N., Kereš D., 2018, MNRAS, 475, 3511
- Grudić et al. (2020) Grudić M. Y., Boylan-Kolchin M., Faucher-Giguère C.-A., Hopkins P. F., 2020, MNRAS, 496, L127
- Grudić et al. (2021) Grudić M. Y., Kruijssen J. M. D., Faucher-Giguère C.-A., Hopkins P. F., Ma X., Quataert E., Boylan-Kolchin M., 2021, MNRAS, 506, 3239
- Haghi et al. (2020) Haghi H., Safaei G., Zonoozi A. H., Kroupa P., 2020, ApJ, 904, 43
- Harris et al. (2020) Harris C. R., et al., 2020, Nature, 585, 357
- Hills (1980) Hills J. G., 1980, ApJ, 235, 986
- Hopkins et al. (2022) Hopkins P. F., Wellons S., Anglés-Alcázar D., Faucher-Giguère C.-A., Grudić M. Y., 2022, MNRAS, 510, 630
- Hunter (2007) Hunter J. D., 2007, Computing In Science & Engineering, 9, 90
- Inayoshi et al. (2022) Inayoshi K., Harikane Y., Inoue A. K., Li W., Ho L. C., 2022, ApJ, 938, L10
- Ishiyama (2014) Ishiyama T., 2014, ApJ, 788, 27
- Ishiyama et al. (2021) Ishiyama T., et al., 2021, MNRAS, 506, 4210
- Kazantzidis et al. (2006) Kazantzidis S., Zentner A. R., Kravtsov A. V., 2006, ApJ, 641, 647
- Kennicutt (1998) Kennicutt Robert C. J., 1998, ApJ, 498, 541
- Kim et al. (2018) Kim J.-G., Kim W.-T., Ostriker E. C., 2018, ApJ, 859, 68
- Kruijssen et al. (2019) Kruijssen J. M. D., et al., 2019, Nature, 569, 519
- Krumholz et al. (2019) Krumholz M. R., McKee C. F., Bland-Hawthorn J., 2019, ARA&A, 57, 227
- Labbé et al. (2023) Labbé I., et al., 2023, Nature, 616, 266
- Li et al. (2019) Li H., Vogelsberger M., Marinacci F., Gnedin O. Y., 2019, MNRAS, 487, 364
- Li et al. (2023) Li Z., Dekel A., Sarkar K. C., Aung H., Giavalisco M., Mandelker N., Tacchella S., 2023, arXiv:2311.14662 [astro-ph], p. arXiv:2311.14662
- Loeb & Peebles (2003) Loeb A., Peebles P. J. E., 2003, ApJ, 589, 29
- Lu et al. (2024) Lu S., Frenk C. S., Bose S., Lacey C. G., Cole S., Baugh C. M., Helly J. C., 2024, arXiv:2406.02672 [astro-ph], p. arXiv:2406.02672
- Madau & Dickinson (2014) Madau P., Dickinson M., 2014, ARA&A, 52, 415
- Mason et al. (2023) Mason C. A., Trenti M., Treu T., 2023, MNRAS, 521, 497
- Menon et al. (2024) Menon S. H., Lancaster L., Burkhart B., Somerville R. S., Dekel A., Krumholz M. R., 2024, ApJ, 967, L28
- Mirocha & Furlanetto (2023) Mirocha J., Furlanetto S. R., 2023, MNRAS, 519, 843
- Murray (2014) Murray S., 2014, HMF: Halo Mass Function calculator, Astrophysics Source Code Library, record ascl:1412.006 (ascl:1412.006)
- Murray et al. (2010) Murray N., Quataert E., Thompson T. A., 2010, ApJ, 709, 191
- Murray et al. (2013) Murray S. G., Power C., Robotham A. S. G., 2013, Astronomy and Computing, 3, 23
- Naidu et al. (2022) Naidu R. P., et al., 2022, ApJ, 940, L14
- Navarro et al. (1996) Navarro J. F., Frenk C. S., White S. D. M., 1996, ApJ, 462, 563
- Navarro et al. (1997) Navarro J. F., Frenk C. S., White S. D. M., 1997, ApJ, 490, 493
- Navarro et al. (2017) Navarro J. F., Benítez-Llambay A., Fattahi A., Frenk C. S., Ludlow A. D., Oman K. A., Schaller M., Theuns T., 2017, MNRAS, 471, 1841
- Nusser (2024) Nusser A., 2024, arXiv:2402.18942 [astro-ph], p. arXiv:2402.18942
- Oesch et al. (2016) Oesch P. A., et al., 2016, ApJ, 819, 129
- Pérez & Granger (2007) Pérez F., Granger B. E., 2007, Computing in Science and Engineering, 9, 21
- Pérez-González et al. (2023) Pérez-González P. G., et al., 2023, ApJ, 951, L1
- Planck Collaboration et al. (2020) Planck Collaboration et al., 2020, A&A, 641, A6
- Polak et al. (2023) Polak B., et al., 2023, arXiv:2312.06509 [astro-ph], p. arXiv:2312.06509
- Power et al. (2003) Power C., Navarro J. F., Jenkins A., Frenk C. S., White S. D. M., Springel V., Stadel J., Quinn T., 2003, MNRAS, 338, 14
- Prada et al. (2023) Prada F., Behroozi P., Ishiyama T., Klypin A., Pérez E., 2023, arXiv:2304.11911 [astro-ph], p. arXiv:2304.11911
- Salpeter (1955) Salpeter E. E., 1955, ApJ, 121, 161
- Shen et al. (2023) Shen X., Vogelsberger M., Boylan-Kolchin M., Tacchella S., Kannan R., 2023, MNRAS, 525, 3254
- Shen et al. (2024) Shen X., Vogelsberger M., Boylan-Kolchin M., Tacchella S., Naidu R. P., 2024, arXiv:2406.15548 [astro-ph], p. arXiv:2406.15548
- Spergel & Steinhardt (2000) Spergel D. N., Steinhardt P. J., 2000, Phys. Rev. Lett., 84, 3760
- Steinhardt et al. (2016) Steinhardt C. L., Capak P., Masters D., Speagle J. S., 2016, ApJ, 824, 21
- Steinhardt et al. (2023) Steinhardt C. L., Kokorev V., Rusakov V., Garcia E., Sneppen A., 2023, ApJ, 951, L40
- Tacchella et al. (2023) Tacchella S., et al., 2023, ApJ, 952, 74
- Tulin & Yu (2018) Tulin S., Yu H.-B., 2018, Phys. Rep., 730, 1
- Virtanen et al. (2020) Virtanen P., et al., 2020, Nature Methods, 17, 261
- Wang et al. (2024) Wang B., et al., 2024, ApJ, 969, L13
- Yung et al. (2024) Yung L. Y. A., Somerville R. S., Nguyen T., Behroozi P., Modi C., Gardner J. P., 2024, MNRAS, 530, 4868
- van Dokkum & Conroy (2024) van Dokkum P., Conroy C., 2024, arXiv:2407.06281 [astro-ph], p. arXiv:2407.06281
- van den Bosch & Ogiya (2018) van den Bosch F. C., Ogiya G., 2018, MNRAS, 475, 4066