Deep Causal Learning to Explain and Quantify The Geo-Tension’s Impact on Natural Gas Market
Abstract
Natural gas demand is a crucial factor for predicting natural gas prices and thus has a direct influence on the power system. However, existing methods face challenges in assessing the impact of shocks, such as the outbreak of the Russian-Ukrainian war. In this context, we apply deep neural network-based Granger causality to identify important drivers of natural gas demand. Furthermore, the resulting dependencies are used to construct a counterfactual case without the outbreak of the war, providing a quantifiable estimate of the overall effect of the shock on various German energy sectors. The code and dataset are available at https://github.com/bonaldli/CausalEnergy.
Index Terms:
natural gas demand, deep learning, Granger causality, counterfactual analysisI Introduction
The Russia-Ukraine conflict has introduced significant uncertainties in the German and European natural gas markets. Understanding the causal elements behind demand fluctuations and accurately quantifying the conflict’s impact is crucial for future energy planning and strategy. It is intuitive to formulate such a task as a prediction problem, i.e., the predict the post-conflict energy price. Traditionally, forecasting in this area leaned heavily on linear regression models, time series methods, and other statistical techniques [9]. While these conventional methodologies can have their strengths, they often exhibit limitations, especially when dealing with non-linear relationships (especially non-stationarity from the conflict) and multiple influencing factors simultaneously. Recently, deep learning models have excelled in analyzing vast amounts of information efficiently, capturing nonlinear relationships, and unearthing patterns and correlations that might be missed by traditional statistical methods [29]. Beyond prediction, another more important topic will be analyzing whether and how much the conflict has impacted the energy market. Causal analysis offers a foundational framework to answer such a question. Applying these two approaches in combination can be especially valuable. In this line of thought, the following two research questions are investigated:
RQ1: Generally, which factors can best describe the patterns of various German energy sectors (including residential, industrial, and gas power plant) so that, ideally, we could use them for better prediction?
RQ2: How does the war affect German energy sectors differently, and is it possible to explain and even quantify these impacts in the long run?
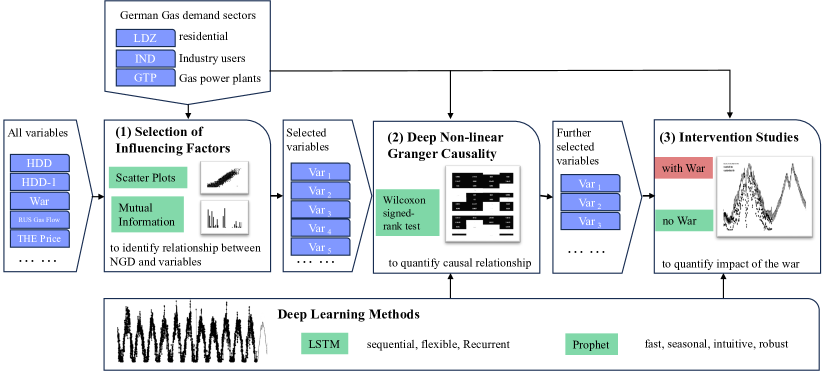
To address these challenges, this paper adopts a three-pronged approach, with an overview in Fig. 1. Firstly, the different sets of data are investigated based on mutual information, to tailor different selection of factors for different sector. Then, non-linear Granger causality tests [10] are applied based on long-short-term memory (LSTM)networks [13], to identify which factors exhibit a strong influence. Thirdly, an LSTM and a prophet network [42] based prediction is generated as a counterfactual scenario for the war period to estimate the effect of the war on natural gas demand.
This paper offers three main contributions to the extant research on forecasting energy demand. First, it proposes a simple and accurate prediction model using deep learning tools for the natural gas demand that is facing unprecedented issues in Germany. Second, the study reveals and quantifies the causal effect of war on future natural gas demand, including residential, industrial, and gas power plant sectors in Germany. Finally, when there are significant shocks to the system, like wars or other unexpected events, the proposed models can be swiftly adapted to different natural gas demand forecasting areas based on the updated information.
The rest of the paper is organized as follows. Section II reviews earlier research on forecasting methods of energy demand. Section III introduces the research approach. Section IV shows the results, including the selection of influencing factors, nonlinear Granger causality analysis, and intervention studies regarding the effect of war on German natural gas demand across different sectors. Section V gives the conclusion.
II Related Work
II-A Prediction Methods for Natural Gas Demand
There has been abundant research in time series prediction based on various techniques such as statistical models [14], tensor [19, 43, 22, 20, 37, 47, 49, 23, 24, 21], deep learning [6, 46, 11], contrastive learning[33, 31, 44, 18], and Large Language Models (LLMs) [27, 26, 48]. It is challenging to forecast natural gas demand (NGD)due to the complex interplay of long-term trends, short-term seasonality, and uncertainties. Existing machine learning works utilize a structure-calibrated support vector regression (SVR) [3], ANN [40] or long-short-term memory (LSTM)Networks [1] to forecast natural gas consumption. In [8], they integrated deep learning techniques to demonstrate their superior forecasting capabilities for energy output. Their study found that a hybrid model based on LSTM networks achieved higher prediction accuracy than conventional ANN models like standard MLP and other physical forecasting models. This is also supported in [45]. A more extended comparison finds that LSTM is superior to ARIMA, exponential smoothing, SVM, ANN, and recurrent neural network [1, 30]. A novel approach is Prophet, an open-source algorithm developed by Facebook in 2017, which has been utilized in electricity price forecast [38]. A comparison study on monthly peak energy demand found this algorithm to perform best among SARIMA, LSTM, RNN and Prophet [5]. In particular for the longer time windows, Prophet has been found to perform well [42].
II-B Impact of the Russia-Ukraine war on Natural Gas Demand
A couple of research studies have been conducted to reckon the impact of the Russia-Ukraine war on Germany’s future natural gas demand NGD across different sectors. In [2], the economic effects of a potential cut-off of Russian energy imports on the German economy are discussed. [12] delve into the intricate dynamics of the natural gas crisis gripping Europe with a special focus on the German unique role, discussing strategies for mitigating the gas supply shortage. [36] applies time series models to forecast daily household demand, industrial demand with regards to gas-intensive production, and gas demand resulting from electricity generation of gas plants in Germany without explicitly assessing the impact of the Russia-Ukraine war on the model. [34] examines the effects of the energy crisis on German NGD using an econometric model and found that gas consumption reductions were more pronounced in the industrial than the household sector. In contrast to this, our work is the first one to explicitly investigate the dependencies between various factors, including the war, and the natural gas demand, based on causal learning [16, 25, 17]. It realizes this by including non-linear granger causality tests, which are not broadly applied yet.
III Methodology
III-A Research Approach
Three sectors of gas consumption will be considered separately, namely residential gas demand (LDZ), industrial gas demand (IND)and gas to power generation demand (GTP), which we believe will be affected by the conflict differently due to their nature. The aggregated natural gas demand is denoted as NGD. For example, LDZ represents domestic and small commercial consumers, which has been found to be more influenced by temperature and holidays [28]. IND is likely correlated with economic indicators. GTP will likely depend strongly on the overall gas supply. As shown in Fig. 1, the process begins with selecting influencing factors that are determined through exploratory data analysis and mutual information analysis [15]. The subsequent step involves applying deep learning in non-linear Granger-Causality tests to determine if the selected factors can indeed predict changes in (NGD). These tests validate the capacity of selected predictors to provide a reliable forecast of NGD and ensure that only the most relevant predictors are included in the model. Finally, the refined data are incorporated into the deep learning intervention studies to forecast NGD in the context of the post-war scenario in Germany.

III-B Data Sources and Definition
The aggregated NGD data were retrieved from Bruegel, Bundesnetzagentur, and Trading Hub Europe, covering the period from April 2010 to July 2023. The factors for predicting gas demand are defined based on previous research. One part of the prediction is the previous gas demand. For temporal effects, the month and holidays are included into the predictive model. In addition, German natural gas consumption strongly depends on temperature [35]. Heating degree days (HDD) is a versatile measure of cold weather duration and severity in 24 hours compared to a base temperature, allowing for weather-based analysis of natural gas consumption [32]. In addition to a contemporary influence, the previous day’s can also influence today’s demand due to heating system dynamics and user behaviors [7]. To control for the Russian-Ukraine’s impact on NGD, a ‘War’ dummy variable is instituted, with the February 24, 2022 as anchor. Next, the various gas supply sources are included, as well as the gas storage levels. Disruptions in supply can influence future demand, especially if there are pipeline outages or if users anticipate further supply issues [4]. Important outside predictors are the gas price, which can incorporate information unknown to the model, and industry production, which is another large consumer of gas in Germany. In systems where natural gas is used as a backup or supplementary source to renewable generation, the output from other energy sources can influence gas demand. To incorporate this, renewable energy production is also included in the model. In addition to that, cross country effects could play a role, especially to France, which had issues in its nuclear production capability. Thus, the french nuclear energy production is also included in the model.
IV Implementation and Results
IV-A Data Exploration and Mutual Information Analysis
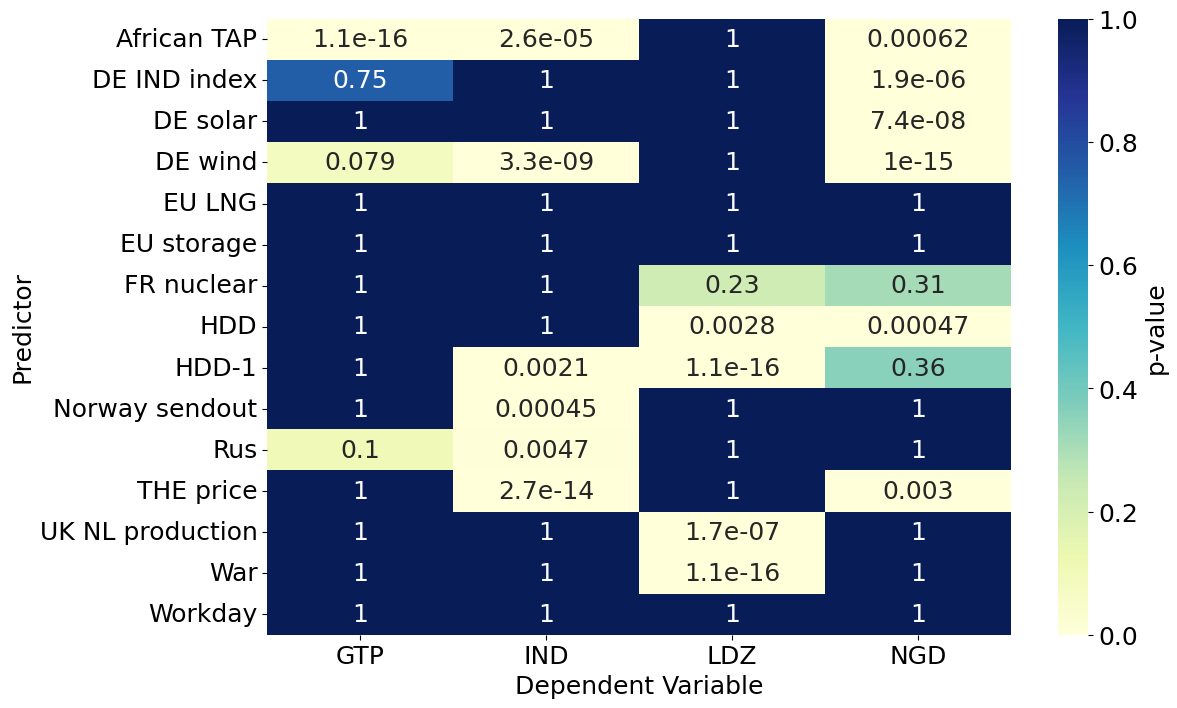
In the dataset, a number of dependencies are found. As shown in Fig. 2(a), a pronounced linear relation between NGD and HDD suggests that colder temperatures elevate gas demand. This trend is consistent even when considering lagged HDD, reinforcing the direct linear relationship between temperature and gas demand. For the other variables, no linear relationship is found. Fig. 2(b) provides a quantitative overview by mutual information analysis of the significant determinants influencing gas demand across various sectors. For aggregated demand (NGD), the primary driving forces are HDD, lagged 1 HDD (HDD-1), Russian gas flow into Europe (RUS), Workday patterns, and monthly variations. This is further supplemented by geopolitical events (War), as well as the production of renewable energy sources such as German wind energy and German solar energy. The LDZ sector is broadly influenced by similar factors but has an added emphasis on French nuclear power production. IND sector gas demand showcases a blend of climatic conditions (HDD, HDD-1), natural gas origins (Rus, UK NL Production), and THE Price, alongside renewable energy inputs. Meanwhile, the GTP sector is majorly swayed by most of the influencing factors, ranging from monthly fluctuations in geopolitical events to a set of renewable energy sources and pricing mechanics. The selection of influencing factors on German NGD summarized below would capture approximately 90% quantile of mutual information in each sector. The geopolitical event (the War) and natural gas import dynamics (Rus) have been included in each sector to intricate interplay of geopolitical events in shaping the gas demand landscape across these sectors.
IV-B Nonlinear Granger Causality
Granger causality is the popular choice to examine the causal relations among time-series. Standard approaches to Granger causality detection commonly assume linear dynamics, due to the nonlinearity, we adopted a non-linear Granger causality test based on LSTM to analyze the dependencies of gas demands. The key idea of Granger causality is: a time series is said to be Granger-cause of another time series if past values of provide significant information about the future values of beyond what is already provided by the past values of itself. Thus, a statistical test will be conducted by comparing the following two:
| (1) |
where for example, our is each energy demand (GTP to NGD), is the each predictor in Fig. 3, the are the other control variables for prediction, is the lag length, is the error, and is the one-step prediction model, i.e., LSTM.
Since LSTM may not follow the assumed F-distribution, the Wilcoxon signed-rank test, a non-parametric test, is used to compare the two [39]. The -values are shown in Fig. 3: While HDD only appears to have a significant non-linear Granger causal relationship with LDZ demand, HDD-1 shows notable nonlinear Granger causality with IND as well as LDZ. The gas price only has a direct influence on the industrial gas demand IND. Besides, a large proportion of predictors like EU storage, EU LNG, and Workday consistently show -values gravitate towards or equal 1 across all NGD sectors which indicates an absence of non-linear Granger causality. These findings highlight the need to identify other key factors that can strongly predict outcomes in future research studies. Additionally, the predictor War exhibits a significant non-linear Granger causality with LDZ, with an extremely small -values of 1.1.
We also use Prophet as a base model, i.e., . Due to space limits, we only conclude the common insights: for example, IND gas demand depends on DE wind and THE price. LDZ depends on HDD-1 and UK NL production, and the overall NGD depends on DE index, DE wind, and HDD.
IV-C Counterfactual Intervention Studies
To explore the effect of the war on natural gas demand, a counterfactual intervention study is conducted. As a baseline, a prediction is taken without the data from the onset of the war, comparing it to the actual development.
| (2) |
where is all the other predicting factors except the war dummy variable, and is the -step prediction model, and we used both LSTM and Prophet. To predict the case without war, only training data (without the war dummy variable) before the is used, but a multi-step prediction is needed, with steps. Otherwise, to predict the war case, all the historical data can be used, and additionally with a war dummy .
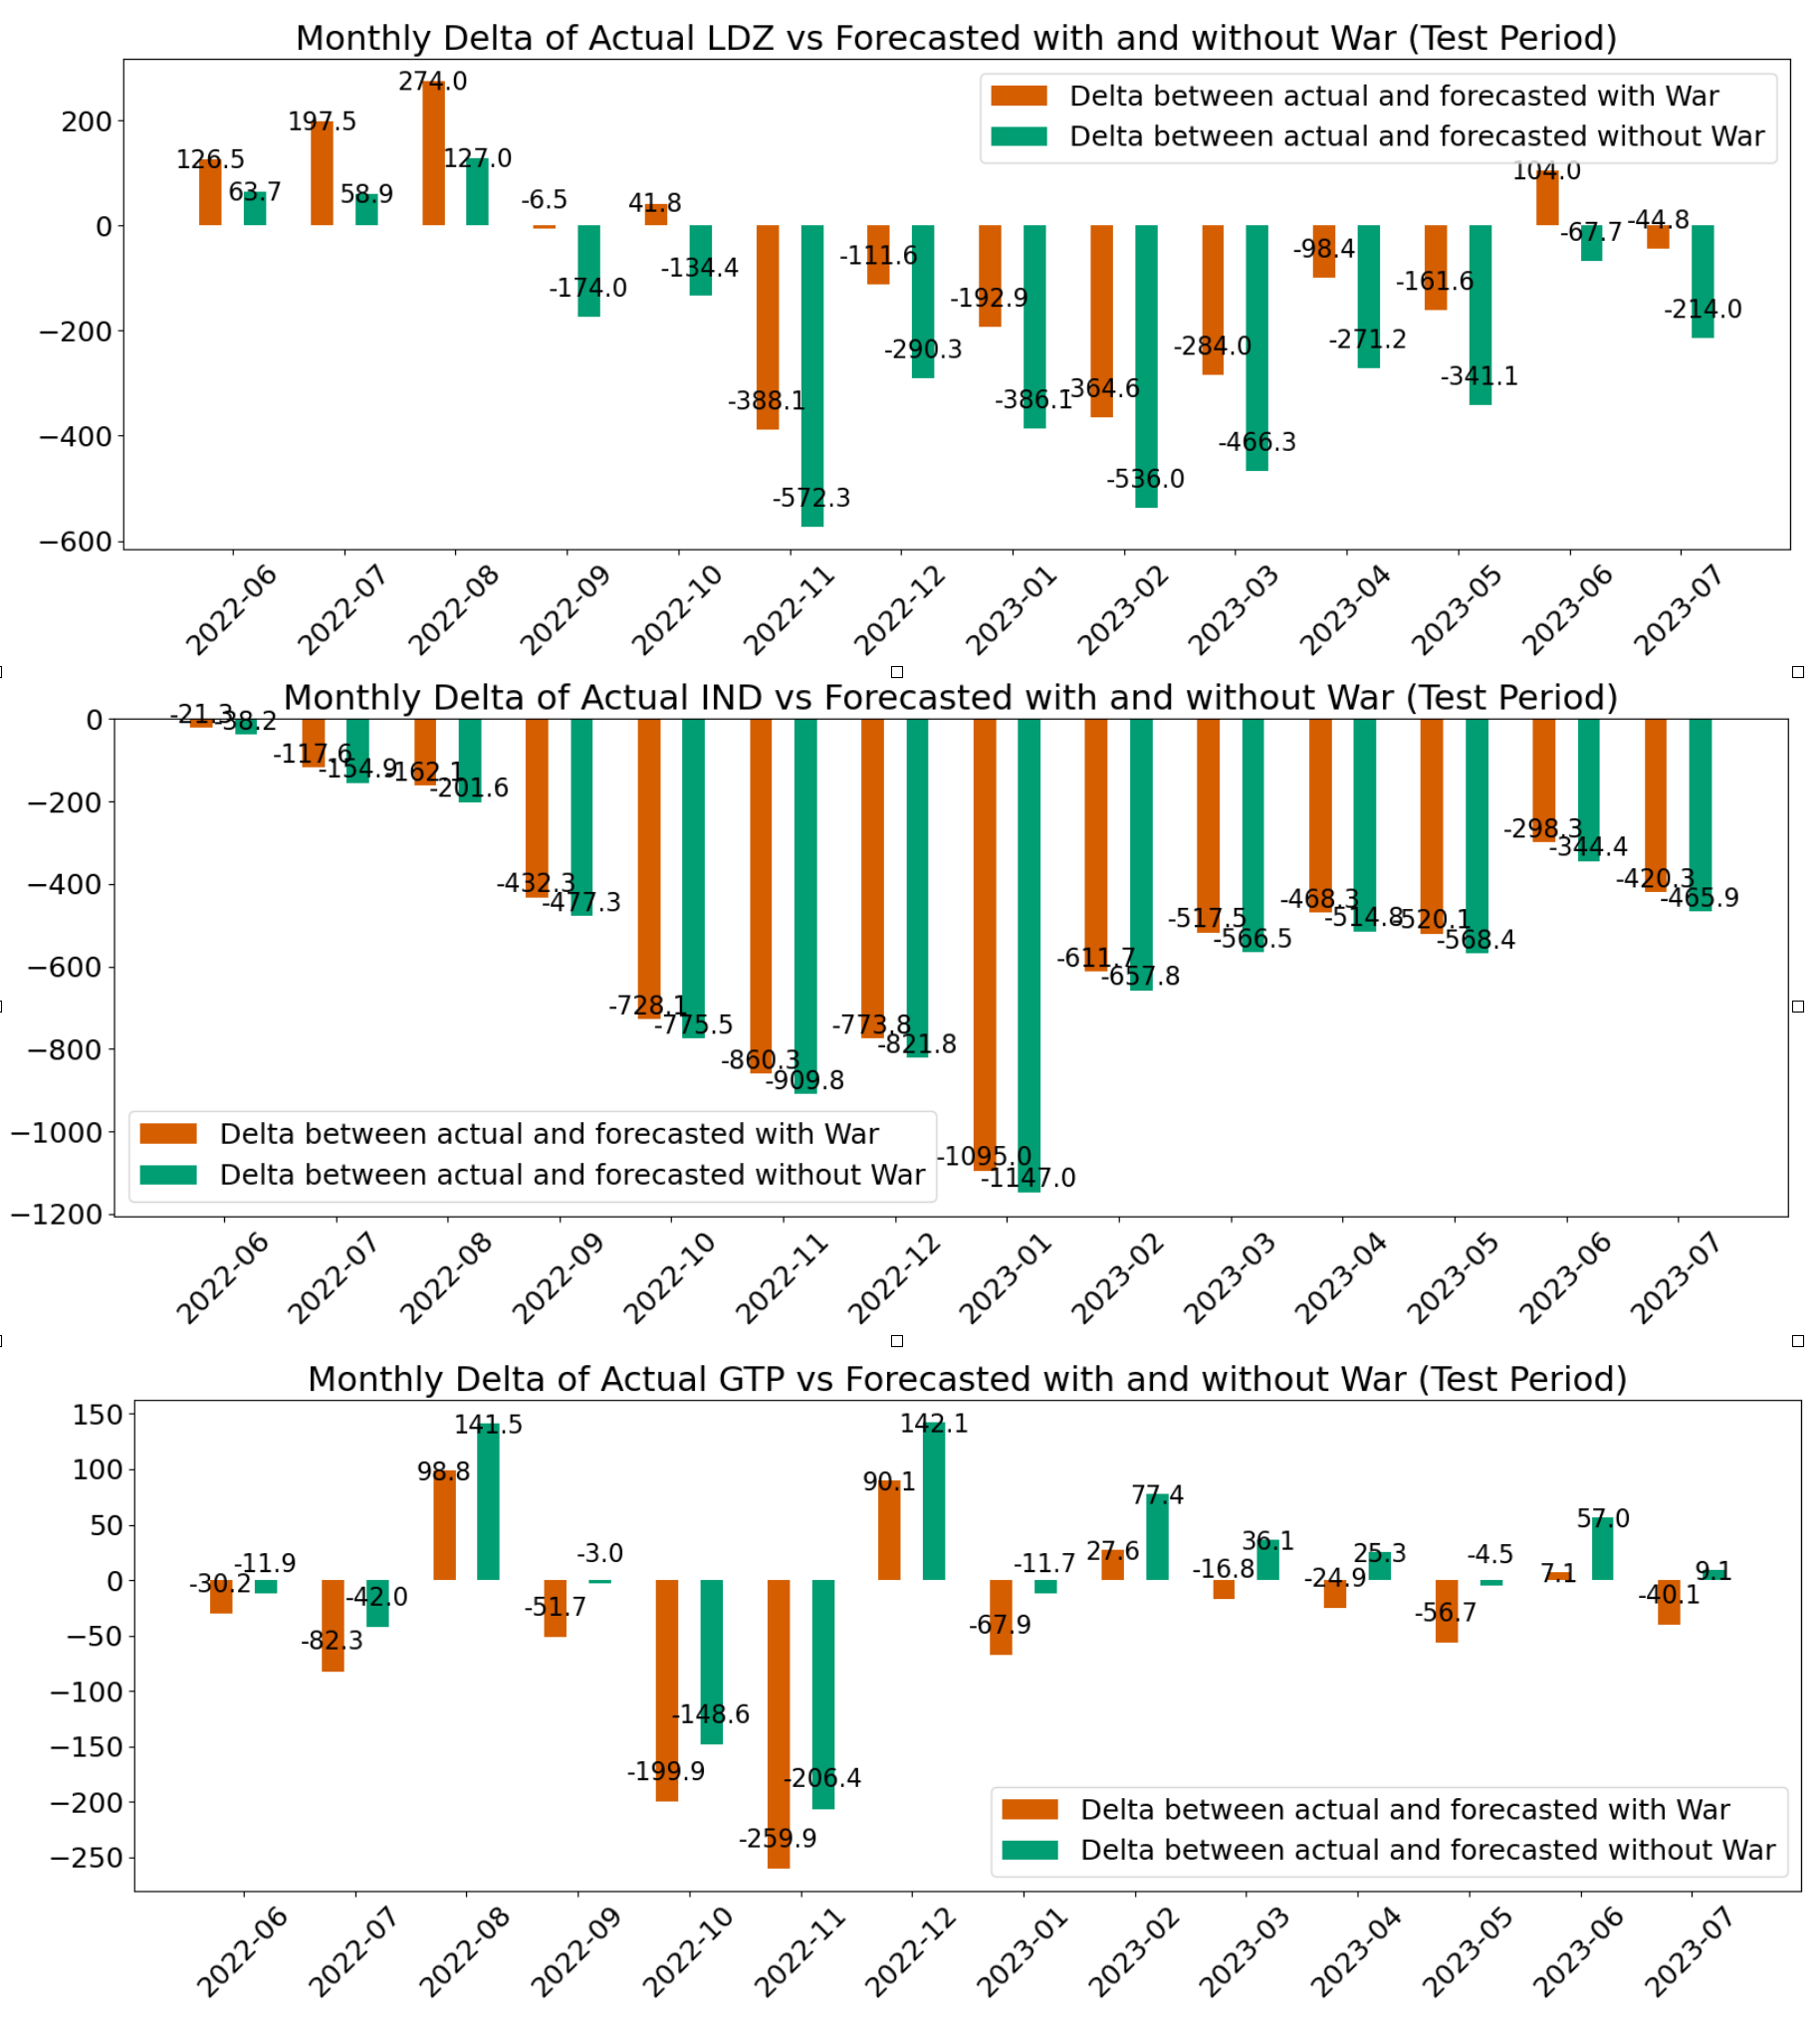
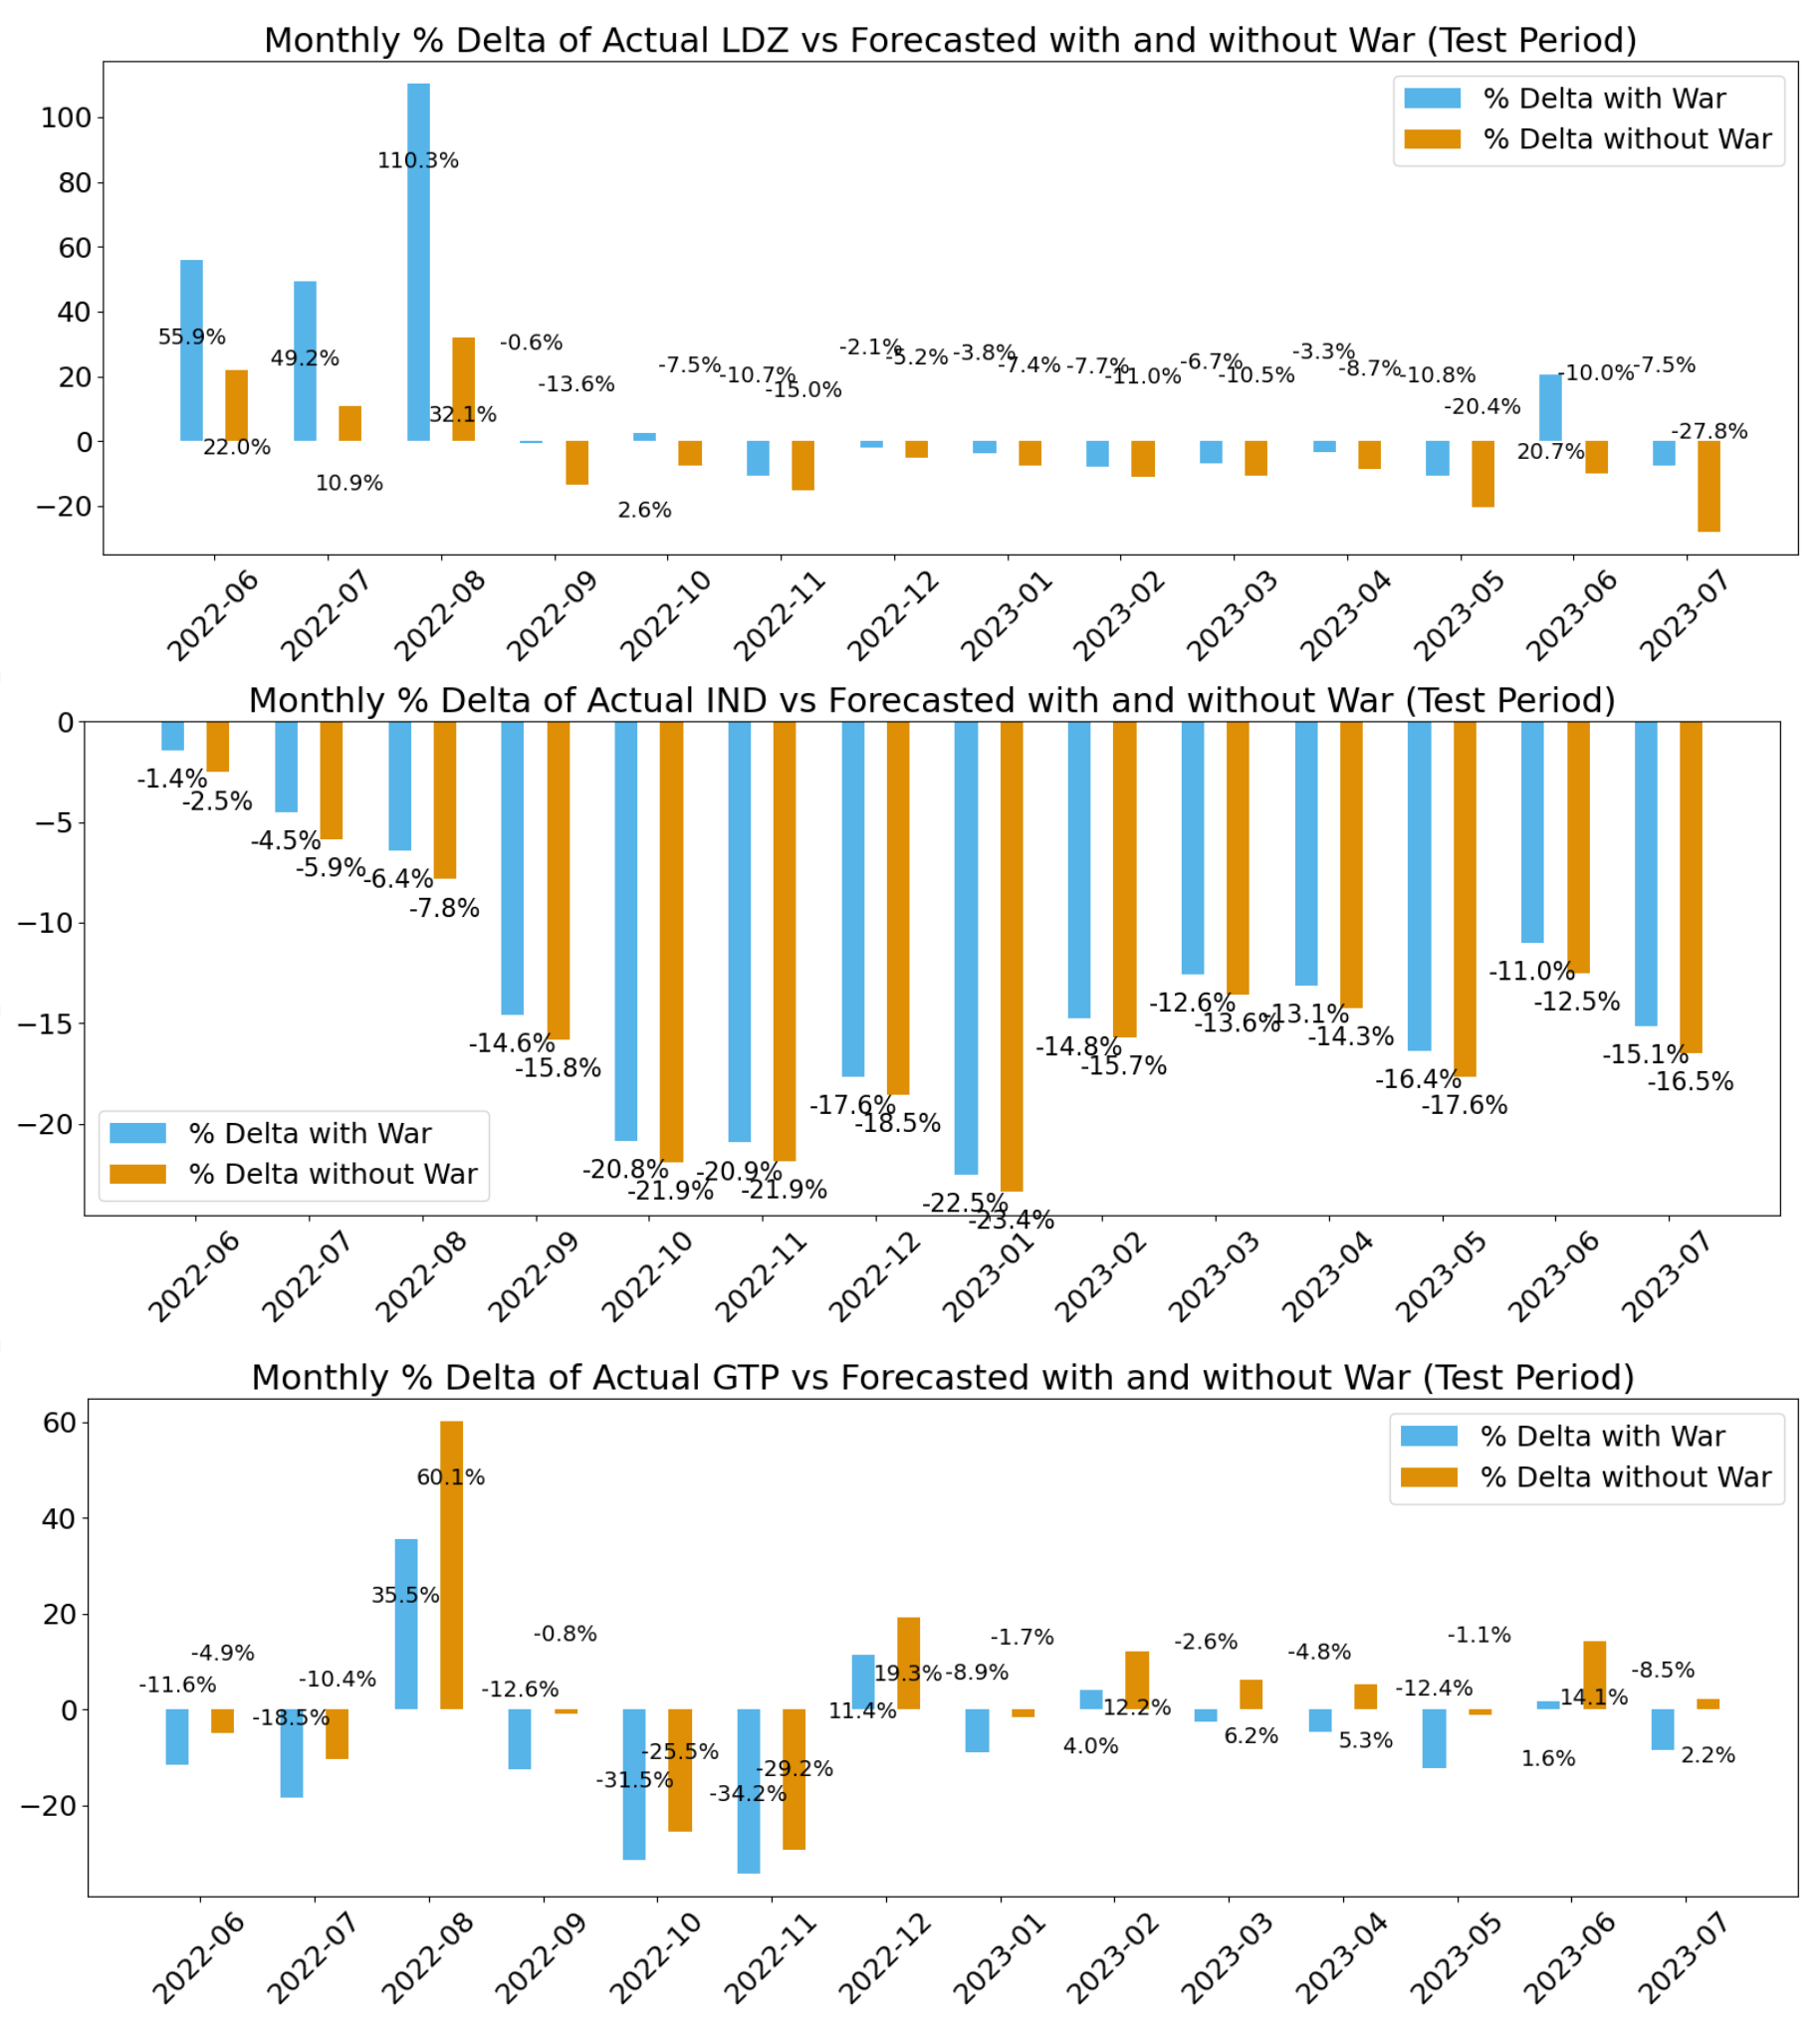
Fig. 4 presents sector-specific impacts in million cubic meters (mcm) per day of the intervention Russia-Ukraine War on German NGD. Fig. 5 expresses deltas as percentages, meaning the relative deviation of forecasts from actual NGD.
In the LDZ sector, the model without war shows a greater deviation from actual data than the model considering war, suggesting that war’s impact was significant enough to be a determining factor in forecasting accuracy. The variation in delta values for the LDZ sector indicates the impact of the war does not have a consistent pattern over the long term. Without considering the war dummy, the forecasted LDZ seems closer to the actual data initially. From September 2022 onwards, the forecast considering the war aligns more closely with the actual LDZ as time progresses, which suggests an increasing impact of the war on this sector.
In the IND sector, the impact of war appears to be more pronounced and consistent as the forecast demands incorporating the war are consistently closer to the actual figures. This indicates that the war had an immediate and substantial effect on IND sector and seems stable over time. Since the deltas in the IND sector are less volatile but consistently negative, the intervention led to a systematic decrease in NGD compared to what was forecasted.
In the GTP sector, the high deltas in the initial months suggest an immediate impact of the war. However, the subsequent reduction and fluctuating deltas could imply that the obvious effects of the war diminish and become less predictable over time. The GTP sector’s response to the intervention fluctuates, suggesting that the impact does not maintain a consistent pattern over time and is influenced by additional factors beyond the war.
In summary, the impact of the Russia-Ukraine war as an intervention varies across German gas sectors. The LDZ and GTP sectors exhibited immediate responses with subsequent fluctuations, while the IND sector showed a consistent trend and suggests a prolonged impact. The attribution of these effects to the intervention is most evident where the forecasts considering the war show distinct deviations from actual data, particularly in the early months of the intervention. Over the longer term, the persistence of these effects appears to be sector-dependent with sustained trends in IND sector and more complex and unstable in GTP sector.
V Discussion and Conclusion
The purpose of this paper is to integrate deep learning models within a causal analysis framework to evaluate the impact of the Russia-Ukraine conflict on German natural gas demand. The impact of the war on German natural gas demand is heterogeneously distributed across different gas sectors. The intervention study, constructing a counterfactual predicted time series hints at the capabilities could be derived from applying this approach in a broader scope. Even though the effect found here is rather small, it shows promising results in uncovering the causal effect of shocks using predictive methods.
We acknowledge the limitation in long-term forecasting accuracy since the prediction error will accumulate [41]. Despite this limitation, the adaptability of deep learning models remains as a strong asset to navigate and understand complex energy demand dynamics in times of geopolitical uncertainty.
References
- [1] Athanasios Anagnostis, Elpiniki Papageorgiou, Vasileios Dafopoulos, and Dionysios Bochtis. Applying long short-term memory networks for natural gas demand prediction. In 2019 10th International Conference on Information, Intelligence, Systems and Applications (IISA), pages 1–7. IEEE, 2019.
- [2] Ruediger Bachmann, David Baqaee, Christian Bayer, Moritz Kuhn, Andreas Löschel, Benjamin Moll, Andreas Peichl, Karen Pittel, and Moritz Schularick. What if? the economic effects for germany of a stop of energy imports from russia. Technical report, ECONtribute Policy Brief, 2022.
- [3] Yun Bai and Chuan Li. Daily natural gas consumption forecasting based on a structure-calibrated support vector regression approach. Energy and Buildings, 127:571–579, 2016.
- [4] Eva M Berger, Sylwia Bialek, Niklas Garnadt, Veronika Grimm, Leonard Salzmann, Monika Schnitzer, Achim Truger, Volker Wieland, et al. A potential sudden stop of energy imports from russia: Effects on energy security and economic output in germany and the eu. Technical report, IMFS Working Paper Series, 2022.
- [5] Shobhit Chaturvedi, Elangovan Rajasekar, Sukumar Natarajan, and Nick McCullen. A comparative assessment of sarima, lstm rnn and fb prophet models to forecast total and peak monthly energy demand for india. Energy Policy, 168:113097, 2022.
- [6] Yirong Chen, Ziyue Li, Wanli Ouyang, and Michael Lepech. Adaptive hierarchical spatiotemporal network for traffic forecasting. In 2023 IEEE 19th International Conference on Automation Science and Engineering (CASE), pages 1–6. IEEE, 2023.
- [7] Ömer Fahrettin Demirel, Selim Zaim, Ahmet Çalişkan, and Pinar Özuyar. Forecasting natural gas consumption in istanbul using neural networks and multivariate time series methods. Turkish Journal of Electrical Engineering and Computer Sciences, 20(5):695–711, 2012.
- [8] André Gensler, Janosch Henze, Bernhard Sick, and Nils Raabe. Deep learning for solar power forecasting—an approach using autoencoder and lstm neural networks. In 2016 IEEE international conference on systems, man, and cybernetics (SMC), pages 002858–002865. IEEE, 2016.
- [9] Fatma B Gorucu. Evaluation and forecasting of gas consumption by statistical analysis. Energy Sources, 26(3):267–276, 2004.
- [10] Clive WJ Granger. Investigating causal relations by econometric models and cross-spectral methods. Econometrica: journal of the Econometric Society, pages 424–438, 1969.
- [11] Pengxin Guo, Pengrong Jin, Ziyue Li, Lei Bai, and Yu Zhang. Online test-time adaptation of spatial-temporal traffic flow forecasting. arXiv preprint arXiv:2401.04148, 2024.
- [12] Christoph Halser and Florentina Paraschiv. Pathways to overcoming natural gas dependency on russia—the german case. Energies, 15(14):4939, 2022.
- [13] Sepp Hochreiter, Jürgen Schmidhuber, et al. Long short-term memory [j]. Neural computation, 9(8):1735–1780, 1997.
- [14] Min Jiang, Andi Wang, Ziyue Li, and Fugee Tsung. A unified probabilistic framework for spatiotemporal passenger crowdedness inference within urban rail transit network. In 2023 IEEE 19th International Conference on Automation Science and Engineering (CASE), pages 1–8. IEEE, 2023.
- [15] Alexander Kraskov, Harald Stögbauer, and Peter Grassberger. Estimating mutual information. Physical review E, 69(6):066138, 2004.
- [16] Tian Lan, Ziyue Li, Zhishuai Li, Lei Bai, Man Li, Fugee Tsung, Wolfgang Ketter, Rui Zhao, and Chen Zhang. Mm-dag: Multi-task dag learning for multi-modal data–with application for traffic congestion analysis. In SIGKDD 2023: Proceedings of the 29th ACM SIGKDD Conference on Knowledge Discovery and Data Mining, pages 1188–1199, 2023.
- [17] Tian Lan, Ziyue Li, Junpeng Lin, Zhishuai Li, Lei Bai, Man Li, Fugee Tsung, Rui Zhao, and Chen Zhang. Multifun-dag: Multivariate functional directed acyclic graph. arXiv preprint arXiv:2404.13836, 2024.
- [18] Zhishuai Li, Yunhao Nie, Ziyue Li, Lei Bai, Yisheng Lv, and Rui Zhao. Non-neighbors also matter to kriging: A new contrastive-prototypical learning. In AISTATS 2024: Proceedings of The 27th International Conference on Artificial Intelligence and Statistics, 2024.
- [19] Ziyue Li, Nurettin Dorukhan Sergin, Hao Yan, Chen Zhang, and Fugee Tsung. Tensor completion for weakly-dependent data on graph for metro passenger flow prediction. In AAAI 2024:, volume 34, pages 4804–4810. AAAI Technical Track: Machine Learning, 2020.
- [20] Ziyue Li, Hao Yan, Fugee Tsung, and Ke Zhang. Profile decomposition based hybrid transfer learning for cold-start data anomaly detection. ACM Transactions on Knowledge Discovery from Data (TKDD), 16(6):1–28, 2022.
- [21] Ziyue Li, Hao Yan, Chen Zhang, Lijun Sun, Wolfgang Ketter, and Fugee Tsung. Choose a table: Tensor dirichlet process multinomial mixture model with graphs for passenger trajectory clustering. arXiv preprint arXiv:2310.20224, 2023.
- [22] Ziyue Li, Hao Yan, Chen Zhang, and Fugee Tsung. Long-short term spatiotemporal tensor prediction for passenger flow profile. IEEE Robotics and Automation Letters, 5(4):5010–5017, 2020.
- [23] Ziyue Li, Hao Yan, Chen Zhang, and Fugee Tsung. Individualized passenger travel pattern multi-clustering based on graph regularized tensor latent dirichlet allocation. Data Mining and Knowledge Discovery, 36(4):1247–1278, 2022.
- [24] Ziyue Li, Hao Yan, Chen Zhang, Andi Wang, Wolfgang Ketter, Lijun Sun, and Fugee Tsung. Tensor dirichlet process multinomial mixture model for passenger trajectory clustering. arXiv preprint arXiv:2306.13794, 2023.
- [25] Junpeng Lin, Ziyue Li, Zhishuai Li, Lei Bai, Zhao Rui, and Chen Zhang. Dynamic causal graph convolutional network for traffic prediction. In 2023 IEEE 19th International Conference on Automation Science and Engineering (CASE), pages 1–8. IEEE, 2023.
- [26] Chenxi Liu, Qianxiong Xu, Hao Miao, Sun Yang, Lingzheng Zhang, Cheng Long, Ziyue Li, and Rui Zhao. Timecma: Towards llm-empowered time series forecasting via cross-modality alignment. arXiv preprint arXiv:2406.01638, 2024.
- [27] Chenxi Liu, Sun Yang, Qianxiong Xu, Zhishuai Li, Cheng Long, Ziyue Li, and Rui Zhao. Spatial-temporal large language model for traffic prediction. In IEEE MDM 2024: The 25th IEEE International Conference on Mobile Data Management, 2024.
- [28] Guixian Liu, Xiucheng Dong, Qingzhe Jiang, Cong Dong, and Jiaman Li. Natural gas consumption of urban households in china and corresponding influencing factors. Energy Policy, 122:17–26, 2018.
- [29] Jinyuan Liu, Shouxi Wang, Nan Wei, Xi Chen, Hanyu Xie, and Jie Wang. Natural gas consumption forecasting: A discussion on forecasting history and future challenges. Journal of Natural Gas Science and Engineering, 90:103930, 2021.
- [30] Jinyuan Liu, Shouxi Wang, Nan Wei, Yi Yang, Yihao Lv, Xu Wang, and Fanhua Zeng. An enhancement method based on long short-term memory neural network for short-term natural gas consumption forecasting. Energies, 16(3):1295, 2023.
- [31] Zhenyu Mao, Ziyue Li, Dedong Li, Lei Bai, and Rui Zhao. Jointly contrastive representation learning on road network and trajectory. In CIKM 2022: Proceedings of the 31st ACM International Conference on Information & Knowledge Management, pages 1501–1510, 2022.
- [32] Qinglong Meng, Yuan Xi, Xingxing Zhang, Monjur Mourshed, and Yue Hui. Evaluating multiple parameters dependency of base temperature for heating degree-days in building energy prediction. In Building Simulation, volume 14, pages 969–985. Springer, 2021.
- [33] Hui Ruan, Qingyuan Gong, Yang Chen, Jiong Chen, Ziyue Li, and Xiang Su. A privacy-preserving heart rate prediction system for drivers in connected vehicles. In Proceedings of the 21st Annual International Conference on Mobile Systems, Applications and Services, pages 557–558, 2023.
- [34] Oliver Ruhnau, Clemens Stiewe, Jarusch Muessel, and Lion Hirth. Natural gas savings in germany during the 2022 energy crisis. Nature Energy, pages 1–8, 2023.
- [35] VN Rusev, GV Abramkin, and EK Muravyova. Multiple regression model for gas consumption in germany. In IOP Conference Series: Earth and Environmental Science, volume 808, page 012033. IOP Publishing, 2021.
- [36] Johann-Friedrich Salzmann, Danial Riaz, and Finn Krueger. Predicting natural gas demand in germany.
- [37] Dorukhan Sergin Nurretin, Jiuyun Hu, Ziyue Li, Chen Zhang, Fugee Tsung, and Hao Yan. Low-rank robust subspace tensor clustering for metro passenger flow modeling. INFORMS Journal on Data Science, 2024.
- [38] Stefano Frizzo Stefenon, Laio Oriel Seman, Viviana Cocco Mariani, and Leandro dos Santos Coelho. Aggregating prophet and seasonal trend decomposition for time series forecasting of italian electricity spot prices. Energies, 16(3):1371, 2023.
- [39] Shivam Swarup and Gyaneshwar Singh Kushwaha. Effects of temperature rise on clean energy-based capital market investments: Neural network-based granger causality analysis. Sustainability, 14(18):11163, 2022.
- [40] Jolanta Szoplik. Forecasting of natural gas consumption with artificial neural networks. Energy, 85:208–220, 2015.
- [41] Amine Tadjer, Aojie Hong, and Reidar B Bratvold. Machine learning based decline curve analysis for short-term oil production forecast. Energy Exploration & Exploitation, 39(5):1747–1769, 2021.
- [42] Sean J Taylor and Benjamin Letham. Forecasting at scale. The American Statistician, 72(1):37–45, 2018.
- [43] Fugee Tsung and Ziyue Li. Discussion of “a novel approach to the analysis of spatial and functional data over complex domains”. Quality Engineering, 32(2):193–196, 2020.
- [44] Luxuan Wang, Lei Bai, Ziyue Li, Rui Zhao, and Fugee Tsung. Correlated time series self-supervised representation learning via spatiotemporal bootstrapping. In 2023 IEEE 19th International Conference on Automation Science and Engineering (CASE), pages 1–7. IEEE, 2023.
- [45] Nan Wei, Changjun Li, Jiehao Duan, Jinyuan Liu, and Fanhua Zeng. Daily natural gas load forecasting based on a hybrid deep learning model. Energies, 12(2):218, 2019.
- [46] Qianxiong Xu, Cheng Long, Ziyue Li, Sijie Ruan, Rui Zhao, and Zhishuai Li. Kits: Inductive spatio-temporal kriging with increment training strategy. arXiv preprint arXiv:2311.02565, 2023.
- [47] Hao Yan, Ziyue Li, Xinyu Zhao, and Jiuyun Hu. Sparse decomposition methods for spatio-temporal anomaly detection. In Multimodal and Tensor Data Analytics for Industrial Systems Improvement, pages 185–206. Springer, 2024.
- [48] Weiqi Zhang, Jiexia Ye, Ziyue Li, Jia Li, and Fugee Tsung. Dualtime: A dual-adapter multimodal language model for time series representation. arXiv e-prints, pages arXiv–2406, 2024.
- [49] LI Ziyue. Tensor topic models with graphs and applications on individualized travel patterns. In ICDE 2021: 2021 IEEE 37th International Conference on Data Engineering (ICDE), pages 2756–2761. IEEE, 2021.