Socioeconomic factors of national representation in the global film festival circuit: skewed toward the large and wealthy, but small countries can beat the odds
Abstract
This study analyzes how economic, demographic, and geographic factors predict the representation of different countries in the global film festival circuit. It relies on the combination of several open access datasets, including festival programming information from the Cinando platform of the Cannes Film Market, covering more than 30,000 screenings of over 20,000 films in almost 600 festivals across the world over a decade. It is shown that while the festival screen is indeed dominated by films from large affluent countries, the bias is nevertheless not fully proportional to the large demographic and economic disparities across the world, and that several small countries perform better than expected. It is further analyzed via computational simulations how much including films from smaller countries contributes to cultural diversity, and how countries differ in cultural "trade balance" dynamics, revealing differences between net exporters and importers of festival films. This research underscores the importance of balanced representation in film festivals and the public value of increasing cultural diversity. The data-driven insights and approaches to quantitative festival program and cultural event analytics are hoped to be useful for both the academic community as well as film festival organizers and policymakers aiming to foster more inclusive and diverse cultural landscapes.
1 Introduction
Film festivals are a vital component of the film industry, occurring in various forms worldwide, ranging from major industry hubs like Cannes, Sundance or the Berlinale, to regional and smaller national events. These festivals differ in budget, audience size, specialization, acceptance rates and diversity, but form a well connected global network in terms of the flow of recurring films, filmmakers and industry stakeholders [34, 36, 61]. They offer filmmakers a venue to showcase and market their productions, which can determine their further success [[]]stringer_global_2001. Festivals also promote cultural interactions and dialogue between makers and audiences, public and industry interests, and generate public value [[, in the sense of]]benington_public_2011,oregan_past_2022,mazzucato_creating_2020 to societies and public spheres, by showcasing culturally varied programs that broaden public access to films and foster international cultural learning and exchange [24, 51, 9, 50, 10, 39]. Increasing diversity in cultural landscapes, including by platforming otherwise low capacity or underrepresented voices and potentially novel perspectives, can in turn foster societal resilience and innovation [15, 5, 25]. Cultural exports including films can also act as soft power [23].
While balancing between various pressures — like marketability, artistic aspirations, activism, diversity and audience choice — can be challenging in terms of curation [4], power over programming means festivals can also bypass traditional distribution limitations and address topical issues [11, 14]. The role of film festivals also extends beyond exhibition and cultural learning. Like other cultural festivals [[]]wilson_expanding_2017, they boost local economies, create financial and symbolic value for host countries and regions via public funding and subsidies, create employment opportunities and increase revenues via tourism [46, 35, 22, 24, 32, 33].
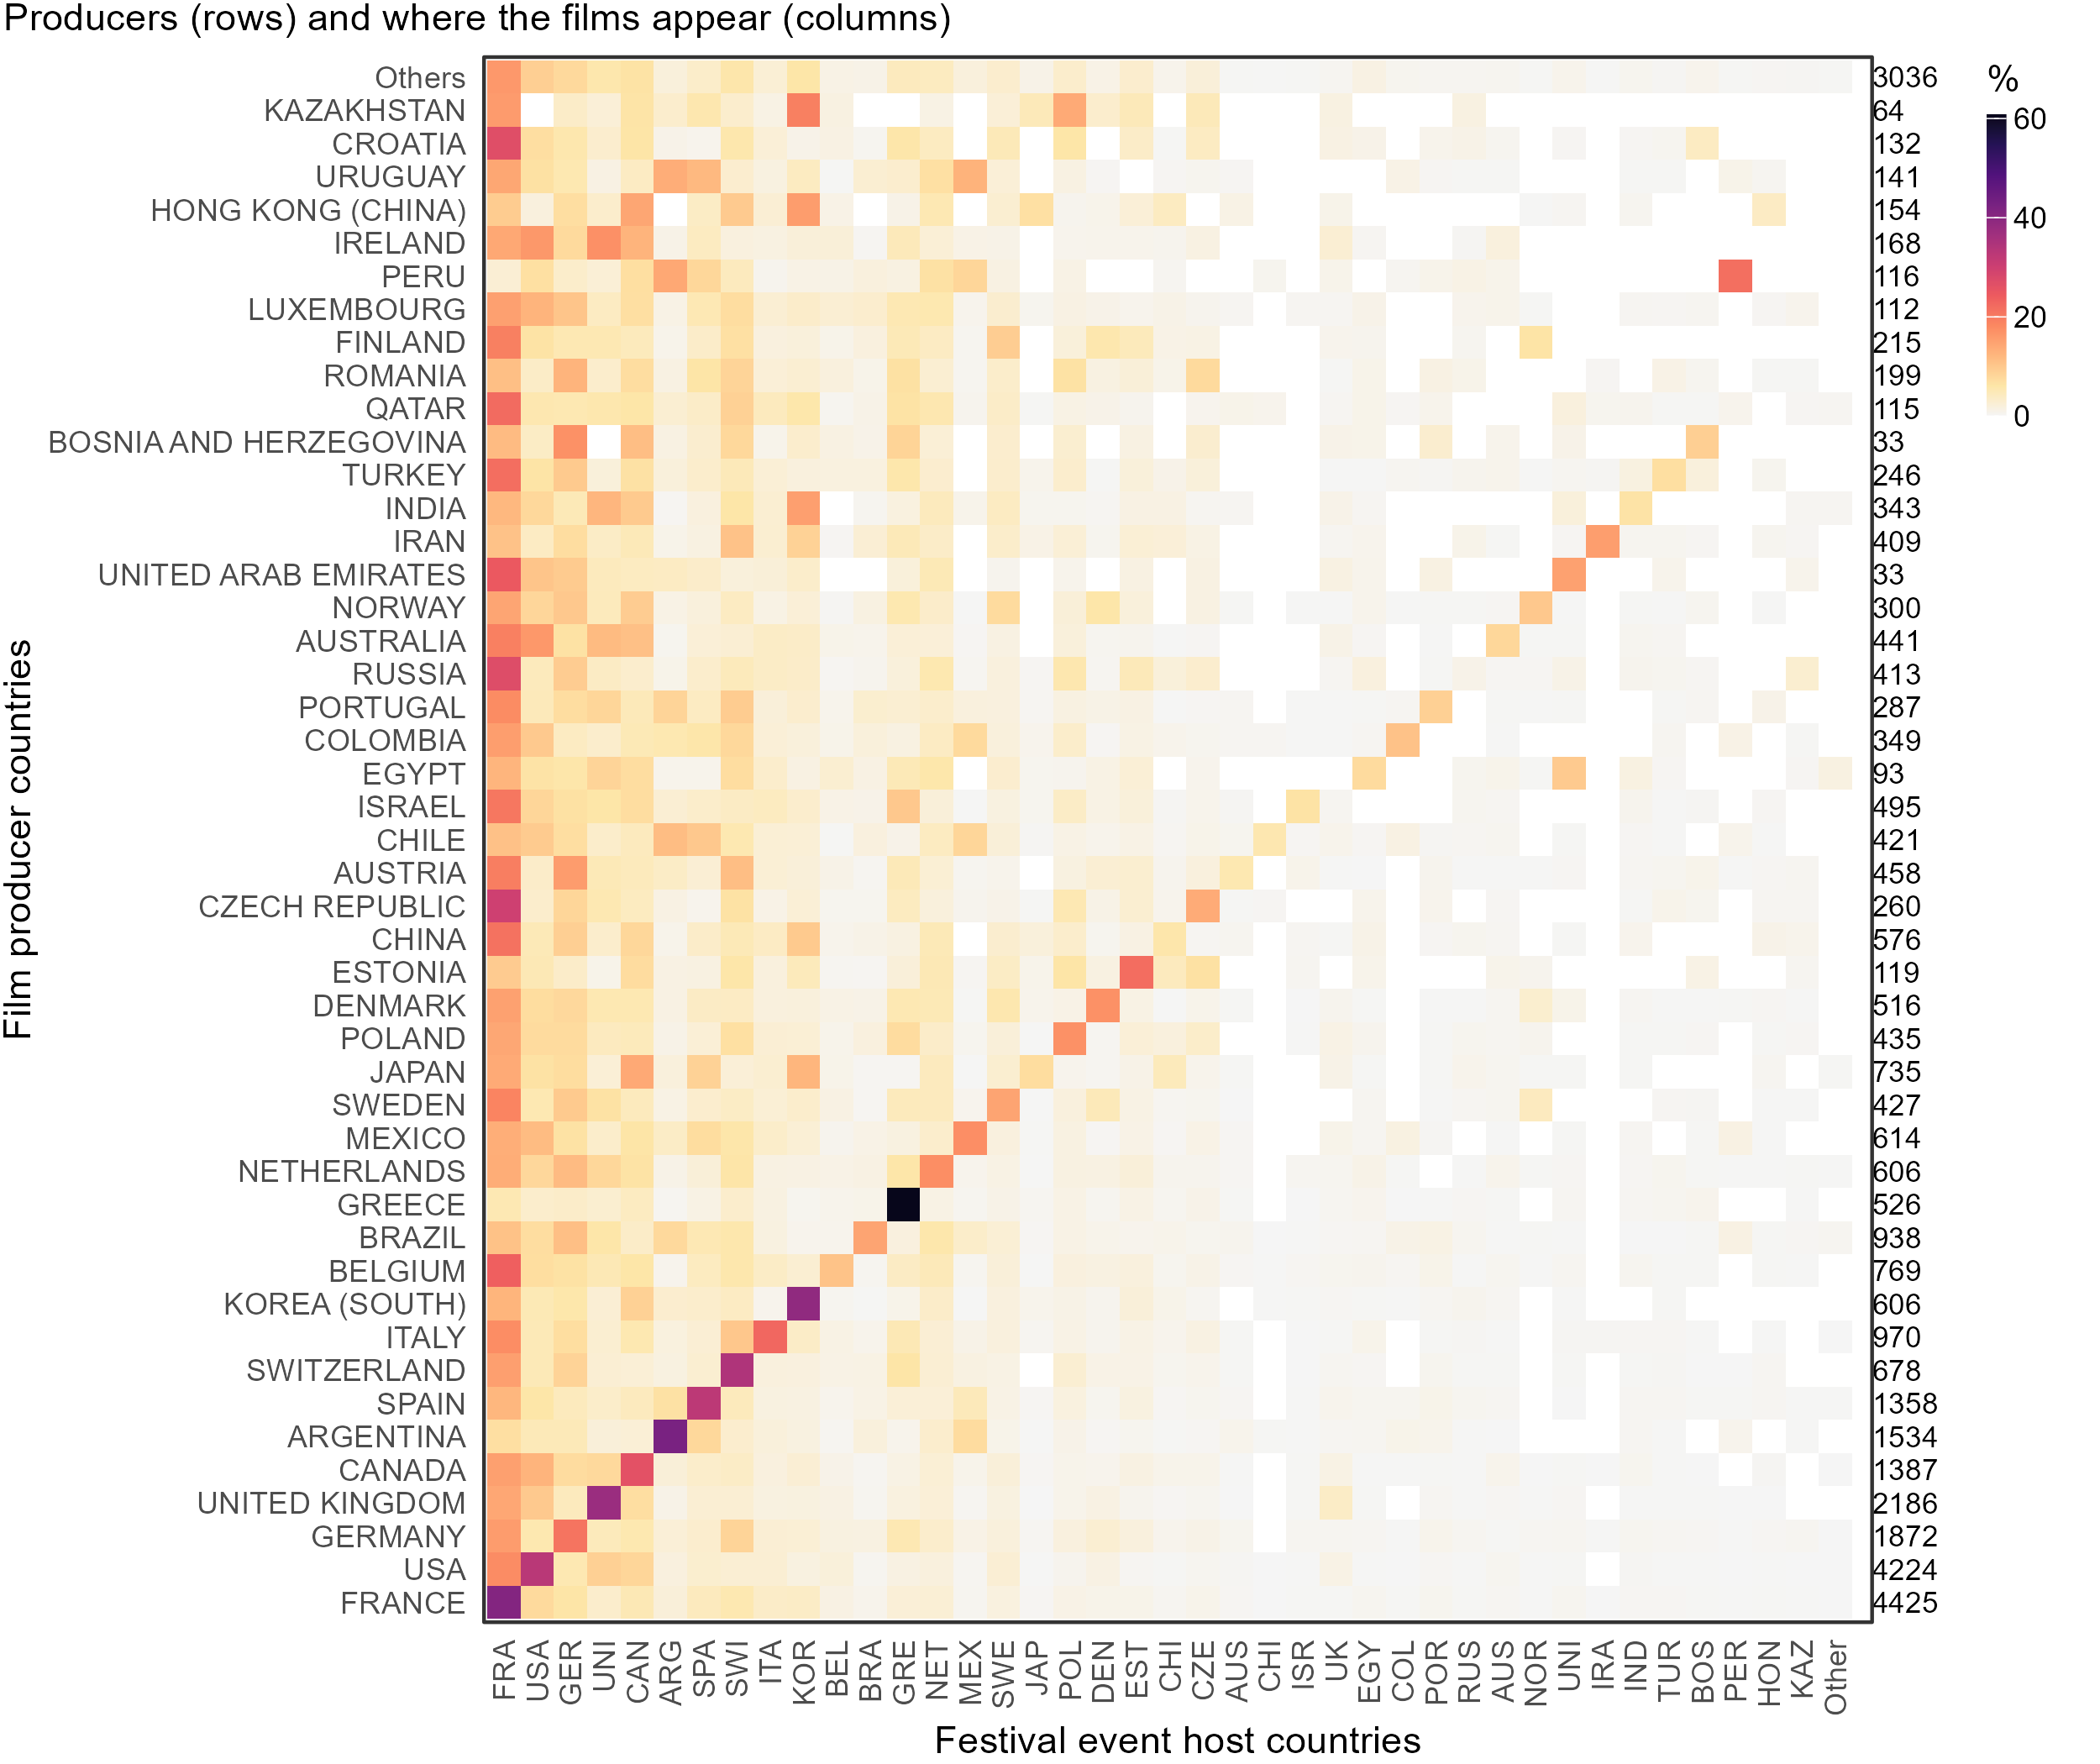
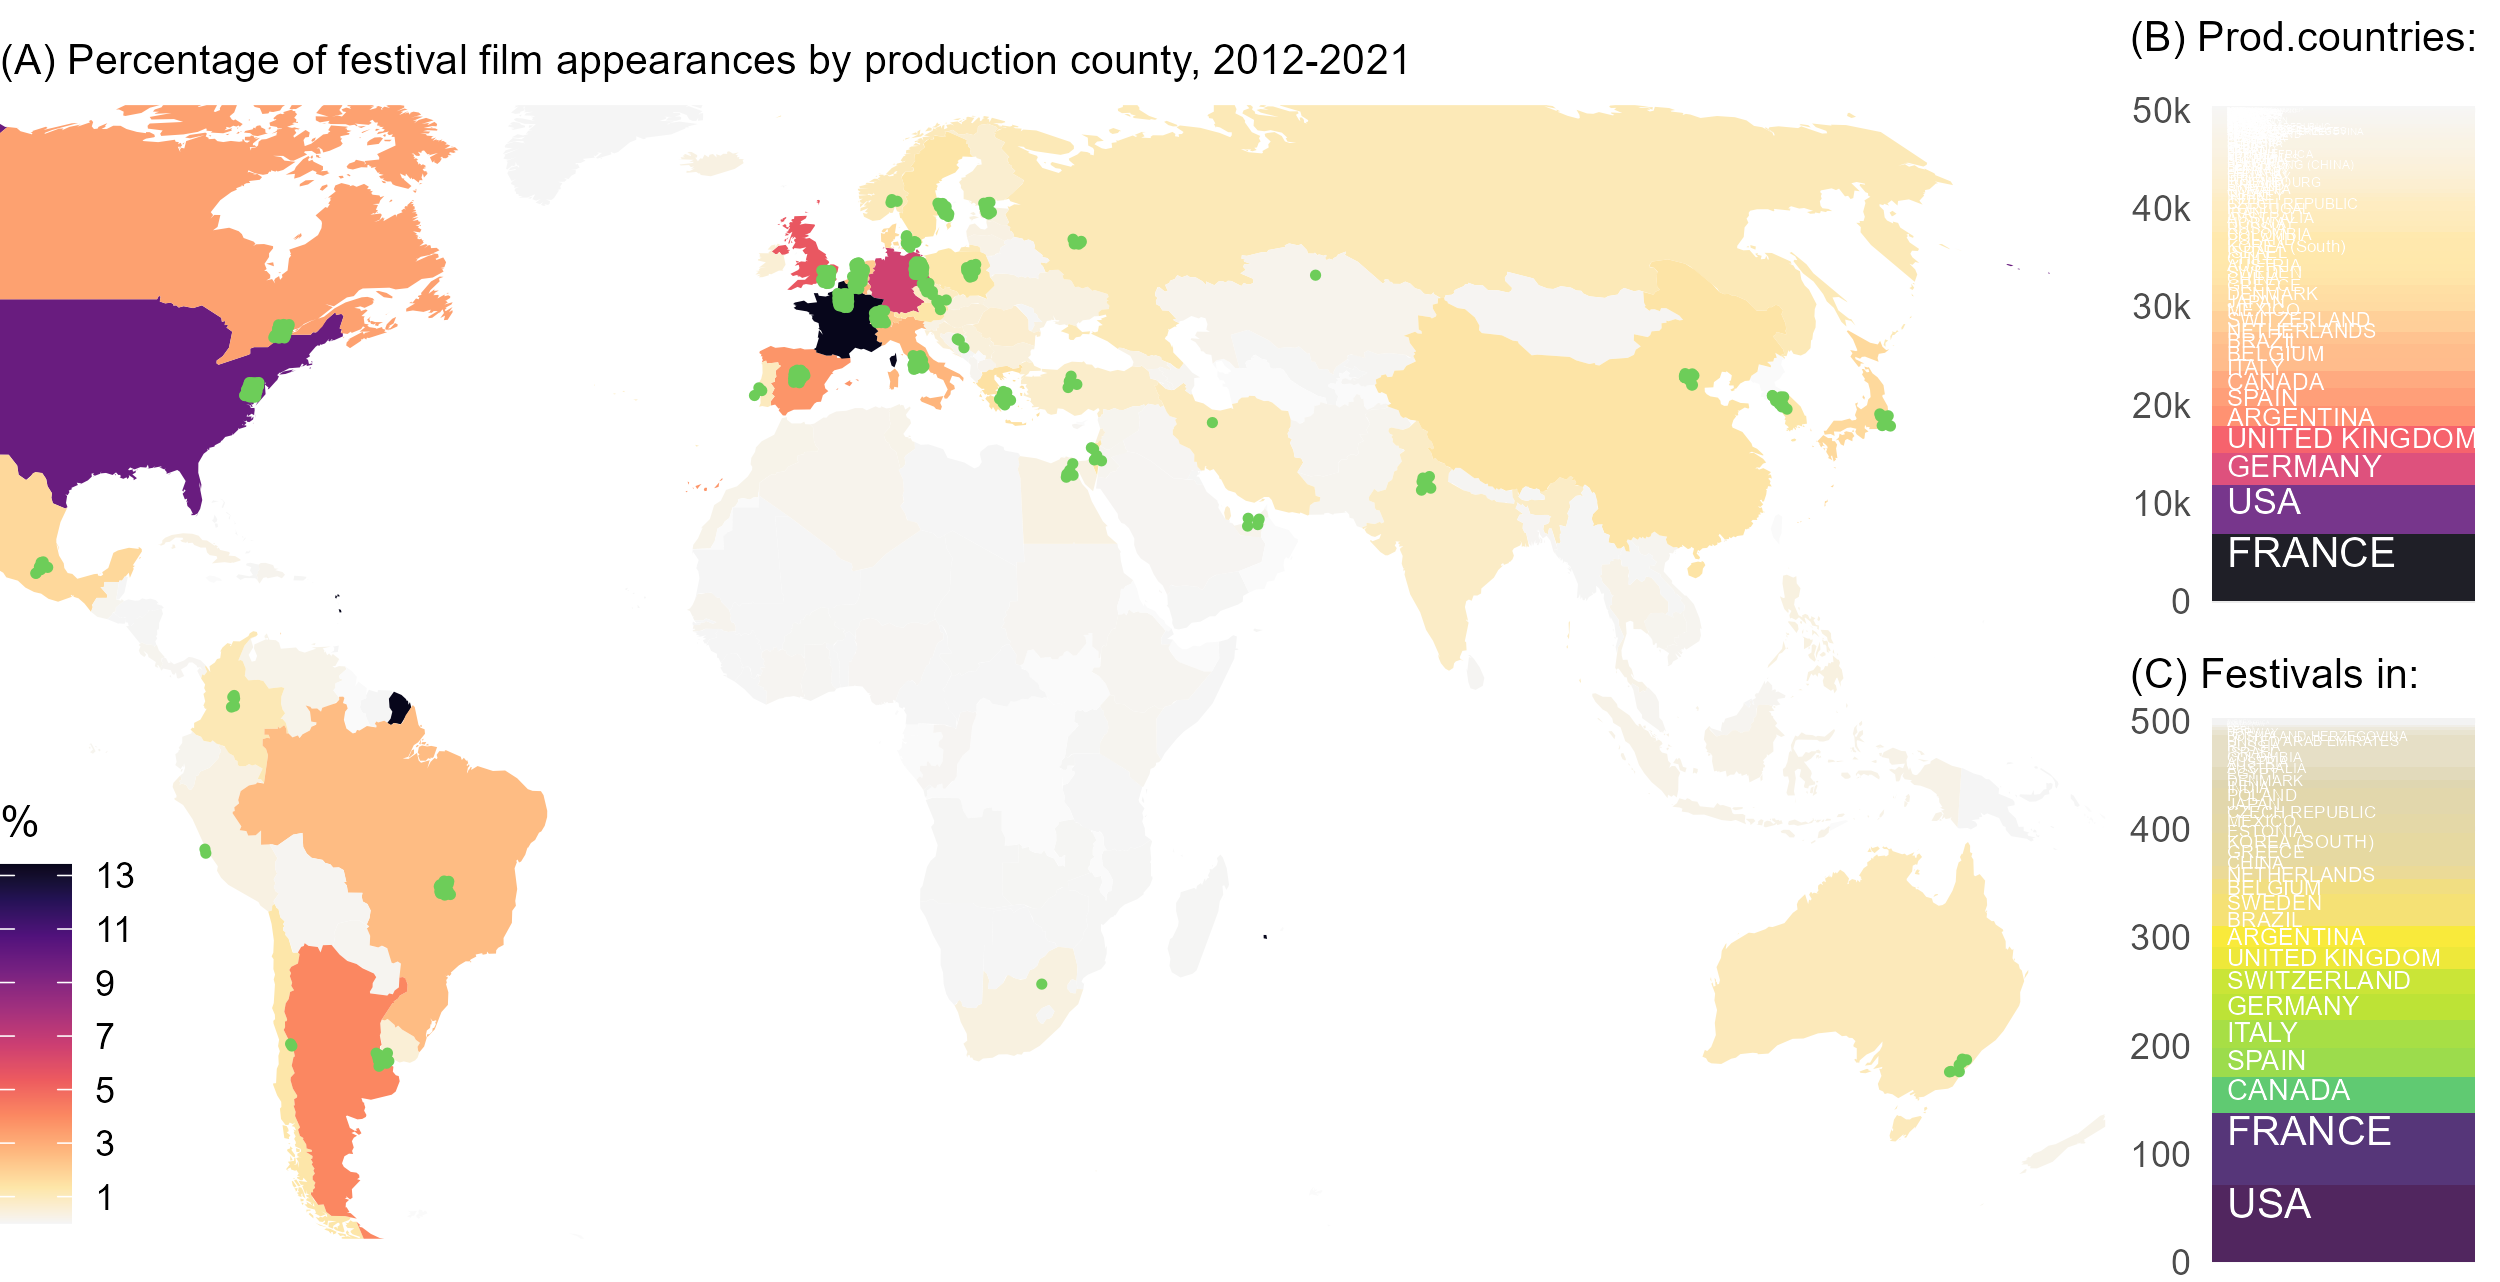
But the festival circuit is not a level playing field. Countries that are smaller, less affluent or whose language is not among the few international lingua francas — naturally face various challenges when it comes to the production as well as (local and global) distribution of cultural products, including films [26, 41, 38, 19]. The dynamics of programming content from large global producers and small countries in festivals, cinemas and television, and questions around the value of cultural diversity, are therefore an active research area [52, 61, 27, 17, 28, 62]. This contribution makes use of several sources of open data, including a refined version of a snapshot of the Cinando database of international film festivals [[]]zemaityte_cinando_2023,zemaityte_quantifying_2024, further described in Materials and methods below. A first glance at the data indicates that the global film festival circuit is rather biased towards large, wealthy nations (Figure 1). Almost a quarter of the films in the circuit in 2012-2021 listed either France or USA as the production or co-production country, and over a quarter of the festivals took place in these two countries (see Fig. 1.C, and the green dots on Fig. 1.A). The database includes films from 163 countries, but half the films in that period were made in or involved one of the top 8 most productive countries.
However, smaller countries likely just have fewer filmmakers, and less prosperous nations have fewer resources to invest in film production. Iceland or Vatican City cannot be expected to match the volume of American film production; Switzerland and Latvia are physically closer to more international festival locations than Malaysia or Uganda. Films from the UK or Australia do not require translation in many places due to being in English. Filmmakers or stakeholders in countries distant from the current hot spots may find fewer opportunities for travel to showcase and advertise their products. India is a large film producer, but not all Bollywood films might make it to the mostly west-centric festivals. First world countries simply have more resources to drive their film industry, and local cinema-going audiences with higher disposable incomes. Yet if economic and demographic disparities lead to unequal representation, it can undermine the potential for film festivals to democratize access to diverse cultural expressions and public value available to global audiences.
This short contribution attempts to shed light on these dynamics and fill a gap in film festival research literature by directly measuring national representation at festivals, and comparing this to countries’ economic and demographic factors, as well as providing a quantitative cultural analytics of the flows of festival films between countries of the world. Until recently, film festival research has remained mostly theoretical [[, e.g.]]de_valck_film_2007,loist_film_2016,wilson_expanding_2017, qualitative or participant experience focused [49, 39, 52], or based on smaller data samples [13]. Following more recent research [61, 62], this contribution study aims to leverage big data and systematic quantitative analysis. Special attention is paid here to small countries, how they fit into the festival ecosystem, and how much diversity and therefore public value they add in the circuit. In summary, the following research questions are addressed:
-
1.
To what extent is the festival circuit skewed or biased towards large and wealthy countries?
-
2.
To what extent are factors like relative wealth and population size predictive of national representation in the film festival circuit? What characterizes countries that perform better or worse than expected?
-
3.
How and how much do countries differ in terms of the cultural "trade balance" of festival films?
-
4.
Is the cultural diversity of the festival landscape affected by the inclusion or absence of smaller and less prosperous countries?
2 Methods and materials
2.1 Film festival data
This research makes use of three large open access datasets, and two additional sources of information. The primary source is the Cinando dataset [60], published along with [61] and further explored in [62]. It is a cleaned version of a static snapshot of the proprietary relational database underlying the namesake platform operated by the Cannes Film Market (also known as Marché du Film — Festival de Cannes). The 2012-2021 subset used for this study is operationalized as a set of 50,408 data points, where each point is the screening of a film; if there are multiple co-production countries then the film entry is repeated for each (but this is taken into account in the analyses). Ignoring co-productions, there are 34,535 film screening entries, reflecting high levels of co-production [[, cf.]]bondebjerg_transnational_2016,parc_understanding_2020. There are 22,167 unique films (but see below), 592 festivals in 129 event series, 148 primary production countries, and 163 countries in total, i.e. 84% of the world’s countries occur at least once.
While the Cinando snapshot used here is currently one of if not the most extensive global dataset available on the programming of international film festivals, it comes with limitations stemming from its initial European origins, having started out as a service solely for the Cannes Film Festival. Using it has arguably later become an industry standard however, reflected by the wide range of festival events recorded there and correlating with UNESCO production estimates (see below). The potential biases include possible under-representation of non-European events and industries, and analyses based on it risk suffering from "survivorship bias", as the database or at least the version available here does not record rejections by the programming committees, only programs of successfully selected films. The initial years of the database are also sparse, reflecting its gradual uptake by the industry. [61] used a subset of data between 2009 and 2021 for most, and from 2012 for more conservative analyses. The latter approach is taken here for aggregated data, as including 2009-2011 still risks biasing the results towards France and French films by showing larger shares and counts than would be representative of the subsequent decade.
Most of the data appears to be entered by platform users, which necessitated extensive data cleaning described in [61]. One shortcoming that remains is the identification of individual films, as films have been often entered into the database multiple times using different ID values. Here, films are further identified using the title and the reported production year, but both of those values are also known to occasionally change during film production, and some films have short single-word titles which can easily be confused.
Another technical detail concerns co-productions. The database does include an order variable for metadata, including production countries, but this is difficult to interpret systematically and is ignored here as in [61]. The existence of multiple producers is accounted for the the analyses however, but doing so requires choices about aggregation to match the goals of a given analysis. In the study on representation below, each listed county is counted as one full entry, whereas in the analyses on cultural flows and diversity, they are weighted, so that for multiple co-producers , the weights equal i.e. sum to one (see Results section).
The data available only includes programs, i.e. already selected films at festivals — there is no information on acceptance rates and rejections, which would be of course interesting to investigate. What can still be modeled is aggregated counts of film appearances per country, which is done below. There are of course multiple ways to aggregate, each with its downsides. The count approach ignores the individual festivals, and with country aggregates it is also not possible to model effects such as festival types, distance of the festival from the production country, or to control for festival year (the period is just under 10 years however). Percentage of countries in a festival could be one option, but that would give undue weight to small festivals. Binomial representation, which would enable modeling more detailed metadata, is another option, but that would equate having one film at a festival and having an entire festival only feature films from one country (and be largely a dataset of zeroes, especially if done per year, given that many countries in the dataset only occur a few times). In the linear regression modeling below, counts on a logarithmic scale is used is the response variable. Another option would be a Poisson regression or a negative binomial model, given the large discrepancy between a few large counts and a long tail of small values. The log-linear approach lends itself to more convenient interpretation, especially given that all other variables are similarly power-law distributed and also on the log scale.
For the representation and bias analysis, the FIAPF or International Federation of Film Producers Associations accreditation list is used as additional categorization [18]. This list represents the so-called "A-list" top competitive festivals at the center of the festival industry, widely recognized by filmmakers, although it does not include all large and otherwise significant event series such as Sundance. Most of the festival series in the dataset however, 115 out of 129, are B-listers.
2.2 Socioeconomic and film production data
The two other datasets are the World Bank database [21], used to source information on population and gross domestic product (GDP) as in [62], and the UNESCO Institute of Statistics database on the counts of feature films produced by country [[]]uis_unesco_2024. Both were aligned with the Cinando dataset by country name (manually correcting names where there was a mismatch in naming formats). Where data for a year was missing for any country, linear interpolation was used to predict the values from adjacent present years.
The UIS production numbers are not directly comparable to the Cinando festival programming data, even if the latter were transformed from screenings to unique film counts. The data collection methods are clearly different, and UIS counts only feature films, whereas festivals feature various formats including short films. Therefore, instead of measuring over or under-representation in absolute numbers, a correlation between the magnitudes is instead provided in the Results section. This relationship could be further analyzed in future research.
These data from the additional databases were added by production country to the final dataset, but aligning by the year of the festival event of a given screening, not the year of film production. This may be a debatable choice, but hopefully leads to more informative results. One argument is the existence of retrospective festivals or program segments. As an extreme example, the socioeconomic situation of the United Kingdom in 1927 probably has little bearing on the screening of the film "The Ring" from that year in Cannes in 2012. The economic situation of a county could itself be a factor however when it comes to representation in a given year in the festival circuit. Furthermore, films typically stay in the circuit only a few years after production anyway, including due to rules of admission in many festivals [61]. In the Cinando subset, the average difference between year of production and screening is just 0.7 years (both variables are at yearly resolution, so this is a somewhat rough estimate).
These should be considered however only rough estimates of more interesting target measures, which would be e.g. the number of filmmakers in a country, and the financial means, revenue and subsidies of a country’s film industry. Total population is a proxy, but of course it cannot be expected that the number of filmmakers is proportional in every country. GDP is the total value of produced goods and services produced, but says nothing about wealth distribution or investment in the arts. Since GDP and population typically correlate, the measure used in the analyses here is GDP per capita, i.e. divided by the population estimate of a given year, as a rough proxy of relative prosperity. These variables are averaged for the analyses below for the 9-year observation period, weighted by the number of screenings in a year: this way the aggregate for each country is most representative of when it was most present in the circuit.
While preceding literature discussed in the Introduction has discussed and compared small and large countries, using continuous population and GDP variables here means there is no need to categorize or bin countries into any arbitrary discrete categories such as "small" or "large", which in turn could easily bias analyses down the line. Unlike [62], which this analysis complements, the models here of representation, bias and diversity all use the continuous scales of the aforementioned variables. A country as such is not necessarily an ideal unit either, as many countries may include regions with different levels of population, affluence or access to arts education. Here country and nation are used interchangeably for simplicity, but many countries of course consists of multiple ethnic and cultural groups, which again may be associated with differential access to resources. Another simplification concerns location and distance. As the Cinando dataset only includes production and festival host at the country level, capital city locations and inter-distances are used where needed (including the map in Fig. 1.A and the regression model in the results).
2.3 Thematic and linguistic diversity
The diversity section in the Results below follows the method of diversity calculation and the open source codebase of [61], who argue against using discrete labels for calculating diversity when the distances between categories are not equidistant. This is of course not the case for e.g. thematic metadata tags such as drama or horror, where some genres are inherently more similar than others. Languages of the world also vary in similarity, and the delineation of language, variety or dialect is often more political than anything else. For example, a festival featuring films in Dutch, Flemish and German would be as diverse on paper as one featuring Japanese, Zulu and Finnish, if one were to simply count the labels. Their proposed solution is using latent spaces, induced directly from the tag co-occurrence data for genres (analogously to word embeddings), and using an externally sourced language typology vectors dataset for linguistic similarity [40]. The set of 41 possible thematic or genre tags in the Cinando dataset is admittedly not ideal, consisting of broad genres (drama, comedy, documentary, etc.), but also markers like animation or book adaption, and also production related tags like first film, female producer and Bollywood. Here as in the aforementioned paper, the thematic vectors are averaged for each film, i.e. the latent "meaning" of a film is allowed to be a composite of its assigned metadata tag semantics.
The continuous spaces then enable the calculation of diversity as the average distance from a global mean vector (analogously to mean absolute deviation or MAD). The mean is normalized by the maximum possible distance in a given space, yielding a metric in range. The intuition is that a distribution tight around the (multidimensional) average indicates low diversity — everything is close to the average. A high mean distance from the average indicates a wider spread and therefore higher diversity. As with any metric based on means, including MAD, this of course assumes a (here multivariate) normal distribution. Given the normalization, a value of 1 is practically only possible in a bimodal distribution, e.g. a system consisting of only two of the most different but frequent categories — which is probably no longer an intuitive representation of diversity, nor a likely policy goal. This limitation of the metric as it approaches its maximum should be kept in mind, but is not found to be an issue in the analyses below.
Finally, the simple simulation described in the Results that uses the diversity measures is based on the concept of bootstrapping. For each subset of e.g. population level, the Cinando dataset of N entries is filtered according to the criterion, and then a new set of N entries is created using sampling with replacement from the filtered set. Therefore the samples, albeit filtered, are roughly proportional to the current representation shares of the countries, and the averages and confidence intervals are always calculated on the exact same sample size. To ensure reliability, for each population and GDP level this sampling procedure is repeated 100 times and the results averaged. When filtering, only films where all co-production countries match a criterion in the given year are kept (e.g. an Iceland-USA co-production would be left out if the population threshold is ""). In other words, this approach measures what the festival circuit would look like if it comprised of only countries matching a certain criterion, e.g. only above or below a certain size, and allows inferring how much diversity smaller or bigger countries contribute, based on the results without them. Another approach would be to do iterated weighted sampling with weights (directly and inversely) proportional to the population and GDP variables; this could be explored in future research.
3 Results
This section is organized by the research questions proposed in the Introduction, starting with the question of bias, followed by statistical modeling of representation affecting factors in the film festival circuit, modeling of cultural flows and finally an assessment of estimated diversity contributions by countries of different socioeconomic profiles.
3.1 Representational balance and bias in the film festival circuit
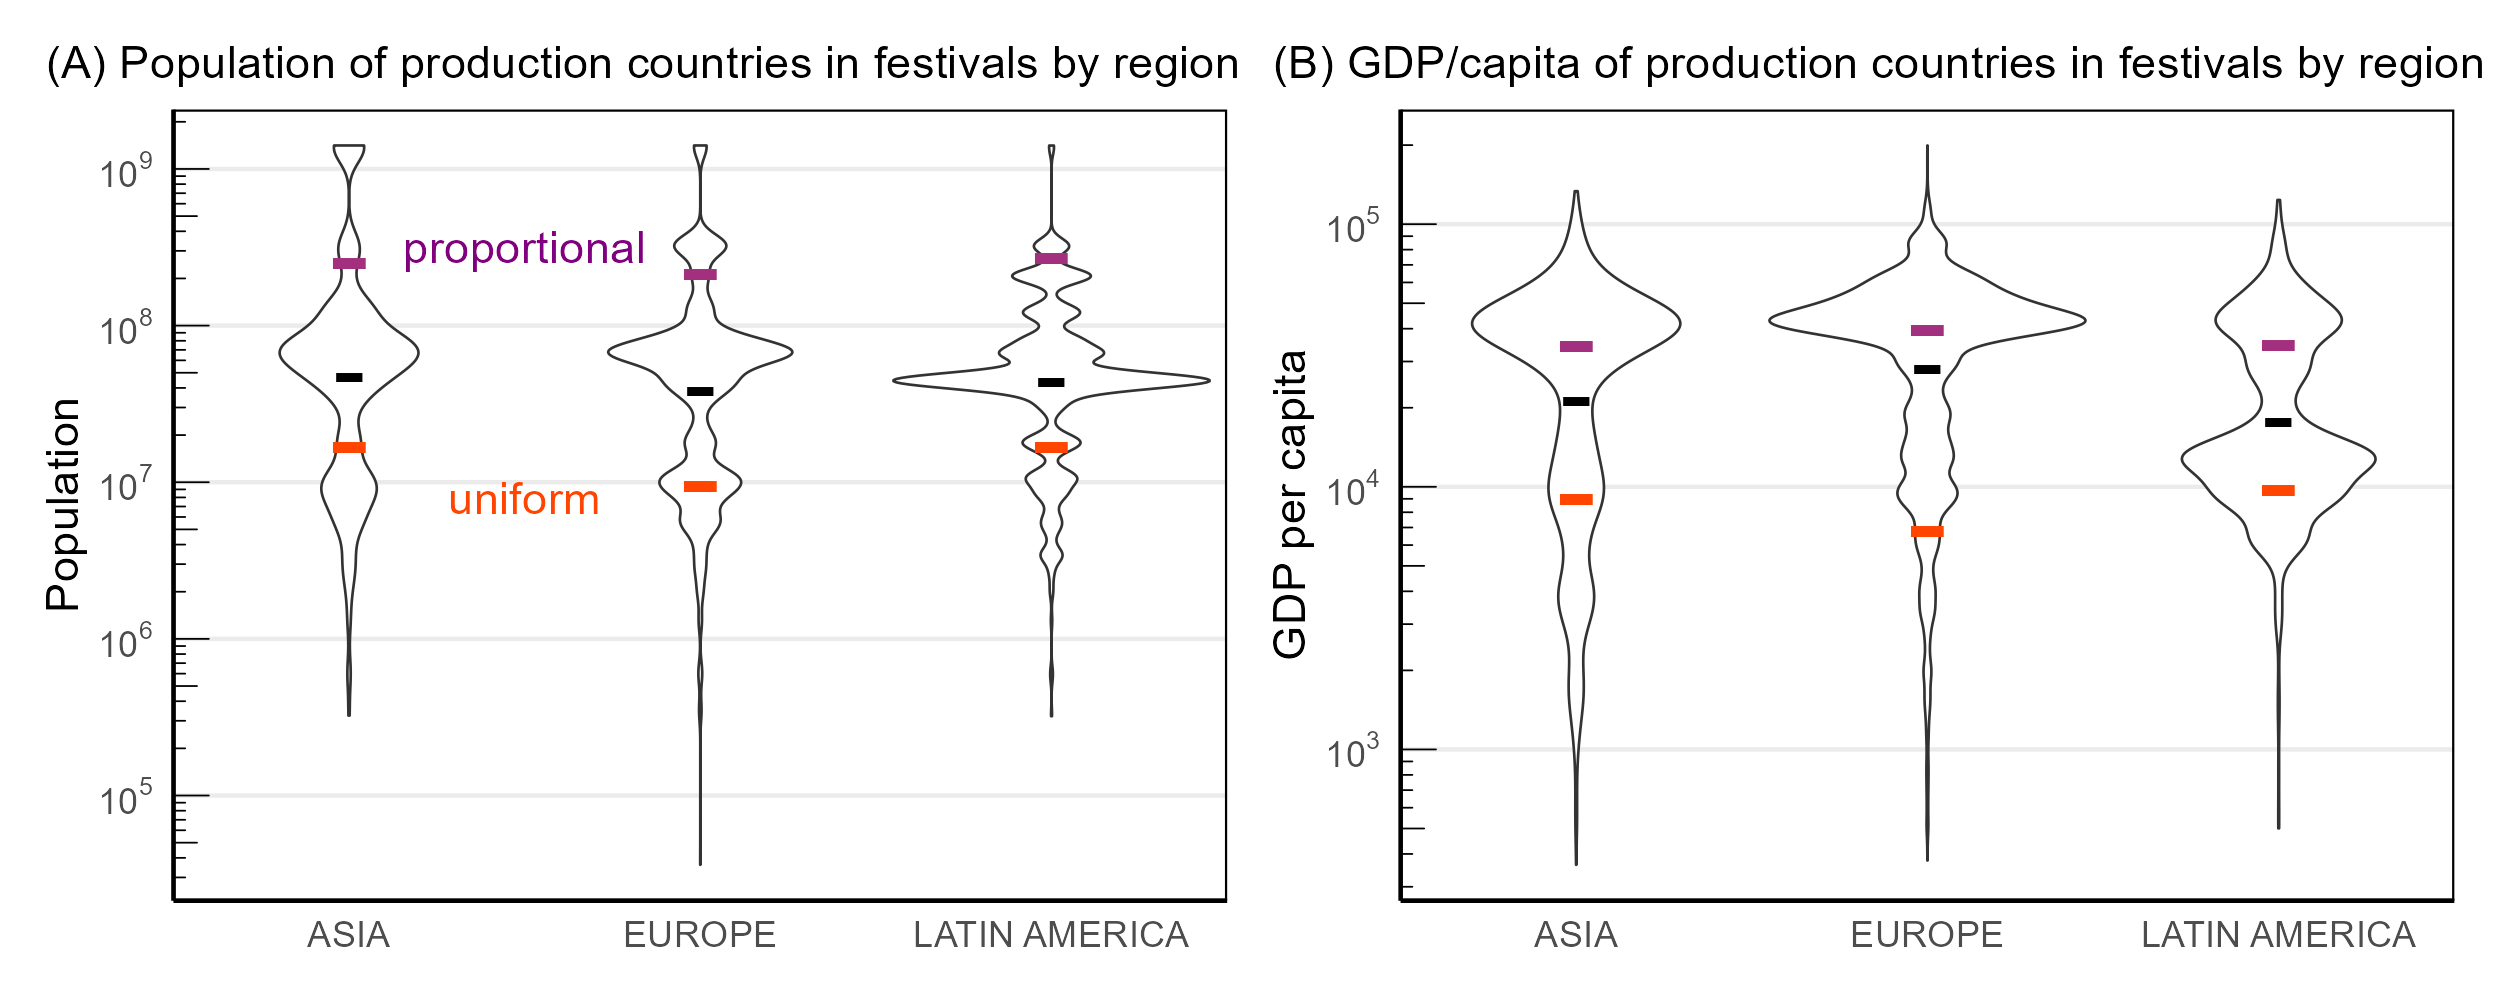
Quantifying balance bias depends on the unit of analysis, and a partially potentially ideological question of what counts as balance, equality or equity. The result presented here is rather agnostic, offering two perspectives on balance across two variables. As discussed in the Methods section, the unit is the (co)production country of film programmed at a festival; multiple appearances of a film are counted as separate data points. Figure 2.A and B show the distribution of country appearances by their respective Population and GDP per capita. Both are on logarithmic scales, given widely known Pareto distributions of both variables. The same data is shown by individual countries in Figure 3.A.
The means (black bars) are therefore geometric rather than arithmetic averages. The figure is further split by festival accreditation categories: all festivals, the prestigious competitive A-listers, and the rest or B-category festivals. There does not appear to be particularly large differences between them on average however. There is also not much different in regions of the world, as most regions contain both small and large countries (see the complementary graph showing distributions by region in the Supplementary materials appendix). Figure 2.C shows the decadal trajectories of 3 A-list and 2 B-list festivals, demonstrating relative stability in the two variables over time. The Tallinn Black Nights International Film Festival is an A-lister, yet arguably smaller and less prestigious than e.g. Cannes or Sundance — the latter itself a B-list yet widely known and influential festival series. Black Nights, taking place in the 1.3-million country of Estonia, also appears to program films on average from smaller and less prosperous countries compared to the others.
The two models of balance are labeled "uniform" and "proportional". The uniform expectation is calculated based on the mean value of a simulated distribution of appearances where each country in the world (that has participated in the festival circuit according to Cinando), regardless of size and prosperity, gets to show the exact same number of films. These values are below the real world means, again related to the power law: there are simply more smaller and few very large or prosperous countries. This model, while not necessarily most realistic, demonstrates what (the average of) a festival circuit blindly balanced by countries as units would look like (where the black mean bar would be given uniform representation).
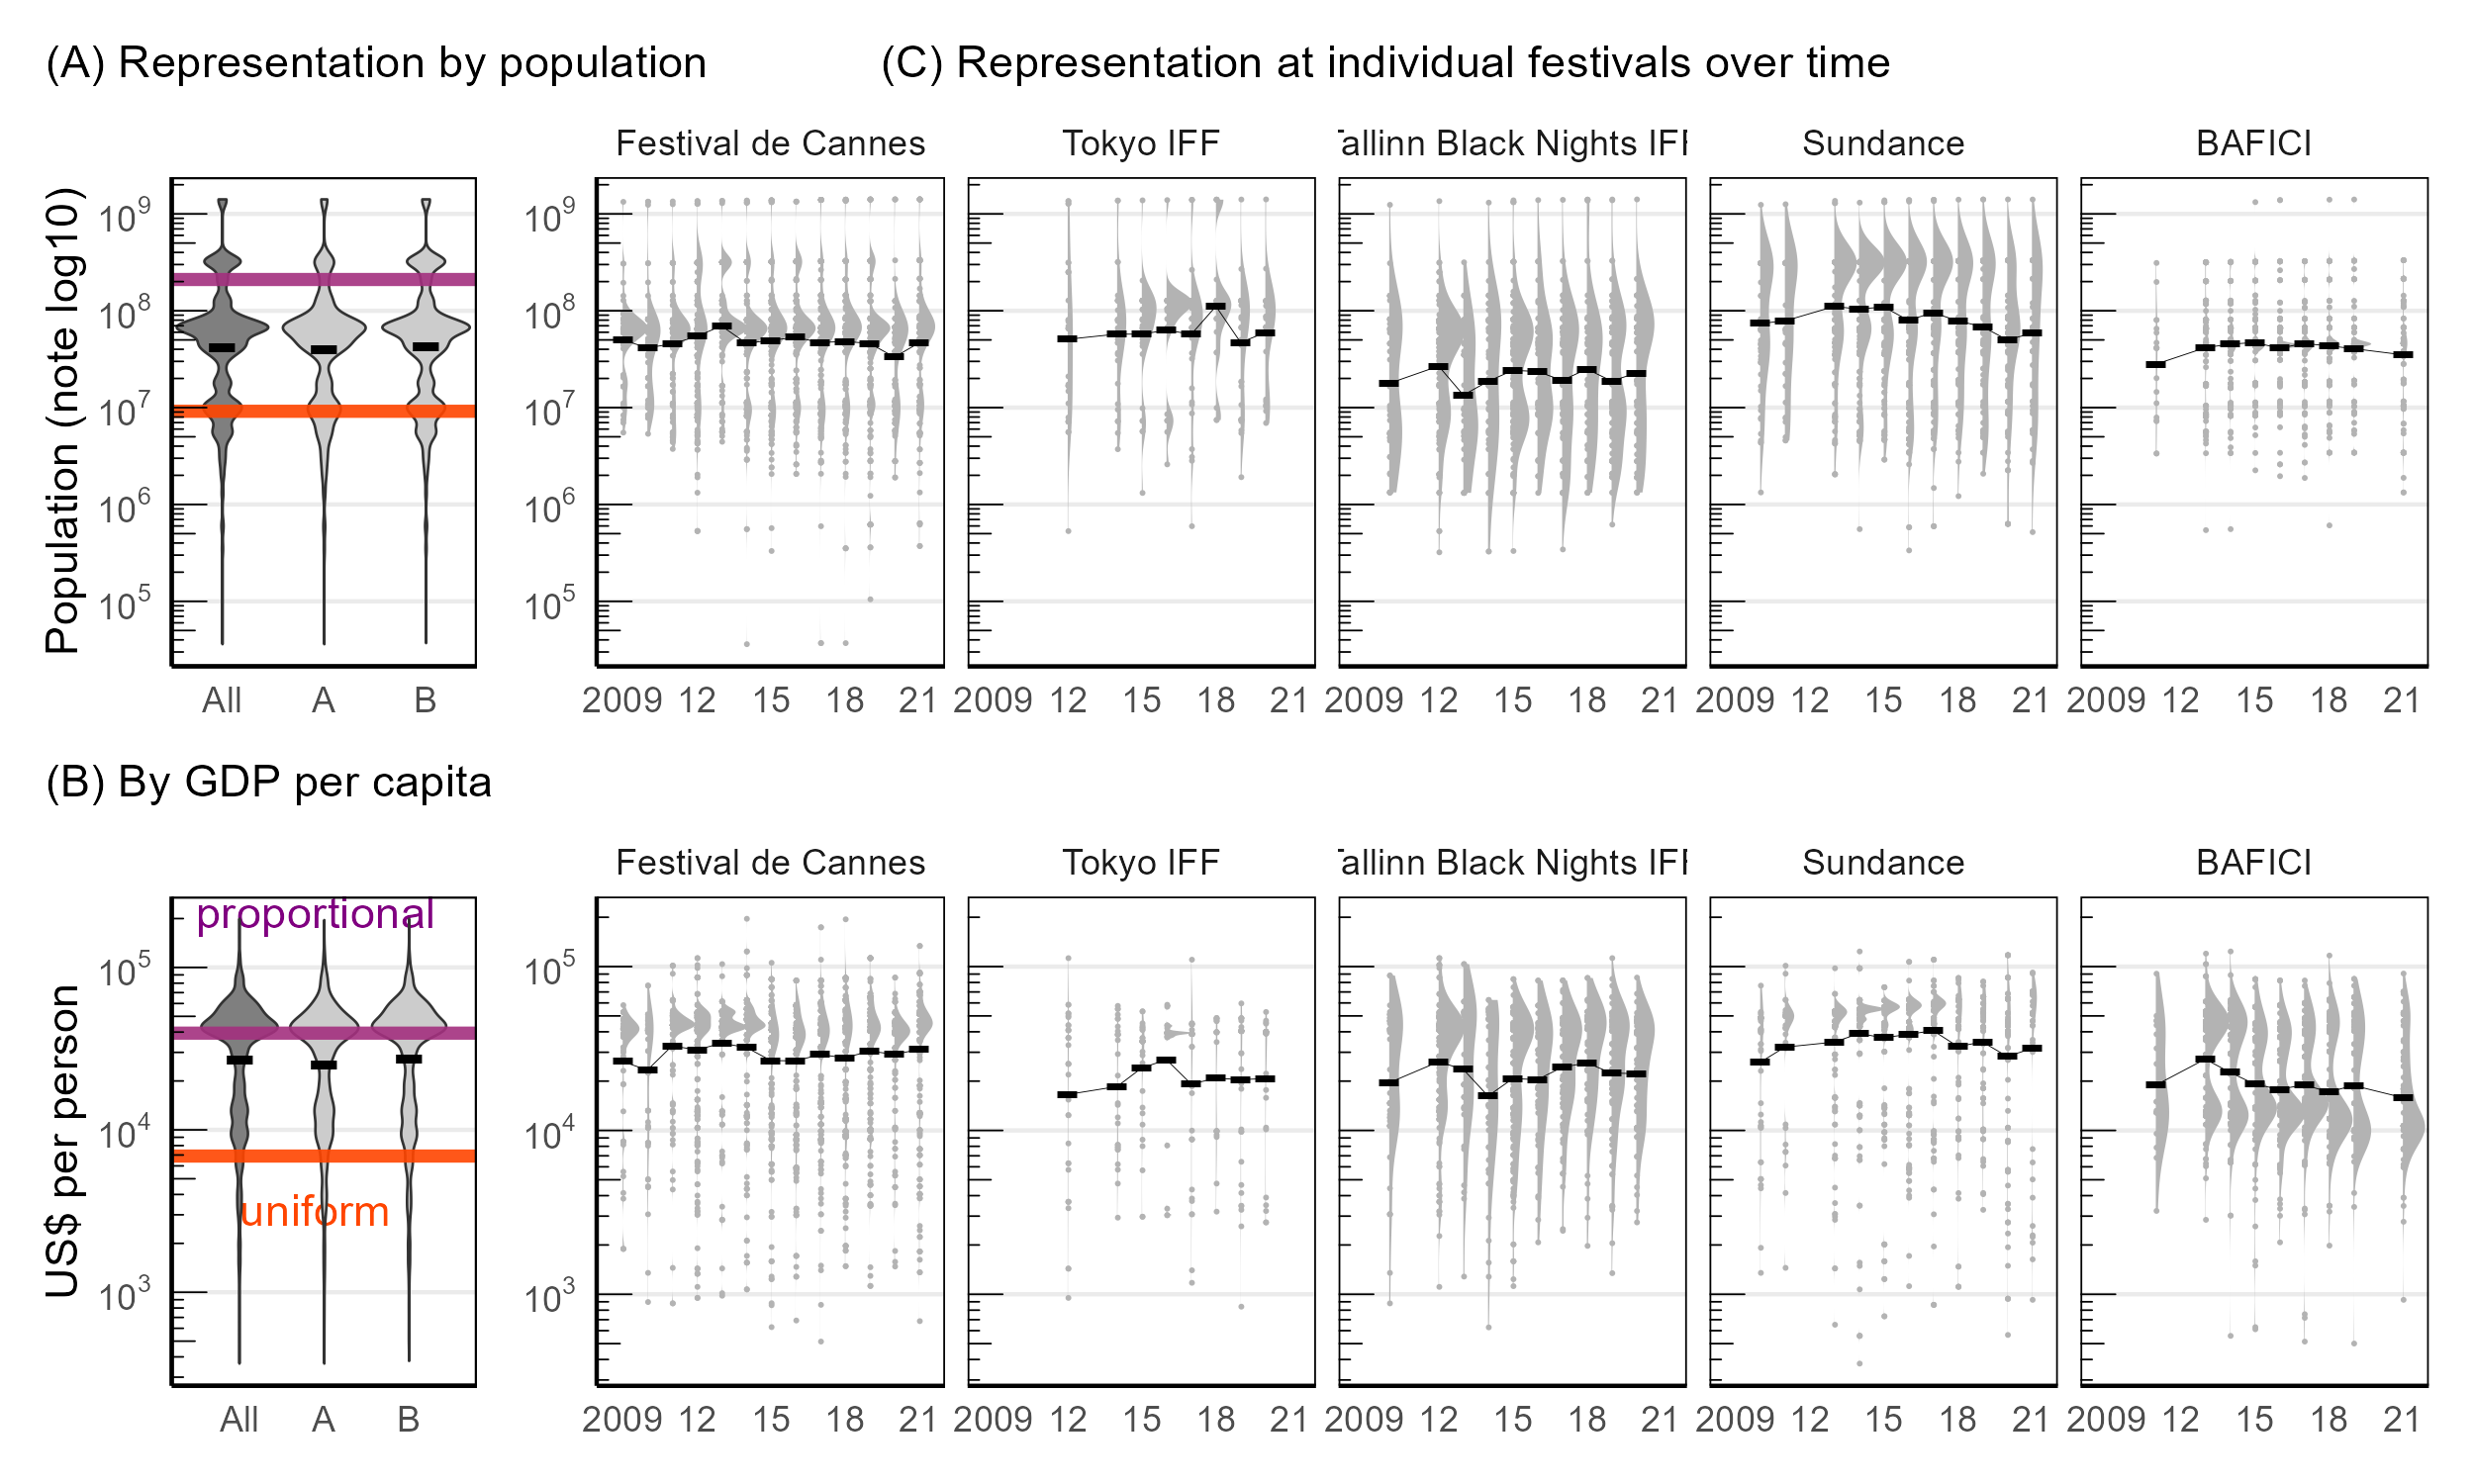
The second, proportional model is the mean of a distribution where each country gets a number of festival appearances perfectly proportional to their Population (A) and GDP per capita (B). The purple line shows where the mean (black bar) would be in this scenario. This illustrates possible worlds where each country would train filmmakers commensurately to their population, or produce films proportionally to their relative GDP (here these factors are modeled separately for simplicity; their interaction is explored below). These values are higher than the real world averages for both variables, demonstrating that the circuit is, from this perspective, indeed not as biased towards the larger and wealthier as it could potentially be. However, if one were to imagine a perfectly population-proportional international festival of say 100 films, then about 37 should be from China or India, 4 from USA, and the rest of the 59 slots split between the rest of the 163 countries in the circuit. Depending on one’s balancing goal, likely both proportionality, diversity and other goals should be taken into account to some extent.
The answer to RQ1 is therefore: it’s complicated. If one were to take proportional balance as a lens to view the world, the bias actually goes the other way, as smaller countries would appear favored. It is also only a global outlook, ignoring the functions of local or regional festivals (see also the Supplementary for region by region models). Given the nature of this database, it is also difficult to ascertain whether the current distribution rises from festival organizers selecting relatively more films from smaller countries and less prosperous regions, or higher-resource countries not producing or submitting as many films as they could. From yet another perspective, the film festival ecosystem as a whole could be seen as already managing to strike a middle ground between these two kinds of equality — whether by default or by design — with different festivals screening different content and catering to different international, regional and thematic audiences [[, cf.]]zemaityte_quantifying_2024.
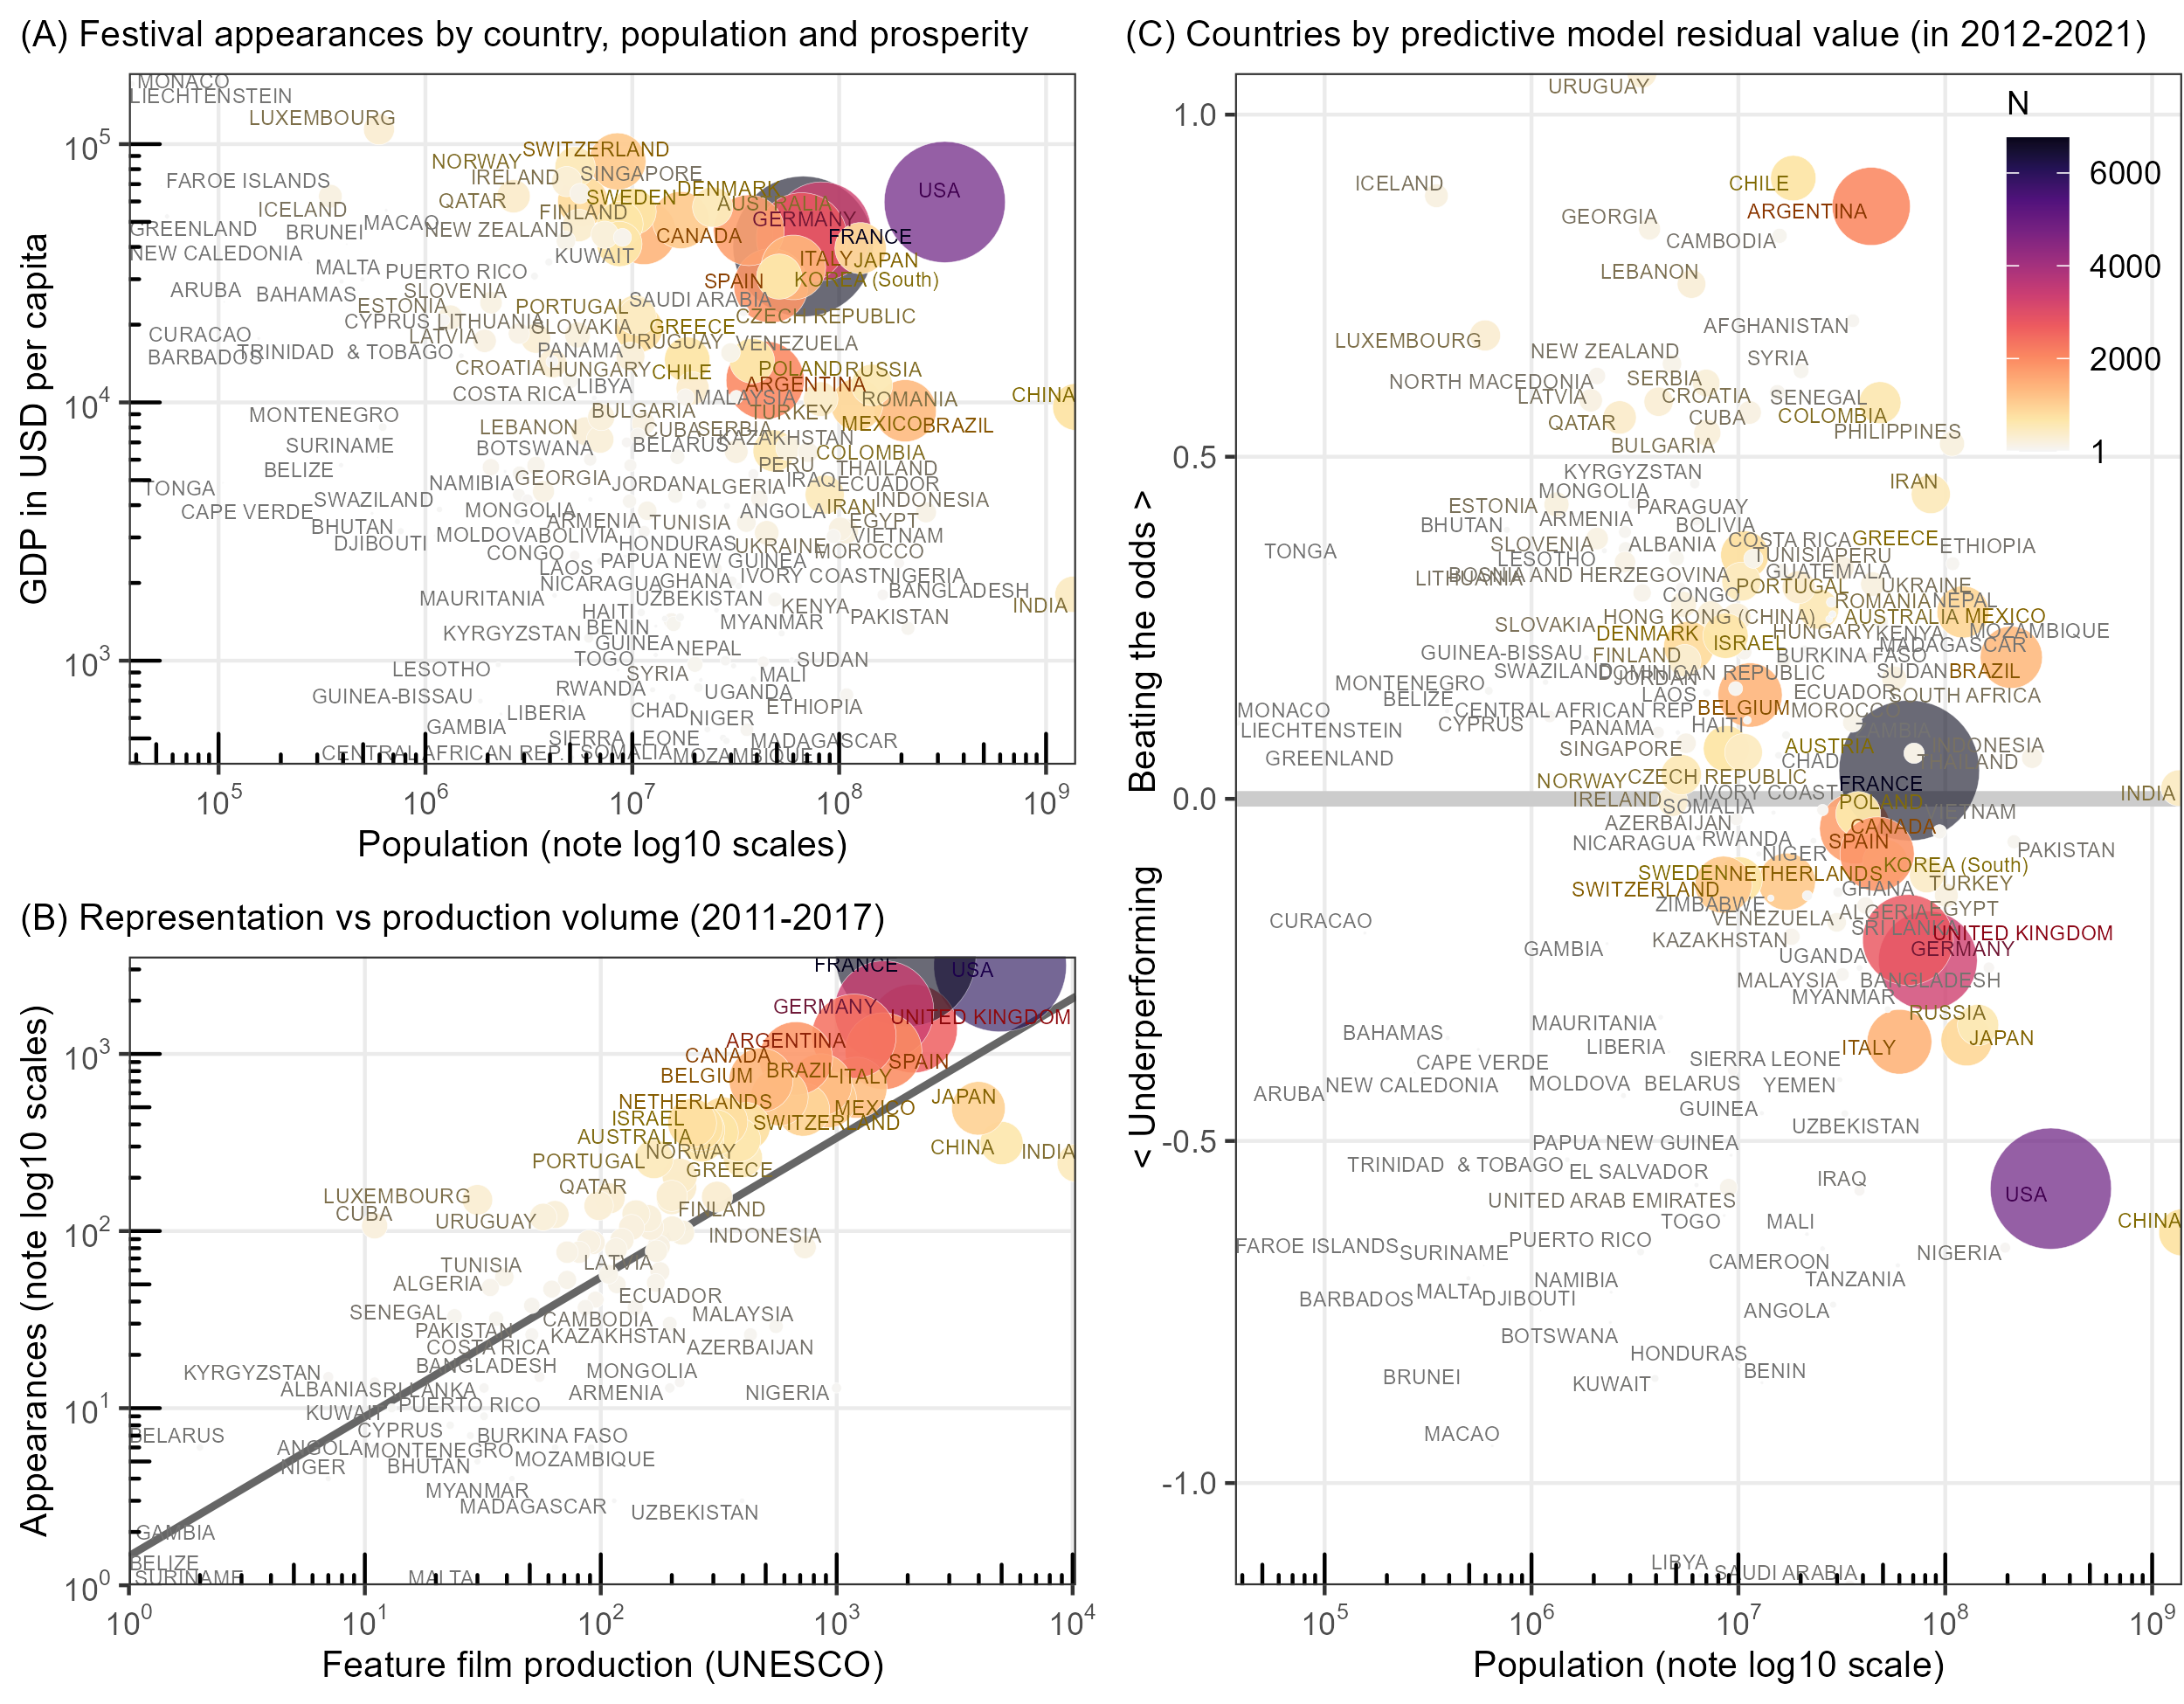
Figure 3 provides three additional views into the dataset. Each country is shown as a marker, the size of which reflects the number of produced or co-produced screenings in the circuit. Reflecting the map in Fig. 1, most of the film sources are indeed clustered on the ends of the scales in 3.A, with France and USA the largest. The question remains, how well this particular festival database reflects country-wise film production capacity, and what can be said about the relative festival success of a given country without festival acceptance and rejection data. When compared with the UIS database (see Methods and materials), the correspondence might close enough, depicted in 3.B. The range of the latter database is narrower, so the Cinando data are also cropped accordingly, but the positive correlation (on log scales) is rather strong, especially given the disparity between the two databases discussed in Methods (adjusted i.e. 57% variance in festival appearances is described by the production numbers). Most of the largest producers perform even better than expected relative to the others (points above the regression line). The largest countries in the world, China and India, appear both as relatively underrepresented, given their production volumes. As discussed in methods, it is difficult to tell at this point on these data alone, but would be interesting to know, whether this is because their filmmakers do not apply to that many festivals, if their films are not selected, or if they do appear in festivals but just not those recorded in the Cinando dataset. Not all films in all genres are of course produced with festivals in mind, and potential regional differences in this dimension may also affect these results.
3.2 Predicting festival performance
Despite these data-specific limitations and those of aggregation discussed in Methods, it is still possible to model factors of representation on country aggregates. Figure 3.C depicts the residual values from a linear regression model predicting the () number of appearances of (co)productions in the circuit per country (henceforth simply referred to as N). The predictors in the model are the population and GDP per capita of each country (centered at 10M and 10k, respectively), the number of festival events hosted in the country (with +1 Laplace-smoothing to allow for log-scaling), and distance from France in thousands of kilometers. All but the last are modeled on the scale, with an interaction allowed between population and prosperity. The reasoning for the event count variable is that countries may be more successful if they host their own festivals, which may be more favorable towards local films. The distance variable reflects the observation that the festival circuit, as recorded in the database, is rather Euro-centric, which may provide advantages to nearby countries in terms of ease of travel or cultural proximity [[]]straubhaar_beyond_1991,fu_examining_2010. The model was checked for and met the assumptions of linearity, equal variance and homoscedasticity, and exhibited only mild multicollinearity. Table 1 shows the coefficients of the model.
| SE | |||
|---|---|---|---|
| Intercept | 2.05 | 0.08 | <0.001 |
| Population | 0.72 | 0.06 | <0.001 |
| GDP per capita | 0.84 | 0.08 | <0.001 |
| Events | 0.29 | 0.12 | 0.02 |
| Distance from France | -0.05 | 0.01 | <0.001 |
| Population : GDP per capita | 0.19 | 0.07 | 0.01 |
All predictors are significant at the level, and the model as a whole is highly predictive of the outcome, describing 76% of the variance in country-wise festival representation. All coefficients except distance are positive, indicating that, as already illustrated in the graphs above, larger and wealthier countries have on average more films appear in the circuit, and also that hosting festivals indeed increases representation. The intercept of corresponds to the expected N for (or a hypothetical mid-sized country at) the reference values of the variables, i.e. 10M population, $10k per capita, hosting zero events, located where France is. Since this is a log-log model, the coefficients are directly interpretable as percent changes. A 1% change in population (with everything else held constant) leads to a 0.72% increase in predicted N; e.g. for a country of 10M, 1% or 100k more people predicts or almost one more appearance (where n is the predicted number of N appearances: , where c is the 10M-centered target population . A million people more predicts about 8 more appearances. However the interaction is also significant, indicating that their effect is multiplicative: having both a large population and a high GDP per capita boosts festival appearances more than just being big or just wealthy.
Distance from France is significant and negative: for each additional 1000 kilometers, N decreases by a multiplicative factor of , or in percent by . Notably, this factor is significant even in this model that controls for GDP per capita (so it is not just an effect of many less prosperous countries e.g. the Global South being far from Europe). A simpler model just predicting N by distance describes about 7% in variance. The fact that even this crude proxy to geographical effects holds predictive power indicates that where a country is located may significantly affect their chances at festival representation.
In summary, most of the variation in how many films get screened from each country comes down to their size, wealth, where they are relative to Europe, and how many festivals they host themselves. While this is somewhat obvious, a statistical model like this allows for a more precise quantification of that intuition.
Coming back to Figure 3.C: the residuals of this model indicate which countries are near their predicted values (those around zero), which do better than average and which worse. The zero is effectively the regression line, and can be thought of as the global average prediction. The residuals are on the same scale, so e.g. a value of 1 means the country appears 10x more in the circuit than would be expected by the aforementioned factors. For example, Argentina, despite its moderate average GDP per capita of $12k and about 44M population in the period, has N=2041 screenings listed in the database, compared to e.g. France at 6759. It is shown below how this may be boosted by a local festival circuit. The more than 10 times smaller Uruguay still has 270 appearances (of 142 films) on record. France on the other hand performs almost exactly as predicted, despite hosting a large array of festivals. USA and China have considerably lower N than would be expected by their size, and in the case of USA, also its prosperity; but as discussed above, this may also be an effect of local markets and festivals. UK is shown to under-perform despite its prosperity and arguably favorable position in European audiovisual industries, especially in the pre-Brexit era that is part of the observation period here [12, 27]. Afghanistan is among countries with a rather high positive residual: despite its very low GDP and other factors, it is listed on 47 appearances of 26 films in total in 2012-2021, although 23 of them appear to be co-productions with mostly European countries. Many small European countries also beat the odds, including Iceland and Luxembourg, but also Estonia, Latvia and Lithuania (all below 3 million in size), likely reflecting recent of their film and television industries [[, cf.]]hjort_cinema_2007,iosifidis_public_2007,ibrus_searching_2019,ibrus_quantifying_2023.
3.3 Cultural flows of festival films between countries of the world
These results raise the questions of how do films travel between countries and festivals, how many screenings come down to (potentially favorable) local festivals, and do countries differ in terms of the cultural "trade balance" of exporting their own films to foreign festivals and "importing" films to be shown at locally hosted festivals. These questions have been explored in terms of cinema but not festivals in the past, and usually on a country rather than world scale [45, 1, 8, 7]. While all these topics likely deserve a study each, this section attempts to shed some light on these global dynamics and cultural flows [[, see also]]fu_examining_2010,christensen_transnational_2013,kawashima_asian_2018,hartley_digital_2020. This analysis is of course still limited to festivals and does not consider other screening venues.
This requires once again choosing between potential aggregation approaches. In the analyses above, every instance of a screening of a film produced or co-produced by a country counted equally for simplicity. This is fitting if one is interested whether a country is represented in a festival or in the circuit as such. In this section, a slightly more nuanced approach is taken, and the counts and shared are weighted by the number of co-producers, for a hopefully more accurate picture of cultural flows. The unit is still one screening at a festival. For example, a film produced by country A and shown in a festival in country X adds a count of 1 in the direction from A to X; while a film co-produced by countries A and B adds 0.5 for each instead.
Figure 4.A illustrates the flow of films between the largest producers and festival hosts. Not all those listed are large producers, for example Estonia once again appears because of its Tallinn Black Nights film festival, which screens a fairly large number of films yearly. Normalized by rows (producers), the diagonal of the matrix effectively displays the share of a given country’s productions that are screened locally. For some countries this is quite high: 61% for Greece (at two festivals, the Thessaloniki Documentary Festival and the Thessaloniki IFF). For Argentina and France this is 42 and 41%. For others like China and Japan (and on average other countries) domestic screenings are at or below 10%. Some countries export a considerable share of their films to a single destination (e.g. a fourth of Belgian film screenings at French festivals — not surprising given the geographic proximity and one shared national language). Some relationships are reciprocal: the UK screens almost a tenth of their films in the USA and vice versa, although the primary non-domestic destination for US films is France (18%). The latter is also an important destination for the UK at 14% (or 311 screenings), but interestingly not so much the other way around, with only 3% or 143 French screenings in the UK [[, see also]]mazdon_je_2010. A larger version of this graph may be found in the Supplementary materials appendix.
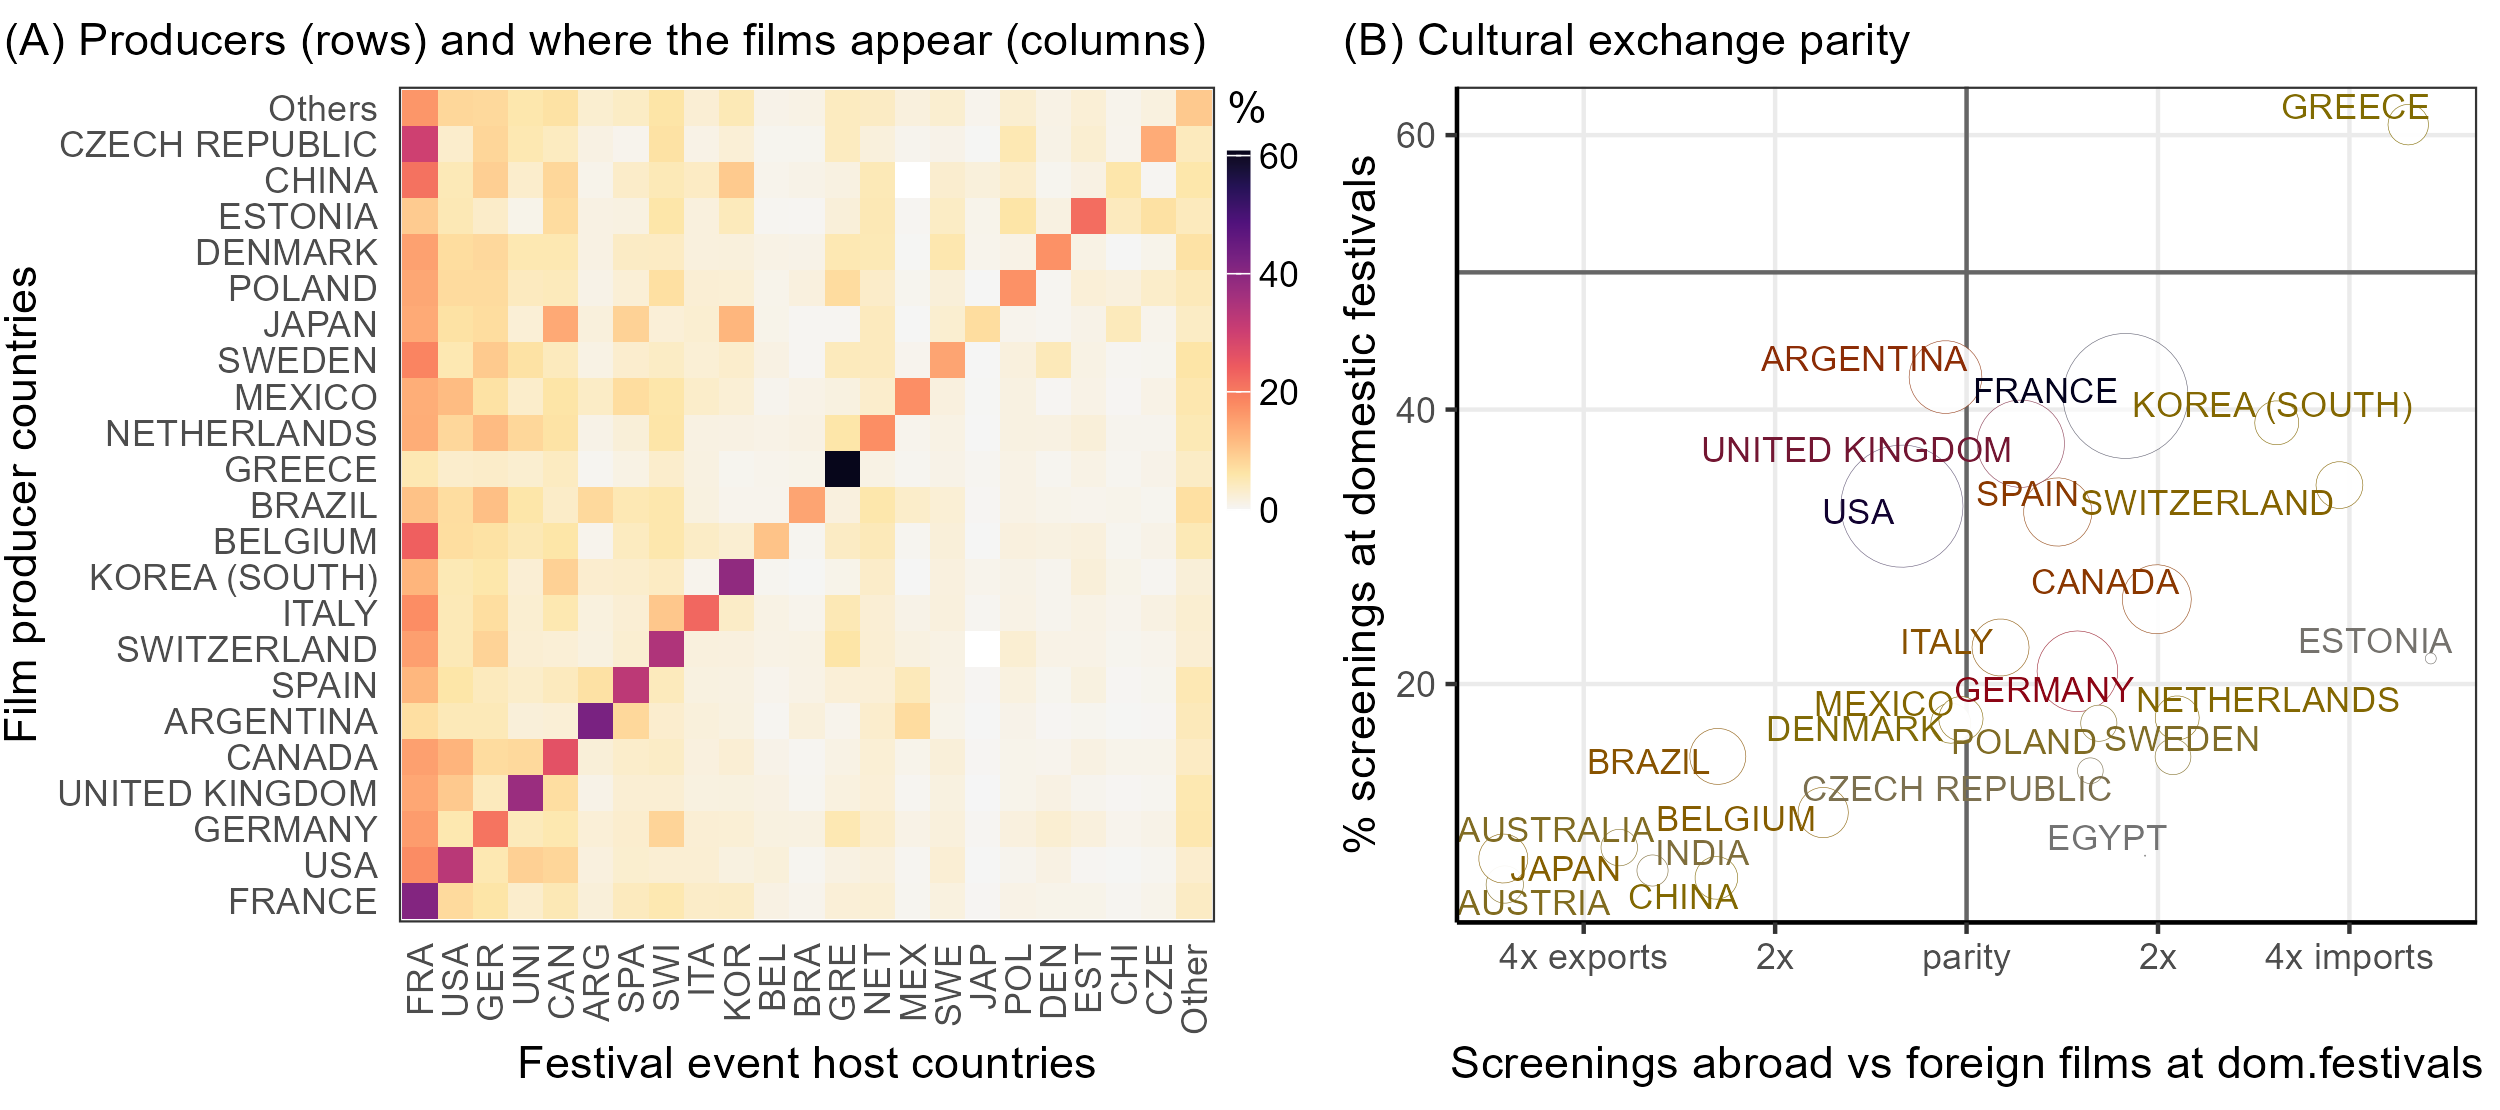
Not all countries in the database are recorded as hosting any festivals, which means their incoming number of films here is zero. Figure 4.B shows a sample of countries which have hosted (at least 5) festival events, arranged across an export-import parity axis. This is calculated simply as a multiplicative difference or (where e.g. a value of 1 means 2x more imports than exports, 2 is 4x more etc). Here imports are defined for each country as the sum of (weighted) screening instances where the producer is not the given country, and exports as the sum of instances where a given country is a producer but not the host. The vertical axis shows how many screenings of a country’s own films happen at their own festivals (effectively the diagonal of the left side panel). Smaller production countries like Estonia and Sweden import more than they export, but France, despite its large production volume, also screens 1.8x more foreign films than it shows its own films abroad, likely due to its large internal festival circuit (76 events in 19 series in 2012-2021). Along with other large production countries like the UK, USA and Argentina, they shows a fair share of their films at home. The USA is a net 1.3x exporter, which is not surprising [45, 55]. The largest countries China and India are in the bottom left, exporting 2.5 and 3.1x more, and screening their productions largely in festivals abroad. This is however according to the somewhat Euro-centric Cinando database, which for example lists only the Shanghai and Beijing IFF as Chinese festivals. It is entirely possible that while Chinese films in western festivals get listed in the database, the share of local Chinese festivals may simply not be represented here [[, cf.]]ma_regarding_2014.
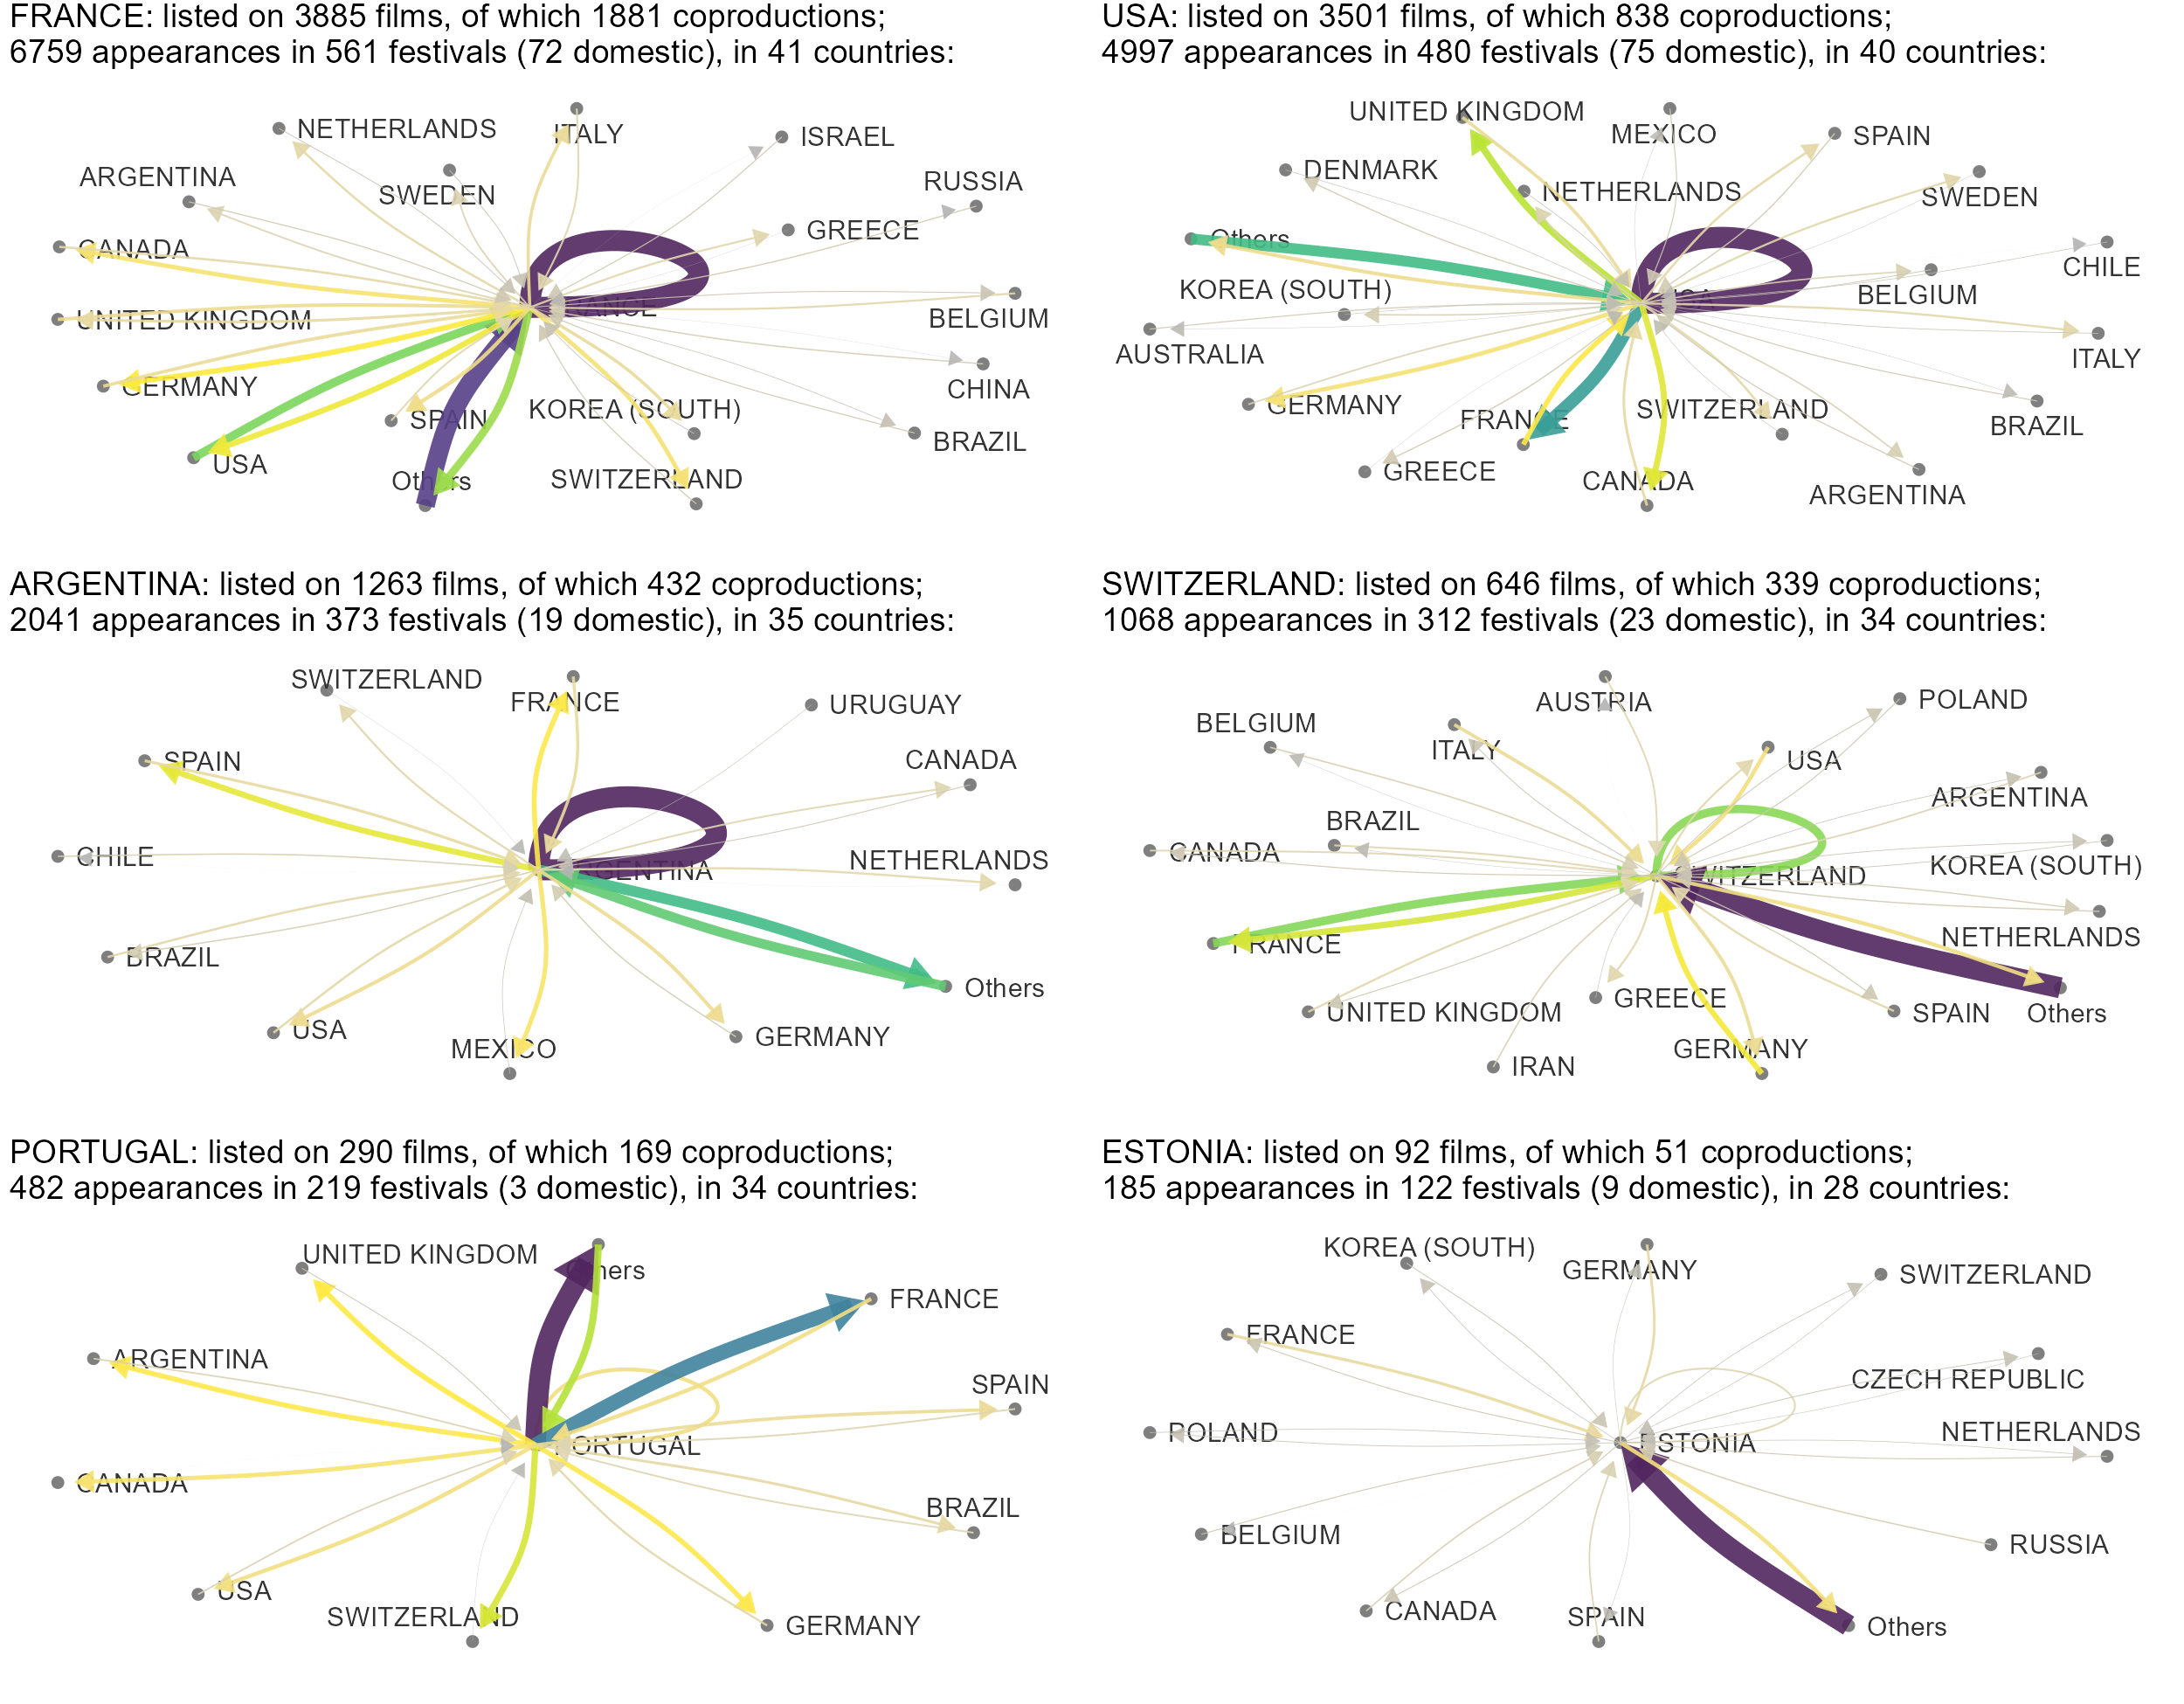
Figure 5 further illustrates the flow of festival films for a selection of countries, ranging again from large producers like France and the USA to small players like Estonia and Portugal, which also rely more on international co-productions. The data is aggregated as above. These networks only show the inflow and outflow for each target country at a time. With the arrow size indicating relative counts, one this that is immediately striking is the difference in the sizes of the local circuits, visible as the looping edge. As also shown in Fig. 4.A, countries also differ in their cultural trade partner distributions, with some sending and receiving films from a variety of nations while others being somewhat more focused on certain destinations like the UK to France. Some links here are also due to co-productions, e.g. a film jointly produced by Portugal and Spain and screened at the San Sebastian Film Festival would still count (at a 0.5 weight) towards a link from the latter to the former.
It should also be noted that this snapshot of the Cinando database ends in 2021, therefore not reflecting the state of the festival industry since then, including the banning of Russia from major film festivals following its military invasion into Ukraine in 2022 [58], or the defunding of the Argentinian national film body in 2024 [20].
3.4 How much diversity is gained by including films from smaller countries?
As illustrated in the beginning in Figure 1, a handful of the largest production countries make up the lion’s share of the screenings across festivals. Yet the circuit is not as dominated by large and prosperous countries as it could be, were representation entirely proportional to population or the offerings in perfect correlation with relative GDP (Fig. 2). It has been shown in recent research that festivals vary significantly in terms of diversity along multiple dimensions, including gender balance, and thematic, linguistic and geographic diversity [61]. While some are regional and focus on a films from one or a few countries, others are highly international. There are thematically concentrated festivals like Cannes or Karlovy Vary (75% or more drama genre in some years) or Hot Docs and DocCorner; festivals that screen films predominantly in one language like Spanish in Latin America (Guadalajara, Ventana Sur) or Sundance in English, yet others where no one language takes up much more than 10% (Tallinn Black Nights in 2019). Similar variation can be found in regional versus international representation. And when it comes to gender, some festivals like Göteborg or Hot Docs often have an almost equal balance, while others can be male-dominated in some years to the point of featuring no women directors at all [[, see]]zemaityte_quantifying_2024,verhoeven_re-distributing_2019,ehrich_film_2022.
A question that has been raised is how much diversity (and potential public value) is added to cultural and audiovisual spheres, including the film festival circuit, by including products of smaller or peripheral countries [52, 61, 27, 17, 62]. While it would be difficult to directly measure the exact contribution of individual countries, it is fairly trivial to simulate what the circuit would look like without certain countries, and interpolate their estimated contribution from that. For example, if removing a group of countries from the dataset does not induce a change in the (macro-level, ecosystem) "external" diversity [[, following]]mcquail_diversity_1983,zemaityte_quantifying_2024, it can be surmised that their contribution to the given dimension of diversity was negligible. For details about the simulation, diversity calculation and bootstrapping, see Methods. As in the previous section, if a film has multiple tags (here languages), their contribution is weighted so they sum to 1. Genres are averaged, so each film only has one thematic vector (which also means they cannot be meaningfully counted).
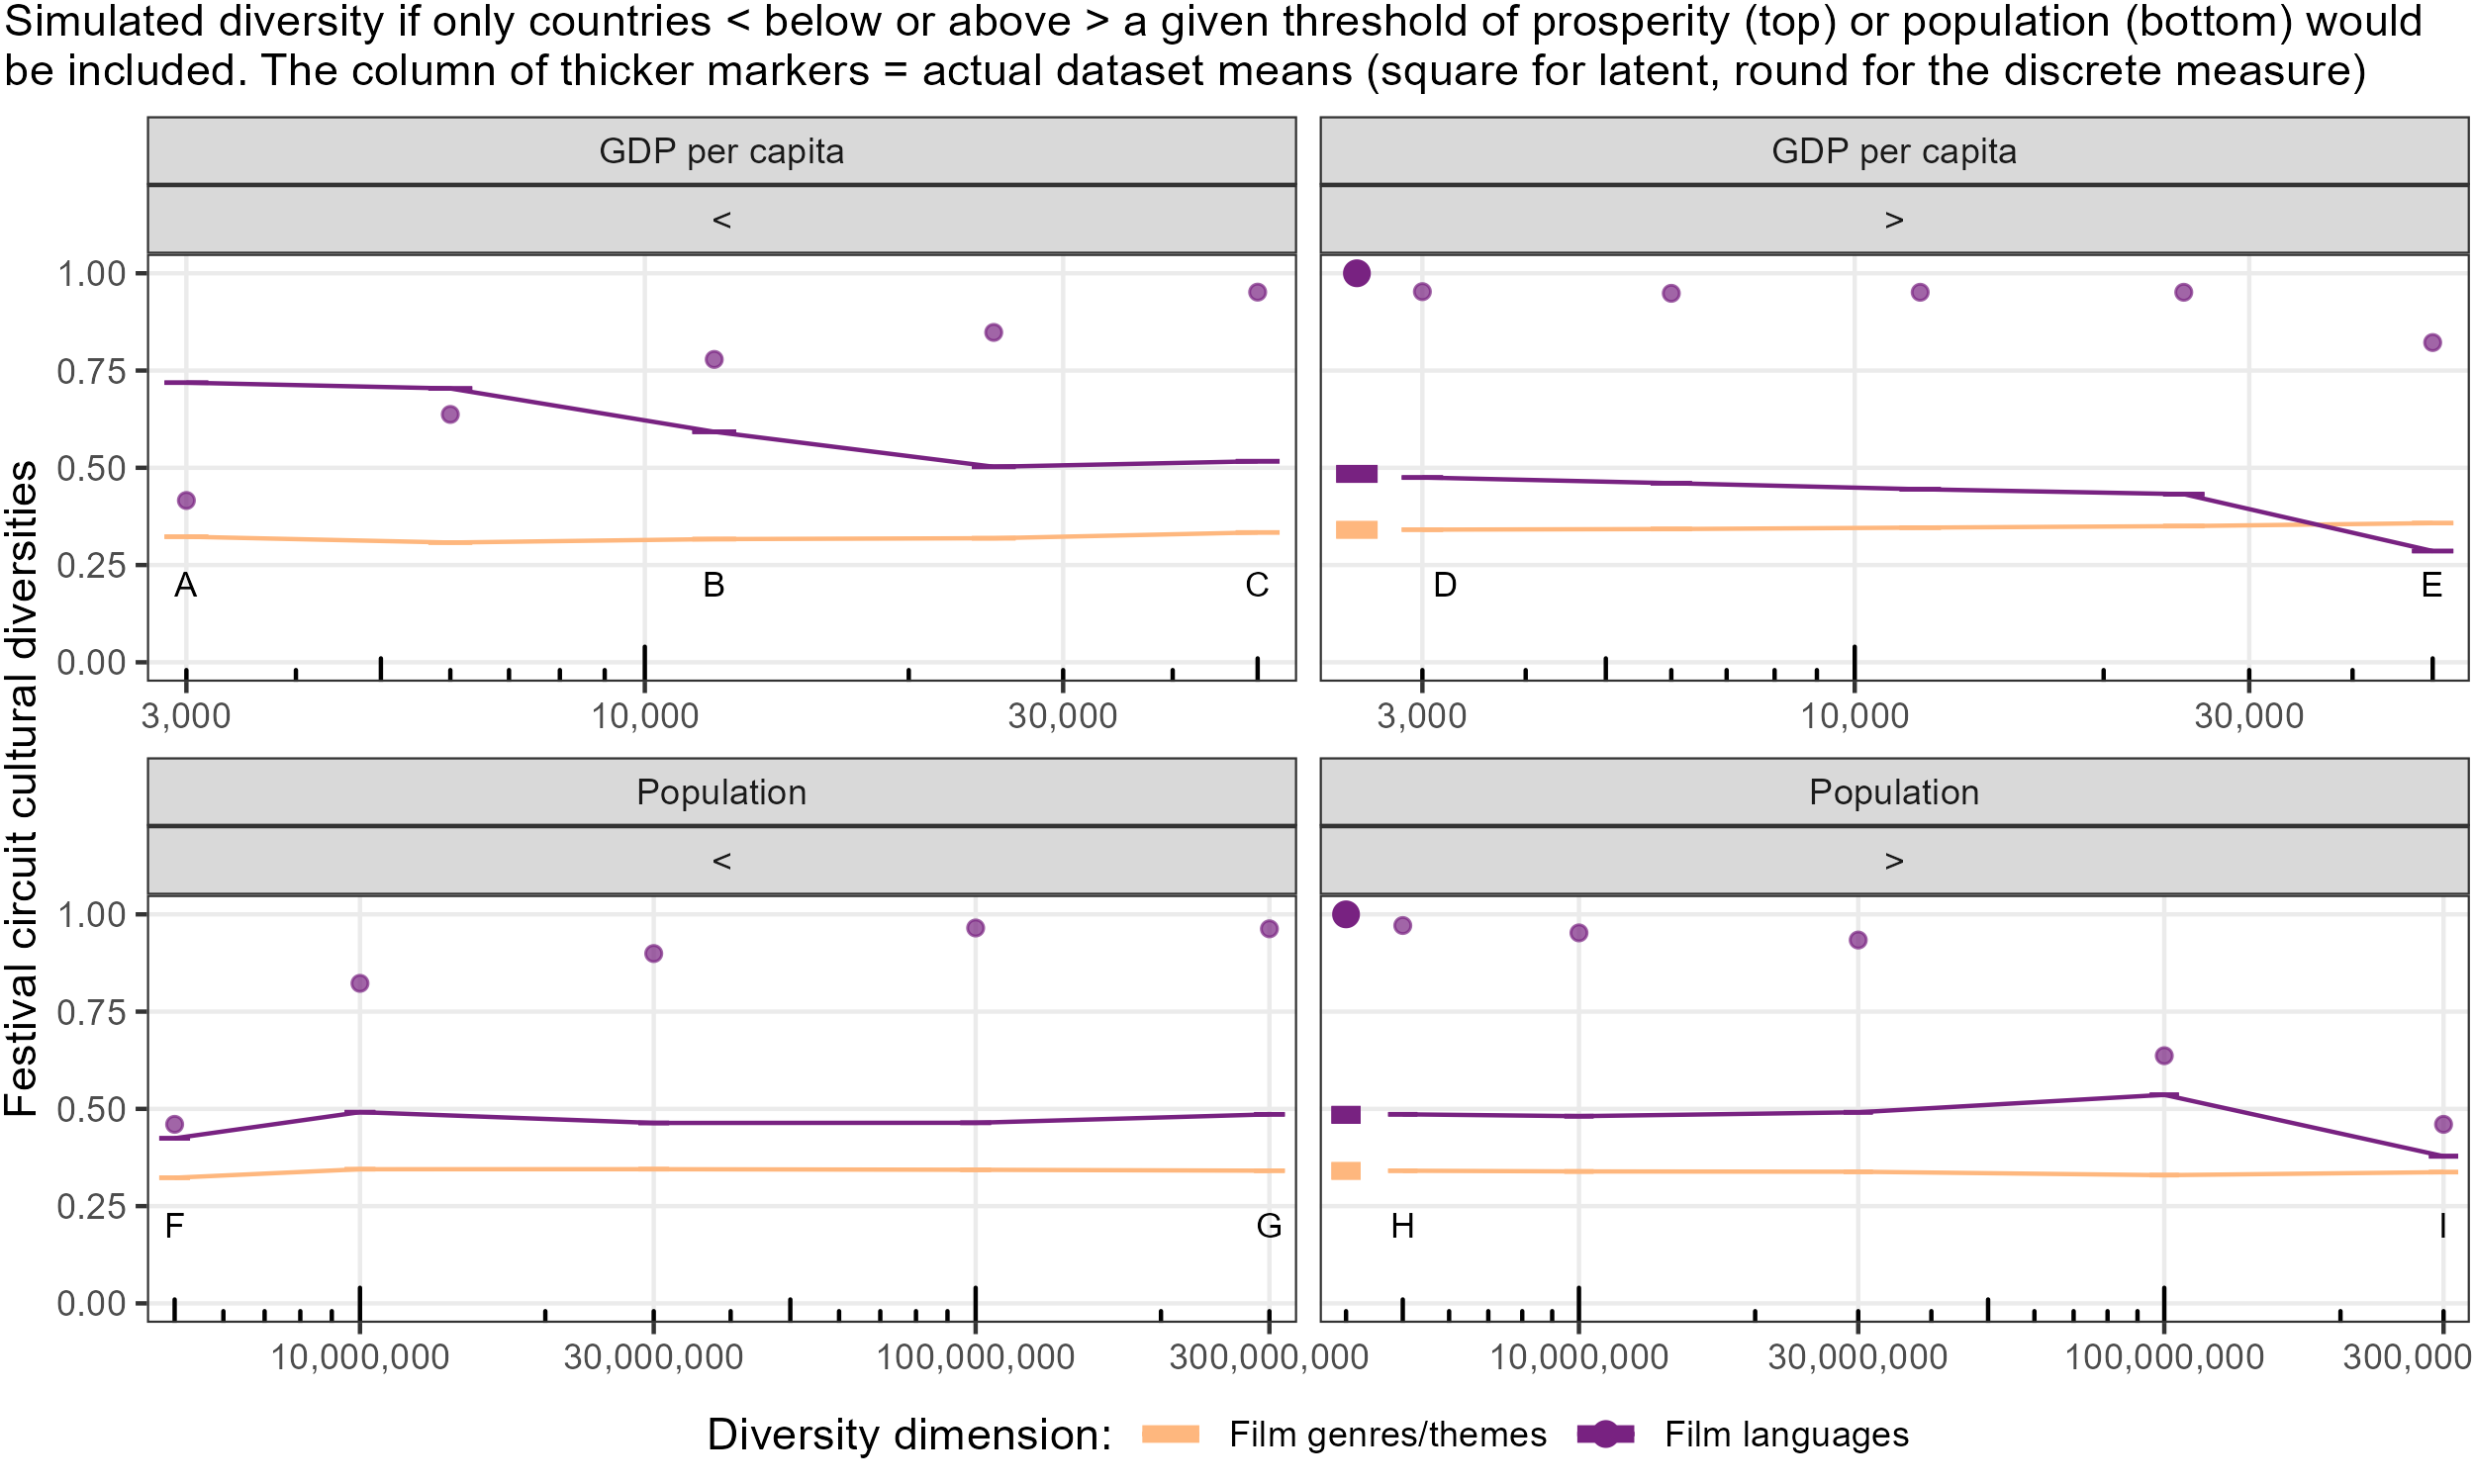
The simulation illustrated in Figure 6 is simple: for both GDP per capita (top) and population (bottom), each marked position depicts the re-calculated diversity after removing larger and wealthier countries (left) and progressively the smaller and less wealthy countries (right). Neither dimension is of course a direct cultural diversity measure as such, but can be considered as proxies or rough estimates of cultural representation. The figure shows diversity as a continuous measure (lines) and additionally as discrete counts for languages (as a percent of the actual circuit total).
To break these results down: first of all, thematic diversity is practically unaffected and remains the same flat line regardless of the composition of the hypothetical festival circuit scenarios. Removing small or less prosperous countries from the circuit would not affect thematic diversity, but neither would doing the opposite, indicating that on average, a large set of small countries can produce as much thematic variation as a small group of the largest ones. This may be somewhat of an artifact of the data however, where about a fourth of all screening entries contain "drama" as a thematic tag anyway, closely followed by "documentary", with the other tags much less frequent each. A more thorough analysis of actual film content would likely provide more interesting results.
Linguistic diversity is slightly more complex. A circuit comprising of only the 47 poorest countries (top left) has only about half the current languages represented, but the latent diversity is slightly higher, reflecting the high typological dissimilarity of languages outside of wealthy western countries. However, removing all these countries from the circuit (pointer D in Fig. 6) barely affects its global diversity average. The circuit only becomes somewhat less diverse past the $50k, i.e. if it would consist of only the very wealthiest nations like Singapore, USA, etc. This is somewhat surprising, but explainable by the high number of languages present in the diverse productions of these large film industries. It is also not impossible that some film entries may lack the full list of co-production countries.
When it comes to population, removing larger countries (bottom left) has again little effect on latent linguistic diversity, although of course the counts fall similarly as for GDP. The other way around, removing the 50 smallest countries of up to 5M population — including countries like Iceland, Estonia, Luxembourg or Uruguay — makes little difference. A part of the reason is that this is not a comparison against some model of fair representation, but the current state of affairs, and their share in the current circuit is already quite small, so removing them does not change that much. A hypothetical circuit consisting of only (contributions proportional to the current circuit from) the USA, India and China, as depicted in the bottom right, would be dominated by English, and have less than half (52) of the current languages present. Yet, the latent linguistic diversity would fall only marginally, as the share of otherwise frequent and similar Indo-European languages like French and Spanish would fall, while a fairly large number of diverse languages would still be present. In summary, when it comes to cultural diversity — as represented by languages spoken in films and their thematic genre — small countries currently add very little from a purely global position. They however make up only a small part of the circuit as of now, whereas a hypothetical circuit of just smaller countries would be as or almost as diverse along these two dimensions, compared to current reality. The interpretation is, therefore, that smaller countries may harbor untapped potential to increase linguistic and cultural diversity in the festival ecosystem. Of course such a simplified global aggregation neither is nor should be the only perspective to diversity, and festivals often serve many (if not more) local cultural, artistic economic and other functions discussed in the Introduction.
4 Discussion
This contribution has attempted to provide a global-scale quantification of national representation in the film festival circuit from an (admittedly simplified) demographic and economic perspective, and to explore the dynamics and cultural flows shaping the festival network, which in turn impacts the economies and cultural landscapes of the production and event host countries. Rather than conclusive outcomes, these results and methodological proposals are meant more as a stepping stones towards deeper and more contextualized research of the festival ecosystem and cultural value generation, building on and complementing recent investigations of the festival circuit via the Cinando database [61, 62]. A number of simplifications were made, including due to the nature of the data, and the subsequent limitations should be kept in mind when interpreting the results, but can also hopefully be improved upon in the future.
For example, the diversity simulation in the last Results subsection is of course a very coarse first analysis, as cultural diversity (and public value) has many more dimensions. The global averaging also simplifies and overlooks the value that regional festivals can provide by platforming local or nearby made films, as well as the (both symbolic and economic) value that can be gained by emerging industries and filmmakers from being showcased at prestigious international film festivals. It is hoped however that this methodological proposal paves the way for a more systematic and data-driven approach to cultural diversity and relatedly, public value, a domain which has otherwise remained rather theoretical in the context of film festival and audiovisual industries research [[, but see]]faulkner_avoiding_2018,ibrus_quantifying_2023,zemaityte_quantifying_2024,zemaityte_peripheral_nodate.
An aspect that was touched upon here but deserves further study are the patterns and dynamics of co-productions [3, 48]. Many of the country examples brought here exhibit high rates of international production, with some co-producing half or more of their festival films (see Figure 5). The production patterns are also likely predictive of cultural flows, as films produced jointly may well subsequently enjoy reception at festivals in all involved co-producer countries.
Beyond the bias analysis, here there was also little attention paid to the categorization of festivals as the accredited A-list and the rest, which of course comes into play in representation and success, given the know variance in competitiveness and functions of these events [61, 62]. A related major limitation imposed by the nature of the dataset is the lack of information on rejection. While the Cinando database provides details on festival programming, there was no way to tell how many films a given country actually sends to a given festival and what share gets selected, and whether there is bias towards or against some countries. Obtaining this information would greatly support the understanding of both the dynamics of individual festivals as well as the circuit as a whole. It would also enable a more informative modeling of representation and its various potential predictors, which was done here in a coarse manner, simply counting screenings per country. Future research could also incorporate more precise factors of film industry revenues instead of country GDP, or factors of cultural proximity between producer and host countries [19]. The latent embedding approach proposed in [61] is suitable for computing both diversity and similarity, in a manner that goes beyond discrete counts of cultural markers or categories and allows for taking into account their intra-similarity. The diversity analysis above considers thematic genre, but further content factors as well as the perceived quality and novelty of a film likely affect its success at festivals, and likely interpersonal, professional network and personal prestige based factors and biases too [10, 7, 39, 13].
It is nevertheless hoped that these analyses and methodological considerations provide support for further quantitative research into film festivals. The preliminary insights could be useful for researchers of the topic but perhaps also for festival organizers and policymakers, providing a data-driven perspective and complementary ways of thinking about analysing film festival programming, their socioeconomic aspects, as well as diversity and balance.
5 Conclusions
Film festivals provide a platform for filmmakers to showcase their work, boost economies, enhance cultural spheres and promote international interactions, can give the spotlight to underrepresented voices and narratives through selective programming, and therefore can either directly or indirectly create public value. At the same time, the global festival circuit, as represented in the Cinando database, is dominated by a few successful production countries. This contribution has endeavoured to measure this apparent bias, discuss quantifiable models of screen equality, show that representation at festivals is highly predictable by socioeconomic factors, and explore global cultural flows of festival films. The preliminary results show that while the circuit is indeed saturated by films from large affluent western nations, it also platforms smaller countries, which have potential to increase cultural diversity in the festival circuit.
Acknowledgements
The author would like to thank Vejune Zemaityte for fruitful discussions on the bias and diversity analysis and initial graphs, and for sharing a festival accreditation list aligned with the dataset; also Indrek Ibrus, Ulrike Rohn and Maximilian Schich for earlier instructive discussions on the analysis of festival data and public value. The author is supported by the CUDAN ERA Chair project for Cultural Data Analytics, funded through the European Union Horizon 2020 research and innovation program (Project No. 810961).
Data availability
The Cinando database snapshot is available via https://doi.org/10.6084/m9.figshare.22682794.v1 (Cinando technical ID values are anonymized).
The data are also available to explore via an interactive dashboard that accompanied the first Cinando-related publication:
https://fiapf.org/festivals/accredited-festivals/competitive-feature-film-festivals.
The FIAPF accreditation list is available via https://fiapf.org/festivals/accredited-festivals.
The population and GDP data were retrieved from the World Bank database available via
https://data.worldbank.org/indicator.
The UIS film production statistics are available via https://data.uis.unesco.org.
References
- [1] Giorgio Avezzù ‘‘The Market for Foreign Cinema in Contemporary Italy: A Geography of Film Consumption’’ In GeoJournal 87.1, 2022, pp. 73–84 DOI: 10.1007/s10708-022-10639-y
- [2] ‘‘Public Value: Theory and Practice’’ Basingstoke (GB): Bloomsbury Publishing, 2011
- [3] Ib Bondebjerg ‘‘Transnational Europe: TV-drama, Co-Production Networks and Mediated Cultural Encounters’’ In Palgrave Communications 2, 2016, pp. Article 16034 DOI: 10.1057/palcomms.2016.34
- [4] Peter Bosma ‘‘Film Programming: Curating for Cinemas, Festivals, Archives’’ Chichester (NY): Columbia University Press, 2015 DOI: 10.7312/bosm17459
- [5] Diane Burgess ‘‘Capturing Film Festival Buzz: The Methodological Dilemma of Measuring Symbolic Value’’ In NECSUS 9.2, 2020, pp. 225–247 DOI: 10.25969/mediarep/15318
- [6] Miyase Christensen ‘‘TransNational Media Flows: Some Key Questions and Debates’’ In International Journal of Communication 7.0, 2013, pp. 2400–2418 URL: https://webcache.googleusercontent.com/search?q=cache%3Ahttps%3A%2F%2Fijoc.org%2Findex.php%2Fijoc%2Farticle%2Fview%2F1879&rlz=1C1KNTJ_enEE1100EE1100&oq=cache%3Ahttps%3A%2F%2Fijoc.org%2Findex.php%2Fijoc%2Farticle%2Fview%2F1879&gs_lcrp=EgZjaHJvbWUyBggAEEUYOTIGCAEQRRg60gEIMjM1OGowajSoAgCwAgE&sourceid=chrome&ie=UTF-8
- [7] Bronwyn Coate, Deb Verhoeven, Colin Arrowsmith and Vejune Zemaityte ‘‘Feature Film Diversity on Australian Cinema Screens: Implications for Cultural Diversity Studies Using Big Data’’ In Australian Screen in the 2000s Cham: Palgrave Macmillan, 2017, pp. 341–360
- [8] Diana Crane ‘‘Cultural Flows and the Global Film Industry: A Comparison of Asia and Europe as Regional Cultures’’ In Asian Cultural Flows: Cultural Policies, Creative Industries, and Media Consumers Singapore: Springer, 2018, pp. 113–126 DOI: 10.1007/978-981-10-0147-5_7
- [9] Marijke Valck ‘‘Film Festivals: From European Geopolitics to Global Cinephilia’’ Amsterdam (NL): Amsterdam University Press, 2007
- [10] Marijke Valck ‘‘Fostering Art, Adding Value, Cultivating Taste: Film Festivals as Sites of Cultural Legitimization’’ In Film Festivals: History, Theory, Method, Practice London (GB): Routledge, 2016, pp. 100–116
- [11] Marijke Valck ‘‘Introduction: What Is a Film Festival? How to Study Festivals and Why You Should’’ In Film Festivals: History, Theory, Method, Practice London (GB): Routledge, 2016, pp. 1–11
- [12] Karen Donders and Hilde Van Bulck ‘‘Decline and Fall of Public Service Media Values in the International Content Acquisition Market: An Analysis of Small Public Broadcasters Acquiring BBC Worldwide Content’’ In European Journal of Communication 31, 2016, pp. 299–316
- [13] Martha E. Ehrich, Katharina Burgdorf, Zhenya Samoilova and Skadi Loist ‘‘The Film Festival Sector and Its Networked Structures of Gender Inequality’’ In Applied network science 7.1, 2022, pp. 1–38 DOI: 10.1007/s41109-022-00457-z
- [14] Thomas Elsaesser ‘‘European Cinema: Face to Face with Hollywood’’ Amsterdam (NL): Amsterdam University Press, 2005
- [15] Betty Farrell ‘‘Understanding the Value of Arts & Culture: The AHRC Cultural Value Project (2016) by Geoffrey Crossick and Patrycja Kaszynska’’ In Cultural Trends 25.4 Routledge, 2016, pp. 273–276 DOI: 10.1080/09548963.2016.1241382
- [16] Nicholas Faulkner and Stefan Kaufman ‘‘Avoiding Theoretical Stagnation: A Systematic Review and Framework for Measuring Public Value’’ In Australian Journal of Public Administration 77.1, 2018, pp. 69–86 DOI: 10.1111/1467-8500.12251
- [17] Steven Félix-Jäger ‘‘The Effects of Globalization on Art and Aesthetics’’ In Art Theory for a Global Pluralistic Age: The Glocal Artist Cham: Springer International Publishing, 2020, pp. 39–63 DOI: 10.1007/978-3-030-29706-0_3
- [18] FIAPF ‘‘Accredited Festivals’’, 2023
- [19] W. Fu and Clarice Sim ‘‘Examining International Country-to-Country Flow of Theatrical Films’’ In Journal of Communication 60.1, 2010, pp. 120–143 DOI: 10.1111/j.1460-2466.2009.01455.x
- [20] Gabriella Geisinger ‘‘Argentinian Government Suspends State Funding to National Film Body INCAA’’, 2024 Screen Daily URL: https://www.screendaily.com/news/argentinian-government-suspends-state-funding-to-national-film-body-incaa/5191550.article
- [21] World Bank Group ‘‘World Development Indicators’’, 2024 URL: https://data.worldbank.org/indicator
- [22] Sandra Grunwell and Inhyuck Ha ‘‘Film Festivals: An Empirical Study of Factors for Success’’ In Event Manag 11.4, 2008, pp. 201–210 DOI: 10.3727/152599508785899893
- [23] Miaofang Guan, Fabrício H Chagas-Bastos and Marislei Nishijima ‘‘Winning Hearts and Minds: Soft Power, Cinema, and Public Perceptions of the United States and China in Brazil’’ In Global Studies Quarterly 3.2, 2023, pp. ksad029 DOI: 10.1093/isagsq/ksad029
- [24] Janet Harbord ‘‘Film Cultures’’ London (GB): Sage, 2002
- [25] John Hartley, Indrek Ibrus and Maarja Ojamaa ‘‘On the Digital Semiosphere: Culture, Media and Science for the Anthropocene’’ New York (NY): Bloomsbury Publishing, 2020
- [26] ‘‘The Cinema of Small Nations’’ Edinburgh University Press, 2007 JSTOR: https://www.jstor.org/stable/10.3366/j.ctt1r1xcf
- [27] Indrek Ibrus, Andres Karjus, Vejune Zemaityte, Ulrike Rohn and Maximilian Schich ‘‘Quantifying Public Value Creation by Public Service Media Using Big Programming Data’’ In International Journal of Communication 17, 2023, pp. 24
- [28] Indrek Ibrus and Maarja Ojamaa ‘‘What Is the Cultural Function and Value of European Transmedia Independents?’’ In International Journal of Communication 8.0, 2014, pp. 18 URL: https://ijoc.org/index.php/ijoc/article/view/2650
- [29] Indrek Ibrus, Ulrike Rohn and Alessandro Nanì ‘‘Searching for Public Value in Innovation Coordination: How the Eurovision Song Contest Was Used to Innovate the Public Service Media Model in Estonia’’ In Int J Cult Stud 22.3, 2019, pp. 367–382 DOI: 10.1177/1367877918757513
- [30] Petros Iosifidis ‘‘Public Television in Small European Countries: Challenges and Strategies’’ In International Journal of Media & Cultural Politics 3.1 Intellect, 2007, pp. 65–87 DOI: 10.1386/macp.3.1.65_1
- [31] Nobuko Kawashima and Hye-Kyung Lee ‘‘Asian Cultural Flows’’ Springer, 2018
- [32] Graham Kendall, Jimmy H.. Chan, Matthew C.. Yeung and Kuok Kei Law ‘‘Do Film Festivals Attract Tourists?’’ In Current Issues in Tourism Routledge, 2021 URL: https://www.tandfonline.com/doi/full/10.1080/13683500.2020.1758041
- [33] Stella Kostopoulou, Nikolaos Vagionis and Dimitris Kourkouridis ‘‘Cultural Festivals and Regional Economic Development: Perceptions of Key Interest Groups’’ In Quantitative Methods in Tourism Economics Heidelberg: Physica-Verlag HD, 2013, pp. 175–194 DOI: 10.1007/978-3-7908-2879-5_10
- [34] Tanja C. Krainhöfer ‘‘Mapping of Collaboration Models among Film Festivals: A Qualitative Analysis to Identify and Assess Collaboration Models in the Context of the Multiple Functions and Objectives of Film Festivals’’, 2018
- [35] Locarno Film Festival ‘‘Annual Report 2022’’, 2022 URL: https://www.locarnofestival.ch/about/organization/annual-report.html
- [36] Skadi Loist ‘‘The Film Festival Circuit: Networks, Hierarchies, and Circulation’’ In Film Festivals: History, Theory, Method, Practice London (GB): Routledge, 2016, pp. 49–64
- [37] Ran Ma ‘‘Regarding the Grassroots Chinese Independent Film Festivals: Modes of Multiplicity and Abnormal Film Networking’’ In China’s iGeneration: Cinema and moving image culture for the twenty-first century Bloomsbury Academic New York, 2014, pp. 235–253
- [38] Robin MacPherson ‘‘Is Bigger Better? Film Success in Small Countries – the Case of Scotland, Ireland and Denmark.’’, 2010 URL: https://napier-repository.worktribe.com/output/208629
- [39] Judith Mair and Michelle Duffy ‘‘The Role of Festival Networks in Regional Community Building’’ In Located Research: Regional Places, Transitions and Challenges Singapore: Springer Nature, 2020, pp. 89–116 DOI: 10.1007/978-981-32-9694-7_7
- [40] Chaitanya Malaviya, Graham Neubig and Patrick Littell ‘‘Learning Language Representations for Typology Prediction’’, 2017 arXiv:1707.09569 DOI: 10.48550/arXiv.1707.09569
- [41] David Martin-Jones and María Soledad Montañez ‘‘Uruguay Disappears: Small Cinemas, Control Z Films, and the Aesthetics and Politics of Auto-Erasure’’ In Cinema Journal 53.1 Michigan Publishing, 2013, pp. 26–51 URL: https://muse.jhu.edu/pub/15/article/523400
- [42] Lucy Mazdon and Catherine Wheatley ‘‘Je T’Aime… Moi Non Plus: Franco-British Cinematic Relations’’ Berghahn Books, 2010 GOOGLEBOOKS: N0LmrUFWBl4C
- [43] Mariana Mazzucato, Rowan Conway, Eleonora Maria Mazzoli, Eva Knoll and Sarah Albala ‘‘Creating and Measuring Dynamic Public Value at the BBC’’, 2020
- [44] Denis McQuail and Jan J. Van Cuilenburg ‘‘Diversity as a Media Policy Goal: A Strategy for Evaluative Research and a Netherlands Case Study’’ In International communication gazette 31.3, 1983, pp. 145–162 DOI: 10.1177/001654928303100301
- [45] Gianpiero Meloni, Dimitri Paolini and J.. Tena ‘‘American Beauty: Trade Flows and Export Costs of US Movies’’ In Journal of Cultural Economics 42.4, 2018, pp. 701–716 DOI: 10.1007/s10824-018-9324-6
- [46] Quin Monson, Sven Wilson and Jay Goodliffe ‘‘Economic Impact: 2023 Sundance Film Festival’’, 2023 URL: https://drive.google.com/file/d/1XeKyXBNLXZAnl2FrZEJMMfXVh_Bn1P7F/view?usp=sharing&usp=embed_facebook
- [47] Tom O’Regan and Anna Potter ‘‘The Past and Future of Public Value: The End of an Illustrious Career or Its Reinvention?’’ In A Companion to Motion Pictures and Public Value Hoboken (NJ): John Wiley & Sons, 2022, pp. 427–444
- [48] Jimmyn Parc ‘‘Understanding Film Co-Production in the Era of Globalization: A Value Chain Approach’’ In Global Policy 11.4, 2020, pp. 458–465 DOI: 10.1111/1758-5899.12830
- [49] María Paz Peirano ‘‘Mapping Histories and Archiving Ephemeral Landscapes: Strategies and Challenges for Researching Small Film Festivals’’ In Stud Eur Cine 17.2, 2020, pp. 170–184 DOI: 10.1080/17411548.2020.1765630
- [50] Carole Roy ‘‘Telling Stories of Resistance and Change: Organizers of Film Festivals Contribute to Media Literacy’’ In Canadian Journal for the Study of Adult Education 26.3, 2014 URL: https://cjsae.library.dal.ca/cjsae/article/view/2928
- [51] Charles-Clemens Rüling and Jesper Pedersen ‘‘Film Festival Research from an Organizational Studies Perspective’’ In Scandinavian Journal of Management 26, 2010, pp. 318–323 DOI: 10.1016/j.scaman.2010.06.006
- [52] Stine Agnete Sand ‘‘Small Places, Universal Stories. Diversity, Film Policy and the Geographical Dimension of Filmmaking’’ In Nordisk kulturpolitisk tidsskrift 22.1 Universitetsforlaget, 2019, pp. 8–25 DOI: 10.18261/ISSN2000-8325-2019-01-02
- [53] Joseph D. Straubhaar ‘‘Beyond Media Imperialism: Assymetrical Interdependence and Cultural Proximity’’ In Critical Studies in Mass Communication 8.1 Routledge, 1991, pp. 39–59 DOI: 10.1080/15295039109366779
- [54] Julian Stringer ‘‘Global Cities and the International Film Festival Economy’’ In Cinema and the City: Film and Urban Societies in a Global Context Blackwell Publishers, 2001, pp. 134–144 DOI: 10.1002/9780470712948.ch11
- [55] Jeremy Tunstall ‘‘The Media Were American: U.S. Mass Media in Decline’’ Oxford University Press, 2008
- [56] UIS ‘‘UNESCO Institute for Statistics (UIS) Database’’, 2024
- [57] Deb Verhoeven, Bronwyn Coate and Vejune Zemaityte ‘‘Re-Distributing Gender in the Global Film Industry: Beyond #metoo and #methree’’ In Media Ind J 6.1, 2019, pp. 135–155 DOI: 10.3998/mij.15031809.0006.108
- [58] Nick Vivarelli ‘‘Berlin Film Festival and EFM Won’t Accredit Companies or Media Outlets With Ties to Russian or Iranian Governments’’, 2023 Variety URL: https://variety.com/2023/film/global/berlin-film-festival-russia-iran-ban-1235493196/
- [59] Juliette Wilson, Norin Arshed, Eleanor Shaw and Tobias Pret ‘‘Expanding the Domain of Festival Research: A Review and Research Agenda’’ In International Journal of Management Reviews 19.2, 2017, pp. 195–213 DOI: 10.1111/ijmr.12093
- [60] Vejune Zemaityte, Andres Karjus, Ulrike Rohn, Maximilian Schich and Indrek Ibrus ‘‘Cinando Film Festival Programming Dataset’’, 2023 figshare DOI: 10.6084/m9.figshare.22682794.v1
- [61] Vejune Zemaityte, Andres Karjus, Ulrike Rohn, Maximilian Schich and Indrek Ibrus ‘‘Quantifying the Global Film Festival Circuit: Networks, Diversity, and Public Value Creation’’ In PLOS ONE 19.3 Public Library of Science, 2024, pp. e0297404 DOI: 10.1371/journal.pone.0297404
- [62] Vejune Zemaityte, Ulrike Rohn and Indrek Ibrus ‘‘Peripheral or Not? Cinema of Small Countries in the Programming of International Film Festivals’’, to appear
Supplementary materials: additional graphs
This appendix contains a few more graphs, expanding the content that was explored in the main text.