Impact of Different Infrastructures and Traffic Scenarios on Behavioral and Physiological Responses of E-scooter Users
Abstract
As micromobility devices such as e-scooters gain global popularity, emergency departments around the world have observed a rising trend in related injuries. However, the majority of current research on e-scooter safety relies heavily on surveys, news reports, and data from vendors, with a noticeable scarcity of naturalistic studies examining the effects of riders’ behaviors and physiological responses. Therefore, this paper aims to study the responses of e-scooter users under different infrastructures and scenarios through naturalistic riding experiments. The findings indicate that different speed profiles, infrastructural elements, and traffic scenarios significantly influence riding dynamics. The experimental results also reveal that e-scooters face amplified safety challenges when navigating through areas with speed variations and without dedicated riding spaces. The study underscores the importance of considering infrastructure design and its influence on e-scooter safety, providing insights that could inform future urban planning and policy-making to enhance the safety of these increasingly popular vehicles.
Index Terms:
E-scooter, micromobility, safety, physiological responses, eye tracking, gazeI Introduction
The integration of emerging modes of transportation, such as e-scooters, presents substantial safety challenges that hinder their smooth integration into our urban ecosystems. Between 2017 and 2021, injuries associated with micromobility vehicles surged by 127% to 77,200. During this time, e-scooters witnessed the most significant rise in injuries and fatalities [1]. Specifically, according to the U.S. Consumer Product Safety Commission (CPSC), e-scooters have seen a continuous year-over-year increase in injuries, with a 22% rise in 2022 compared to 2021 [2]. A comprehensive study by the Centers for Disease Control and Prevention (CDC) [3] found that 20 out of every 100,000 e-scooter trips resulted in injuries. Half of these injuries are head injuries, with a significant 15% related to severe traumatic brain injuries. Even more alarmingly, e-scooter-related injuries among children have risen noticeably, with hospitalizations increasing from 4.2% in 2011 to 12.9% in 2020 [4, 5, 6]. Given these alarming trends, the urgent need for innovative research to bridge the safety knowledge gap becomes evident, paving the way for safer e-scooter integration.
Previous research has primarily used emergency room records and media reports to gather crash information and conduct safety studies [7, 8]. For instance, the study by [7] analyzed treatment records from two emergency departments, revealing that 44% of e-scooter incidents took place on sidewalks. Similarly, [8] utilized a comprehensive collection of news reports detailing 169 e-scooter-involved crashes across the US between 2017 and 2019, finding that the majority of these incidents occurred on streets, intersections, and sidewalks. Additionally, survey and observational studies have been pivotal in this realm [9, 10, 11, 12, 13]. For example, targeted research in Washington, DC, USA, involving roadside observations of 2,004 e-scooters, found that riders more commonly used sidewalks (60%) rather than roads (40%) in areas devoid of bike lanes. These observations stress the importance of exploring innovative strategies to comprehend the behavioral patterns and psycho-physiological responses of e-scooter users in various roadway conditions and infrastructures to enhance safety measures [13].
Despite these valuable insights, the aforementioned studies have not adequately captured the critical situational interactions between riders and urban infrastructure that precipitate accidents. This gap underscores the critical need for naturalistic studies that observe and record behaviors and responses in the complex, uncontrolled conditions of real-world settings [14]. Such studies are uniquely positioned to reveal the nuanced dynamics of e-scooter usage, offering insights into how different infrastructural elements and traffic scenarios directly impact rider safety. Nevertheless, focused research on e-scooter safety through naturalistic methods remains relatively scarce [14]. Notably, [15] and [16] delved into the naturalistic studies of risks associated with e-scooter vibrations, which can impact riding comfort due to varying road surfaces and wheel sizes. Moreover, [17] analyzed e-scooter interactions with urban infrastructure, revealing that vibrations, speed variations, and environmental constraints elevate safety risks, emphasizing the necessity for research to enhance infrastructure and policies. Similarly, [18] investigated the visual attention of pedestrians, cyclists, and e-scooter users through mobile eye tracking, showing that while fixation rates per minute were comparable across these groups, the distribution of their visual attention varied significantly. However, this research did not cover diverse traffic conditions, and its analysis was confined to fixation metrics, omitting critical metrics like gaze entropy and variability [19, 20].
This paper aims to investigate the interplay between e-scooter users’ behavior and physiological responses across various traffic scenarios and infrastructures to enhance our understanding of how these factors contribute to overall road safety and user experience. Specifically, we examine the influence of riding on different road layouts, such as sidewalks, pedestrian trails, and roads with or without bike lanes. Moreover, we assess human reactions across different traffic scenarios, ranging from bike lane transitions to pedestrian interactions, to capture a comprehensive picture of e-scooter navigation challenges. Furthermore, this paper utilizes diverse metrics such as gaze density heat maps, the percentage of road center focus, gaze entropies, gaze variations, and fixation details, offering a nuanced view of e-scooter users’ visual and cognitive interaction with their surroundings. By highlighting the necessity for custom-tailored infrastructure and well-informed policy decisions, this study aims to advance urban safety and navigability for e-scooter users, fostering a more integrated and safe coexistence among all road participants.
II METHODOLOGY
II-A Experiment setup
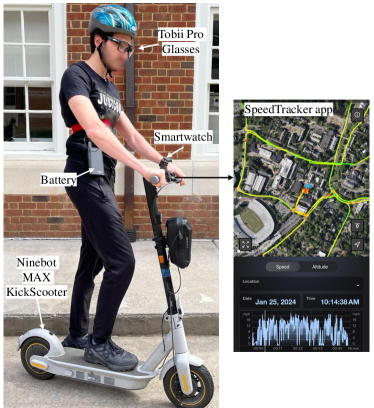
This paper investigates e-scooter riders’ behavioral and physiological reactions to varying roadway designs and infrastructural elements. The naturalistic studies were conducted using a Ninebot MAX KickScooter, equipped with a 350W motor capable of reaching speeds up to 18.6 mph and a range of 25 miles, supporting riders up to 220 lbs. Additionally, the SpeedTracker app further enhances data collection, recording vital travel information such as GPS, speed, elevation, and timestamps at one-second intervals (see Figure 1).
Instrumentation also included Tobi Pro Glasses 3, which captured a wealth of data on gaze behavior, including gaze patterns, eye movements, saccades, and visual fixations. This device, equipped with a 3-axis gyroscope and accelerometer, recorded continuous forward-facing video at a resolution of pixels with a 90-degree field of view at 25 Hz. Additionally, a Samsung Galaxy smartwatch was used to record heart rate variations. Although this study primarily focuses on the visual data, a detailed analysis of heart rate variations across different scenarios is planned for future research.
II-B Experiment procedure & Data cleaning
All riding experiments were carried out by two male researchers (coauthors of this paper), each approximately 6 feet tall and experienced in e-scooter riding. These trials involved navigating diverse routes around the University of Virginia (UVA) and the downtown area of Charlottesville, VA, USA, to explore various road structures and traffic scenarios. To guarantee a thorough evaluation, each experiment covered different routes. All experiments took place during daylight, lasting about an hour each, under either sunny or cloudy weather conditions, avoiding any trials in the rain. Prior to each ride, pre-ride safety inspections and equipment calibrations were meticulously performed to ensure the reliability of all data collection tools. It is important to note that this paper does not focus on the impact of human factors (i.e., riders’ weight and age) on riding risk, which are topics planned for future research.
In total, we collected data from 16 trips, amounting to approximately 16 hours of riding data. Each trip provided extensive information, encompassing speed, GPS, elevation, and gaze data. The collected data was meticulously synchronized for analysis, aligning with the frame rate of the gaze data. The data cleaning phase involved several crucial steps: filtering out noise from the GPS and gaze data, managing any instances of missing data, and rectifying discrepancies within the datasets to enhance the dataset’s quality for analysis. Subsequently, various traffic scenarios encountered across these trips were methodically classified by our research team, alongside the corresponding trip data, facilitating a structured analysis framework [21]. For detailed information on our methodology and data processing techniques, readers are referred to our open-source codes111https://github.com/DongChen06/Escooter_ITSC.
II-C Physiological data analysis
Eye gaze patterns have been employed across various studies to deduce human states. Features like fixation duration, direction-specific gaze variability, and gaze entropies have demonstrated correlations with states including workload, stress levels, and emotions [22, 19].
Fixations, which occur when the eyes cease scanning and maintain central foveal vision on specific points, represent the most prevalent aspect utilized in eye tracking to deduce cognitive processes or states. The Tobii Pro Lab software, designed for Tobii glasses, incorporates a built-in algorithm that considers a single gaze lasting 0.02 seconds as a fixation. When three or more gazes fall within a 0.5∘ radius of each other, they are classified as a fixation. The Mean Fixation Length is determined by calculating the average duration of all fixation events within a specified time interval. The Percentage of Road Center (PRC) is then defined as the proportion of fixation duration that occurs within the road center relative to the total fixation duration for any chosen time interval.
Stationary Gaze Entropy (SGE) measures the predictability of fixation locations [22], indicating gaze dispersion during a viewing period and quantifying attention distribution as follows:
| (1) |
where represents the entropy value for a given set (each time bin within each scenario), with denoting each fixation’s location on a 2D plane within , is the total number of fixations in , and is the proportion of fixations at each state space within .
Gaze Transition Entropy (GTE) extends this analysis to the dynamics of gaze shift [23], applying conditional entropy to first-order Markov transitions between fixations:
| (2) |
where is the stationary distribution across fixation locations, and represents the transition probability to location from . This equation captures the variability in gaze transitions, reflecting the complexity of visual attention shifts. For the analysis under different conditions, fixation coordinates were discretized by categorizing them into spatial bins of pixels [23, 20].
III Results
III-A Speeds
Figure 2 presents the gaze density heat map across various speed profiles. Visual analysis of the gaze heat map reveals that the low-speed scenario exhibits a more dispersed distribution of gazes compared to the other scenarios. In contrast, the high-speed scenario (>20 mph) demonstrates a higher concentration of gazes towards the center of the viewing area, with the medium-speed scenario (10-20 mph) showing a similar, albeit less concentrated pattern.
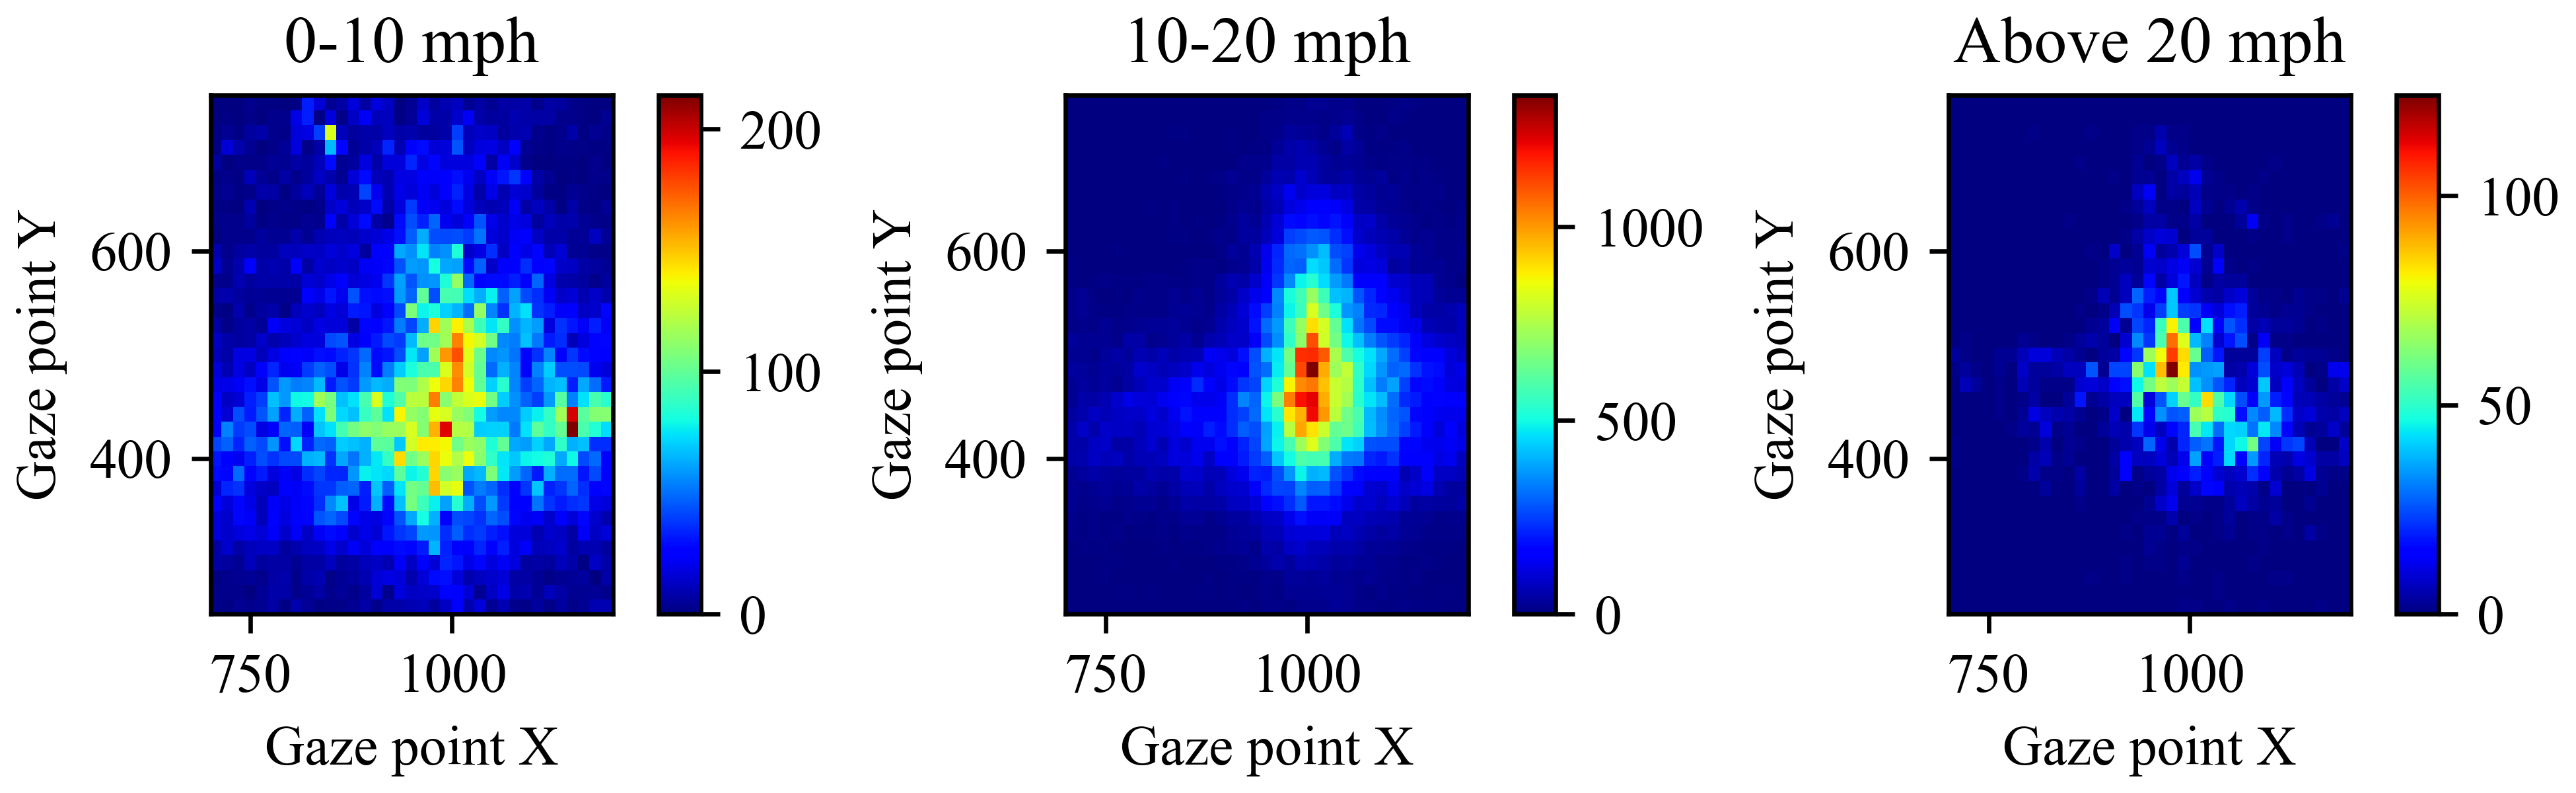
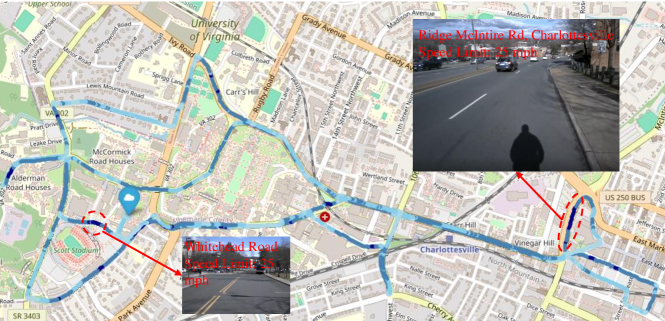
Figure 3 depicts a representative round trip on an e-scooter beginning and ending at the University of Virginia (UVA) and passing through the downtown area of Charlottesville. Speed variations along the route are visually depicted using color gradients, with darker hues indicating higher speeds. The figure includes detailed views of two segments characterized by high-speed travel on downhill paths. Notably, these segments lack dedicated bike lanes, compelling e-scooter riders to share the road with vehicles and pedestrians, a factor that significantly escalates safety concerns for all road users. Particularly concerning is that one of these high-speed areas aligns precisely with the location of a documented accident, occurring after the data collection period, where an e-scooter rider was struck by a car and subsequently required hospitalization222https://www.wric.com/news/western-virginia/person-hit-by-car-while-riding-scooter-on-uvas-campus/, highlighting the real-world dangers present in these high-risk zones.
III-B Infrastructures
The infrastructural analysis offers critical insights into the interaction between e-scooter riders and the built environment. To comprehensively assess this dynamic, we examined the effects of riding on various types of infrastructure, including sidewalks, pedestrian trails (sidewalks situated away from main roads), bike lanes, and roads without bike lanes.
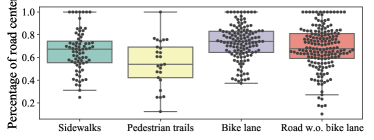
Figures 4 show PRC values corresponding to these infrastructure types. Riding on sidewalks and pedestrian trails exhibits varied PRC, indicating extensive scanning due to the presence of pedestrians and obstacles. Conversely, riding on dedicated bike lanes displays a narrower focus, suggesting a more straightforward path of travel with less navigational stress. In the case of roads without bike lanes, the PRC values are typically more closely grouped or concentrated than those on sidewalks or pedestrian trails but more varied than in bike lanes. This pattern indicates a higher level of concentrated attention required by riders to safely share the road with motor vehicles. The presence of vehicles introduces a significant element of risk, necessitating constant awareness and quick responsiveness to dynamic traffic conditions. The necessity for heightened awareness in scenarios without bike lanes is quantitatively supported by the increase in gaze variability as depicted in Figures 5. These variations in gaze patterns emphasize the rider’s need to continuously monitor their surroundings for potential hazards, a task that is evidently less demanding on roads with bike lanes, as shown by the lower gaze variability scores.
The elevated SGE and GTE observed on roads without bike lanes, as shown in Figure 6, signify a more dynamic and unpredictable visual engagement by riders, necessitated by the challenging and less structured road environment. These higher entropy values imply that riders must continuously adapt their focus and attention to navigate safely, reflecting the high cognitive load required in these conditions. Conversely, the reduced entropy on roads with bike lanes indicates a more straightforward riding experience, where riders can maintain a consistent gaze with less need to frequently adjust their focus. For sidewalks and pedestrian trails, the moderate levels of SGE and GTE suggest a need for frequent scanning and attention adjustments due to the varied presence of pedestrians and other obstacles, pointing to a moderately complex navigation environment.
Similarly, shorter mean fixation lengths on sidewalks and pedestrian trails, as shown in Figure 7, imply less cognitive strain in these predictable environments. In contrast, longer fixations and a higher frequency of fixations per second on roads without bike lanes indicate a more challenging navigational context, demanding increased alertness.
| Events | B.L. to cross. | Intersection | Occupied cross. | Downhill | Close pro. | Road to B.L. | Passing bus | Passing ped. |
|---|---|---|---|---|---|---|---|---|
| PRC () | 0.40 | 0.49 | 0.48 | 0.72 | 0.70 | 0.72 | 0.63 | 0.53 |
| Mean fixation length (s) () | 0.21 | 0.22 | 0.22 | 0.25 | 0.25 | 0.25 | 0.26 | 0.27 |
| Fixations per second () | 2.95 | 2.96 | 3.19 | 2.94 | 3.01 | 2.99 | 2.86 | 3.03 |
| SGE () | 5.77 | 5.32 | 4.30 | 5.63 | 4.03 | 4.52 | 4.66 | 4.41 |
| GTE () | 28.68 | 21.94 | 11.24 | 20.92 | 7.34 | 9.20 | 12.52 | 11.53 |
| Gaze variability x () | 209.96 | 167.79 | 152.41 | 113.22 | 107.13 | 116.25 | 166.50 | 117.83 |
| Gaze variability y () | 115.82 | 105.47 | 73.39 | 83.04 | 87.82 | 71.47 | 76.37 | 73.82 |
III-C Traffic scenarios
Figure 8 depicts the gaze distribution across various traffic scenarios, showing distinct attentional patterns of e-scooter riders. In transition areas like “Bike lane to crosswalk” and “Intersection”, a concentrated gaze suggests riders’ focused navigation. Dispersed patterns in “Occupied crosswalks” (crosswalks occupied by pedestrians or vehicles) indicate searching behavior, while the tight clustering in “Downhill” and “Close proximity” scenarios suggests heightened alertness due to speed and spatial constraints. The pattern in “Passing bus” is somewhat scattered but centered, suggesting that while the bus itself is a focus, riders must also monitor surrounding traffic conditions closely. The “entry into a bike lane” and “passing pedestrians” also demonstrate deliberate gaze strategies, emphasizing the cognitive complexity of urban micromobility. These findings highlight the need for infrastructure that accommodates the diverse visual demands of riders in different traffic contexts.
Table I provides a detailed evaluation with quantitative metrics for each scenario. Notably, the highest PRC (0.72) is observed in the “Downhill” and “Road to bike lane” scenarios, suggesting that riders devote a significant portion of their attention to the roads. Interestingly, “Passing pedestrian” situations elicit the longest mean fixation length, potentially reflecting the need for riders to monitor pedestrian movements closely. Fixations per second are notably elevated in “Occupied crosswalks”, which could reflect the rapid visual assessment required in dynamic environments. This metric, coupled with the highest SGE and GTE observed in “Bike lane to crosswalk” scenarios, underscores the cognitive complexity of navigating through these areas. Gaze variability, measured both horizontally (x) and vertically (y), is found to be the most significant in “Bike lane to crosswalk” scenarios, further highlighting the unpredictable nature and visual demands of these transition spaces.
IV Conclusion
In conclusion, this paper presented a comprehensive examination of the behavioral and physiological responses of e-scooter users across various road infrastructures and traffic scenarios, filling a notable gap in current micromobility research. Through naturalistic studies, we captured and analyzed detailed eye-tracking data, which revealed significant insights into the visual attention and cognitive load experienced by riders. Our findings highlighted the profound impact of infrastructure on rider safety, with bike lanes promoting more focused and predictable gaze patterns, thereby reducing cognitive demands. Conversely, roads without bike lanes result in increased gaze dispersion and fixations per second, indicating the need for heightened alertness and suggesting a more complex navigational environment.
This paper also explored different situational challenges faced by riders, such as navigating intersections, downhills, and crosswalks. The results showed that riders adjust their visual focus according to the complexity and risk associated with these scenarios, highlighting the need for strategic infrastructure planning to mitigate potential hazards.
As e-scooters become increasingly integrated into urban transport ecosystems, the implications of this paper are extensive. The evidence supports the need for urban infrastructure that accommodates e-scooter dynamics, advocating for designs that enhance rider safety and promote harmonious coexistence with other road users. Our research offers valuable data-driven insights that can guide policymakers, urban planners, and e-scooter manufacturers in creating safer, more efficient environments for micromobility devices.
Looking forward, this work lays the groundwork for future research to include more participants to explore the complex interplay of human factors, such as weight and age, on riding risks. Continued exploration in this area will enhance our understanding of micromobility safety and strengthen the foundation for evidence-based infrastructural and policy advancements in urban transportation.
References
- [1] J. Tark, “Micromobility products-related deaths, injuries, and hazard patterns: 2017–2021,” United States Consumer Product Safety Commission Report, 2022.
- [2] T. U. C. P. S. C. (CPSC), “E-scooter and e-bike injuries soar: 2022 injuries increased nearly 21%,” https://www.cpsc.gov/Newsroom/News-Releases/2024/E-Scooter-and-E-Bike-Injuries-Soar-2022-Injuries-Increased-Nearly-21, accessed: 2023-10-17.
- [3] S. Hayden and R. Spillar, “Dockless electric scooter-related injuries study,” Austin Public Health, 2019.
- [4] H. Hayward, “Number of children hospitalized for e-scooter injuries surge from 2011-2020,” American Academy of Pediatrics National Conference & Exhibition, 2022. [Online]. Available: https://www.aap.org/en/news-room/news-releases/conference-news-releases/number-of-children-hospitalized-for-e-scooter-injuries-surge-from-2011-2020/
- [5] E. Krištopaitytė, “Surging e-scooter, bicycle injuries in kids: Helmets could help,” Health News, October 2022. [Online]. Available: https://healthnews.com/news/surging-e-scooter-bicycle-injuries-in-kids-helmets-could-help/
- [6] A. Gordon, “Electric scooter rider executes flawless cross-highway lane change during rush hour,” Jalopnik, 2019. [Online]. Available: https://jalopnik.com/electric-scooter-rider-executes-flawless-cross-highway-1836659426
- [7] A. Badeau, C. Carman, M. Newman, J. Steenblik, M. Carlson, and T. Madsen, “Emergency department visits for electric scooter-related injuries after introduction of an urban rental program,” The American journal of emergency medicine, vol. 37, no. 8, pp. 1531–1533, 2019.
- [8] H. Yang, Q. Ma, Z. Wang, Q. Cai, K. Xie, and D. Yang, “Safety of micro-mobility: Analysis of e-scooter crashes by mining news reports,” Accident Analysis & Prevention, vol. 143, p. 105608, 2020.
- [9] O. James, J. Swiderski, J. Hicks, D. Teoman, and R. Buehler, “Pedestrians and e-scooters: An initial look at e-scooter parking and perceptions by riders and non-riders,” Sustainability, vol. 11, no. 20, p. 5591, 2019.
- [10] Z. Zou, H. Younes, S. Erdoğan, and J. Wu, “Exploratory analysis of real-time e-scooter trip data in washington, dc,” Transportation research record, vol. 2674, no. 8, pp. 285–299, 2020.
- [11] N. Haworth, A. Schramm, and D. Twisk, “Comparing the risky behaviours of shared and private e-scooter and bicycle riders in downtown brisbane, australia,” Accident Analysis & Prevention, vol. 152, p. 105981, 2021.
- [12] ——, “Changes in shared and private e-scooter use in brisbane, australia and their safety implications,” Accident Analysis & Prevention, vol. 163, p. 106451, 2021.
- [13] J. B. Cicchino, N. K. Chaudhary, and M. G. Solomon, “How are e-scooter speed-limiter settings associated with user behavior? observed speeds and road, sidewalk, and bike lane use in austin, tx, and washington, dc,” Transportation Research Record, p. 03611981231214518, 2023.
- [14] G. S. Janikian, J. K. Caird, B. Hagel, and G. Reay, “A scoping review of e-scooter safety: Delightful urban slalom or injury epidemic?” Transportation Research Part F: Traffic Psychology and Behaviour, vol. 101, pp. 33–58, 2024.
- [15] J. D. Cano-Moreno, J. M. Cabanellas Becerra, J. M. Arenas Reina, and M. E. Islán Marcos, “Analysis of e-scooter vibrations risks for riding comfort based on real measurements,” Machines, vol. 10, no. 8, p. 688, 2022.
- [16] Q. Ma, H. Yang, and Z. Yan, “Use of mobile sensing data for assessing vibration impact of e-scooters with different wheel sizes,” Transportation Research Record, vol. 2677, no. 8, pp. 388–399, 2023.
- [17] Q. Ma, H. Yang, A. Mayhue, Y. Sun, Z. Huang, and Y. Ma, “E-scooter safety: The riding risk analysis based on mobile sensing data,” Accident Analysis & Prevention, vol. 151, p. 105954, 2021.
- [18] A. Pashkevich, T. E. Burghardt, S. Puławska-Obiedowska, and M. Šucha, “Visual attention and speeds of pedestrians, cyclists, and electric scooter riders when using shared road–a field eye tracker experiment,” Case studies on transport policy, vol. 10, no. 1, pp. 549–558, 2022.
- [19] X. Guo, A. Tavakoli, E. Robartes, A. Angulo, T. D. Chen, and A. Heydarian, “Roadway design matters: Variation in bicyclists’ psycho-physiological responses in different urban roadway designs,” arXiv preprint arXiv:2202.13468, 2022.
- [20] X. Guo, A. Tavakoli, T. D. Chen, and A. Heydarian, “Unveiling the impact of cognitive distraction on cyclists psycho-behavioral responses in an immersive virtual environment,” IEEE Transactions on Intelligent Transportation Systems, 2024.
- [21] D. Chen, A. Hosseini, A. Smith, A. F. Nikkhah, A. Heydarian, O. Shoghli, and B. Campbell, “Performance evaluation of real-time object detection for electric scooters,” in Computing in Civil Engineering, 2024.
- [22] B. Shiferaw, L. Downey, and D. Crewther, “A review of gaze entropy as a measure of visual scanning efficiency,” Neuroscience & Biobehavioral Reviews, vol. 96, pp. 353–366, 2019.
- [23] B. A. Shiferaw, L. A. Downey, J. Westlake, B. Stevens, S. M. Rajaratnam, D. J. Berlowitz, P. Swann, and M. E. Howard, “Stationary gaze entropy predicts lane departure events in sleep-deprived drivers,” Scientific reports, vol. 8, no. 1, p. 2220, 2018.