Triggering the Untriggered: The First Einstein Probe-Detected Gamma-Ray Burst 240219A and Its Implications
Abstract
The Einstein Probe (EP) achieved its first detection and localization of a bright X-ray flare, EP240219a, on February 19, 2024, during its commissioning phase. Subsequent targeted searches triggered by the EP240219a alert identified a faint, untriggered gamma-ray burst (GRB) in the archived data of Fermi/GBM, Swift/BAT, Insight-HXMT/HE and INTEGRAL/SPI-ACS. The EP/WXT light curve reveals a long duration of approximately 160 seconds with a slow decay, whereas the Fermi/GBM light curve shows a total duration of approximately 70 seconds. The peak in the Fermi/GBM light curve occurs slightly later with respect to the peak seen in the EP/WXT light curve. Our spectral analysis shows that a single cutoff power-law model effectively describes the joint EP/WXT-Fermi/GBM spectra in general, indicating coherent broad emission typical of GRBs. The model yielded a photon index of and a peak energy of keV. After detection of GRB 240219A, long-term observations identified several candidates in optical and radio wavelengths, none of which was confirmed as the afterglow counterpart during subsequent optical and near-infrared follow-ups. The analysis of GRB 240219A classifies it as an X-ray rich GRB with a high peak energy, presenting both challenges and opportunities for studying the physical origins of X-ray flashes (XRFs), X-ray rich GRBs (XRRs), and classical GRBs (C-GRBs). Furthermore, linking the cutoff power-law component to non-thermal synchrotron radiation suggests that the burst is driven by a Poynting flux-dominated outflow.
1 Introduction
The Einstein Probe, launched on 2024 January 9, is dedicated to monitoring the sky in the soft X-ray band (Yuan et al., 2022). Equipped with two scientific instruments, the Wide-field X-ray Telescope (WXT) and the Follow-up X-ray Telescope (FXT), EP offers a large instantaneous field of view for detecting rapid transients, along with a considerable effective area crucial for follow-up observations and precise localization. Due to its exceptional sensitivity in detecting rapid transients, EP holds significant promise for identifying faint, high-redshift, or newly discovered high-energy transients, especially Gamma-Ray Bursts (GRBs).
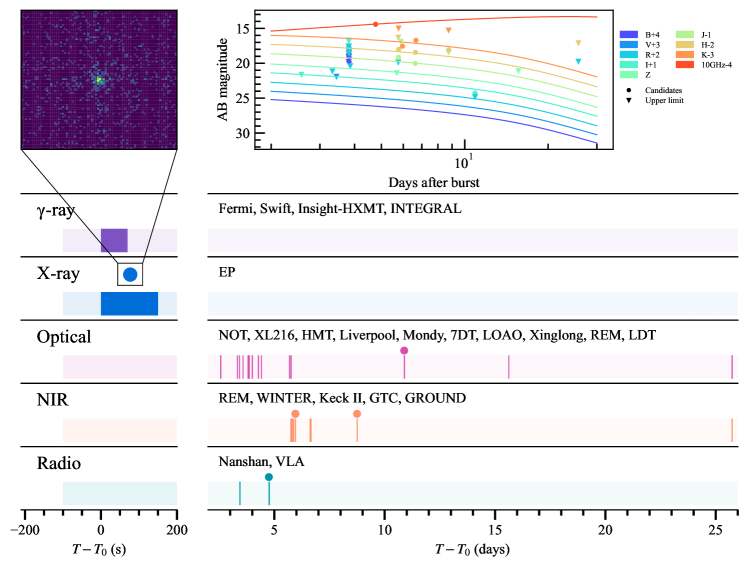
On 2024 February 19 at 06:21:42 UT (referred to as ), the EP/WXT detected and located a bright X-ray flare named EP240219a (Zhang et al., 2024c, d) during its commissioning phase at RA = 80.016∘ and Dec = 25.541∘ (J2000) with an uncertainty of 3 arcminutes (Figure 1). The source exhibits an overall profile of a fast-rise and exponential-decay shape (FRED) and lasts approximately 160 seconds (see Figure 2). Fitted by an absorbed power law (PL), the time-averaged spectrum can be characterized with an absorption of and a photon index of . The calculated time-averaged unabsorbed fluence in the 0.5 - 4.0 keV range is .
Following the EP alert, a faint, untriggered gamma ray transient that occurred at the same time as was discovered offline in the archived data of Fermi/GBM (Zhang et al., 2024a, b; Fletcher et al., 2024), Swift/BAT (DeLaunay et al., 2024), Insight-HXMT/HE (Cai et al., 2024) and INTEGRAL/SPI-ACS (Minaev et al., 2024). The gamma-ray transient exhibits a total duration of approximately 70 seconds and shared a consistent location with EP240219a, leading to its reclassification as GRB 240219A. The time-integrated and time-resolved spectral analysis indicates a peak energy of 127 keV. Applying the fluence ratio criterion / established by Sakamoto et al. (2008), this event is classified as an X-ray rich gamma-ray burst (XRR). Follow-up observations identified one potential optical source and seven potential radio sources (Ho et al., 2024). The optical candidate was subsequently ruled out by follow-up observations. Six of the seven radio sources are associated with near-infrared or optical counterparts (Figure 1), but none were verified to be linked to the GRB (Karambelkar et al., 2024a; Srinivasaragavan et al., 2024).
In this Letter, we report on the detection of EP240219a/GRB 240219A and its follow-up observations, including a multiwavelength analysis and an exploration of its implications. This Letter is structured as follows. Section 2 provides the data reduction and analysis, and presents the results. Section 3 details the long-term follow-up observations and possible afterglow candidates. In Section 4, we explore the implications of the burst’s classification and spectral components. Finally, Section 5 summarizes the characteristics and findings derived from this first GRB observed by EP.
| Observed Properties | GRB 240219A |
| () | |
| () | |
| Minimum variability timescale () | |
| Spectral index | |
| Peak energy () | |
| -ray fluence () | |
| X-ray fluencea () | |
| Fluence ratiob |
-
a
The X-ray fluence is calculated in the energy range of 0.5 - 4.0 keV.
-
b
The fluence ratio is obtained between the energy ranges of 25-50 keV and 50-100 keV using the joint spectral fitting results for 0-70 s (Table 2).
2 Data Reduction and Analysis
EP/WXT operates in the 0.5 - 4.0 keV soft X-ray band, offering an energy resolution of 130 eV (at 1.25 keV) and a temporal resolution of 0.05 s. The observation of GRB 240219A took place between 06:07:32.034 UT and 06:30:44.934 UT on February 19, 2024, resulting in a net exposure time of 1033 s. GRB 240219A was identified within the WXT’s field of view at RA = 80.016∘, Dec = 25.541∘ with an uncertainty of 3 arcminutes, as illustrated in Figure 1. The X-ray photon events were processed and calibrated using specialized data reduction software and the calibration database (CALDB) developed for EP/WXT (Liu et al. in prep.). The generation of CALDB relies on the results from both on-ground and in-orbit calibration campaigns (Cheng et al. in prep.). Energy corrections were applied to each event employing bias and gain values stored in the CALDB while identifying and flagging bad/flaring pixels. Events that met the predefined criteria, such as singlets, doublets, triplets and quadruplets without anomalous flags, were selected to generate a cleaned event file. Subsequently, the image in the 0.5 – 4.0 keV energy range was extracted from the cleaned events, with each photon’s position projected into celestial coordinates. The source and background light curves and spectra for any specified time interval were obtained from a circular region with a radius of 9.1 arcminutes and an annular region with inner and outer radii of 1.4∘ and 1.8∘, respectively. Additionally, as the instrument’s in-orbit calibration was ongoing during the observation, the calibration uncertainties are accounted for in the joint Spectral Energy Distribution (SED) fitting.
Following EP/WXT’s alert, we retrieved the time-tagged event dataset encompassing the temporal span of GRB 240219A from the publicly accessible Fermi/GBM data archive111https://heasarc.gsfc.nasa.gov/FTP/fermi/data/gbm/daily/. Among the twelve sodium iodide detectors, n9 and na were chosen due to their minimal viewing angles relative to the GRB source direction. This direction is determined by the angle between the detector’s pointing direction and the GRB location as identified by EP/WXT. The burst signal-to-noise ratio of the two selected detectors both exceed 3 . Furthermore, for both temporal and spectral analyses, we included the bismuth germanium oxide detector, b1, which also has a relatively small viewing angle. Given the weak signal detected by b1, we evaluated the spectral fit quality both with and without its data and found that incorporating the data from b1 resulted in an improved fit. Subsequently, we analyzed the Fermi/GBM data using the established methodologies described in Zhang et al. (2011) and Yang et al. (2022).
2.1 Light Curve
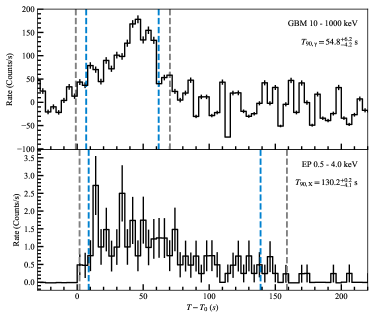
In Figure 2, we present the light curves of GRB 240219A, featuring Fermi/GBM data with a bin size of 4 s in the energy range of 10–1000 keV and EP/WXT data in 0.5–4.0 keV. The overall profiles of X-ray and gamma-ray emissions exhibit coherence from the trigger time , with the X-ray emission displaying a prolonged duration characterized by a slow decay. The duration of the burst, , in the energy range of 10–1000 keV is s, while in the energy range of 0.5–4.0 keV, the derived is s.
The minimum variability timescale (MVT) is a measurement of the temporal variability of the light curves. We determined the MVT of GRB 240219A by implementing the Bayesian method (Scargle et al., 2013) to recognize Bayesian blocks from the time-tagged event data of Fermi/GBM and EP/WXT. We adopt the definition of MVT as half of the minimum bin size of the resulting blocks. For Fermi/GBM data, the MVT was found to be 2.19 s, whereas for EP/WXT data, it was 29.3 s. Consequently, the MVT of 2.19 s, derived from Fermi/GBM data, is considered as the MVT of this event. The MVT and gamma-ray luminosity in GRBs are found to exhibit an empirical anti-correlation (Sonbas et al., 2015). Attributing the MVT to the viscous instability of the hyperaccretion disk, such a correlation can be well understood within the black hole central engine model (Xie et al., 2017). For GRB 240219A, the MVT and gamma-ray luminosity (assuming redshift ) are consistent with the empirical anti-correlation and theoretical predictions from the black hole central engine model.
The comparison of the Fermi/GBM and EP/WXT light curves shown in Figure 2 highlights some temporal disparities in emission peak times and slightly varied structures between the two detections. This is further manifested by the lag calculation, which yields s. The calculation of spectral lag was conducted using the method described in Zhang et al. (2012). This method employs the cross-correlation function (Norris et al., 2000; Ukwatta et al., 2010) to measure the time lags between the light curves from Fermi/GBM and EP/WXT shown in Figure 2. Considering that the bin size is 4 s, such a lag cannot be ruled out as being caused by noise fluctuations. Due to the weak detection of GRB 240219A by Fermi/GBM and the limited photons collected by EP/WXT, further discerning potential substructures of the emission is challenging and out of the scope of this study.
2.2 Spectral Fit
We conducted both time-integrated and time-resolved spectral fits for EP/WXT and Fermi/GBM data separately, covering the time range from 0 to 70 seconds. Time-integrated spectra for both instruments were extracted during this period. We divided the spectra of both instruments into several slices. However, to compare the spectral consistency, we required that the spectra of both instruments share the same corresponding time slices. To achieve this, we required a minimum of 20 total accumulating photon counts for each EP/WXT spectrum and 5 average accumulating photon counts per channel for each Fermi/GBM spectrum. We finally obtained the time-resolved spectra for three slices, as listed in Table 2, for both instruments.
The fitting utilized the Python package MySpecFit, following the methodology summarized in Yang et al. (2022) and Yang et al. (2023). MySpecFit is a Bayesian inference-based spectral fitting tool and uses the nested sampler Multinest (Feroz & Hobson, 2008; Feroz et al., 2009; Buchner et al., 2014; Feroz et al., 2019) as the fitting engine. The evaluation of the goodness of fit involved examining the reduced statistic STAT/dof, where the term “dof” represents the degree of freedom, and “STAT” serves as the likelihood function. Specifically, for the EP spectra, we used CSTAT (Cash, 1979), while for the GBM spectra, we used PGSTAT (Arnaud, 1996). The model comparison was conducted using the Bayesian information criterion (BIC) as outlined by Schwarz (1978). The fitting results of the best model and the corresponding statistics for each time slice are listed in Table 2. From the spectral fittings, the spectral evolution and the SEDs were subsequently derived, as shown in Figure 3 and Figure 4.
We briefly outline the key results of the spectral fitting as follows:
| Independent fit | ||||||||||||
| t1 (s) | t2 (s) | PL model | ||||||||||
| CSTAT/dof | BIC | |||||||||||
| () | ||||||||||||
| 0.00 | 38.25 | |||||||||||
| 38.25 | 53.21 | |||||||||||
| 53.21 | 70.00 | |||||||||||
| 70.00 | 160.00 | |||||||||||
| 0.00 | 70.00 | |||||||||||
| t1 (s) | t2 (s) | CPL model | ||||||||||
| PGSTAT/dof | BIC | |||||||||||
| (keV) | () | |||||||||||
| 0.00 | 38.25 | |||||||||||
| 38.25 | 53.21 | |||||||||||
| 53.21 | 70.00 | |||||||||||
| 0.00 | 70.00 | |||||||||||
| Joint fit | ||||||||||||
| t1 (s) | t2 (s) | CPL model | ||||||||||
| STAT/dof | BIC | |||||||||||
| (keV) | () | |||||||||||
| 0.00 | 38.25 | |||||||||||
| 38.25 | 53.21 | |||||||||||
| 53.21 | 70.00 | |||||||||||
| 0.00 | 70.00 | |||||||||||
-
1.
The spectral models. The best-fit models in our analyses are finally determined to be a PL for EP/WXT spectra and a cutoff power law (CPL) for Fermi/GBM spectra. CPL is also determined to be the best model for the joint EP/WXT and Fermi/GBM spectral fitting. We note that an absorption component is needed when EP/WXT data are involved.
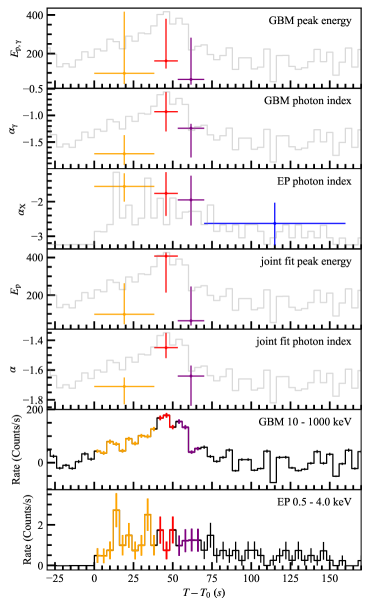
Figure 3: The observed light curves of GRB 240219A and its spectral evolution based on the best-fit parameters of the CPL model for Fermi/GBM spectra, the PL model for EP/WXT spectra, and the CPL model for Fermi/GBM-EP/WXT spectra. Same time slices are highlighted in same colors across all panels. All error bars on data points represent the 1 confidence level. -
2.
The value. A fixed value is adopted across all fits. To obtain this fixed value, we first perform time-resolved spectral fits with linked using an absorbed power-law model tbabs*powerlaw for the EP/WXT spectra, where tbabs is Tuebingen-Boulder ISM absorption model (Wilms et al., 2000) with a free parameter for the absorption column density, . The best-fit is then adopted and fixed at in all subsequent spectral analyses.
-
3.
Independent fit.
-
•
Time-integrated fit. In the time interval of 0-70 seconds, the time-integrated spectrum of EP/WXT data can be well-fitted by the absorbed PL model with an average photon index of . The spectrum of Fermi/GBM data is aptly characterized by the CPL model, featuring a typical GRB photon index of and a peak energy of keV. Considering the larger error bars, the low-energy index of the CPL model is consistent with the photon index of the PL model, suggesting a common physical origin of the emissions in the two energy bands.
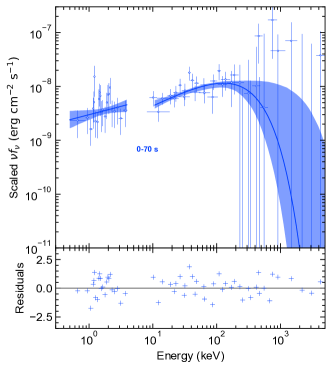
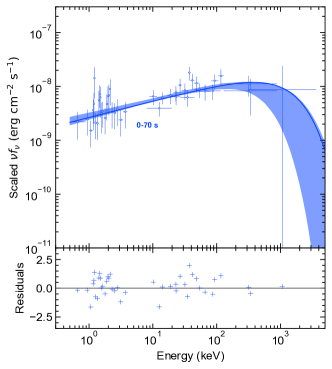
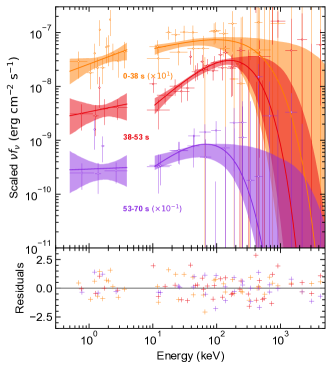
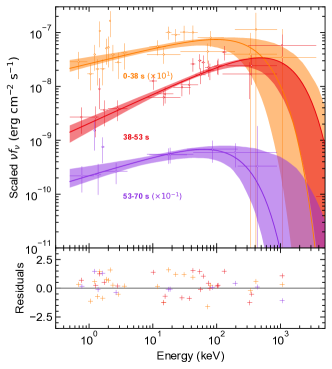
Figure 4: SEDs and their evolution. The left panels present SEDs derived from independent spectral fittings at different time intervals. Solid lines show the best-fit unabsorbed model for each independent fit. The right panels illustrate SEDs obtained from joint spectral fittings using an absorbed single CPL model at different time intervals. The unabsorbed CPL model is presented. Error bars represent the 1 confidence level. -
•
Time-resolved fit. In the first time slice (0.00-38.25 s), both Fermi/GBM and EP/WXT spectra demonstrate a relatively lower peak energy and softer low-energy indices, indicating a soft spectrum emerging in the early phase of the burst. Afterwards, both EP/WXT and Fermi/GBM show a trend of transition from hard to soft evolution. We note that the spectral indices in the second and third time slices of Fermi/GBM are not exactly aligned with EP/WXT (i.e., the photon indices are generally softer in X-ray spectra compared to -ray spectra). However, in view of the large uncertainties caused by the limitation of photon numbers, the spectra of EP/WXT and Fermi/GBM are considered to be consistent within 1 uncertainty.
-
•
-
4.
Joint fit. The joint fit is performed with an absorbed CPL model tbabs*cutoffpowerlaw. Considering the calibration uncertainties for Fermi/GBM and EP/WXT, we introduced a calibration constant within the range of 90%–110% on EP/WXT to account for the systematic uncertainty between the two instruments. We found that for all four slices, the two components of the spectral data from EP/WXT and Fermi/GBM appear to be sewn together with a single CPL model, characterized by acceptable best-fit parameters (Table 2), indicating a coherent single component spanning from X-ray to -ray emissions. The joint fit also provides constraints on model parameters, which yields smaller uncertainties than what are obtained from independent fits, as is shown in Figure 4. Therefore, we adopt the best-fit model parameters of the joint fit for subsequent analyses. Additionally, the time-resolved joint fits indicate a similar evolution trend as the independent fits, showing a soft spectrum at the beginning, followed by a hard-to-soft evolution.
| (day) | (RA, Dec) | Telescope | Band | AB Magnitude | comment | Ref. | |
| 0.000 | - | (80.016, 25.541) | EP/WXT | x-ray | - | [1] | |
| 0.000 | - | - | Fermi/GBM | -ray | - | [2] | |
| 0.000 | 300 | (80.046, 25.500) | Swift/BAT | -ray | - | [3] | |
| 0.000 | - | - | SPI-ACS/INTEGRAL | -ray | - | [4] | |
| 0.000 | - | - | Insight-HXMT/HE | -ray | - | [5] | |
| 2.574 | 3120 | - | Liverpool/IO:O | I | 22.12 | [6] | |
| 3.329 | 9200 | - | XL216 | R | 21.3 | [7] | |
| 3.424 | 3090 | - | HMT | unfilter | 19.7 | [18] | |
| 3.443 | 12200 | - | Nanshan | V | 21.7126 | [8] | |
| 3.582 | 9200 | (80.034, 25.548) | NOT | z | 21.80.2 | candidate 0 (ruled out) | [18] |
| 3.811 | 900 | - | 7DT | m400 | 18.166 | [9] | |
| 3.824 | 900 | - | 7DT | m425 | 18.338 | [9] | |
| 3.812 | 900 | - | 7DT | m450 | 18.330 | [9] | |
| 3.824 | 900 | - | 7DT | m475 | 18.447 | [9] | |
| 3.811 | 900 | - | 7DT | m500 | 18.597 | [9] | |
| 3.823 | 900 | - | 7DT | m525 | 18.678 | [9] | |
| 3.816 | 900 | - | 7DT | m550 | 18.379 | [9] | |
| 3.828 | 900 | - | 7DT | m575 | 18.486 | [9] | |
| 3.813 | 900 | - | 7DT | m600 | 17.712 | [9] | |
| 3.825 | 900 | - | 7DT | m625 | 18.365 | [9] | |
| 3.812 | 900 | - | 7DT | m650 | 18.110 | [9] | |
| 3.824 | 900 | - | 7DT | m675 | 18.425 | [9] | |
| 3.812 | 900 | - | 7DT | m700 | 17.894 | [9] | |
| 3.824 | 900 | - | 7DT | m725 | 18.029 | [9] | |
| 3.812 | 900 | - | 7DT | m750 | 17.154 | [9] | |
| 3.825 | 900 | - | 7DT | m775 | 17.641 | [9] | |
| 3.815 | 900 | - | 7DT | m800 | 17.177 | [9] | |
| 3.827 | 900 | - | 7DT | m825 | 17.014 | [9] | |
| 3.861 | 6030 | - | LOAO | R | 20.562 | [10] | |
| 4.278 | 30120 | - | Mondy | R | 18.00 | [11] | |
| 4.278 | 30120 | - | Mondy | R | 18.63 | [11] | |
| 4.416 | 3090 | - | HMT | unfilter | 19.5 | [18] | |
| 4.765 | 2070 | (80.046, 25.560) | VLA | X | 169 | candidate 1 (unlikely) | [12] |
| 4.765 | 2070 | (80.050, 25.535) | VLA | X | 82 | candidate 2 (unlikely) | [12] |
| 4.765 | 2070 | (80.020, 25.530) | VLA | X | 157 | candidate 3 (undetermined) | [12] |
| 4.765 | 2070 | (80.025, 25.522) | VLA | X | 38 | candidate 4 (undetermined) | [12] |
| 4.765 | 2070 | (79.999, 25.546) | VLA | X | 49 | candidate 5 (undetermined) | [12] |
| 4.765 | 2070 | (80.020, 25.558) | VLA | X | 30 | candidate 6 (ruled out) | [12] |
| 4.765 | 2070 | (79.969, 25.530) | VLA | X | 300 | candidate 7 (ruled out) | [12] |
| 5.685 | 12200 | - | NOT | z | 22.5 | [18] | |
| 5.754 | 1200 | - | REM | r | 19.9 | [13] | |
| 5.754 | 1200 | - | REM | H | 18.69 | [13] | |
| 5.768 | 1200 | - | GROND | J | candidate 3 | [18] | |
| 5.768 | 1200 | - | GROND | H | candidate 3 | [18] | |
| 5.768 | 1200 | - | GROND | candidate 3 | [18] | ||
| 5.877 | - | - | WINTER | J | 18.5 | unknown exposure time | [14] |
| 5.959 | 4300 | (80.020, 25.530) | Keck II/NIRES | K′ | 20.84 | candidate 3 | [15] |
| 6.619 | 9110 | (80.020, 25.530) | GTC/EMIR | J | 21.66 0.10 | candidate 3 | [18] |
| 6.619 | 9110 | (80.025, 25.522) | GTC/EMIR | J | 25.86 | candidate 4 | [18] |
| 6.619 | 9110 | (79.999, 25.546) | GTC/EMIR | J | 22.33 0.11 | candidate 5 | [18] |
| 6.639 | 1886 | (80.020, 25.530) | GTC/EMIR | H | 20.86 0.10 | candidate 3 | [18] |
| 6.639 | 1886 | (80.025, 25.522) | GTC/EMIR | H | 25.92 | candidate 4 | [18] |
| 6.639 | 1886 | (79.999, 25.546) | GTC/EMIR | H | 21.58 0.09 | candidate 5 | [18] |
| 6.665 | 4203 | (80.020, 25.530) | GTC/EMIR | 19.99 0.13 | candidate 3 | [18] | |
| 6.665 | 4203 | (80.025, 25.522) | GTC/EMIR | 25.92 | candidate 4 | [18] | |
| 6.665 | 4203 | (79.999, 25.546) | GTC/EMIR | 20.92 0.13 | candidate 5 | [18] | |
| 8.748 | 1200 | - | GROND | J | candidate 3 | [18] | |
| 8.748 | 1200 | - | GROND | H | candidate 3 | [18] | |
| 8.748 | 1200 | - | GROND | candidate 3 | [18] | ||
| 10.893 | 10150 | (80.020, 25.530) | LDT/LMI | r′ | 24.9 | candidate 3 | [16] |
| 10.893 | 10150 | (80.020, 25.530) | LDT/LMI | i′ | 24.8 0.2 | candidate 3 | [16] |
| 10.893 | 10150 | (80.025, 25.522) | LDT/LMI | r′ | 25.1 | candidate 4 | [16] |
| 10.893 | 10150 | (80.025, 25.522) | LDT/LMI | i′ | 24.5 | candidate 4 | [16] |
| 10.893 | 10150 | (79.999, 25.546) | LDT/LMI | r′ | 25.1 | candidate 5 | [16] |
| 10.893 | 10150 | (79.999, 25.546) | LDT/LMI | i′ | 24.7 0.2 | candidate 5 | [16] |
| 15.627 | 16200 | - | NOT | z | 22.2 | [18] | |
| 25.741 | 1800 | - | REM | r | 19.8 | [17] | |
| 25.741 | 1800 | - | REM | H | 19.49 | [17] |
3 Long term follow-up and afterglow candidates
Follow-up observations were carried out spanning various wavelengths, from optical to radio. Since the on-board trigger was not activated during the EP commissioning phase, the first follow-up observations started approximately 2.6 days after the burst trigger. A summary of these observations, detailing the candidates and their respective upper limits, is shown in Table 3 and Figure 1.
Rapid responses and extensive efforts to search for the afterglow of GRB 240219A were made by the Liverpool Telescope, the Beijing Faint Object Spectrograph and Camera (BFOSC) mounted on the Xinglong 2.16 m Telescope (Fan et al., 2016) (XL216), the half-meter telescope (HMT; located at Xingming Observatory, China), the Nanshan Telescope, the 7-Dimensional Telescope (7DT) and the Lemonsan Optical Astronomy Observatory (LOAO). However, only upper limits were obtained during the first 3.5 days. Additionally, adverse weather conditions and poor seeing affected observations with the Gran Telescopio CANARIAS (GTC) and Lijiang Telescope. Unfortunately, despite these comprehensive early efforts, no optical or radio afterglow candidates were discovered.
At + 3.6 days, the first reported afterglow candidate was detected by the efforts of the EP collaboration using the Nordic Optical Telescope (NOT) in the z-band. On the first night of NOT observations, we found an uncatalogued target with a brightness of at equatorial coordinates (J2000.0): RA = , Dec= . The magnitude of the candidate seemed to increase slightly during the second night of observations. To make a final check of this burst, we applied for one more observation on NOT at + 15.6 days. The candidate we found before was still bright, which is not consistent with the GRB afterglow model. We also stacked all the NOT images and did not find any additional candidate associated with EP240219a. The photometric results of these observations were calibrated with the Pan-STARRS DR2 catalog (Chambers et al., 2016; Flewelling et al., 2020) and are presented in Table 3.
On February 24, 2024, at 00:26 UTC, the Very Large Array (VLA) started observing the location of GRB 240219A (Ho et al., 2024). During 34.5 minutes of on-source time in the X-band (10 GHz) radio frequency, seven point sources were detected as potential afterglow candidates within the 3 arcminutes radius region. Among these, Candidates 6 and 7 were cross-matched with ZTF deep reference r-band images. However, the identification of Candidate 7 in an earlier VLA Sky Survey indicates that it is unlikely to be linked with GRB 240219A. Later on, Candidate 6 was ruled out due to a lack of variations from the observation of NIRES acquisition camera on the Keck II telescope. Candidate 1 and 2 were ruled out because of the optical extended source with low i′ magnitude from the observation of the Large Monolithic Imager on the 4-meter Lowell Discovery Telescope (LDT).
We conducted our near-infrared follow-up using the Espectr’ografo Multiobjeto Infra-Rojo (EMIR) at the GTC starting from 21:04:48.89 UTC on February 25. Observations utilized -, -, and - band filters. Standard data reduction, including image combination, distortion correction, and flat-fielding, was performed using the Pyemir software package Pascual et al. (2010). For astrometric solutions, 60 bright, unsaturated stars from the 2MASS point source catalog were selected as Web Coverage Service (WCS) reference stars (Cutri et al., 2003). Coordinates were measured using the imexamine task of the Image Reduction and Analysis Facility (IRAF, Tody, 1986, 1993).222IRAF is distributed by the National Optical Astronomy Observatory, operated by the Association of Universities for Research in Astronomy (AURA) under a cooperative agreement with the National Science Foundation. The CCMAP routine in IRAF was used for precise astrometric solutions, with rms uncertainties in (R.A., decl.) of (, ) for all frames. Six candidates were identified in the GTC field. Without observing standard stars, we selected 20 bright, isolated, non-saturated stars from the 2MASS catalog within the GTC field as photometric reference stars for each band. The zero point of the images was established with these reference stars, and apparent magnitudes were obtained using the background-subtracted flux of the candidates and the zero point. The final AB magnitudes, converted using the Vega and AB magnitude relationship from Blanton et al. (2005), are listed in Table 3.
Further additional detection of Candidate 3 was made using the Gamma-ray Burst Optical Near-infrared Detector (GROND) at the 2.2m MPE telescope at La Silla, at days. This detection showed a slightly higher flux density compared to the GTC observation at days. Additionally, the band detection of Candidate 3 from GTC at days is brighter than the detection from Keck II at days. However, due to the limited number of observations for Candidate 3, we are currently unable to confirm whether it is the afterglow counterpart or to discuss additional components/features, such as a supernova.
As of this writing, all follow-up observations did not confirm any candidate as the afterglow counterpart associated with GRB 240219A. Candidates 3, 4 and 5 remain undetermined. The absence of confirmed afterglow counterpart and the current uncertainty are primarily influenced by several factors: the relatively long latency ( 44.5 hours) of the burst notice (EP ATel; Zhang et al., 2024c, d), which caused a relatively late start of follow-up observations; the large localization region initially provided by EP/WXT during its commissioning phase, which made the search for optical sources more challenging; and the possibility of an intrinsically dark afterglow and/or a high redshift of the burst. In the latter case, according to the Amati relation (see Section 4), the redshift of the burst may exceed 1.5, thus explaining the absence of detectable afterglow at days and beyond.
4 Nature of the Burst
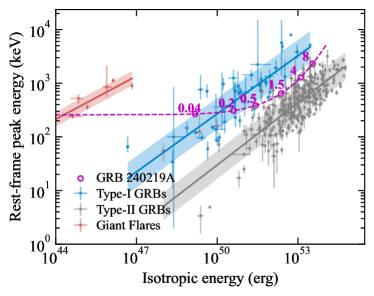
As a bright X-ray transient detected by EP/WXT, EP240219a’s reclassification as a GRB is based on the simultaneous gamma-ray detection, characterized by a hard spectrum and peak energy exceeding 100 keV. Due to the unknown distance of this cosmological event, we plot this GRB along the curve with various redshifts on the Ep,z-Eiso diagram (Amati et al., 2002). Based on Figure 5, we deduce that for GRB 240219A to appear as an intrinsic Type-II GRB, its redshift is likely no less than approximately 1.5. Furthermore, the detection by EP/WXT may indicate significant X-ray emission, providing an opportunity to investigate the subclassification of the GRB and the dominated spectral components during the prompt emission phase.
4.1 C-GRB, XRR or XRF?
Within the broad sample of GRBs, which exhibit a wide range of peak energies, two empirically identified subclasses with more dominant X-ray emission are known as XRFs and XRRs (Heise et al., 2001; Kippen et al., 2001; Barraud et al., 2003; Atteia et al., 2004; Barraud et al., 2005). XRFs are characterized by stronger X-ray emission compared to the typical intensity observed in C-GRBs. XRRs occupy an intermediate position between XRFs and C-GRBs, displaying relatively softer gamma-ray emission than C-GRBs. The classification of these subclasses has been systematically studied in various papers (Kippen et al., 2003; Sakamoto et al., 2005; D’Alessio et al., 2006; Sakamoto et al., 2006, 2008; Bi et al., 2018; Liu & Mao, 2019). However, the exact physical processes underpinning the manifestation of XRFs and XRRs remain contentious within the field.
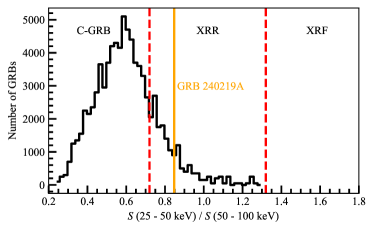
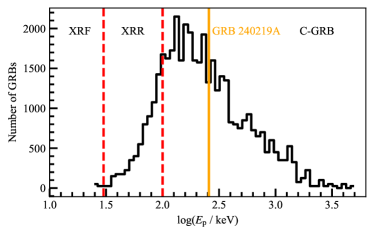

To classify C-GRBs, XRRs and XRFs, two approaches based on spectral properties can be adopted. Initially, XRFs are identified through detection by the BeppoSAX/Wide Field Camera (WFC) but remain untriggered by the BeppoSAX/Gamma Ray Burst Monitor (GRBM) (Heise et al., 2001). The spectral peak energy, , is then used as a criterion to distinguish between these subclasses (Sakamoto et al., 2005; Zhang, 2018). Sakamoto et al. (2005) established the boundary at 30 keV between XRFs and XRRs, and at 100 keV between XRRs and C-GRBs (Zhang, 2018). Alternatively, considering cross-instrument compatibility, C-GRBs, XRRs, and XRFs are proposed to be categorized according to the fluence ratio in different bands, such as / (Sakamoto et al., 2008) and / (Sakamoto et al., 2005).
To explore the subclassification of GRB 240219A, we utilize the best-fit parameters of the time-integrated joint-fit spectrum with one CPL model obtained in Section 2.2. The observed peak energy of the burst aligns with the typical values of Fermi/GBM detected GRB samples333https://heasarc.gsfc.nasa.gov/W3Browse/fermi/fermigbrst.html, categorizing it as a C-GRB. However, the fluence ratio, / , is , which deviates from the expected values for C-GRBs. This indicates that the burst is classified as an XRR, as illustrated in Figure 6. We note that the other fluence ratio, introduced by Sakamoto et al. (2005) in the study of HETE-2 GRB samples, log[ / ] , also classifies it as an XRR.
We further investigated the boundaries of the fluence ratio / within the parameter space of the CPL model. As depicted in Figure 7, there is a strong correlation between the fluence ratio and the observed spectral peak energy, as previously observed by Sakamoto et al. (2005), particularly when the photon index exceeds -1.2. However, GRB 240219A exhibits a lower value of , placing it in a controversial region where the fluence ratio fails to constrain a reasonable peak energy. This event challenges the current working definitions of GRB subclassification, highlighting the need for further exploration into the subclass nature of GRBs using a larger sample of events detected across a broad energy range, such as the soft X-rays of prompt emission detected by EP/WXT.
4.2 Implication of spectral components
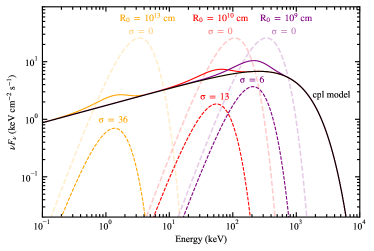
The GRB prompt emission spectrum often comprises three elemental spectral components, as discussed by Zhang et al. (2011): a non-thermal component, a quasi-thermal component and another non-thermal high-energy component. While the third component remains undetected in GRB 240219A, the first component, well-described by the CPL model, dominates throughout the burst. Here, as the photon indices fall below the so-called synchrotron death line (-2/3) (Preece et al., 1998), we attribute the CPL component to the non-thermal synchrotron radiation in the optically thin region. Moreover, to establish a lower limit for the anticipated photosphere spectrum within the framework of the internal shock model in the baryon-dominated outflow, we first assume that the photosphere emission of the ejecta generates a blackbody spectrum. By comparing how such a blackbody spectrum fits the observed data, we can measure the extent to which the outflow deviates from a purely thermal photospheric origin.
We examine the significance of the presence of a quasi-thermal-like component in the observed spectrum of GRB 240219A. Assuming , where is the Poynting luminosity and is the baryonic luminosity, the initial wind luminosity sets a lower bound equal to the observed gamma-ray luminosity , given by . The estimated observed blackbody temperature is , where is the radius of the fireball base, is the Stefan-Boltzmann energy density constant, and is the speed of light. Figure 8 shows that significant thermal-like peaks deviate from the observed spectrum.
Our analysis suggests a significant magnetization of the central engine of GRB 240219A, with the majority of energy being carried by magnetic fields instead of photons in the hot outflow. This phenomenon effectively suppresses the bright photosphere component. Furthermore, we can estimate a minimum value, which represents the fraction of baryonic flux concealed. Here, we implement the following approach to estimate the lower limit of (Yang et al., 2023, see also Gao & Zhang (2015)). Based on the best-fit spectrum of GRB 240219A, we introduce a hybrid model with an additional blackbody component to the CPL model by substituting with . We then determine the minimum value at which the goodness of fit to the data becomes unacceptable. To quantify this, we employ the Akaike Information Criterion (AIC; Akaike, 1974; Sugiura, 1978), setting the threshold for the goodness of fit at (Krishak & Desai, 2020). Our calculations reveal a lower limit of for , indicating that the outflow is mostly dominated by Poynting flux.
5 Summary and Discussion
In this Letter, we report on the first EP detection of a bright X-ray flare, EP240219a, which is associated with an untriggered GRB with consistent trigger time and overall profile. The peak of the burst shows a delay between the detections by EP/WXT and Fermi/GBM. Nonetheless, the possible substructures are not resolved because of the weak gamma-ray detection and the limited number of X-ray photons. We then conducted both individual and joint spectral fits with EP/WXT and Fermi/GBM data. Our findings suggest a seeming spectral discrepancy between the two emission bands when fitted individually. However, due to the large uncertainties, this discrepancy is likely not significant. A single CPL model can sufficiently account for the overall spectra. This indicates a coherent broad emission of a typical GRB with a photon index of and a peak energy of keV. Attributing the CPL component to the non-thermal synchrotron radiation, we further obtained a lower limit of the Poynting flux and the baryonic flux ratio , implying the outflow is predominantly Poynting flux-dominated. Furthermore, the spectral characteristics contribute additional insights into the subclassification of GRBs. Identifying GRB 240219A as an XRR with a high peak energy presents both challenges and opportunities for understanding and exploring the physical conditions of XRFs, XRRs and C-GRBs.
Long-term follow-up observations are essential to build on the findings from GRB 240219A. Although localization and follow-up detection efforts did not yield a confirmed afterglow, they highlight the need for rapid response to capture the precise location and early afterglow phases, which are critical for progenitor and central engine studies.
The observation of GRB 240219A showcases the EP’s ability to detect and analyze high-energy fast transients. Being the first GRB observed by EP, GRB 240219A illustrates the instrument’s capability to investigate the soft X-ray component of GRB prompt emissions. Additionally, EP’s recent detection of EP240617a (Zhou et al., 2024), in correlation with another untriggered XRR, GRB 240617A (Yang et al., 2024), highlights its proficiency in identifying and researching XRRs. Together, these observations underline EP’s substantial role in enhancing our understanding of GRBs with more attributes, particularly those that might otherwise remain unnoticed due to their weak gamma-ray signals or high redshift (Liu et al., 2024).
References
- Akaike (1974) Akaike, H. 1974, IEEE Transactions on Automatic Control, 19, 716, doi: 10.1109/TAC.1974.1100705
- Amati et al. (2002) Amati, L., Frontera, F., Tavani, M., et al. 2002, A&A, 390, 81, doi: 10.1051/0004-6361:20020722
- Arnaud (1996) Arnaud, K. A. 1996, in Astronomical Society of the Pacific Conference Series, Vol. 101, Astronomical Data Analysis Software and Systems V, ed. G. H. Jacoby & J. Barnes, 17
- Atteia et al. (2004) Atteia, J. L., Barraud, C., Lestrade, J. P., et al. 2004, in Astronomical Society of the Pacific Conference Series, Vol. 312, Gamma-Ray Bursts in the Afterglow Era, ed. M. Feroci, F. Frontera, N. Masetti, & L. Piro, 12
- Barraud et al. (2005) Barraud, C., Daigne, F., Mochkovitch, R., & Atteia, J. L. 2005, A&A, 440, 809, doi: 10.1051/0004-6361:20041572
- Barraud et al. (2003) Barraud, C., Olive, J. F., Lestrade, J. P., et al. 2003, A&A, 400, 1021, doi: 10.1051/0004-6361:20030074
- Bi et al. (2018) Bi, X., Mao, J., Liu, C., & Bai, J.-M. 2018, The Astrophysical Journal, 866, 97, doi: 10.3847/1538-4357/aadcf8
- Blanton et al. (2005) Blanton, M. R., Schlegel, D. J., Strauss, M. A., et al. 2005, AJ, 129, 2562, doi: 10.1086/429803
- Bochenek et al. (2024) Bochenek, A., Hinds, K. R., & Perley, D. A. 2024, GRB Coordinates Network, 35783, 1
- Buchner et al. (2014) Buchner, J., Georgakakis, A., Nandra, K., et al. 2014, A&A, 564, A125, doi: 10.1051/0004-6361/201322971
- Cai et al. (2024) Cai, C., Xiong, S.-L., Song, L.-M., Zhang, S.-N., & Insight-HXMT Team. 2024, GRB Coordinates Network, 35785, 1
- Cash (1979) Cash, W. 1979, ApJ, 228, 939, doi: 10.1086/156922
- Chambers et al. (2016) Chambers, K. C., Magnier, E. A., Metcalfe, N., et al. 2016, arXiv e-prints, arXiv:1612.05560, doi: 10.48550/arXiv.1612.05560
- Cutri et al. (2003) Cutri, R. M., Skrutskie, M. F., van Dyk, S., et al. 2003, 2MASS All Sky Catalog of point sources.
- D’Alessio et al. (2006) D’Alessio, V., Piro, L., & Rossi, E. M. 2006, A&A, 460, 653, doi: 10.1051/0004-6361:20054501
- DeLaunay et al. (2024) DeLaunay, J., Tohuvavohu, A., Ronchini, S., et al. 2024, GRB Coordinates Network, 35784, 1
- Fan et al. (2016) Fan, Z., Wang, H., Jiang, X., et al. 2016, PASP, 128, 115005, doi: 10.1088/1538-3873/128/969/115005
- Feroz & Hobson (2008) Feroz, F., & Hobson, M. P. 2008, MNRAS, 384, 449, doi: 10.1111/j.1365-2966.2007.12353.x
- Feroz et al. (2009) Feroz, F., Hobson, M. P., & Bridges, M. 2009, MNRAS, 398, 1601, doi: 10.1111/j.1365-2966.2009.14548.x
- Feroz et al. (2019) Feroz, F., Hobson, M. P., Cameron, E., & Pettitt, A. N. 2019, The Open Journal of Astrophysics, 2, 10, doi: 10.21105/astro.1306.2144
- Ferro et al. (2024a) Ferro, M., Brivio, R., Hu, Y. D., et al. 2024a, GRB Coordinates Network, 35803, 1
- Ferro et al. (2024b) Ferro, M., Hu, Y. D., D’Avanzo, P., et al. 2024b, GRB Coordinates Network, 35978, 1
- Fletcher et al. (2024) Fletcher, C., Lesage, S., Jenke, P., & Fermi-GBM Team. 2024, GRB Coordinates Network, 35776, 1
- Flewelling et al. (2020) Flewelling, H. A., Magnier, E. A., Chambers, K. C., et al. 2020, ApJS, 251, 7, doi: 10.3847/1538-4365/abb82d
- Gao & Zhang (2015) Gao, H., & Zhang, B. 2015, The Astrophysical Journal, 801, 103, doi: 10.1088/0004-637X/801/2/103
- Heise et al. (2001) Heise, J., Zand, J. i. t., Kippen, R. M., & Woods, P. M. 2001, in Gamma-Ray Bursts in the Afterglow Era, ed. E. Costa, F. Frontera, & J. Hjorth (Berlin, Heidelberg: Springer Berlin Heidelberg), 16–21
- Ho et al. (2024) Ho, A. Y. Q., Rodriguez, A., Kasliwal, M., Kulkarni, S., & Perley, D. 2024, GRB Coordinates Network, 35788, 1
- Karambelkar et al. (2024a) Karambelkar, V., Ahumada, T., & Kasliwal, M. 2024a, GRB Coordinates Network, 35808, 1
- Karambelkar et al. (2024b) Karambelkar, V., Frostig, D., Stein, R., et al. 2024b, GRB Coordinates Network, 35807, 1
- Kippen et al. (2003) Kippen, R. M., Woods, P. M., Heise, J., et al. 2003, in American Institute of Physics Conference Series, Vol. 662, Gamma-Ray Burst and Afterglow Astronomy 2001: A Workshop Celebrating the First Year of the HETE Mission, ed. G. R. Ricker & R. K. Vanderspek (AIP), 244–247, doi: 10.1063/1.1579349
- Kippen et al. (2001) Kippen, R. M., Woods, P. M., Heise, J., et al. 2001, in Gamma-Ray Bursts in the Afterglow Era, ed. E. Costa, F. Frontera, & J. Hjorth (Berlin, Heidelberg: Springer Berlin Heidelberg), 22–25
- Krishak & Desai (2020) Krishak, A., & Desai, S. 2020, Journal of Cosmology and Astroparticle Physics, 2020, 006, doi: 10.1088/1475-7516/2020/07/006
- Liu & Mao (2019) Liu, C., & Mao, J. 2019, The Astrophysical Journal, 884, 59, doi: 10.3847/1538-4357/ab3e75
- Liu et al. (2024) Liu, Y., Sun, H., Xu, D., et al. 2024, arXiv e-prints, arXiv:2404.16425, doi: 10.48550/arXiv.2404.16425
- Minaev et al. (2024) Minaev, P., Pozanenko, A., Chelovekov, I., Grebenev, S., & IKI FuN, G. 2024, GRB Coordinates Network, 35786, 1
- Norris et al. (2000) Norris, J. P., Marani, G. F., & Bonnell, J. T. 2000, ApJ, 534, 248, doi: 10.1086/308725
- Paek et al. (2024a) Paek, G. S. H., Im, M., Choi, H., et al. 2024a, GRB Coordinates Network, 35790, 1
- Paek et al. (2024b) Paek, G. S. H., Im, M., Lee, C.-U., et al. 2024b, GRB Coordinates Network, 35791, 1
- Pankov et al. (2024) Pankov, N., Pozanenko, A., Klunko, E., Belkin, S., & IKI-GRB-FuN. 2024, GRB Coordinates Network, 35787, 1
- Pascual et al. (2010) Pascual, S., Gallego, J., Cardiel, N., & Eliche-Moral, M. C. 2010, in Astronomical Society of the Pacific Conference Series, Vol. 434, Astronomical Data Analysis Software and Systems XIX, ed. Y. Mizumoto, K. I. Morita, & M. Ohishi, 353
- Preece et al. (1998) Preece, R. D., Briggs, M. S., Mallozzi, R. S., et al. 1998, ApJ, 506, L23, doi: 10.1086/311644
- Sakamoto et al. (2005) Sakamoto, T., Lamb, D. Q., Kawai, N., et al. 2005, The Astrophysical Journal, 629, 311, doi: 10.1086/431235
- Sakamoto et al. (2006) Sakamoto, T., Barbier, L., Barthelmy, S. D., et al. 2006, The Astrophysical Journal, 636, L73, doi: 10.1086/500261
- Sakamoto et al. (2008) Sakamoto, T., Hullinger, D., Sato, G., et al. 2008, The Astrophysical Journal, 679, 570, doi: 10.1086/586884
- Scargle et al. (2013) Scargle, J. D., Norris, J. P., Jackson, B., & Chiang, J. 2013, The Astrophysical Journal, 764, 167, doi: 10.1088/0004-637X/764/2/167
- Schwarz (1978) Schwarz, G. 1978, The Annals of Statistics, 6, 461 , doi: 10.1214/aos/1176344136
- Sonbas et al. (2015) Sonbas, E., MacLachlan, G. A., Dhuga, K. S., et al. 2015, ApJ, 805, 86, doi: 10.1088/0004-637X/805/2/86
- Srinivasaragavan et al. (2024) Srinivasaragavan, G. P., Hammerstein, E., Karambelkar, V., et al. 2024, GRB Coordinates Network, 35865, 1
- Sugiura (1978) Sugiura, N. 1978, Communications in Statistics - Theory and Methods, 7, 13, doi: 10.1080/03610927808827599
- Tody (1986) Tody, D. 1986, in Society of Photo-Optical Instrumentation Engineers (SPIE) Conference Series, Vol. 627, Instrumentation in astronomy VI, ed. D. L. Crawford, 733, doi: 10.1117/12.968154
- Tody (1993) Tody, D. 1993, in Astronomical Society of the Pacific Conference Series, Vol. 52, Astronomical Data Analysis Software and Systems II, ed. R. J. Hanisch, R. J. V. Brissenden, & J. Barnes, 173
- Ukwatta et al. (2010) Ukwatta, T. N., Stamatikos, M., Dhuga, K. S., et al. 2010, The Astrophysical Journal, 711, 1073, doi: 10.1088/0004-637X/711/2/1073
- Wilms et al. (2000) Wilms, J., Allen, A., & McCray, R. 2000, ApJ, 542, 914, doi: 10.1086/317016
- Xie et al. (2017) Xie, W., Lei, W.-H., & Wang, D.-X. 2017, ApJ, 838, 143, doi: 10.3847/1538-4357/aa6718
- Xu et al. (2024) Xu, D., Jin, J., He, M., et al. 2024, GRB Coordinates Network, 35795, 1
- Yang et al. (2024) Yang, J., Yin, Y.-H. I., Zhang, B., et al. 2024, GRB Coordinates Network, 36692, 1
- Yang et al. (2022) Yang, J., Ai, S., Zhang, B.-B., et al. 2022, Nature, 612, 232, doi: 10.1038/s41586-022-05403-8
- Yang et al. (2023) Yang, J., Zhao, X.-H., Yan, Z., et al. 2023, ApJ, 947, L11, doi: 10.3847/2041-8213/acc84b
- Yuan et al. (2022) Yuan, W., Zhang, C., Chen, Y., & Ling, Z. 2022, in Handbook of X-ray and Gamma-ray Astrophysics, 86, doi: 10.1007/978-981-16-4544-0_151-1
- Zhang (2018) Zhang, B. 2018, The Physics of Gamma-Ray Bursts, doi: 10.1017/9781139226530
- Zhang et al. (2024a) Zhang, B., Sun, H., Yin, Y.-H. I., et al. 2024a, The Astronomer’s Telegram, 16473, 1
- Zhang et al. (2024b) —. 2024b, GRB Coordinates Network, 35773, 1
- Zhang et al. (2011) Zhang, B.-B., Zhang, B., Liang, E.-W., et al. 2011, The Astrophysical Journal, 730, 141, doi: 10.1088/0004-637X/730/2/141
- Zhang et al. (2012) Zhang, B.-B., Burrows, D. N., Zhang, B., et al. 2012, The Astrophysical Journal, 748, 132, doi: 10.1088/0004-637X/748/2/132
- Zhang et al. (2024c) Zhang, C., Ling, Z. X., Liu, Y., et al. 2024c, The Astronomer’s Telegram, 16463, 1
- Zhang et al. (2024d) —. 2024d, The Astronomer’s Telegram, 16472, 1
- Zhou et al. (2024) Zhou, H., Chen, W., Sun, H., et al. 2024, GRB Coordinates Network, 36691, 1