Unsupervised Anomaly Detection Using Diffusion Trend Analysis
Abstract
Conventional anomaly detection techniques based on reconstruction via denoising diffusion model are widely used due to their ability to identify anomaly locations and shapes with high performance. However, there is a limitation in determining appropriate noise parameters that can degrade anomalies while preserving normal characteristics. Also, due to the volatility of the diffusion model, normal regions can fluctuate considerably during reconstruction, resulting in false detection. In this paper, we propose a method to detect anomalies by analysis of reconstruction trend depending on the degree of degradation, effectively solving the both problems of existing methods. The proposed method is validated on an open dataset for industrial anomaly detection, improving the performance of existing methods on a number of evaluation criteria. With the ease of combination with existing anomaly detection methods, it provides a trade-off between computational cost and performance, allowing it high application potential in manufacturing industry.
Index Terms:
Anomaly detection, Diffusion, Trend analysisI Introduction
Unsupervised anomaly detection is widely used in industrial inspection to build a line of defense against unexpected defects, and reconstruction-based approaches are particularly useful because they can detect both the anomaly’s location and shape [1, 2]. In principle, the reconstruction generates “normal” image that acts as a standard to be compared with anomaly. An image is reconstructed based on a model, and if the reconstruction obtained is different from the original image, an anomaly is likely. As the generation of a proper normal image is essential to detect anomalies, many recent studies have adopted diffusion models due to their ability to produce high-quality normal images [3, 4, 5]. Specifically, diffusion-based anomaly detection first degrades the input image to some degree by adding noise, and then reconstructs the degraded image using a diffusion model trained only on normal images [6, 7]. The diffusion model denoises noisy images to follow the distribution of normal data, so if the input anomaly image is noisy enough to be indistinguishable from normal, the reconstructed image can be considered normal. Therefore, the reconstructed normal image can be compared to the original anomaly image to obtain an anomaly score, based on the assumption that the reconstruction error in anomaly regions is larger than the error in normal regions.
While diffusion-reconstruction-based anomaly detection has advantages, it also has two major drawbacks. First, it is difficult to determine the proper noise level to degrade the input image. Larger noise levels reduce anomalies, but they can also distort normal regions. Second, diffusion models can create large variations even in normal regions during reconstruction, resulting in false positives. This is due to the high diversity of the diffusion model, which generates samples covering a wide range of normal distributions [8].
In this work, we propose a novel approach that addresses both issues by focusing on the trend of reconstruction with increasing degradation noise instead of relying solely on reconstruction errors at a single noise level. When an anomaly image is reconstructed with a diffusion model after noise is added, the resulting reconstruction has a gradual trend as the noise added increases. Since the denoising diffusion model is trained to generate a normal image, the gradual degradation of the anomaly by noise added creates a trend in which it becomes increasingly normal. This trend is independent of the morphological features of the anomaly, which solves the problem of determining the proper noise level in the conventional method. The trend-based approach also reduces false positives in normal regions because it distinguishes reconstructed normal variants from anomaly regions, based on the observation that the fluctuation in normal regions does not have a directional trend with noise level, whereas anomaly regions has a change in one direction by gradually progressing from anomaly to normal.
We demonstrate that we can significantly improve the stability and performance of anomaly detection by employing the trend analysis. Evaluated using the MVTec anomaly detection dataset, the proposed method improves mAUROC by 4.6% and mAP by 23.5% over the baseline method.
II Background
A denoising diffusion model is a type of generative model that learns to generate data by reversing a diffusion process. It involves a forward diffusion process that maps data to noise and a learned reverse process for data generation. These models have shown remarkable results in high-fidelity image generation, outperforming other generative models like generative adversarial networks (GANs) [8], and have applications in image editing, super-resolution, and more due to their ability to provide high mode coverage of the training data distribution [3, 4, 5].
A diffusion model is useful in anomaly detection due to the ease of generating high-quality anomaly-free images from anomaly images, even though the diffusion model was trained only on normal images. Reconstruction-based anomaly detection using diffusion models works by adding noise and reconstructing it to generate a normal image, which is then compared to the original anomaly image. If the diffusion model replaces the anomaly with normal while preserving the original information, only the anomaly region is different, allowing the recon error to become the anomaly score. Based on this principle, diffusion-based anomaly detection methods have been recently proposed [6, 7].
To get the best result, it is important to create a good normal image to compare with, one that removes the anomaly while keeping the other information intact. This ensures that only anomaly regions are differentiated clearly without over- or under-detection. The process of generating a normal image from an anomaly through the diffusion model is composed of a forward process and a reverse process. Noise is first added to make it difficult to distinguish the anomaly from the normal, and then denoising is used to create a normal image that is close to the original [6, 7]. In this context, there are two challenges associated with generating a proper normalized image.
First, it is hard to determine the optimal noise level. The proper noise level is crucial because it is the mediator that converts an anomaly into something normal. If there is not enough noise, untrained anomalies may still be present, preventing the image from being restored to normal. On the other hand, if there is too much noise, the normal regions are degraded to the point where they cannot contain their original characteristics, resulting in many false positives. It is difficult to set the ideal noise level since it depends on the color, size, and shape of the unknown anomaly. Moreover, an image can even has multiple anomalies so it is impossible to determine one single value for all of them.
Second, false positives can be caused by the mode coverage property of the diffusion model. Diffusion models can produce a lot of variation even in normal regions and the reconstruction error can be high especially in regions with high contrast and fine detail.
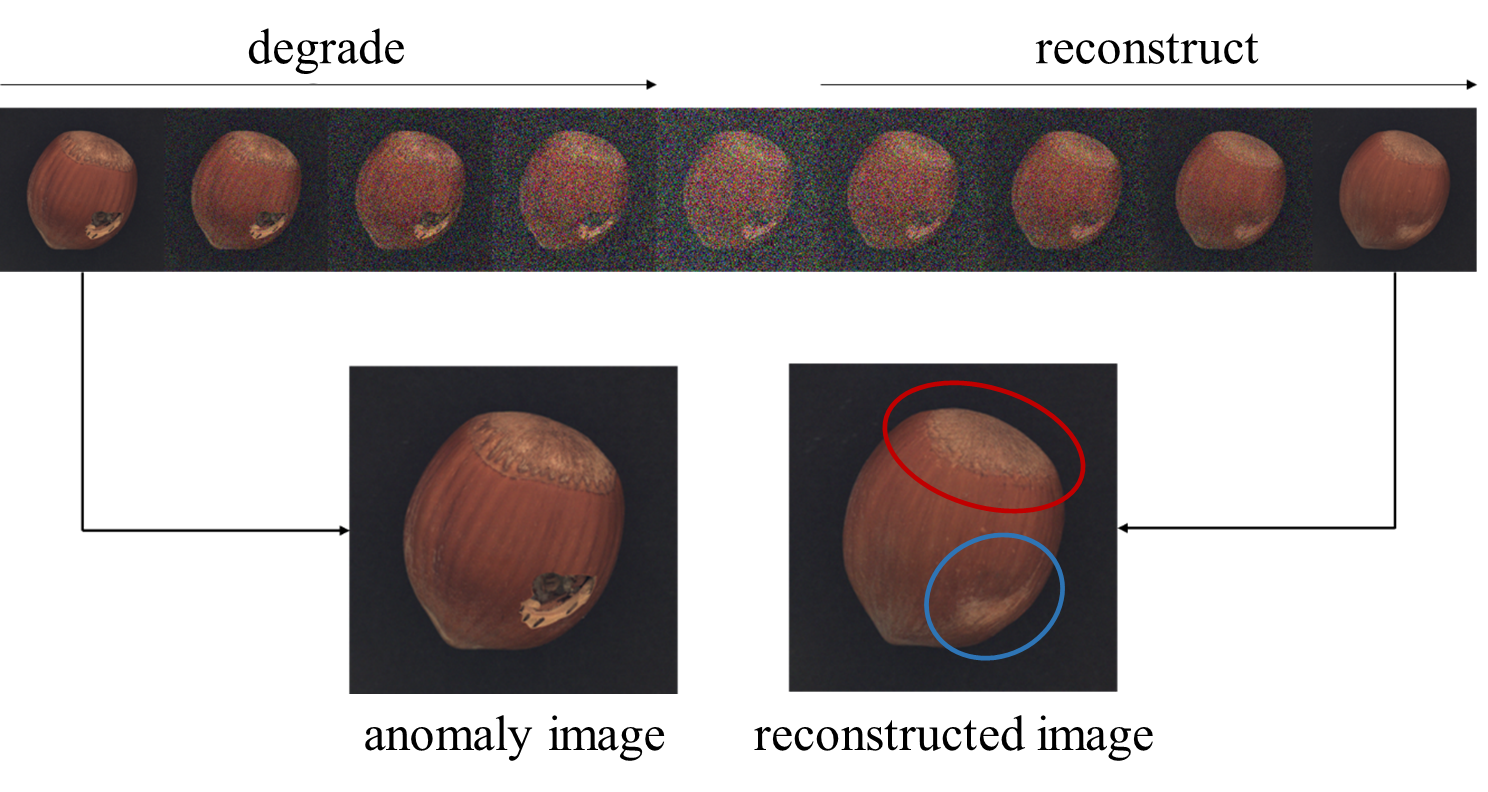
As an example of the conventional method, Figure 1 illustrates the anomaly detection process on a hazelnut image. The broken part in the hazelnut is the target region to be detected as anomaly. The rightmost image is the reconstructed normal image to be compared to the original. Note that the anomaly region is converted to normal (blue), but another normal region with a fine detail also has been deformed (red), indicating the problem of false positives using the conventional method.
III Method
To overcome the limitation of the conventional method, we propose an approach to analyze the trend of the reconstructions rather than just computing the reconstruction error for a particular noise level (Figure 2). As described above, in the reconstruction-based anomaly detection methods using diffusion, the noise level that degrades the image is an important parameter. By increasing the noise level and examining the trend of the reconstructed image as it changes, we obtain more information for a more reliable analysis, without relying on one critical parameter value. A gradually changing noise level will create a gradual change in the reconstructed image. The gradually changing noise level creates a gradual trend in the reconstruction image, where the anomaly region has a distinct trend from the normal region. If the noise level is insignificant, the anomaly will not be degraded enough, and it cannot be reconstructed to normal by the diffusion model. On the other hand, if the noise level is high enough, the anomaly will be sufficiently degraded to be indistinguishable from normal, and the diffusion model will be able to reconstruct it to normal. This means that as the noise level increases, the diffusion model is increasingly able to reconstruct the anomaly region similar to normal, and by analyzing each pixel to detect this gradual trend, anomaly region can be performed at the pixel level. Normal regions can also show some fluctuation in the reconstructed image due to different noise levels, but they are distinguished from anomalies by the absence of such large, gradual trends.
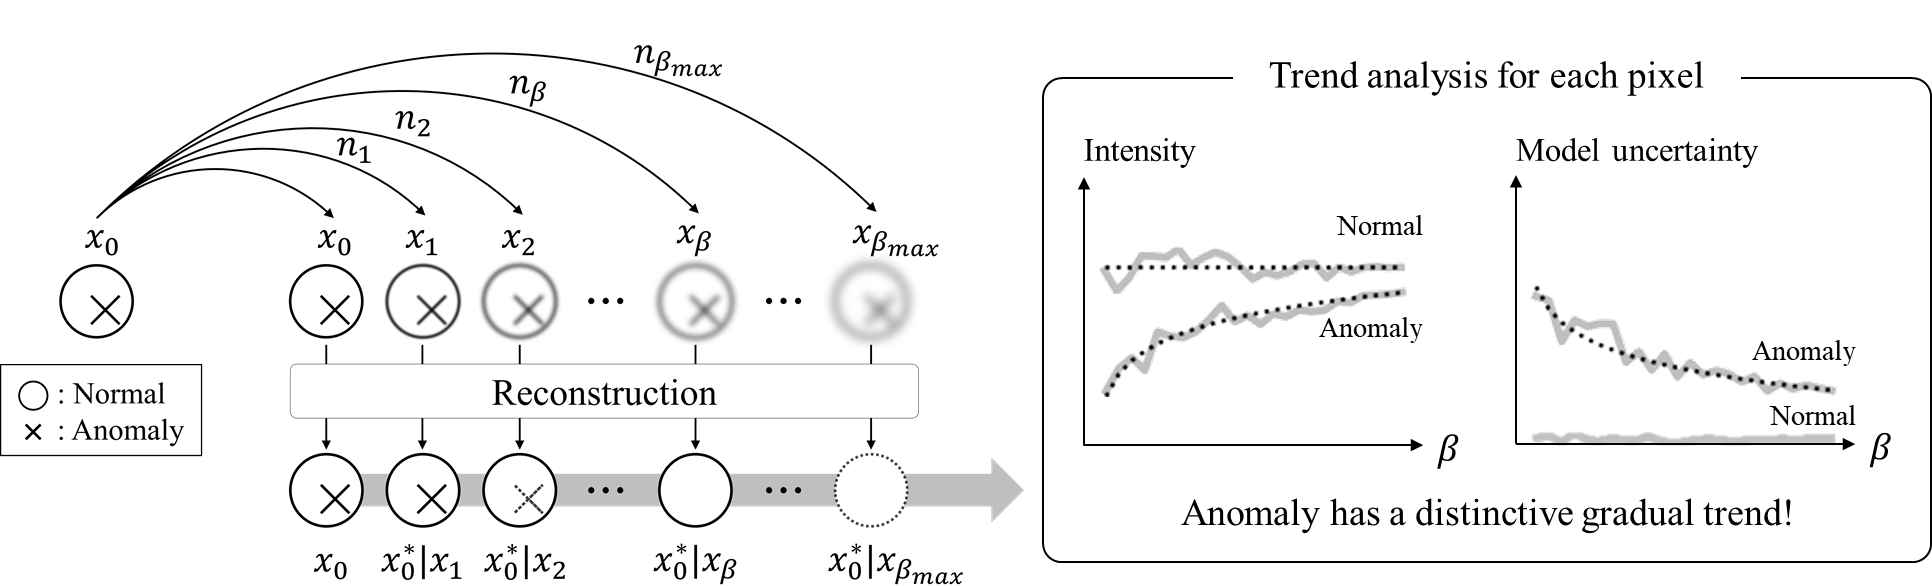
The existence of these trends in the reconstructed images is independent of the morphological characteristics of the anomalies, such as color, size, thickness, so the method solves the problem of properly setting the noise parameter for a range of unknown anomalies. It also mitigates the problem of false positives in normal regions because the fluctuations that occur in normal regions have a constant center and no significant trend, while anomalies change in one direction, slowly progressing from anomaly to normal.
In addition to analyzing the trend of the intensity, the proposed method also analyzes the trend of the model uncertainty at each pixel of the reconstructed image. Model uncertainty indicates how confidently the model predicts the clean data, and is higher on unfamiliar data not seen during training. For models trained only on normal data, the uncertainty will be higher for anomaly regions, which can be used as a cue for anomaly detection [9]. As the reconstructed image gets closer to normal with increasing noise level, the uncertainty tends to decrease, and we can identify this trend to further improve performance.
To this end, this study presents a novel method to quantify the uncertainty in diffusion models using model gradients. In the training of a neural network, a gradient conceptually means the change in the output image over each pixel change in the input image. Because the diffusion model is trained to counteract the noise in the input data, its predictions do not fluctuate much for small changes in values for familiar input data. On the other hand, for unfamiliar anomaly, the output becomes more susceptible to input changes. Since the model gradient reveals which regions of the image are susceptible to input changes, it can be used to detect anomaly. The model gradient is the value used in the network’s training process and can be easily calculated.
We analyzed these two trends together. As the input anomaly image becomes increasingly noisy, the intensity and uncertainty in each pixel of the reconstruction image changes with a gradual and large trend. By combining these two independently calculated values, more reliable anomaly detection is possible.
Since these trends are caused by adding a small amount of noise, we have prior knowledge that the trend of interest is an extremely low-frequency component that changes slowly. To quantify the magnitude of the trend, we adopted the magnitude of the second Fourier coefficient which indicates a slow trend of the reconstructed signal changing with noise level. By removing all but the smallest frequency components, except for the DC component, we are able to effectively analyze these slowly changing trends. The resulting two trends were each normalized to have a value between 0 and 1 and combined by multiplication to get the final anomaly score (Figure 3).

IV Result
We evaluated the MVTec anomaly detection dataset, a public dataset for evaluating image-based anomaly detection in various manufacturing domains [10]. While the proposed method can be combined with other reconstruction-based techniques, in this paper, we combined it with the based method, that calculates the reconstruction error with a single noise level using a diffusion model [5], to demonstrate the performance improvements. Figure 4 is an example of anomaly detection of hazelnuts (a), where a broken region corresponds to an anomaly. We set the two criteria to distinguish the anomaly: reconstruction error (b) and the model uncertainty (c), which are the targets of the trends. The result of the proposed method (d), which is the combination of the two trends, detects the anomaly cleanly and without over-detection compared to the existing method (b).
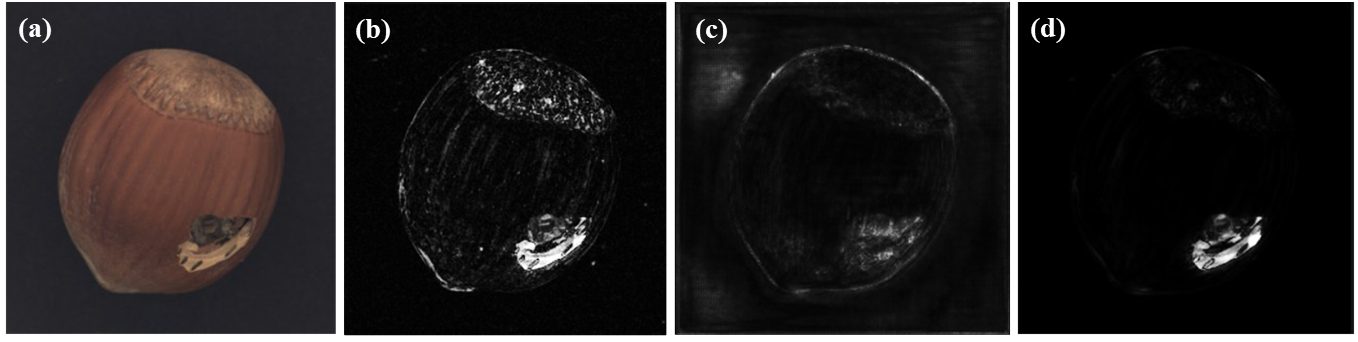
Table 1 shows the results for different types of manufacturing. In many image anomaly detection cases, the normal and anomaly regions are often very unbalanced in area, and we are interested in detecting these small anomalies. In such scenarios, average precision (AP) can be important, since it is sensitive to rare event detection performance compared to the area under the receiver operating characteristic (AUROC) curve [11]. In this study, we added AP performance analysis in addition to AUROC, and combined the performance of all defect types to obtain mean AUROC (mAUROC) and mean AP (mAP). The proposed method performs well in all defect types and is particularly strong in mAP when uncertainty trend analysis is added. The improvement in mAP is attributed to the increased sensitivity to small anomalies, the extent of which could be further controlled by adjusting the weight of uncertainty trend.
![[Uncaptioned image]](/html/2407.09578/assets/TABLE1.png)
V Conclusion
The proposed method has several beneficial properties. The diffusion model for the proposed methods is unsupervised and can be easily trained by abundant normal images. The proposed method can be used in combination with other diffusion-based reconstruction methods to provide a trade-off between computational cost and performance, simply by analyzing the trends of the anomaly score and the diffusion model. Moreover, the proposed method is flexible and compatible, allowing it to be used in conjunction with self-supervised or image-guided techniques, which can be useful in reconstruction-based anomaly detection.
In conclusion, we propose the anomaly detection method based on trend analysis, which is extensively applicable in various industrial inspection due to its robustness to parameters and anomaly characteristics.
References
- [1] Y. Cui, Z. Liu, and S. Lian, “A survey on unsupervised anomaly detection algorithms for industrial images,” IEEE Access, 2023.
- [2] H. Xu, S. Xu, and W. Yang, “Unsupervised industrial anomaly detection with diffusion models,” Journal of Visual Communication and Image Representation, vol. 97, p. 103983, 2023.
- [3] Y. Song, J. Sohl-Dickstein, D. P. Kingma, A. Kumar, S. Ermon, and B. Poole, “Score-based generative modeling through stochastic differential equations,” arXiv preprint arXiv:2011.13456, 2020.
- [4] J. Ho, A. Jain, and P. Abbeel, “Denoising diffusion probabilistic models,” Advances in neural information processing systems, vol. 33, pp. 6840–6851, 2020.
- [5] J. Song, C. Meng, and S. Ermon, “Denoising diffusion implicit models,” arXiv preprint arXiv:2010.02502, 2020.
- [6] A. Mousakhan, T. Brox, and J. Tayyub, “Anomaly detection with conditioned denoising diffusion models,” arXiv preprint arXiv:2305.15956, 2023.
- [7] J. Wyatt, A. Leach, S. M. Schmon, and C. G. Willcocks, “Anoddpm: Anomaly detection with denoising diffusion probabilistic models using simplex noise,” in Proceedings of the IEEE/CVF Conference on Computer Vision and Pattern Recognition, 2022, pp. 650–656.
- [8] P. Dhariwal and A. Nichol, “Diffusion models beat gans on image synthesis,” Advances in neural information processing systems, vol. 34, pp. 8780–8794, 2021.
- [9] S. Park, G. Adosoglou, and P. M. Pardalos, “Interpreting rate-distortion of variational autoencoder and using model uncertainty for anomaly detection,” Annals of Mathematics and Artificial Intelligence, vol. 90, no. 7, pp. 735–752, 2022.
- [10] P. Bergmann, K. Batzner, M. Fauser, D. Sattlegger, and C. Steger, “The mvtec anomaly detection dataset: a comprehensive real-world dataset for unsupervised anomaly detection,” International Journal of Computer Vision, vol. 129, no. 4, pp. 1038–1059, 2021.
- [11] J. Davis and M. Goadrich, “The relationship between precision-recall and roc curves,” in Proceedings of the 23rd international conference on Machine learning, 2006, pp. 233–240.