Rethinking Knee Osteoarthritis Severity Grading: A Few Shot Self-Supervised Contrastive Learning Approach
Abstract
Knee Osteoarthritis (OA) is a debilitating disease affecting over 250 million people worldwide. Currently, radiologists grade the severity of OA on an ordinal scale from zero to four using the Kellgren-Lawrence (KL) system. Recent studies have raised concern in relation to the subjectivity of the KL grading system, highlighting the requirement for an automated system, while also indicating that five ordinal classes may not be the most appropriate approach for assessing OA severity. This work presents preliminary results of an automated system with a continuous grading scale. This system, namely SS-FewSOME, uses self-supervised pre-training to learn robust representations of the features of healthy knee X-rays. It then assesses the OA severity by the X-rays’ distance to the normal representation space. SS-FewSOME initially trains on only ‘few’ examples of healthy knee X-rays, thus reducing the barriers to clinical implementation by eliminating the need for large training sets and costly expert annotations that existing automated systems require. The work reports promising initial results, obtaining a positive Spearman Rank Correlation Coefficient of 0.43, having had access to only 30 ground truth labels at training time.
1 Introduction
Knee Osteoarthritis (OA) is a degenerative joint disease that affects over 250 million of the world’s population [17]. Presently, the Kellgren-Lawrence (KL) system [9] is the standard OA grading system consisting of five ordinal classes from grade zero to four where grade zero is healthy and grade four is severe OA. The subjectivity of the KL grading has been an ongoing subject of concern [1], highlighting the requirement for an automated system, while also indicating that five ordinal classes may not be the most appropriate approach for assessing OA severity. This work outlines SS-FewSOME, an automated continuous grading system for knee OA. It uses self-supervised pre-training to learn robust representations of the features of healthy knee X-rays and assesses the OA severity of an X-ray based on its distance in representation space to the centre of the normal representation space. This is the core concept that forms the basis of several anomaly detection techniques such as DeepSVDD [14], Patchcore [13] and FewSOME [3], where data samples that are sufficiently distant from the normal representations are deemed ‘anomalous’.
Although several automated grading systems based on Convolutional Neural Networks (CNN) [15, 5, 2, 18, 8] have shown promising results, these approaches require large datasets consisting of thousands of X-rays for training, along with ground truth OA severity labels from experts which is a tedious and costly process that is subject to annotator variability. SS-FewSOME initially trains on ‘few’ examples of healthy knee x-rays and thus, it eliminates the aforementioned challenges and reduces the barriers to clinical implementation of Machine Learning based automated systems.
2 Methods
FewSOME was selected for the basis of this analysis due to its performance in the few shot setting. Due to the success of self-supervised techniques in representation learning [6, 16, 20], FewSOME was extended to SS-FewSOME which includes a Stochastic Data Augmentation (SDA) module to enable self-supervised training. A dataset originally obtained from the Osteoarthritis Initiative (OAI) [11] containing bilateral Posterior Anterior fixed flexion X-ray images [4] was used for this analysis.
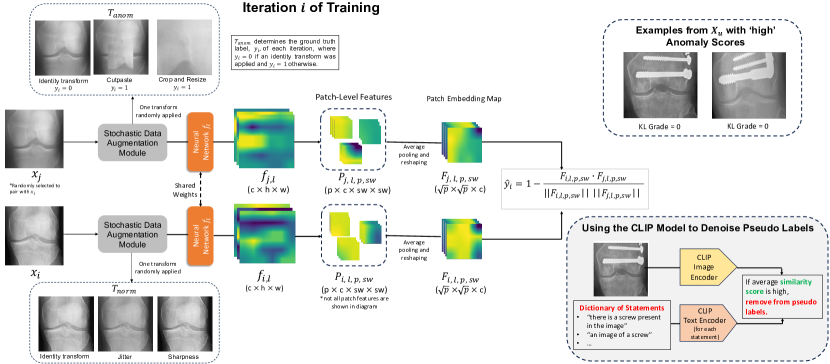
Self-Supervised Pre-Training A dataset of size consists of solely nominal images of healthy X-rays. In iteration of training, a data sample is paired with a randomly selected data sample . The original FewSOME implementation relies on ImageNet [7] pretrained weights and an ‘anchor’ for learning compact representations of the normal class where the ground truth label, is equal to zero for the duration of training. This work extends this method to use self-supervised training where both data samples, and are input into the Stochastic Data Augmentation (SDA) module. The SDA module consists of two sets of transforms, and . The set of transforms are applied only to and they consist of weak, global augmentations that aim to generate additional X-rays whose representation are within the hyper-sphere of the normal representation space. For this analysis, consists of the identity function (i.e. no transformation), applying jitter to the image and adjusting the sharpness and brightness. The set of transforms are applied only to and they consist of the identity function and strong augmentations, random cropping followed by resizing and Cutpaste [10]. These transforms were shown through experimentation to transform the image’s representation to outside of the normal representation space. The SDA determines the ground truth label with if the identity transform was applied to and otherwise.
Following the SDA, the first layers of an AlexNet initialised with ImageNET pre-trained weights, denoted as , are used to transform the input space, to the representation space, , where is the number of channels, is the height and is the width of the extracted feature maps and is set to . The later layers are removed as they are biased towards natural image classification. To improve the sensitivity of the model to localised anomalies such as osteophytes, , denoted as , is converted to patch level features. A sliding window of size with converts to patch level features, where is the number of patches. Feature aggregation is performed for each patch by average pooling and the resultant tensor is reshaped to create a patch embedding map, .
This method exploits that X-rays are spatially very similar and therefore, the cosine similarity is calculated only between patches in and that have the same coordinates. The loss function, Binary Cross Entropy was calculated based on one minus the patch cosine similarity scores and the ground truth value, (where the value of was determined by the SDA module).
Pseudo Labelling and Denoising with CLIP This method is extended for the setting where additional X-rays are available at training time but they are without expert ground truth labels. Given an unlabelled dataset of X-rays, of size where , the patch embedding map, , for each data sample is obtained, followed by the anomaly score which is equal to one minus the mean cosine similarity between and . X-rays with high anomaly scores are assumed to be severe OA cases. The model can be retrained on these cases to improve the sensitivity to OA specific anomalies with the newly assigned pseudo label of . However, knee X-rays often contain anomalies unrelated to the OA grade, a common one being the presence of screws and metal in the X-ray. The CLIP [12] model along with a dictionary of statements is used to denoise the pseudo labels. The dictionary consists of statements such as ‘there is a screw present in the image’. X-rays with significantly high similarity scores to the statements were removed. A denoised dataset of size then consists of X-rays that had a low similarity score to the statements and also a sufficiently high anomaly score. ‘High’ anomaly scores have values greater than twice the average score between each pair of normal representations in the training data.
Retraining with Pseudo Labels Retraining the model with pseudo labels is similar to the self-supervised pre-training with some key differences. The SDA is switched off and the value of is determined by where is sampled from. For example, in iteration of training, is paired with a randomly selected data sample where if and if . Additionally, as there is now more data available and therefore, the model is less prone to overfitting, the original AlexNet architecture is replaced with the larger VGG-16. The objective of the training remains the same, to obtain the patch embedding map for both and , calculate one minus the patch cosine similarity scores and compare this to the ground truth .
3 Results and Conclusion
Table 1 shows the results on a test set consisting of 1,526 X-rays before the model was retrained on pseudo labels. The table shows the Spearman Rank Correlation Coefficient (SRCC) for competing methods DeepSVDD and Patchcore, the original implementation of FewSOME and the proposed SS-FewSOME with for all methods, meaning the model trains on just 30 examples of healthy knee X-rays. SRCC measures the correlation between the model output scores and the ground truth KL grades. The results are averaged over five seeds with being randomly sampled from the dataset each time to demonstrate the model’s robustness to the contents of the training data. SS-FewSOME outperforms competing methods, demonstrating its potential for use as an automated continuous OA grading system. The table also highlights the model’s performance on the task of detecting severe OA cases (KL Grade 4) in terms of Area Under the Curve (AUC).
The model was then used to assign pseudo labels on the remaining training data and the X-rays with ‘high’ anomaly scores were considered for retraining. Prior to denoising the pseudo labels with CLIP, the percentage of grade zeros with high anomaly scores had an average value of 10.7%. This decreased to 0.7% after denoising the labels. The model was then retrained with (average) denoised pseudo labels. The results in table 1 show that the model is sensitive to noisy pseudo labels as the model performance is similar when trained on no pseudo labels and when trained with pseudo labels that were not denoised, both models scoring a SRCC of 0.35. However, by retraining with the denoised pseudo labels, the model’s performance has increased to an SRCC value of , and it can now detect severe cases of OA with an AUC of 91.2%. This is a promising result given a recent study found the interrater reliability between experts using the KL system can be as low as 0.51 [19].
This preliminary work has demonstrated SS-FewSOME’s ability as an automated continuous OA grading system whilst having a low data and annotation requirement, thus reducing the barriers to clinical implementation. The next steps will focus on further developing the pseudo labelling technique and performing a clinical evaluation of the proposed continuous grading system.
| Metric | DSVDD | Patchcore | FSOME | SS-FSOME |
|
|
||||
|---|---|---|---|---|---|---|---|---|---|---|
| SRCC |
Acknowledgements
This work was funded by Science Foundation Ireland through the SFI Centre for Research Training in Machine Learning (Grant No. 18/CRT/6183). This work is supported by the Insight Centre for Data Analytics under Grant Num- ber SFI/12/RC/2289 P2.
References
- Abedin et al. [2019] Jaynal Abedin, Joseph Antony, Kevin McGuinness, Kieran Moran, Noel E O’Connor, Dietrich Rebholz-Schuhmann, and John Newell. Predicting knee osteoarthritis severity: comparative modeling based on patient’s data and plain x-ray images. volume 9, pages 392–408, 2019.
- Bany Muhammad and Yeasin [2021] Mohammed Bany Muhammad and Mohammed Yeasin. Interpretable and parameter optimized ensemble model for knee osteoarthritis assessment using radiographs. Scientific Reports, 11(1):14348, 2021.
- Belton et al. [2023] Niamh Belton, Misgina Tsighe Hagos, Aonghus Lawlor, and Kathleen M. Curran. Fewsome: One-class few shot anomaly detection with siamese networks. In 2023 IEEE/CVF Conference on Computer Vision and Pattern Recognition Workshops (CVPRW), pages 2978–2987, 2023. doi: 10.1109/CVPRW59228.2023.00299.
- Chen [2018] Pingjun Chen. Knee osteoarthritis severity grading dataset. Mendeley Data, 1, 2018.
- Chen et al. [2019] Pingjun Chen, Linlin Gao, Xiaoshuang Shi, Kyle Allen, and Lin Yang. Fully automatic knee osteoarthritis severity grading using deep neural networks with a novel ordinal loss. Computerized Medical Imaging and Graphics, 75:84–92, 2019.
- Chen et al. [2020] Ting Chen, Simon Kornblith, Mohammad Norouzi, and Geoffrey Hinton. A simple framework for contrastive learning of visual representations. In International conference on machine learning, pages 1597–1607. PMLR, 2020.
- Deng et al. [2009] Jia Deng, Wei Dong, Richard Socher, Li-Jia Li, Kai Li, and Li Fei-Fei. Imagenet: A large-scale hierarchical image database. In 2009 IEEE conference on computer vision and pattern recognition, pages 248–255. Ieee, 2009.
- Jain et al. [2021] Rohit Kumar Jain, Prasen Kumar Sharma, Sibaji Gaj, Arijit Sur, and Palash Ghosh. Knee osteoarthritis severity prediction using an attentive multi-scale deep convolutional neural network. arXiv preprint arXiv:2106.14292, 2021.
- Kellgren and Lawrence [1957] Jonas H Kellgren and JS1006995 Lawrence. Radiological assessment of osteo-arthrosis. Annals of the rheumatic diseases, 16(4):494, 1957.
- Li et al. [2021] Chun-Liang Li, Kihyuk Sohn, Jinsung Yoon, and Tomas Pfister. Cutpaste: Self-supervised learning for anomaly detection and localization. In Proceedings of the IEEE/CVF conference on computer vision and pattern recognition, pages 9664–9674, 2021.
- Nevitt et al. [2006] M Nevitt, D Felson, and Gayle Lester. The osteoarthritis initiative. Protocol for the cohort study, 1, 2006.
- Radford et al. [2021] Alec Radford, Jong Wook Kim, Chris Hallacy, Aditya Ramesh, Gabriel Goh, Sandhini Agarwal, Girish Sastry, Amanda Askell, Pamela Mishkin, Jack Clark, et al. Learning transferable visual models from natural language supervision. In International conference on machine learning, pages 8748–8763. PMLR, 2021.
- Roth et al. [2022] Karsten Roth, Latha Pemula, Joaquin Zepeda, Bernhard Schölkopf, Thomas Brox, and Peter Gehler. Towards total recall in industrial anomaly detection. In Proceedings of the IEEE/CVF Conference on Computer Vision and Pattern Recognition, pages 14318–14328, 2022.
- Ruff et al. [2018] Lukas Ruff, Robert Vandermeulen, Nico Goernitz, Lucas Deecke, Shoaib Ahmed Siddiqui, Alexander Binder, Emmanuel Müller, and Marius Kloft. Deep one-class classification. In International conference on machine learning, pages 4393–4402. PMLR, 2018.
- Saini et al. [2023] Deepak Saini, Ashima Khosla, Trilok Chand, Devendra K Chouhan, and Mahesh Prakash. Automated knee osteoarthritis severity classification using three-stage preprocessing method and vgg16 architecture. International Journal of Imaging Systems and Technology, 2023.
- Tack et al. [2020] Jihoon Tack, Sangwoo Mo, Jongheon Jeong, and Jinwoo Shin. Csi: Novelty detection via contrastive learning on distributionally shifted instances. Advances in neural information processing systems, 33:11839–11852, 2020.
- Vos et al. [2012] Theo Vos, Abraham D Flaxman, Mohsen Naghavi, Rafael Lozano, Catherine Michaud, Majid Ezzati, Kenji Shibuya, Joshua A Salomon, Safa Abdalla, Victor Aboyans, et al. Years lived with disability (ylds) for 1160 sequelae of 289 diseases and injuries 1990–2010: a systematic analysis for the global burden of disease study 2010. The lancet, 380(9859):2163–2196, 2012.
- Wahyuningrum et al. [2019] Rima Tri Wahyuningrum, Lilik Anifah, I Ketut Eddy Purnama, and Mauridhi Hery Purnomo. A new approach to classify knee osteoarthritis severity from radiographic images based on cnn-lstm method. In 2019 IEEE 10th International Conference on Awareness Science and Technology (iCAST), pages 1–6. IEEE, 2019.
- Wright et al. [2014] Rick W Wright, James R Ross, Amanda K Haas, Laura J Huston, Elizabeth A Garofoli, David Harris, Kushal Patel, David Pearson, Jake Schutzman, Majd Tarabichi, et al. Osteoarthritis classification scales: interobserver reliability and arthroscopic correlation. The Journal of bone and joint surgery. American volume, 96(14):1145, 2014.
- Zou et al. [2022] Yang Zou, Jongheon Jeong, Latha Pemula, Dongqing Zhang, and Onkar Dabeer. Spot-the-difference self-supervised pre-training for anomaly detection and segmentation. In European Conference on Computer Vision, pages 392–408. Springer, 2022.