Thermodynamics of Giant Molecular Clouds: The Effects of Dust Grain Size
Abstract
The dust grain size distribution (GSD) likely varies significantly across different star-forming environments in the Universe, but the overall impact of this variation on star formation remains unclear. This ambiguity arises because the GSD interacts non-linearly with processes like heating/cooling, radiation, and chemistry, which have competing effects and different environmental dependencies. In this study, we investigate the effects of GSD variation on the thermochemistry and evolution of giant molecular clouds (GMCs). To achieve this, we conducted radiation-dust-magnetohydrodynamic simulations spanning a range of cloud masses and grain sizes, which explicitly incorporate the dynamics of dust grains within the full-physics framework of the STARFORGE project. We find that differences in grain size significantly alter the thermochemistry of GMCs. Specifically, we show that the leading-order effect is that larger grains, under fixed dust mass and dust-to-gas ratio conditions, result in lower dust opacities. This reduced opacity permits ISRF photons to penetrate more deeply and allows internal radiation field photons to permeate more extensively into the cloud, resulting in rapid gas heating and the inhibition of star formation. We find that star formation efficiency is highly sensitive to grain size, with an order of magnitude reduction in efficiency when grain size increases from 0.1 to 10 . Additionally, we note that warmer gas suppresses the formation of low-mass stars. Moreover, as a consequence of the decreased opacities, we observe a greater proportion of gas residing in diffuse ionized structures.
1 Introduction
Dust plays a pivotal role in the processes involved in star formation and evolution of giant molecular clouds (GMCs). Dust absorbs stellar radiation in the far-ultraviolet (FUV) and re-emitting it in the infrared (IR) (Draine & Lee, 1984; Mathis, 1990; Li & Draine, 2001; Tielens, 2005). Additionally, dust significantly impacts the thermodynamics of GMCs (Mathis et al., 1983; Draine, 2003). As GMCs undergo collapse, developing high-density regions, dust becomes closely coupled to the gas through frequent collisions. These collisions facilitate the exchange of energy between dust and gas, resulting in the heating or cooling of dust grains and the opposite effect, cooling or heating, on the gas. Photoelectric heating, resulting from the absorption of radiation from the interstellar radiation field (ISRF) and neighboring stars, can also contribute to the heating of gas within the interstellar medium (ISM) (Goldreich & Kwan, 1974; Leung, 1975). Additionally, dust grains act as efficient coolants, releasing energy through thermal emission and achieving a state of thermal equilibrium.
A critical property influencing the rates of the aforementioned processes is the size of dust grains, a parameter that is reasonably well-constrained within the diffuse ISM. Canonical ISM grain models typically describe grains with an empirical Mathis-Rumpl-Nordsieck (MRN) spectrum with sizes up to (Mathis et al., 1977). However, the regulation of the GSD involves various processes, including those inducing grain growth such as grain-grain coagulation (Chokshi et al., 1993) and accretion (Spitzer, 1978) , as well as grain destruction through thermal and non-thermal sputtering (Borkowski & Dwek, 1995; Tielens et al., 1994). Environmental conditions, including temperature, density, and turbulence, influence the rate of each dust grain process. Particularly, grain coagulation, the process that limits maximum grain size, is inefficient in the diffuse ISM but proceeds efficiently in the cool dense ISM (Yan et al., 2004). This suggests that areas with increased density harbor larger grain sizes.
Therefore, it seems improbable that a single ISM grain size distribution (GSD) describes all star-forming environments across all galaxies throughout the history of the Universe. Indeed, observations of dense star-forming environments support this notion, revealing an abundance of larger dust grains (Johnson, 1964; Savage & Mathis, 1979; Cardelli & Clayton, 1988; De Marchi & Panagia, 2014). Furthermore, the “coreshine” effect, observed in the Mid-Infrared (MIR) and Near-Infrared (NIR) within dark clouds, can be ascribed to the prevalence of micron-sized grains that scatter background radiation (Pagani et al., 2010; Steinacker et al., 2015; Lefèvre et al., 2014). This diversity in the GSD extends to different galaxies as well (Pei, 1992; Calzetti et al., 1994; Salim et al., 2018; Hopkins, 2004; Kriek & Conroy, 2013). Furthermore, recent simulations by Hopkins et al. (2022) demonstrated that dust dynamics alone can induce deviations from the typical MRN GSD within individual clouds or star-forming regions. Variations in the GSD are not confined to dense star-forming regions but are also observed across different sightlines within the diffuse Galactic ISM (Ysard et al., 2015; Schlafly et al., 2016; Wang et al., 2017).
The wide range of extinction curves and inferred GSDs across various spatial scales and environments underscores the importance of considering a range of grain sizes when studying physical processes within these regions. Dust grain properties profoundly affect the thermodynamics and evolution of molecular clouds, with grain size being a critical parameter.
At a fixed dust-to-gas ratio, smaller grains within a cloud could enhance dust shielding, potentially creating more favorable conditions for star formation. This correlation has been established and reported in simulations and observations by Krumholz & McKee (2008); Lada et al. (2010); García-Burillo et al. (2012); Gong et al. (2016). This heightened opacity would also increase the photoelectric heating rates, accompanied by higher collisional cooling rates due to the increased overall dust surface area.
However, it is important to note that the rates of photoelectric heating are contingent upon the incident FUV radiation, which diminishes with smaller grain sizes due to reduced photon penetration in the higher optical depth regime. Nevertheless, the potential increase in star formation could elevate the overall FUV radiation budget within the cloud. Additionally, changes in the dust cross section would impact other relevant processes, such as molecule formation rates. These interconnected processes are non-linear, making it uncertain a priori where the net effect would ultimately settle.
Therefore, to enhance our understanding of the intricate balance among photon penetration, heating rate, and the influence of grain size on these complex interactions, comprehensive investigations through rigorous simulations and theoretical models are imperative. This study introduces simulations of star formation that integrate detailed ISM physics, explicit dust dynamics, stellar formation, and feedback. The primary focus is to investigate the influence of grain properties, specifically grain size, on the thermodynamic characteristics of the clouds and how this parameter shapes the efficiency of star formation.
The paper is structured as follows: In Section 2, we provide a concise description of the code and a description of the initial conditions for the runs. In Section 1, we discuss the theoretical predictions of altering the GSD and compare them to the results obtained from our simulations. Finally, we conclude in Section 4.
2 Simulations
2.1 STARFORGE simulation setup
We utilize the GIZMO code (Hopkins, 2015) for conducting 3-dimensional radiation-dust-magnetohydrodnynamics (RDMHD) STARFORGE (Grudić et al., 2022) simulations of star formation in giant molecular clouds, following the physics setup detailed in Soliman & Hopkins (in prep.), which encompasses our complete STARFORGE +dust physics modules. We offer a concise overview here; however, readers are encouraged to consult the aforementioned references as well as Grudić et al. (2021) for a more comprehensive description.
We utilise the GIZMO Meshless Finite Mass magnetohydrodynamics (MHD) solver (Hopkins & Raives, 2016; Hopkins, 2016) for ideal MHD equations and the meshless frequency-integrated M1 solver for the time-dependent radiative transfer (RT) equations (Lupi et al., 2017, 2018; Hopkins & Grudić, 2019a; Hopkins et al., 2020a; Grudić et al., 2021; Hopkins & Grudić, 2019b; Hopkins et al., 2020b). The radiation is discretized into five frequency bands (, , , and ), inducing processes such as photoionisation, photodissociation, photoelectric heating, and dust absorption, directly coupled with the dust distribution. Radiative cooling and heating terms also encompass metal lines, molecular lines, fine structure lines, and dust collisional processes, as detailed in Hopkins et al. (2023). The rates for the dust radiative cooling and photoeletric heating, as well as other processes mentioned prior, derive from interpolating the local dust particle distribution and local dust properties for each gas cell.
Sink particles, representing individual stars, evolve through accretion and interact with the medium via protostellar jets, winds, radiation, and potential supernovae (Grudić et al., 2022).
2.2 Dust physics
The dust physics we employ in our simulations mirrors the setup detailed in Soliman et al. (2024), where it is presented in greater detail. Furthermore, comprehensive studies of the modules and methods can be found in Hopkins & Lee (2016); Lee et al. (2017); Moseley et al. (2019); Hopkins et al. (2022); Soliman & Hopkins (2022).
In our simulations, dust grains are modeled as “super-particles” using a Monte Carlo sampling technique (Carballido et al., 2008; Johansen et al., 2009; Bai & Stone, 2010; Pan et al., 2011; McKinnon et al., 2018). Each dust “particle” represents dust grains with identical attributes, including grain size , mass , charge , and composition. The grain charge is determined for each particle for each timestep self-consistently by computing the collisional, photoelectric, and cosmic ray charging rates (Draine & Sutin, 1987; Tielens, 2005). The grain sizes are statistically sampled to ensure that the ensemble of all particles adheres to an MRN size distribution with the desired dust-to-gas ratio, while also ensuring uniform particle distribution across logarithmic intervals in grain size. In particular, it is important to emphasise that the grain size for the individual particles, and thus the cloud average GSD does not evolve during the simulations; in other words, we do not model grain growth/coagulation or sputtering/destruction. However, the GSD within a particular volume can evolve over time as grains of varying sizes move in and out. We follow dust dynamics by accounting for drag, Lorentz, gravity, and radiation pressure forces. To ensure self-consistency, we interpolate local dust properties, such as the dust-to-gas (DTG) ratio and GSD, to their corresponding gas neighbors. Using this information, we compute local rates of various processes that dust is involved in, including:
-
•
Radiative transfer: Employing the MRN model, we use a simple model for dust absorption and scattering cross-sections. The dimensionless absorption+scattering efficiency is given by
(1) where the effective wavelength is the geometric mean of the minimum and maximum wavelengths in the relevant range, .
-
•
Collisional heating and cooling: The dust collisional cooling rate per unit volume, , is modelled as follows (Hollenbach & McKee, 1979, 1989; Meijerink & Spaans, 2005):
(2) (3) where and are the temperatures of the gas and dust respectively, measured in Kelvin.
Photoelectric heating: The heating rate per unit volume due to the photoelectric effect on dust grains, , is given by (Bakes & Tielens, 1994; Wolfire et al., 2003, 1995):
(4) where is the hydrogen number density in and is the FUV radiation field in Habing units. The heating efficiency, , is defined as:
(5) where is the electron number density. Note that polycyclic aromatic hydrocarbons (PAHs) are not included in our simulations, so their contribution to the photoelectric heating effect is excluded. The reasoning behind this choice and its implications are elaborated upon in Section 3.3.
-
•
Molecular Hydrogen Formation on Dust Surfaces: The formation rate of molecular hydrogen on dust, , is given by (Hollenbach & McKee, 1979; Jura, 1974; Gry et al., 2002; Habart et al., 2004; Wakelam et al., 2017):
(6) is the metallicity as a fraction of solar, and is the number density. The rate coefficient, , is computed as:
(7)
By incorporating these processes, we can effectively capture the influence of a live dust population on the thermochemical behavior and dynamics of the cloud.
2.3 Initial conditions
| [] | [pc] | [] | [] | Notes |
|---|---|---|---|---|
| 3 | 0.1 | fiducial run | ||
| 1.0 | 10 larger grains | |||
| 10 | larger grains | |||
| 10 | 0.1 | fiducial run | ||
| 1.0 | 10 larger grains | |||
| 10 | 100 larger grains |
Our simulation setup involves a uniform-density turbulent molecular cloud surrounded by a diffuse warm ambient medium confined within a periodic box, whose dimensions are 10 times greater than the cloud’s radius. The ambient medium has a density approximately times lower than that of the cloud. The initial velocity distribution follows a Gaussian random field, characterized by an initial virial parameter . The initial magnetic field is uniform, establishing a mass-to-flux ratio 4.2 times the critical value within the cloud (Mouschovias & Spitzer, 1976).
Our study includes two clouds of different masses. The first cloud has a mass of and a radius of , with a mass resolution of . Additionally, we include a larger cloud configuration with and radius , with a resolution of . To precisely capture the dynamics of dust, we employ a mass resolution for dust super-particles that is four times higher than that of the gas (Moseley et al., 2019). Furthermore, cells associated with protostellar jets and stellar winds have a mass resolution ten times higher than that of the typical gas cells.
The initial dust distribution samples follows a statistically uniform DTG ratio with corresponding to galactic values. We consider an MRN mixture of carbonaceous and silicate grain composition for the dust, assuming a uniform internal density and composition. The grains have a sublimation temperature of 1500 K and an internal density of . When dust particles exceed this temperature, they are not permanantly destroyed; instead, their cross-sections are exponentially reduced according to their temperature at that timestep. Each particle is initialized with velocity corresponding to its nearest gas cell. Recall that the distribution of grain sizes samples from the empirical power law model proposed by Mathis et al. (1977), characterized by a differential number density represented as . We consider three variations in the maximum grain size: , , and , spanning a dynamic range where the maximum grain size is 100 times larger than the minimum size, .
We provide a summary of the initial conditions for all simulations discussed in this work in Table LABEL:table.
3 Results
3.1 Theoretical expectations
Introducing variations in the GSD within the cloud can significantly affect its thermochemical properties. In the following section, we consider the expected changes resulting from these variations. Specifically, we examine how changes in the GSD would influence the optical depth .
For simplicity, we assume that the GSD remains constant along a line-of-sight through the cloud, and that the initial mean density within the cloud is spatially uniform. Recall that we model the distribution of dust particles according to an MRN size distribution, where , with normalized to ensure . With these assumptions, we can express the optical depth as:
| (8) |
where is defined as follows
| (9) |
Therefore, given these assumptions and considering , the expression for simplifies to
| (10) |
where .
While certain wavelengths of interest will fall within the intermediate regime (), we primarily focus on the geometric () and Rayleigh () regimes as they provide the most intuitive understanding. The intermediate regime mainly serves to interpolate between these two.
As highlighted in the expression above, modifying the GSD yields two distinct effects on dust opacity. Firstly, it dictates whether the majority of grains are situated in the geometric or Rayleigh regimes. Second, each of these regimes demonstrates a unique dependence on grain size: the Rayleigh regime maintains independently of grain size, while in the geometric limit . It is important to note that in this investigation, we explore variations in grain size while keeping the total dust mass constant. Consequently, increasing the grain size effectively reduces the total grain surface area, to which the geometric opacity is particularly sensitive. This explains why the Rayleigh opacity, being a bulk effect, does not exhibit any dependence on the grain size.
To identify the dominant opacity regime within the GMC, we examine the critical value of where the transition between the geometric and Rayleigh regimes occurs in relation to grain size. Examining wavebands pertinent to star formation processes, specifically the FUV, Near Ultraviolet (NUV), Optical/NIR, and FIR bands tracked in our model, we note that these transitions occur at approximately , , , , and , respectively. Consequently, as increases from to (the distributions considered in this paper), a higher proportion of grains shift towards the geometric opacity regime. This shift is particularly pronounced at shorter wavelengths, such as in the UV band, where the opacity exhibits an inverse relationship with the maximum grain size. The FUV band opacity is particularly important for the thermodynamics of the GMC, as FUV photons play an important role in regulating the gas temperature through photoelectric dust heating.
Opacity-induced effects can drive highly nonlinear changes in cloud evolution. However, to first order, if the grain shielding dominates the clouds thermodynamics, larger grain sizes would enhance FUV radiation penetration, leading to warmer gas. This transition can significantly impact star formation rates and the properties of the stellar population. Warmer conditions, characterized by larger sonic scales and reduced density perturbations, would likely inhibit small-scale structure formation, giving rise to a smoother cloud morphology. Additionally, this would increase the Jeans mass, suggesting reduced low-mass star formation.
However, larger grain sizes also imply reduced photoelectric heating efficiencies. This reduction might, however, be counteracted by the the larger FUV flux, due to more photons penetrating, in addition to slower dust collisional cooling rates observed with larger grains (). Ultimately, the interplay of these effects will dictate whether the gas experiences a net warming or cooling effect.
3.2 Simulation results
3.2.1 Effects on cloud morphology
In this study, we conducted simulations of GMCs with initial conditions detailed in Section 1. We systematically varied the maximum grain size while maintaining a fixed DTG ratio at the start of each simulation. Building upon the theoretical framework outlined in the previous section, this section presents the results obtained from our simulations.
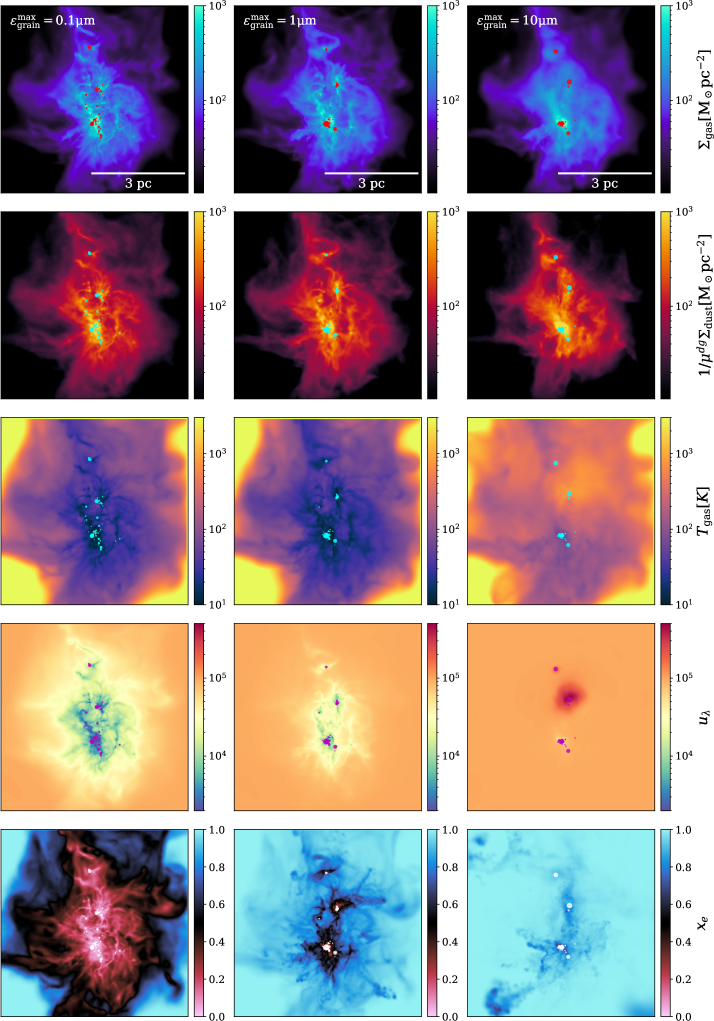
In Figure 1, we present the morphology of molecular clouds, each with an initial mass of approximately and a resolution of , evolved for 3 Myrs. From left to right, the columns represent clouds with different maximum grain sizes: , , and respectively. The top two rows provide a visual representation of the 2D integrated gas and dust surface densities, with stellar particles shown as circles, scaled according to their masses. The subsequent rows describe the thermodynamic and radiative properties of the cloud. The third row shows the average temperature of the gas, while the fourth row shows the average radiation energy density associated with FUV radiation in the range in arbitrary units. The fifth row displays the gas mass-weighted ionization fraction of the gas.
The clouds with larger grain sizes exhibit higher FUV radiation energy densities relative to their smaller grains counterparts. This is due to reduced FUV opacity, as demonstrated in Equation 10, allowing radiation to propagate more extensively throughout the cloud. Consequently, this leads to elevated temperatures driven by the photoelectric effect on dust grains.
In line with our predictions outlined in Section 3.1, the increase in temperature is accompanied by a reduction in small-scale structures and weaker density fluctuations. This effect is particularly evident in the diffuse gas structures formed in our simulation. In contrast, a similar smoothing effect is not observed in the dust structure. This discrepancy is to be expected, as the dust does not experience pressure forces. However, despite the consistent difference in FUV radiation energy density across the different grain size runs in the early stages, a significant temperature increase is observed only when the most massive stars form and emit substantial amounts of radiation. Specifically, a sink particle coincides with the high radiation energy density and temperature peaks. The radiative feedback from this star warms the gas in the cloud, facilitating the smoothing of the gas structure within Myr.
Furthermore, there is a distinct contrast in the ionisation fraction among different grain size runs. In the simulation with , the majority of the cloud remains predominantly molecular. However, increasing the grain size by a factor of 10 confines molecular regions to the dense central core, while the majority of the cloud is in a predominantly ionized state. A further increase by a factor of 10 results in an almost fully ionized cloud. This marked difference is expected given the heightened radiation energy density and elevated temperatures in clouds with larger grains. In addition, the rate of molecular hydrogen formation decreases as the total surface area-to-mass ratio of the grains decreases.

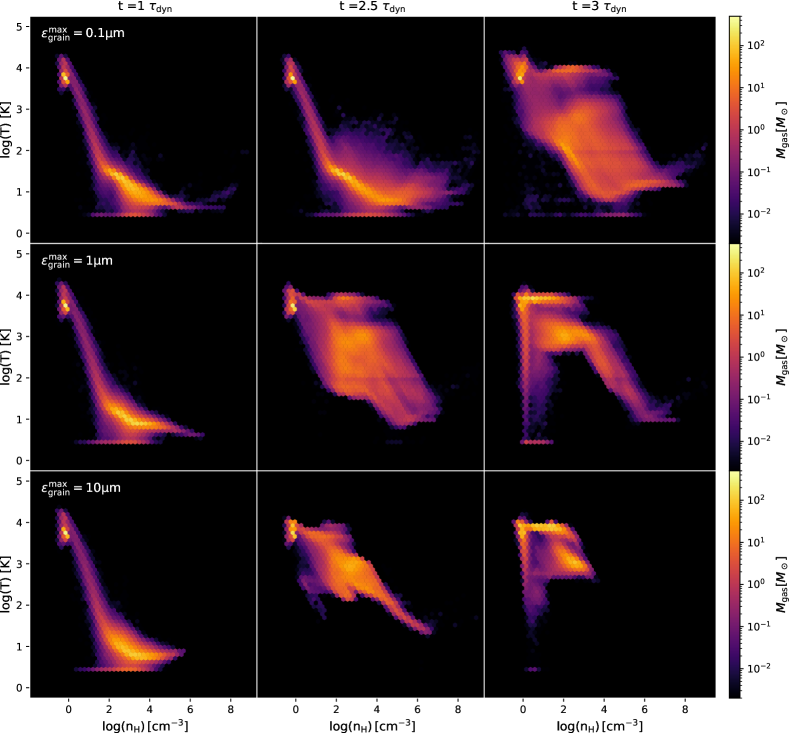
To further explore the thermodynamic evolution of the three clouds, Figure 2 illustrates the temperature-density phase-space diagram at different dynamical times . The three panels represent time intervals of , , and , respectively, with the colour map corresponding to the total gas mass within a given state.
At the initial stage (), all three clouds exhibit similar distributions. However, the clouds with smaller grain sizes contain more gas in cool ( K) and dense structures (number densities of ), although this represents only a small fraction of the total gas. As a result, these regions have a higher number of cores prone to gravitational collapse, leading to an earlier onset of star formation. We point out that the gas component at K and corresponds to the hot gas bath that surrounds the molecular cloud as per our initial conditions.
By , star formation has completed in all three clouds. However, clouds with larger grain sizes contain warmer gas due to weaker shielding from these larger grains. Moving to , most gas with is predominantly warm ( K), while denser gas remains fairly cool. Notably, the component with lacks a dense counterpart and is mostly warm, with an average temperature of K. This component is ionized, corresponding to the warm ionized medium (WIM) with no cold neutral medium (CNM) component.
In Figure 3, we present the morphology of a 0.5 pc thick slice through our cloud at Myrs evolved with different GSDs. The top two rows present 2D integrated surface densities of gas and dust , while the third row displays the average grain size across the slice normalized to in the cloud. The fourth row shows the mean DTG ratio with respect to the cloud’s mean value.
In the cloud, the gas and dust are well-coupled, evident in their closely aligned spatial distributions. This implies that the grain sizes within the simulation predominantly have stopping times much shorter than the timescale of gas dynamics. As a result, there are no discernible variations observed in the DTG ratio, and there is a uniform distribution of grains across all sizes.
In the cloud, larger grains are less effectively coupled to the gas, therefore they do not trace the gas dynamics as well as their smaller grain counterparts. This discrepancy introduces fluctuations in the spatial distribution of grain sizes, with larger grains lagging behind the gas flow. This effect is particularly pronounced in regions of low density where large grains would encounter even lengthier stopping times as . Given that larger grains contribute substantially to the overall dust mass under an MRN GSD, this poor dust coupling for large grains can drive large-scale fluctuations in DTG ratios. The most striking results emerge in the cloud, where even more pronounced fluctuations in GSD are observed. This leads to order of magnitude variations in the DTG ratio, particularly in regions with predominantly large grains.
3.2.2 Effects on initial mass function
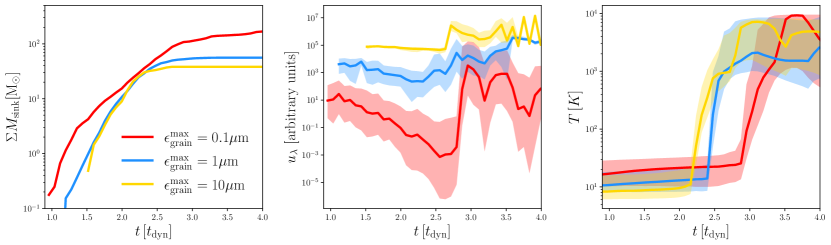
We quantify the impact of larger dust grains on star formation in Figure 4, which illustrates the evolution of star-forming GMCs over time, represented in units of the cloud’s dynamical time. The right panel shows the total stellar mass formed, the middle panel displays the mean FUV band radiation energy density within 0.1 parsec spherical regions around the formed stars, and the left panel shows the average gas temperatures outside these regions.
The m simulation exhibits an earlier onset of star formation compared to m and m simulations. However, the difference in the timing of star formation onset is minimal. Initially, the gas is only radiated by the relatively faint ISRF. This diminishes the importance of factors that dependent on grain size such as shielding effects. Additionally, dust-mediated cooling and heating mechanisms is significantly weaker than the heating and cooling influenced by hydrodynamics. As a result, the gas sustains comparable average temperatures across various grain sizes. This remains the case until enough sinks form, particularly massive sinks, and begin to contribute to the radiation field. At approximately 1.8 dynamical times, all clouds exhibit similar average temperatures and attain the same stellar mass. However, smaller grains offer higher dust opacity, which reduces the propagation of UV flux from the stars to the surrounding gas. As a result, the clouds with smaller grains maintain a cooler temperature for a longer duration.
It is noteworthy that the propagated UV flux scales inversely with the square of the grain size, aligning with expectations for grains in the geometric optics regime. This enhanced dust shielding enables the cloud to sustain ongoing star formation until the gas eventually heats up, and stellar feedback leads to the evacuation of the cloud and halts further star formation. A significant contrast in the star formation efficiency is evident when comparing clouds with the largest grains to those with the smallest grains. Specifically, the cloud with 10 grains converts only 1% of its mass into stars, whereas the cloud with 0.1 grains exhibits roughly a tenfold higher star formation efficiency, converting 10% of its mass into stars.
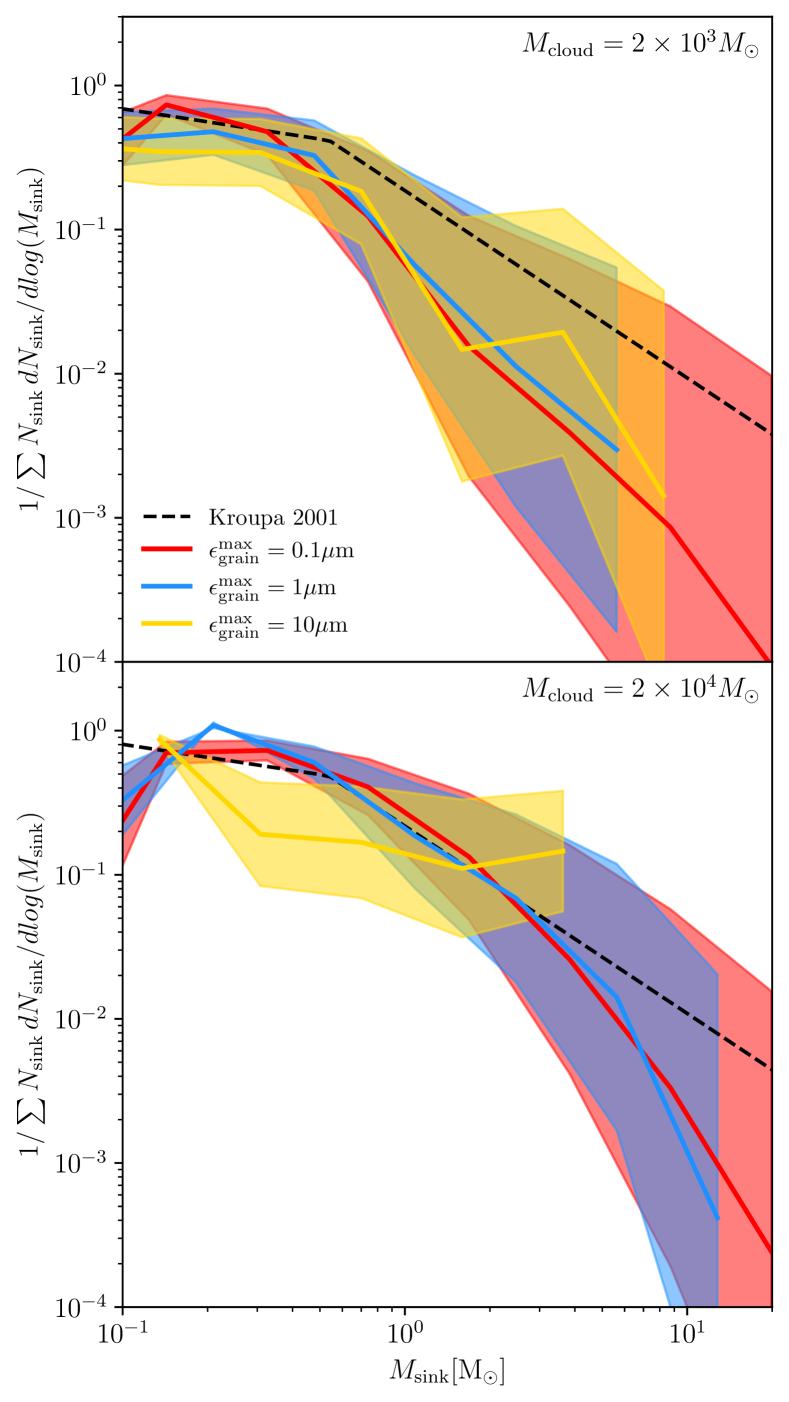
In Figure 5 we present the mass function of sink particles that form in clouds with (top) and (bottom). The results for different grain sizes are compared to the initial mass function from Kroupa (2001). The shaded region represents the Poisson error. We find that clouds with larger grains yield stellar populations with a narrower mass range. Specifically, as the grain size increases by a factor of 10, the range of sink masses decreases by a factor of 2. The higher minimum sink mass can be attributed to the higher expected jeans mass, while the high-mass trucation is likely due to the reduced number of sinks forming in the large grain runs, resulting in limited sampling at the higher mass end. While our simulations indicate a higher mean sink mass in setups with larger grains, the reduced sink count, especially at the high mass end due to sampling, and sparse statistical data highlight the necessity for a more comprehensive statistical analysis to attain a precise understanding of the distribution. Presently, our simulations tentatively suggest that grain size has minimal impact on the mass function, within statistical error margins.
Another trend in Figure 5 is the reduction in low-mass sink particles () for clouds with larger grains. In the smaller cloud, the fraction of low-mass sinks decreases from 0.8 to about 0.6, and in the larger cloud, it drops from 0.6 to around 0.2 as the grain size increases from 0.1 m to 10 m. This decline is attributed to the elevated temperature, which leads to a larger Jeans mass, thus inhibiting smaller cores from meeting the criteria for collapse in warmer environments. This sequence of events underscores the intricate interplay among grain size, radiation, temperature, and structural characteristics in shaping the dynamic evolution of molecular clouds.
3.3 Caveats
Several caveats should be considered when interpreting our findings. Firstly, our study does not encompass the full spectrum of factors that may affect dust opacities within star-forming regions. Specifically, variations in the DTG ratio due to non-power law characteristics in the GSD and grain chemistry are not explored. While our study provides insights into the effects of varying initial GSDs on star formation, the absence of these additional factors may limit the comprehensiveness of our conclusions. All else equal, and considering the impact of these factors on dust opacity, their incorporation would effectively lead to a re-scaling of opacities for a given range in grain size. Consequently, we anticipate that, to leading order, these factors would produce similar effects on star formation as those observed in our study.
In addition, we do not incorporate the role of PAHs, as it falls beyond the current scope of our investigation. PAHs behave as gas-phase molecules, requiring distinct physics to accurately model their effects and behavior within this environment. Our paper primarily focuses on elucidating the first-order effects of large versus small grains. Consequently, we have omitted the effects of PAHs from our analysis. Nevertheless, considering PAHs would likely amplify the effects we report. Assuming, the main finding of increased FUV radiation due to lower dust grain opacities remains robust with the inclusion of PAHs, their presence would likely enhance photoelectric heating for a given radiation field. This enhancement could lead to earlier or higher temperature increases and ionization fractions in the gas. The respective effects of PAHs and grains on radiative transfer and thermochemsitry with GMCs, is complex. The outcomes of including another dust species that plays an important role in these process might yield effects different from those discussed in the current study, emphasizing the need for further investigation in subsequent studies.
Secondly, while we systematically explore the effects of different initial GSDs, the evolution of GSDs over time within actual star-forming regions is influenced by a multitude of dynamic factors. Processes such as grain destruction, coagulation, and growth exhibit variations across different environments, introducing complexities that are not fully captured in our model. In future work, we aim to model the evolution of GSDs within star-forming regions, following a similar approach as demonstrated in recent work by Choban et al. (2022). This endeavour will contribute to a more comprehensive understanding of the interplay between dust properties and star formation processes.
4 Conclusions
The dust GSD likely varies significantly across different star-forming regions, with evidence of variability observed in diverse galaxy extinction curves. Observational data from dust scattering in dark clouds and molecular cloud extinction curves further suggests deviations from the canonical diffuse ISM GSD, indicating larger grain sizes in these regions. This variability may be more pronounced in high-redshift systems and across various star-forming environments.
In this study, we conducted a series of RDMHD GIZMO simulations focusing on star-forming GMCs with different GSD, specifically with .
Our simulations included various competing effects, such as dust collisional heating/cooling, photoelectric heating, and dust shielding, our results indicate that larger grain sizes lead to a decrease in star formation efficiency. Our findings highlight that the rate of star formation declines more rapidly in clouds with larger grains. The decrease in star formation efficiency is due to enhanced radiation penetration through the cloud, facilitated by reduced dust shielding. This results in more efficient heating and ionization, all of which are non-linear processes.
In summary, the observed effects emphasize the necessity of a careful consideration of grain size variations when interpreting and modeling the physical processes within star-forming regions.
Data Availability Statement
The data supporting this article are available on reasonable request to the corresponding author.
References
- Bai & Stone (2010) Bai, X.-N., & Stone, J. M. 2010, ApJ, 722, L220, doi: 10.1088/2041-8205/722/2/L220
- Bakes & Tielens (1994) Bakes, E., & Tielens, A. 1994, Astrophysical Journal, Part 1 (ISSN 0004-637X), vol. 427, no. 2, p. 822-838, 427, 822
- Borkowski & Dwek (1995) Borkowski, K. J., & Dwek, E. 1995, Astrophysical Journal v. 454, p. 254, 454, 254
- Calzetti et al. (1994) Calzetti, D., Kinney, A. L., & Storchi-Bergmann, T. 1994, The astrophysical journal. Chicago. Vol. 429, no. 2, pt. 1 (July 1994), p. 582-601
- Carballido et al. (2008) Carballido, A., Stone, J. M., & Turner, N. J. 2008, MNRAS, 386, 145, doi: 10.1111/j.1365-2966.2008.13014.x
- Cardelli & Clayton (1988) Cardelli, J. A., & Clayton, G. C. 1988, The Astronomical Journal, 95, 516
- Choban et al. (2022) Choban, C. R., Kereš, D., Hopkins, P. F., et al. 2022, Monthly Notices of the Royal Astronomical Society, 514, 4506
- Chokshi et al. (1993) Chokshi, A., Tielens, A., & Hollenbach, D. 1993, Astrophysical Journal, Part 1 (ISSN 0004-637X), vol. 407, no. 2, p. 806-819., 407, 806
- De Marchi & Panagia (2014) De Marchi, G., & Panagia, N. 2014, Monthly Notices of the Royal Astronomical Society, 445, 93
- Draine & Lee (1984) Draine, B., & Lee, H. M. 1984, Astrophysical Journal, Part 1 (ISSN 0004-637X), vol. 285, Oct. 1, 1984, p. 89-108. Research supported by the Alfred P. Sloan Foundation., 285, 89
- Draine (2003) Draine, B. T. 2003, ARA&A, 41, 241, doi: 10.1146/annurev.astro.41.011802.094840
- Draine & Sutin (1987) Draine, B. T., & Sutin, B. 1987, ApJ, 320, 803, doi: 10.1086/165596
- García-Burillo et al. (2012) García-Burillo, S., Usero, A., Alonso-Herrero, A., et al. 2012, Astronomy & Astrophysics, 539, A8
- Goldreich & Kwan (1974) Goldreich, P., & Kwan, J. 1974, Astrophysical Journal, Vol. 189, pp. 441-454 (1974), 189, 441
- Gong et al. (2016) Gong, Y., Mao, R., Fang, M., et al. 2016, Astronomy & Astrophysics, 588, A104
- Grudić et al. (2021) Grudić, M. Y., Guszejnov, D., Hopkins, P. F., Offner, S. S. R., & Faucher-Giguère, C.-A. 2021, MNRAS, 506, 2199, doi: 10.1093/mnras/stab1347
- Grudić et al. (2022) Grudić, M. Y., Guszejnov, D., Offner, S. S. R., et al. 2022, MNRAS, 512, 216, doi: 10.1093/mnras/stac526
- Grudić et al. (2021) Grudić, M. Y., Guszejnov, D., Hopkins, P. F., Offner, S. S. R., & Faucher-Giguère, C.-A. 2021, Monthly Notices of the Royal Astronomical Society, 506, 2199, doi: 10.1093/mnras/stab1347
- Gry et al. (2002) Gry, C., Boulanger, F., Nehme, C., Habart, E., & Falgarone, E. 2002, Astronomy & Astrophysics, 391, 675
- Habart et al. (2004) Habart, E., Boulanger, F., Verstraete, L., & Walmsley, C. 2004, Astronomy & Astrophysics, 414, 531
- Harris et al. (2020) Harris, C. R., Millman, K. J., van der Walt, S. J., et al. 2020, Nature, 585, 357, doi: 10.1038/s41586-020-2649-2
- Hollenbach & McKee (1979) Hollenbach, D., & McKee, C. F. 1979, Astrophysical Journal Supplement Series, vol. 41, Nov. 1979, p. 555-592., 41, 555
- Hollenbach & McKee (1989) —. 1989, Astrophysical Journal, Part 1 (ISSN 0004-637X), vol. 342, July 1, 1989, p. 306-336., 342, 306
- Hopkins (2004) Hopkins, A. M. 2004, The Astrophysical Journal, 615, 209
- Hopkins (2015) Hopkins, P. F. 2015, MNRAS, 450, 53, doi: 10.1093/mnras/stv195
- Hopkins (2016) —. 2016, MNRAS, 462, 576, doi: 10.1093/mnras/stw1578
- Hopkins & Grudić (2019a) Hopkins, P. F., & Grudić, M. Y. 2019a, MNRAS, 483, 4187, doi: 10.1093/mnras/sty3089
- Hopkins & Grudić (2019b) —. 2019b, MNRAS, 483, 4187, doi: 10.1093/mnras/sty3089
- Hopkins et al. (2020a) Hopkins, P. F., Grudić, M. Y., Wetzel, A., et al. 2020a, MNRAS, 491, 3702, doi: 10.1093/mnras/stz3129
- Hopkins et al. (2020b) —. 2020b, MNRAS, 491, 3702, doi: 10.1093/mnras/stz3129
- Hopkins & Lee (2016) Hopkins, P. F., & Lee, H. 2016, MNRAS, 456, 4174, doi: 10.1093/mnras/stv2745
- Hopkins & Raives (2016) Hopkins, P. F., & Raives, M. J. 2016, MNRAS, 455, 51, doi: 10.1093/mnras/stv2180
- Hopkins et al. (2022) Hopkins, P. F., Rosen, A. L., Squire, J., et al. 2022, Monthly Notices of the Royal Astronomical Society, 517, 1491
- Hopkins et al. (2023) Hopkins, P. F., Wetzel, A., Wheeler, C., et al. 2023, MNRAS, 519, 3154, doi: 10.1093/mnras/stac3489
- Hunter (2007) Hunter, J. D. 2007, Computing in Science & Engineering, 9, 90, doi: 10.1109/MCSE.2007.55
- Johansen et al. (2009) Johansen, A., Youdin, A., & Mac Low, M.-M. 2009, ApJ, 704, L75, doi: 10.1088/0004-637X/704/2/L75
- Johnson (1964) Johnson, H. L. 1964, Bol. Obs. Tonantzintla Tacubaya, 3, 305
- Jura (1974) Jura, M. 1974, Astrophysical Journal, Vol. 191, p. 375-379, 191, 375
- Kriek & Conroy (2013) Kriek, M., & Conroy, C. 2013, The Astrophysical Journal Letters, 775, L16
- Kroupa (2001) Kroupa, P. 2001, Monthly Notices of the Royal Astronomical Society, 322, 231
- Krumholz & McKee (2008) Krumholz, M. R., & McKee, C. F. 2008, Nature, 451, 1082
- Lada et al. (2010) Lada, C. J., Lombardi, M., & Alves, J. F. 2010, The Astrophysical Journal, 724, 687
- Lee et al. (2017) Lee, H., Hopkins, P. F., & Squire, J. 2017, MNRAS, 469, 3532, doi: 10.1093/mnras/stx1097
- Lefèvre et al. (2014) Lefèvre, C., Pagani, L., Juvela, M., et al. 2014, Astronomy & Astrophysics, 572, A20
- Leung (1975) Leung, C. M. 1975, The Astrophysical Journal, 199, 340
- Li & Draine (2001) Li, A., & Draine, B. 2001, The Astrophysical Journal, 554, 778
- Lupi et al. (2018) Lupi, A., Bovino, S., Capelo, P. R., Volonteri, M., & Silk, J. 2018, MNRAS, 474, 2884, doi: 10.1093/mnras/stx2874
- Lupi et al. (2017) Lupi, A., Volonteri, M., & Silk, J. 2017, MNRAS, 470, 1673, doi: 10.1093/mnras/stx1313
- Mathis et al. (1983) Mathis, J., Mezger, P., & Panagia, N. 1983, Astronomy and Astrophysics (ISSN 0004-6361), vol. 128, no. 1, Nov. 1983, p. 212-229., 128, 212
- Mathis (1990) Mathis, J. S. 1990, Annual Review of Astronomy and Astrophysics, 28, 37
- Mathis et al. (1977) Mathis, J. S., Rumpl, W., & Nordsieck, K. H. 1977, ApJ, 217, 425, doi: 10.1086/155591
- McKinnon et al. (2018) McKinnon, R., Vogelsberger, M., Torrey, P., Marinacci, F., & Kannan, R. 2018, MNRAS, 478, 2851, doi: 10.1093/mnras/sty1248
- Meijerink & Spaans (2005) Meijerink, R., & Spaans, M. 2005, Astronomy & Astrophysics, 436, 397
- Moseley et al. (2019) Moseley, E. R., Squire, J., & Hopkins, P. F. 2019, MNRAS, 489, 325, doi: 10.1093/mnras/stz2128
- Mouschovias & Spitzer (1976) Mouschovias, T. C., & Spitzer, L., J. 1976, ApJ, 210, 326, doi: 10.1086/154835
- Pagani et al. (2010) Pagani, L., Steinacker, J., Bacmann, A., Stutz, A., & Henning, T. 2010, Science, 329, 1622
- Pan et al. (2011) Pan, L., Padoan, P., Scalo, J., Kritsuk, A. G., & Norman, M. L. 2011, ApJ, 740, 6, doi: 10.1088/0004-637X/740/1/6
- Pei (1992) Pei, Y. C. 1992, Astrophysical Journal, Part 1 (ISSN 0004-637X), vol. 395, no. 1, p. 130-139., 395, 130
- Salim et al. (2018) Salim, S., Boquien, M., & Lee, J. C. 2018, The Astrophysical Journal, 859, 11
- Savage & Mathis (1979) Savage, B. D., & Mathis, J. S. 1979, Annual review of astronomy and astrophysics, 17, 73
- Schlafly et al. (2016) Schlafly, E., Meisner, A., Stutz, A., et al. 2016, The Astrophysical Journal, 821, 78
- Soliman & Hopkins (2022) Soliman, N. H., & Hopkins, P. F. 2022, arXiv preprint arXiv:2210.13517
- Soliman et al. (2024) Soliman, N. H., Hopkins, P. F., & Grudić, M. Y. 2024, arXiv preprint arXiv:2406.09602
- Spitzer (1978) Spitzer, L. 1978, Physical processes in the interstellar medium, doi: 10.1002/9783527617722
- Steinacker et al. (2015) Steinacker, J., Andersen, M., Thi, W.-F., et al. 2015, Astronomy & Astrophysics, 582, A70
- Tielens et al. (1994) Tielens, A., McKee, C., Seab, C., & Hollenbach, D. 1994, The Astrophysical Journal, Part 1, vol. 431, no. 1, p. 321-340, 431, 321
- Tielens (2005) Tielens, A. G. G. M. 2005, The Physics and Chemistry of the Interstellar Medium (Cambridge, UK: Cambridge University Press)
- van der Velden (2020) van der Velden, E. 2020, The Journal of Open Source Software, 5, 2004, doi: 10.21105/joss.02004
- Virtanen et al. (2020) Virtanen, P., Gommers, R., Oliphant, T. E., et al. 2020, SciPy 1.0: Fundamental Algorithms for Scientific Computing in Python, doi: 10.1038/s41592-019-0686-2
- Wakelam et al. (2017) Wakelam, V., Bron, E., Cazaux, S., et al. 2017, Molecular Astrophysics, 9, 1
- Wang et al. (2017) Wang, S., Jiang, B. W., Zhao, H., Chen, X., & de Grijs, R. 2017, ApJ, 848, 106, doi: 10.3847/1538-4357/aa8db7
- Wolfire et al. (1995) Wolfire, M. G., Hollenbach, D., McKee, C. F., Tielens, A. G. G. M., & Bakes, E. L. O. 1995, ApJ, 443, 152, doi: 10.1086/175510
- Wolfire et al. (2003) Wolfire, M. G., McKee, C. F., Hollenbach, D., & Tielens, A. 2003, The Astrophysical Journal, 587, 278
- Yan et al. (2004) Yan, H., Lazarian, A., & Draine, B. 2004, The Astrophysical Journal, 616, 895
- Ysard et al. (2015) Ysard, N., Köhler, M., Jones, A., et al. 2015, Astronomy & Astrophysics, 577, A110