Map It Anywhere (MIA): Empowering Bird’s Eye View Mapping using Large-scale Public Data
Abstract
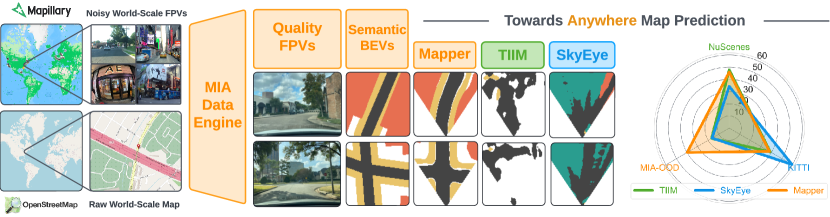
Top-down Bird’s Eye View (BEV) maps are a popular representation for ground robot navigation due to their richness and flexibility for downstream tasks. While recent methods have shown promise for predicting BEV maps from First-Person View (FPV) images, their generalizability is limited to small regions captured by current autonomous vehicle-based datasets. In this context, we show that a more scalable approach towards generalizable map prediction can be enabled by using two large-scale crowd-sourced mapping platforms, Mapillary for FPV images and OpenStreetMap for BEV semantic maps. We introduce Map It Anywhere (MIA), a data engine that enables seamless curation and modeling of labeled map prediction data from existing open-source map platforms. Using our MIA data engine, we display the ease of automatically collecting a dataset of 1.2 million pairs of FPV images & BEV maps encompassing diverse geographies, landscapes, environmental factors, camera models & capture scenarios. We further train a simple camera model-agnostic model on this data for BEV map prediction. Extensive evaluations using established benchmarks and our dataset show that the data curated by MIA enables effective pretraining for generalizable BEV map prediction, with zero-shot performance far exceeding baselines trained on existing datasets by 35%. Our analysis highlights the promise of using large-scale public maps for developing & testing generalizable BEV perception, paving the way for more robust autonomous navigation.
1 Introduction
Bird’s Eye View (BEV) maps are an important perceptual representation for ground robots. Across various applications such as autonomous driving [19, 3, 13, 29], offroad navigation [24, 33, 1, 17], and localization [30, 17], prior work has demonstrated the simplicity of reasoning through the BEV perspective, making it also attractive for many downstream tasks such as path planning [26, 14]. To enable wide deployment of BEV maps as a perceptual representation, there is a requirement for a general map prediction building block that performs robustly across different domains and supports effective adaptation to specific tasks/environments.
Despite tremendous advancements in predicting BEV maps from First Person View (FPV) images [23, 29, 13], we find that achieving good out-of-the-box predictions across diverse scenarios remains challenging. This shortcoming mainly stems from the current training & testing paradigm on limited-scale datasets collected using autonomous vehicle (AV) platforms [32, 5, 36, 4, 20]. While these benchmarks have massively propelled the field, they are principally limited in capturing large-scale diversity due to the time and cost associated with manual labeling, the limited deployment range, and finally, the use of specific sensor configurations on current AV stacks.
We believe that a complementary training & testing paradigm is necessary to assess the generalizability & robustness of BEV mapping, paving the way for anywhere deployment. Hence, starting from first principles, we formulate the key requirements for generalizable BEV mapping as: (a) being able to provide top-down information of key navigation classes, (b) ability to be used by different agents and across different operating regimes, for example, sidewalk prediction is more critical for autonomous wheelchairs, (c) perform reasonably out-of-the-box in unseen locations supporting quick adaptation, and (d) easily adaptable to different hardware configurations such as camera models.
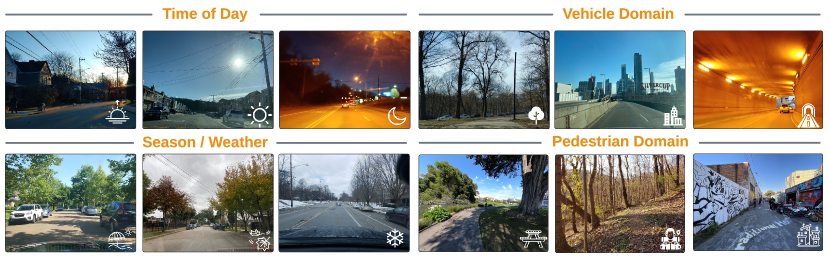
In this context, we explore the question of “How can one collect a dataset to empower generalizable BEV mapping?” Specifically, to support research on generalizable BEV mapping, such a dataset needs to (a) contain diverse geographies, terrain types, time of day, and seasons, (b) capture scenarios beyond on-the-road driving, (c) support various camera models, and (d) consists of well-distributed classes and labels for supporting navigation.
To construct such a dataset, our key insight is to leverage two disjoint, crowd-sourced, and world-scale public mapping platforms: Mapillary for First-Person View (FPV) images and OpenStreetMap for Bird’s Eye View (BEV) semantic maps. Both open-source platforms provide the tools necessary to associate crowd-sourced FPV images with semantic raster maps used for everyday human navigation. We introduce MIA, a data engine which taps into the potential of these mapping platforms to enable seamless curation and modeling of labeled data for generalizable BEV map prediction. Specifically, our data engine enables an evergrowing BEV dataset and benchmark, which exhibits world-scale diversity and supports research on both universal & environment-specific deployment.
In this paper, to showcase the potential of our data engine, we make the following key contributions:
-
1.
We open-source our MIA data engine for supporting automation curation of paired world-scale FPV & BEV data, which can be readily used for BEV semantic map prediction research.
-
2.
Using our MIA data engine, we release a dataset containing 1.2 million high quality FPV image and BEV map pairs covering 470 , thereby facilitating future map prediction research on generalizability and robustness.
-
3.
We show that training a simple camera intrinsics-agnostic model with our released datasets results in superior zero-shot performance over existing state-of-the-art baselines on key static classes, such as roads and sidewalks.
-
4.
Through analysis of current performance in urban and rural domains of our benchmark, we show that significant research remains to enable generalizable BEV map prediction.
Overall, MIA establishes a diverse evergrowing dataset & benchmark for map prediction research and showcases how commodity public maps can empower generalizable BEV perception tasks (Fig. 1).
| Dataset | Locations | km2 covered | # BEV Annotated Frames | # Camera Models | Domain types | Capture Platform | Automatic Curation | |||||
| U | S | R | O | Car | Bik | Ped | ||||||
| Argoverse [5] | 2 in US | 1.6 [32] | 22K | 2 | ✓ | X | X | X | ✓ | X | X | X |
| Argoverse 2 [36] | 6 in US | - | 108K [38] | 2 | ✓ | X | X | X | ✓ | X | X | X |
| KITTI-360-BEV [13] | 1 in DE | 5.3 | 83K | 2 | X | ✓ | ✓ | X | ✓ | X | X | X |
| NuScenes [4] | BN, SP | 5.6 | 40K | 2 | ✓ | ✓ | X | X | ✓ | X | X | X |
| Waymo [32] | 3 in US | 76 [32] | 230K | 2 | ✓ | ✓ | X | X | ✓ | X | X | X |
| MGL* [30] | 12 in US/EU | - | 760K | 4 | ✓ | ✓ | ✓ | X | ✓ | X | X | X |
| MIA (Ours) | 6 in US | 470 | 1.2M | 17 | ✓ | ✓ | ✓ | ✓ | ✓ | ✓ | ✓ | ✓ |
2 Related Work
Bird’s Eye View Map Prediction: BEV map prediction involves predicting top-down semantic maps from various sensory modalities to facilitate downstream robotic tasks. Some works rely solely on LiDAR [18], others on multi-view cameras [27], and some on both [21, 41]. These approaches rely on modalities that are expensive and difficult to calibrate. Recently, a growing number of works use monocular cameras [12, 13, 29, 23, 28, 22], as they are attractive for their ease of deployment, reduced cost, and higher scalability. However, all these works still rely on current autonomous driving datasets for labels, which limits the scalability of data collection. To address this limitation, SkyEye [13] uses more available front-view semantics to build map predictors without explicit BEV maps. However, this method relies on ground truth FPV semantic masks, which are costly to annotate and scale. In contrast, MIA leverages two readily available world-scale databases to provide diverse and accurate supervision, avoiding the high cost of equipment and manual labor.
Another line of related work is the task of matching FPV images with BEV maps that can be satellite-based [15, 40], planimetric [30, 37], or multi-modal [31]. They often employ techniques to predict a BEV feature map given an FPV image. While useful for retrieval or localization, these feature maps cannot benefit downstream tasks without complex learned decoders, unlike predicted semantic BEV maps, which downstream algorithms like path planning can readily consume.
Datasets for BEV Map Prediction: Existing BEV map prediction datasets are often derived from multi-modal autonomous driving datasets [32, 5, 36, 4, 13, 12] that target various tasks, including BEV prediction. These pioneering works depend on manually collected data from costly LiDARs, hence requiring careful calibration with camera setups to ensure accurate correspondence between FPV & BEV data. The BEV is generated by accumulating semantically labeled LiDAR point clouds & then splatting them to BEV, allowing them to capture dynamic and static classes. However, these approaches are principally limited in both scale and diversity due to their high cost, hindering model generalizability. In contrast, MIA uses data available on crowd-sourced platforms and can thus obtain FPV-BEV pairs globally, achieving broader diversity & scale as shown in Table 1.
Crowd-sourced Datasets for Learning Geometric Tasks: Crowd-sourced platforms enable open-source contributors to upload diverse in-the-wild data, significantly empowering generalizability in geometric learning tasks. One such notable platform is Mapillary [7], which hosts over 2 billion (and growing) crowd-sourced street-level images from various locations worldwide, captured by different cameras across all seasons and times. Mapillary has been notably used for tasks such as depth estimation [2], lifelong place recognition [35], and visual localization [16, 30]. Most related to our work, OrienterNet [30] addresses visual localization within a large top-down map, curating a large-scale localization dataset provided by crowd-sourced platforms, Mapillary [7] for FPV images and OpenStreetMap [8] (OSM) for large BEV maps. However, the OrienterNet pipeline for rasterizing maps is not suitable for BEV prediction as it renders large maps, mimics OSM style, and includes graphical elements/labels irrelevant to the map prediction task. MIA further refines the OrienterNet pipeline by enabling automatic curation and collection of semantic maps, alignment of BEV renders with satellite images, and inference of missing OSM sidewalk geometries, thus providing rich semantic maps that are ready for BEV map prediction.
3 MIA Data Engine
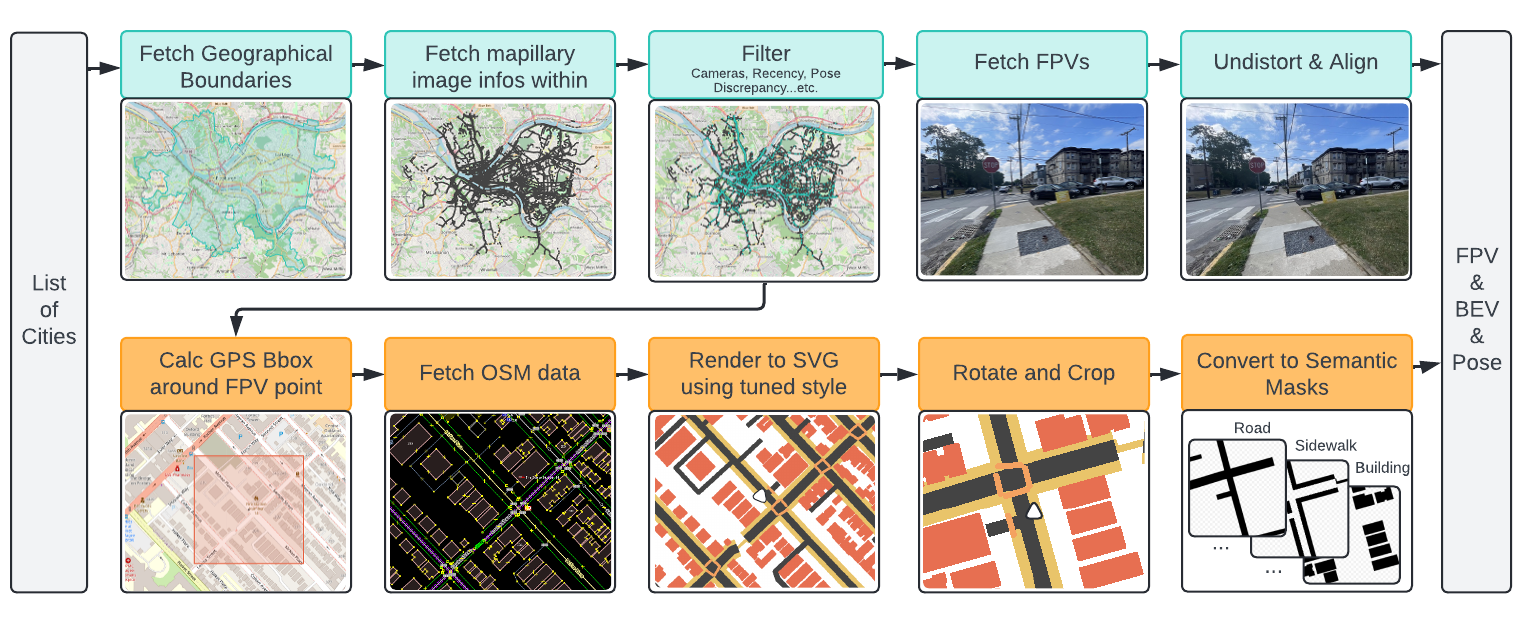
To construct a dataset for generalizable BEV mapping, we develop a scalable data engine that generates high-quality, diverse FPV-BEV pairs with rich semantic labels. This process, summarized in Fig. 2 and detailed below, follows the criteria discussed in Section 1.
3.1 First Person View (FPV) Retrieval
Mapillary: For FPV retrieval, we leverage Mapillary [7], a massive public database, licensed under CC BY-SA, with over 2 billion crowd sourced images. The images span various weather and lighting conditions collected using diverse camera models and focal lengths. Furthermore, images are taken by pedestrians, vehicles, bicyclists, etc. This diversity enables the collection of more dynamic and difficult scenarios critical for anywhere map prediction. However, this massive pool of data is not readily amenable to deep learning as it contains many noisy, distorted, and incorrectly registered instances. Thus far, few works, such as [30], have leveraged such data providing an impressive retrieval and undistortion pipeline. However, the work relied on careful and manual curation of limited camera models and scenarios. Such approaches are not scalable and cannot leverage the powerful quantity and diversity of Mapillary. Hence, we further refine the OrienterNet [30] data curation framework and develop a fully automated curation pipeline that can harness the full potential of the extensive Mapillary database. We describe the pipeline in the following sections.
FPV Pipeline: As demonstrated in Fig. 2, the FPV pipeline starts by manually inputting a list of locations of interest, which can be as simple as inputting the name of the location or as specific as specifying the GPS bounds. The pipeline then converts these bounds to a list of zoom-14 tiles and uses the publicly exposed Mapillary APIs to query for any image instance within these tiles. The retrieved instances are then geospatially filtered to ensure they lie within the exact boundaries of interest. Given the retrieved image IDs, we use another Mapillary endpoint to retrieve image metadata, which includes coordinates rectified through structure from motion, camera information, poses, and timestamps, amongst other details that we use for filtering in the subsequent stage.
We develop the filtering pipeline by observing hundreds of FPV & BEV pairs and identifying the correlations between good-quality FPVs and their corresponding metadata. The criteria we used included a recency filter, a camera model filter spanning 19 camera models with good RGB quality, a location/angle discrepancy filter that computes the difference between Structure from Motion (SfM) computed and recorded poses as a proxy for measuring the quality of the geo-registration, and a camera type filter that only includes perspective and fisheye. To promote spatial diversity over sheer quantity, we filter out images within a 4-meter radius of another image from the same sequence. After filtering, we retrieve the RGB images from Mapillary and feed them through an undistortion pipeline adapted from [30]. The undistortion is critical for fisheye images to ensure their pixel-aligned features can be correctly lifted into BEV space. Using this pipeline, we can retrieve high-quality images from anywhere in the world, tapping into the power of the Mapillary platform.
3.2 Birds Eye View (BEV) Retrieval
Open Street Map (OSM): For BEV retrieval, we leverage OSM [8], a global crowd-sourced mapping platform open-sourced under Open Data Commons Open Database License (ODbL). OSM provides rich vectorized annotations for streets, sidewalks, buildings, etc. However, OSM data cannot be easily used for map prediction as (a) OSM often does not encode critical sidewalk geometry, (b) structured formats like OSM maps prove difficult to train on, (c) off-the-shelf rendering pipelines target human consumption often encoding information irrelevant for BEV prediction (such as textual labels) and do not care about pixel aligning maps with satellite imagery, thereby encoding inaccurate road widths in many instances. Recognizing the need to create our own rasterization pipeline, we build on top of the MIT-licensed MapMachine project [34] and study hundreds of satellite/map pairs to achieve rasterization that is more pixel-aligned with satellite imagery. We further carefully map the hundreds of elements in OSM to a handful of informative dominant semantic labels.
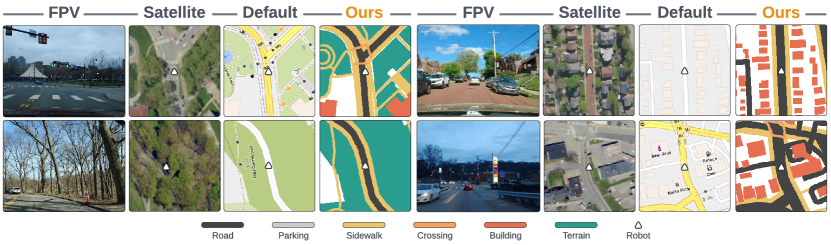
BEV Generation Pipeline: BEV retrieval starts after the filtering stage in FPV retrieval as illustrated in Fig. 2. Given coordinates in the World Geodetic System (WGS-84) frame for each image, we project each point onto a Cartesian UTM coordinate frame, estimated separately for each city/location. Next, we calculate an ego-centric bounding box of size at a resolution of meters per pixel. Here, represents the requested image dimension, is the padding added to accommodate rotations without introducing empty space, and is the padding added to avoid missing any OSM elements that may not fall within the original box. To adhere to the OSM API, we project boxes back to WGS-84 coordinates before retrieving OSM data for every image. We then utilize our version of MapMachine (enhanced to infer missing sidewalks from OSM) with a carefully tuned, satellite-aligned map style to render the data into SVG format. Next, we rotate the rendered image so that the robot is looking ‘up’ in the BEV image plane, aligning it with the forward direction of the FPV plane. Finally, we rasterize the SVG into a semantic mask containing six static classes (Road, Parking, Sidewalk, Crossing, Building & Terrain), as shown in Fig. 3, to produce the final BEV.
4 Empowering Map Prediction with the MIA Data Engine
4.1 Sampling the MIA Dataset
We show the utility of the MIA data engine by sampling six different urban-centered locations, extending to the suburbs. We selected highly populated cities - New York, Chicago, Houston, and Los Angeles - to collect challenging scenarios with diverse and dense traffic. Additionally, we included Pittsburgh and San Francisco for their unique topologies. For BEV retrieval, we set , , and , resulting in what we believe is the largest public BEV prediction dataset, comprising approximately 1.2 million FPV-BEV pairs, as shown in Table 1. To illustrate the diversity of the data, we adapt the coverage metric proposed by [32] in which each image instance covers a radius of 150 meters around its pose. For our sampled dataset, we calculate the coverage at a radius of 112 meters consistent with our chosen value. As shown in Table 1, our sampled dataset covers , far surpassing all existing BEV prediction datasets by . This highlights the immense potential of our scalable MIA data engine to produce large quantities of annotated FPV-BEV pairs covering extensive geographies and with varying camera models and focal lengths, as highlighted in Fig. 4.
To further benchmark the generalization capability of map prediction models in more extreme settings, we further sample a small () rural/remote dataset, which we denote as MIA-Rural. This dataset has a distribution very different from the urban-centered samples. We selected locations with distinct visual appearances, namely Willow (Alaska), Ely (Nevada), and Owen Springs (Australia). To push the boundaries of generalization testing, we disabled the camera model filter for this test set, thereby incorporating a variety of challenging camera models into this extreme dataset.
4.2 Mapper: Training a camera intrinsics-agnostic baseline model
We train a model, Mapper, with MIA to validate the need for such a large-scale and diverse dataset by testing its generalization capability. Leveraging the diversity of the Mapillary dataset requires a model architecture capable of handling various image characteristics, such as focal lengths and image size. Additionally, following OrienterNet [30], it is reasonable to assume that the robot or phone has orientation information (IMU), and we aim to incorporate this information into our map predictions.
Our goal is to learn a model that takes in a monocular image to predict a gravity-aligned BEV semantic map . Formally, given an image , its intrinsic matrix , and its extrinsic matrix , we seek to produce a multi-label binary semantic map in gravity-aligned frame where is the number of semantic classes. To achieve this, we build on OrienterNet [30], designed for top-down map localization, as the front-end architecture. This choice accommodates different camera characteristics and pose information from IMUs, thereby leveraging the orientation data from OSM and Mapillary. We add a decoder head on the BEV features (obtained post 2D-to-3D lifting of FPV features) to predict a semantic map, thereby maintaining simplicity in the model architecture. Furthermore, to improve generalization capability, we replace the ResNet encoder with the DINOv2 encoder [25]. For training, we resize and pad images to a 512 x 512 square, applying weighted Dice and Binary Cross Entropy Loss to the BEV pixels within the image frustum. We use DINOv2 ViT-B/14 [25] with registers [9] as the image encoder. We further augment the dataset with brightness, contrast, and color jittering. We train with a batch size of 128 for 15 epochs, which takes approximately 4 hours using 4 NVIDIA-H100 GPUs. The supplementary material provides more details on the model and training, along with a figure of the model pipeline.
5 Experimental Setup
To evaluate generalizability, we test our Mapper model and baselines on multiple datasets, including our diverse MIA dataset and conventional map prediction datasets.
Conventional Datasets: We evaluate our model on BEV map segmentation benchmarks: NuScenes [4] and KITTI360-BEV [13], to demonstrate the generalizability of a model trained on MIA when applied to established datasets. We follow the BEV generation procedure in [28] for NuScenes. Both datasets are collected from on-road vehicles and present challenges such as occlusions, different times of day, and varying weather conditions. We adhere to the conventional(geographically non-overlapping) data set splits: Roddick et al.’s [28] split for NuScenes and Gosala et al.’s split [13] for KITTI360-BEV. Since we focus on static class map prediction, we exclude dynamic elements from the dataset labels before training. For NuScenes, we use only the static map layers, and for KITTI360-BEV, we remove dynamic object labels. In the experiments, we use the front-facing camera data to evaluate monocular camera BEV map prediction. Class mappings between the datasets are provided in Table 5 of the appendix.
MIA Dataset: We utilize the MIA dataset to assess performance in diverse urban and rural settings not captured by previous datasets, including held-out environments. Specifically, we split our dataset into two settings: MIA-ID (New York, Los Angeles, San Francisco, Chicago) represents in-distribution urban areas, MIA-OOD (Houston, Pittsburgh) tests the generalization ability in held-out urban settings. Furthermore, we use MIA-Rural to provide a more challenging out-of-distribution evaluation. For each location, we generate an 80% train / 10% validation / 10% test split, ensuring the splits are geographically disparate as illustrated in Fig. 8 of the appendix.
Metrics: We adhere to standard conventions [29, 13] to calculate the Intersection-over-Union (IoU) score using binarized predictions with a threshold of 0.5. The IoU score is computed over the observable area as defined by the visibility mask, based on LiDAR observations or the visibility frustum. Since there is no LiDAR sensing in the MIA dataset, we generate a heuristic-based visibility mask by raycasting from the robot’s position, ending 4 pixels into a building. To be consistent with SkyEye evaluations [13], in KITTI360-BEV, we also include occluded areas within image frustum for IoU calculation. For all datasets, we performed comparisons over a 50m x 50m area with a resolution of 0.5m/pixel. Consistent with prior work [29, 13], we report the macro-mean IoU over all classes. In addition, for a fair comparison across different methods and datasets, we report the macro-mean IoU over the two classes common in all datasets, road & sidewalk.
Baselines: We compare our results with previously published methods that focus on the monocular single-camera setting, specifically Translating Images into Maps (TIIM) [29], which was trained and tested on NuScenes [4], and SkyEye, which was tested on KITTI360-BEV [13]. While newer methods have been proposed [39, 6], TIIM is the most recent method with available code, to our knowledge. We follow the training protocols described in the respective papers and code, with slight modifications to train for static classes. For evaluation, images are processed to meet the requirements of each method. To test the baseline models on datasets they were not trained on, we follow Gosala et al. [13] and resize the image to match the focal length of the model’s training dataset. More details on baseline implementation are provided in supplementary material and appendix.
6 Results & Discussion
We firstly evaluate Mapper zero-shot against the baselines. Next, we test MIA’s effectiveness for pre-training by finetuning Mapper on limited data from an existing dataset. Finally, we stress test all models in extreme out-of-distribution scenarios to highlight future opportunities enabled by MIA.
6.1 MIA can go more "anywhere" out-of-the-box
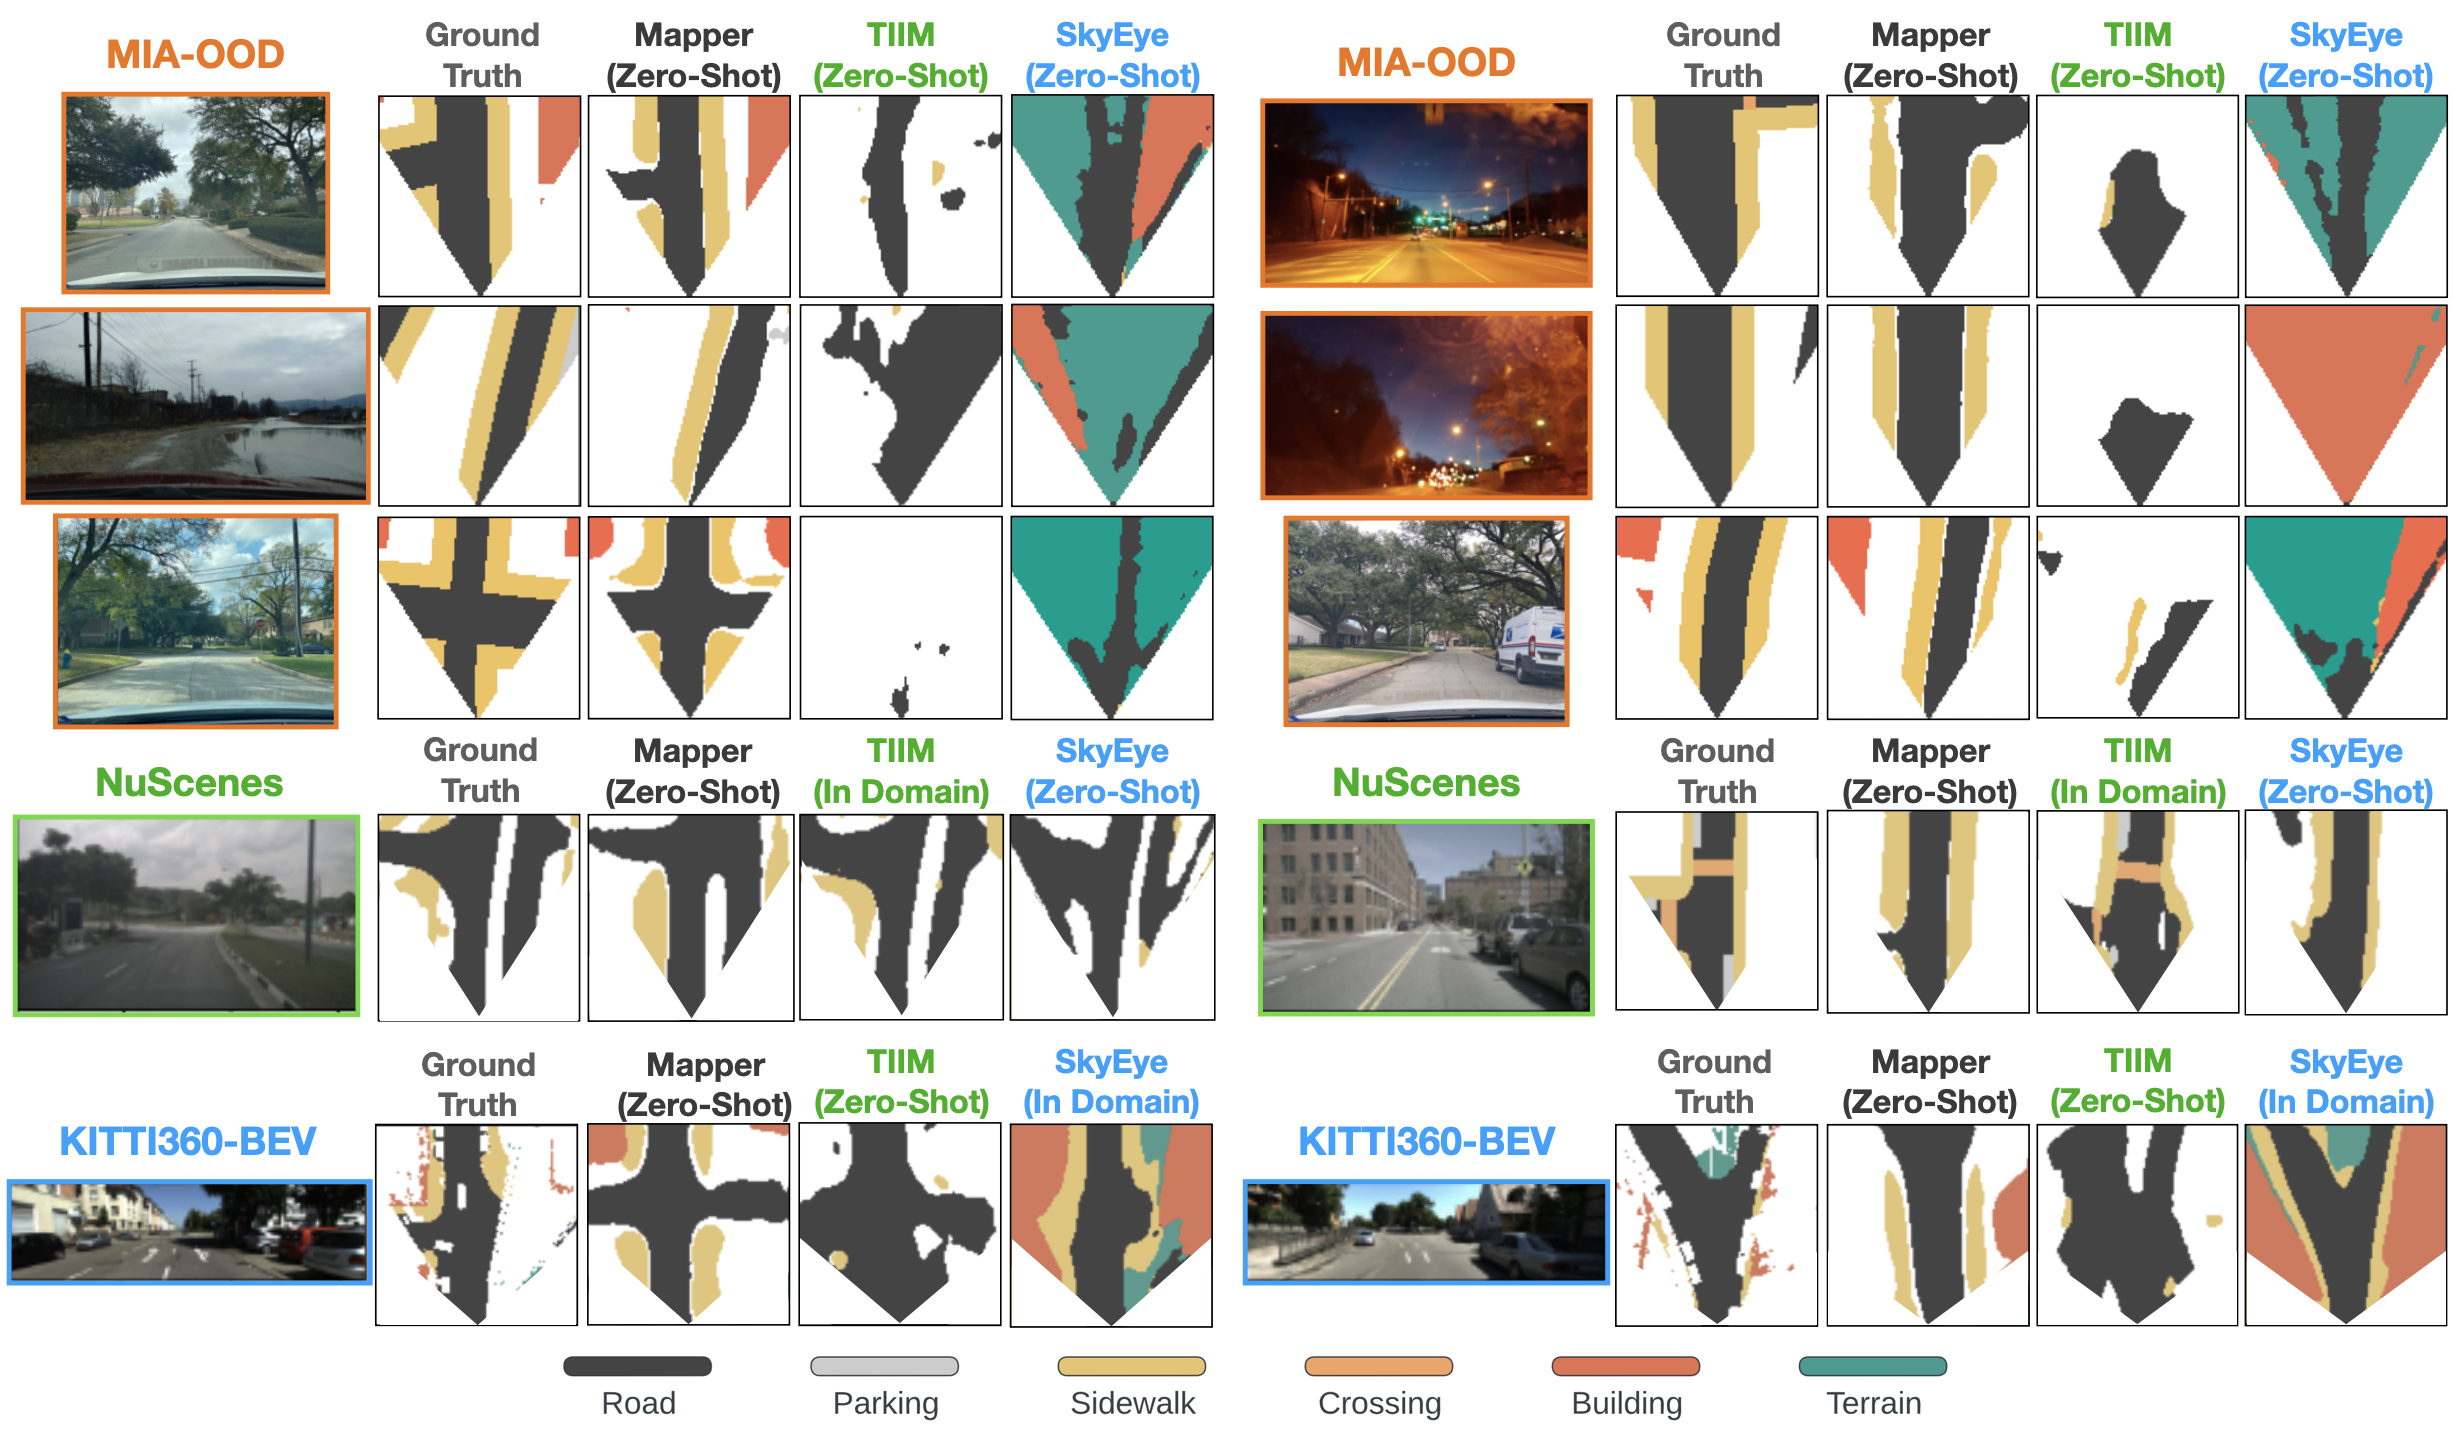
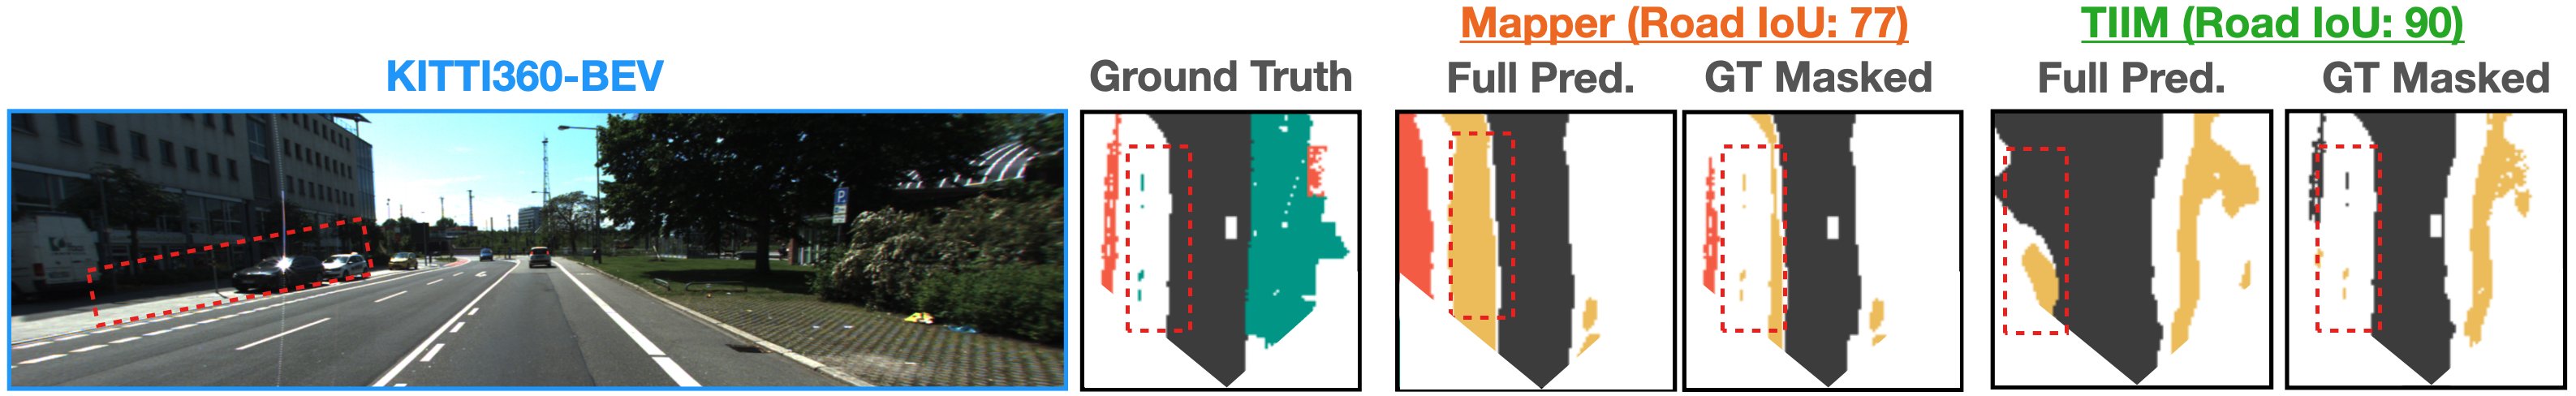
Section 6.3 demonstrates the generalizability of Mapper, trained with the MIA-ID dataset, over both zero-shot & fully-supervised baselines, in particular on the NuScenes and MIA-OOD environments. Fig. 5 visually compares the model predictions, where Mapper provides more realistic predictions across the datasets compared to the zero-shot baseline, which often fails due to the distribution change caused by unseen location, different camera models, or severe weather conditions. When comparing average IoU of Road and Sidewalk, Mapper achieves superior zero-shot result in NuScenes val [4] and MIA-OOD, with improvements of 33% and 144%, respectively. Notably, in NuScenes and MIA-OOD, Mapper performs comparably to fully supervised methods (trained with in-domain data) in road and sidewalk classes. While Mapper performs consistently with TIIM (trained on NuScenes) when tested on KITTI360-BEV [13], Mapper provides more realistic predictions overall, especially in non-road regions where TIIM tends to overpredict roads. However, due to the limitations of KITTI360-BEV, where much of the map is unlabeled and IoU is only measured in labeled regions, as illustrated in Fig. 6, it is challenging to perform effective benchmarking and comparisons.
6.2 Pre-training on MIA enables effective fine-tuning with limited data
We also test if the MIA dataset can provide effective pretraining for new map prediction tasks. Specifically, we finetune Mapper with 10% and 1% of NuScenes data. For comparison, we use the same data split to train TIIM [29]. To fine-tune Mapper, we map the new training dataset classes to MIA classes as described in Table 5 of appendix. Details on training, fine-tuning and data splits are available in the appendix and supplementary material. Section 6.3 shows that Mapper can be effectively fine-tuned on specific environments with limited new map prediction data. Notably, the experiment suggests that MIA provides effective pretraining for map prediction, as fine-tuning the pre-trained Mapper yields improved results compared to training TIIM solely on the data subset.
6.3 MIA provides challenging settings for future work on anywhere map prediction
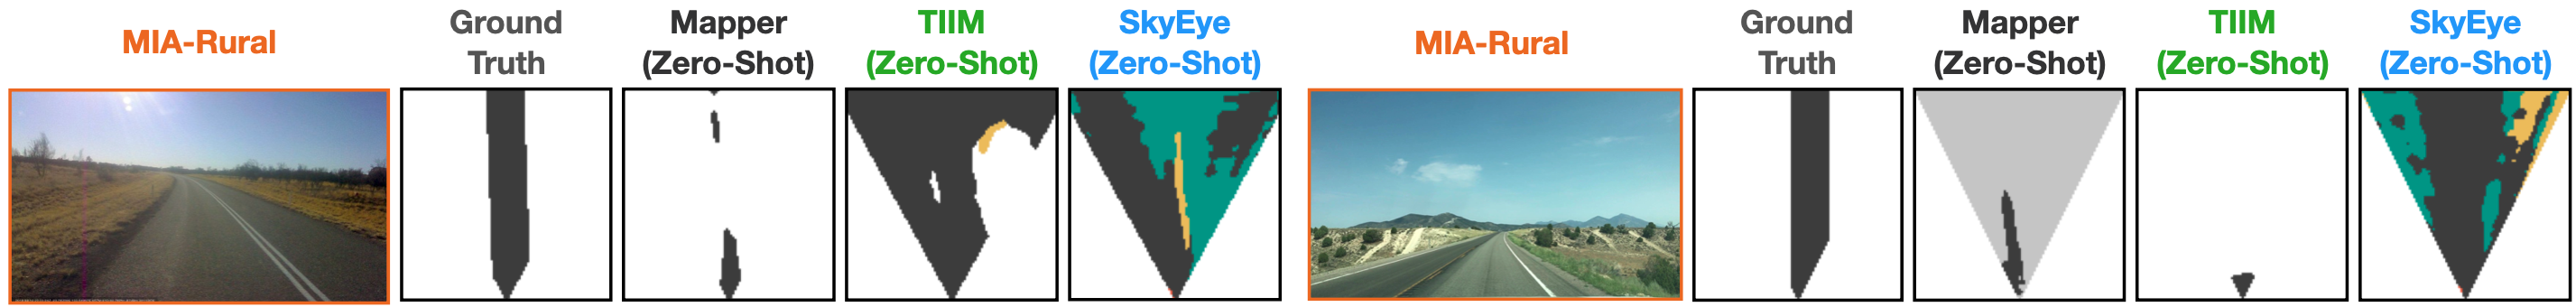
To test model generalizability, we further curate MIA-Rural, which is far from the training distribution. Fig. 7 shows an example predictions from highway images where all models, including our proposed Mapper, fail to generalize. Quantitatively, on the entirety of MIA-Rural, the average IoU between road and sidewalks (Avg. R, S) is 21.04 for Mapper, 20.55 for TIIM [29] and 18.62 for SkyEye [13]. This further illustrates the research need for an anywhere map prediction dataset.
| Methods | In-Domain | Road | Crossing | Sidewalks | Building | Parking | Terrain | Avg. | Avg. R, S |
| Mapper+OOD | 58.28 | 0.05 | 30.75 | 13.80 | 13.79 | 6.70 | 20.56 | 44.52 | |
| \cdashline1-10 TIIM [29] | 32.74 | 0.00 | 1.47 | 0.00 | 0.00 | 0.00 | 5.70 | 17.11 | |
| SkyEye [13] | 33.09 | 0.00 | 1.18 | 5.70 | 0.00 | 2.67 | 7.11 | 17.14 | |
| Mapper | 54.65 | 0.06 | 27.55 | 15.78 | 2.66 | 1.83 | 17.09 | 41.10 |
| Methods | Data % | Drivable | Crossing | Walkway | Carpark | Mean |
| Mapper | 0% | 64.22 | 0.06 | 27.71 | 0.04 | 23.01 |
| \cdashline1-7 TIIM [29] | 1% | 57.80 | 3.11 | 12.66 | 0.10 | 18.42 |
| Mapper | 1% | 70.83 | 0.25 | 26.99 | 0.08 | 24.54 |
| \cdashline1-7 TIIM [29] | 10% | 61.12 | 23.69 | 14.52 | 1.53 | 25.22 |
| Mapper | 10% | 75.06 | 12.41 | 19.84 | 0.00 | 26.83 |
| \cdashline1-7 TIIM [29] | 100% | 68.63 | 29.41 | 27.03 | 7.70 | 33.19 |
7 Conclusion
In this work, we propose MIA, a data curation pipeline aimed at empowering anywhere BEV map prediction from FPV images. We release a large MIA dataset obtained through the data engine giving the research community access to 1.2M FPV-BEV pairs to accelerate anywhere map prediction research. Results from training on the dataset show impressive generalization performance across conventional map prediction datasets, while on the other hand, provides challenging test cases for the research community. Our approach departs from the traditional and expensive autonomous vehicle data collection and labeling paradigm, towards automatic curation of readily-available crowd-sourced data. We believe this work seeds the first step towards anywhere map prediction.
7.1 Limitations, Biases, Social Impact
While we show promising generalization performance on conventional datasets, we note that label noise inherently exists, to a higher degree than manually collected data, in crowd-sourced data, in both pose correspondence and in BEV map labeling. Such noise is common across large-scale automatically scraped/curated benchmarks such as ImageNet [10]. Moreover, our approach does not capture dynamic classes as they do not exist in static maps. However, we see our approach as indispensable for scale and diversity yet complementary to conventionally obtained datasets. While we recognize that our sampled dataset is biased towards locations in the US, our MIA data engine is directly applicable to other worldwide locations.
Negative Societal Impact: Our work relies heavily on crowd-sourced data, which places the burden of data collection on open-source contributors. Additionally, while the FPV images and metadata from Mapillary are desensitized, there remains a potential risk of reconstructing private information.
Acknowledgments and Disclosure of Funding
The work is funded by National Institute of Advanced Industrial Science and Technology (AIST), Army Research Lab (ARL) awards W911NF2320007 and W911NF1820218 and W911NF20S0005, Defence Science and Technology Agency (DSTA). Omar Alama is partially funded by King Abdulaziz University. This work used Bridges-2 at PSC through allocation cis220039p from the Advanced Cyberinfrastructure Coordination Ecosystem: Services & Support (ACCESS) program which is supported by NSF grants #2138259, #2138286, #2138307, #2137603, and #213296.
We thank Mihir Sharma for his work on related research curation and exploration into potential extensions involving terrain height extraction. We thank Mononito Goswami for invaluable discussions on paper organization, framing, experimental design, and project feedback. Additionally, we appreciate David Fan, Simon Stepputtis, and Yaqi Xie for their insightful feedback throughout the project.
References
- Aich et al. [2024] Shubhra Aich, Wenshan Wang, Parv Maheshwari, Matthew Sivaprakasam, Samuel Triest, Cherie Ho, Jason M Gregory, John G Rogers III, and Sebastian Scherer. Deep bayesian future fusion for self-supervised, high-resolution, off-road mapping. arXiv preprint arXiv:2403.11876, 2024.
- Antequera et al. [2020] Manuel López Antequera, Pau Gargallo, Markus Hofinger, Samuel Rota Bulò, Yubin Kuang, and Peter Kontschieder. Mapillary planet-scale depth dataset. In Computer Vision – ECCV 2020: 16th European Conference, Glasgow, UK, August 23–28, 2020, Proceedings, Part II, page 589–604, Berlin, Heidelberg, 2020. Springer-Verlag. ISBN 978-3-030-58535-8. doi: 10.1007/978-3-030-58536-5_35. URL https://doi.org/10.1007/978-3-030-58536-5_35.
- Bernhard et al. [2023] Maximilian Bernhard, Niklas Strauß, and Matthias Schubert. Mapformer: Boosting change detection by using pre-change information. March 2023. doi: 10.48550/ARXIV.2303.17859.
- Caesar et al. [2020] Holger Caesar, Varun Bankiti, Alex H. Lang, Sourabh Vora, Venice Erin Liong, Qiang Xu, Anush Krishnan, Yu Pan, Giancarlo Baldan, and Oscar Beijbom. nuscenes: A multimodal dataset for autonomous driving, 2020.
- Chang et al. [2019] Ming-Fang Chang, John W Lambert, Patsorn Sangkloy, Jagjeet Singh, Slawomir Bak, Andrew Hartnett, De Wang, Peter Carr, Simon Lucey, Deva Ramanan, and James Hays. Argoverse: 3d tracking and forecasting with rich maps. In Conference on Computer Vision and Pattern Recognition (CVPR), 2019.
- Chen et al. [2024] Yongquan Chen, Weiming Fan, Wenli Zheng, Rui Huang, and Jiahui Yu. Predicting bird’s-eye-view semantic representations using correlated context learning. IEEE Robotics and Automation Letters, 9(5):4718–4725, 2024. doi: 10.1109/LRA.2024.3384078.
- contributors [2013] Mapillary contributors. Mapillary. https://www.mapillary.com/, 2013.
- contributors [2017] OpenStreetMap contributors. Planet dump retrieved from https://planet.osm.org. https://www.openstreetmap.org, 2017.
- Darcet et al. [2023] Timothée Darcet, Maxime Oquab, Julien Mairal, and Piotr Bojanowski. Vision transformers need registers, 2023.
- Deng et al. [2009] J. Deng, W. Dong, R. Socher, L.-J. Li, K. Li, and L. Fei-Fei. ImageNet: A Large-Scale Hierarchical Image Database. In CVPR09, 2009.
- Gorelick et al. [2017] Noel Gorelick, Matt Hancher, Mike Dixon, Simon Ilyushchenko, David Thau, and Rebecca Moore. Google earth engine: Planetary-scale geospatial analysis for everyone. Remote Sensing of Environment, 2017. doi: 10.1016/j.rse.2017.06.031. URL https://doi.org/10.1016/j.rse.2017.06.031.
- Gosala and Valada [2022] Nikhil Gosala and Abhinav Valada. Bird’s-eye-view panoptic segmentation using monocular frontal view images. IEEE Robotics and Automation Letters, 7(2):1968–1975, April 2022. ISSN 2377-3774. doi: 10.1109/lra.2022.3142418.
- Gosala et al. [2023] Nikhil Gosala, Kürsat Petek, Paulo L. J. Drews-Jr, Wolfram Burgard, and Abhinav Valada. Skyeye: Self-supervised bird’s-eye-view semantic mapping using monocular frontal view images. In 2023 IEEE/CVF Conference on Computer Vision and Pattern Recognition (CVPR), pages 14901–14910. IEEE, 2023. doi: 10.1109/CVPR52729.2023.01431.
- Ho et al. [2021] Cherie Ho, Jay Patrikar, Rogerio Bonatti, and Sebastian Scherer. Adaptive safety margin estimation for safe real-time replanning under time-varying disturbance. arXiv preprint arXiv:2110.03119, 2021.
- Hu et al. [2018] Sixing Hu, Mengdan Feng, Rang Ho Man Nguyen, and Gim Hee Lee. Cvm-net: Cross-view matching network for image-based ground-to-aerial geo-localization. 2018 IEEE/CVF Conference on Computer Vision and Pattern Recognition, pages 7258–7267, 2018. URL https://api.semanticscholar.org/CorpusID:52829753.
- Jafarzadeh et al. [2021] Ara Jafarzadeh, Manuel López Antequera, Pau Gargallo, Yubin Kuang, Carl Toft, Fredrik Kahl, and Torsten Sattler. Crowddriven: A new challenging dataset for outdoor visual localization. In Proceedings of the IEEE/CVF International Conference on Computer Vision (ICCV), pages 9845–9855, October 2021.
- Jin et al. [2024] Lihong Jin, Wei Dong, and Michael Kaess. Bevrender: Vision-based cross-view vehicle registration in off-road gnss-denied environment, 2024. URL https://arxiv.org/abs/2405.09001.
- Lang et al. [2019] Alex H Lang, Sourabh Vora, Holger Caesar, Lubing Zhou, Jiong Yang, and Oscar Beijbom. Pointpillars: Fast encoders for object detection from point clouds. In Proceedings of the IEEE/CVF conference on computer vision and pattern recognition, pages 12697–12705, 2019.
- Li et al. [2022] Zhiqi Li, Wenhai Wang, Hongyang Li, Enze Xie, Chonghao Sima, Tong Lu, Qiao Yu, and Jifeng Dai. Bevformer: Learning bird’s-eye-view representation from multi-camera images via spatiotemporal transformers, 2022.
- Liao et al. [2022] Yiyi Liao, Jun Xie, and Andreas Geiger. KITTI-360: A novel dataset and benchmarks for urban scene understanding in 2d and 3d. Pattern Analysis and Machine Intelligence (PAMI), 2022.
- Liu et al. [2023] Zhijian Liu, Haotian Tang, Alexander Amini, Xinyu Yang, Huizi Mao, Daniela L Rus, and Song Han. Bevfusion: Multi-task multi-sensor fusion with unified bird’s-eye view representation. In 2023 IEEE international conference on robotics and automation (ICRA), pages 2774–2781. IEEE, 2023.
- Lu et al. [2018] Chenyang Lu, Marinus Jacobus Gerardus van de Molengraft, and Gijs Dubbelman. Monocular semantic occupancy grid mapping with convolutional variational encoder-decoder networks. IEEE Robotics and Automation Letters, 4(2):445–452, April 2018. ISSN 2377-3774. doi: 10.1109/lra.2019.2891028.
- Mani et al. [2020] Kaustubh Mani, Swapnil Daga, Shubhika Garg, Sai Shankar Narasimhan, Madhava Krishna, and Krishna Murthy Jatavallabhula. Monolayout: Amodal scene layout from a single image. In Proceedings of the IEEE/CVF Winter Conference on Applications of Computer Vision, pages 1689–1697, 2020.
- Meng et al. [2023] Xiangyun Meng, Nathan Hatch, Alexander Lambert, Anqi Li, Nolan Wagener, Matthew Schmittle, JoonHo Lee, Wentao Yuan, Zoey Chen, Samuel Deng, Greg Okopal, Dieter Fox, Byron Boots, and Amirreza Shaban. TerrainNet: Visual Modeling of Complex Terrain for High-speed, Off-road Navigation. In Robotics: Science and Systems (R:SS), 2023.
- Oquab et al. [2023] Maxime Oquab, Timothée Darcet, Théo Moutakanni, Huy Vo, Marc Szafraniec, Vasil Khalidov, Pierre Fernandez, Daniel Haziza, Francisco Massa, Alaaeldin El-Nouby, Mahmoud Assran, Nicolas Ballas, Wojciech Galuba, Russell Howes, Po-Yao Huang, Shang-Wen Li, Ishan Misra, Michael Rabbat, Vasu Sharma, Gabriel Synnaeve, Hu Xu, Hervé Jegou, Julien Mairal, Patrick Labatut, Armand Joulin, and Piotr Bojanowski. Dinov2: Learning robust visual features without supervision, 2023.
- Otte et al. [2007] Michael W Otte, Scott G Richardson, Jane Mulligan, and Gregory Grudic. Local path planning in image space for autonomous robot navigation in unstructured environments. In 2007 IEEE/RSJ International Conference on Intelligent Robots and Systems, pages 2819–2826. IEEE, 2007.
- Philion and Fidler [2020] Jonah Philion and Sanja Fidler. Lift, splat, shoot: Encoding images from arbitrary camera rigs by implicitly unprojecting to 3d. In Computer Vision–ECCV 2020: 16th European Conference, Glasgow, UK, August 23–28, 2020, Proceedings, Part XIV 16, pages 194–210. Springer, 2020.
- Roddick and Cipolla [2020] Thomas Roddick and Roberto Cipolla. Predicting semantic map representations from images using pyramid occupancy networks. arXiv, 2020. doi: 10.48550/ARXIV.2003.13402.
- Saha et al. [2022] Avishkar Saha, Oscar Mendez, Chris Russell, and Richard Bowden. Translating images into maps. In 2022 International conference on robotics and automation (ICRA), pages 9200–9206. IEEE, 2022.
- Sarlin et al. [2023] Paul-Edouard Sarlin, Daniel DeTone, Tsun-Yi Yang, Armen Avetisyan, Julian Straub, Tomasz Malisiewicz, Samuel Rota Bulo, Richard Newcombe, Peter Kontschieder, and Vasileios Balntas. OrienterNet: Visual Localization in 2D Public Maps with Neural Matching. In CVPR, 2023.
- Sarlin et al. [2024] Paul-Edouard Sarlin, Eduard Trulls, Marc Pollefeys, Jan Hosang, and Simon Lynen. Snap: Self-supervised neural maps for visual positioning and semantic understanding. Advances in Neural Information Processing Systems, 36, 2024.
- Sun et al. [2020] Pei Sun, Henrik Kretzschmar, Xerxes Dotiwalla, Aurelien Chouard, Vijaysai Patnaik, Paul Tsui, James Guo, Yin Zhou, Yuning Chai, Benjamin Caine, Vijay Vasudevan, Wei Han, Jiquan Ngiam, Hang Zhao, Aleksei Timofeev, Scott Ettinger, Maxim Krivokon, Amy Gao, Aditya Joshi, Yu Zhang, Jonathon Shlens, Zhifeng Chen, and Dragomir Anguelov. Scalability in perception for autonomous driving: Waymo open dataset. In Proceedings of the IEEE/CVF Conference on Computer Vision and Pattern Recognition (CVPR), June 2020.
- Triest et al. [2023] Samuel Triest, Mateo Guaman Castro, Parv Maheshwari, Matthew Sivaprakasam, Wenshan Wang, and Sebastian Scherer. Learning risk-aware costmaps via inverse reinforcement learning for off-road navigation. In 2023 IEEE International Conference on Robotics and Automation (ICRA), pages 924–930. IEEE, 2023.
- Vartanov [2022] Sergey Vartanov. Mapmachine. https://github.com/enzet/map-machine, 2022.
- Warburg et al. [2020] Frederik Warburg, Søren Hauberg, Manuel López-Antequera, Pau Gargallo, Yubin Kuang, and Javier Civera. Mapillary street-level sequences: A dataset for lifelong place recognition. In Computer Vision and Pattern Recognition (CVPR), June 2020.
- Wilson et al. [2021] Benjamin Wilson, William Qi, Tanmay Agarwal, John Lambert, Jagjeet Singh, Siddhesh Khandelwal, Bowen Pan, Ratnesh Kumar, Andrew Hartnett, Jhony Kaesemodel Pontes, Deva Ramanan, Peter Carr, and James Hays. Argoverse 2: Next generation datasets for self-driving perception and forecasting. In Proceedings of the Neural Information Processing Systems Track on Datasets and Benchmarks (NeurIPS Datasets and Benchmarks 2021), 2021.
- Wu et al. [2023] Xindi Wu, KwunFung Lau, Francesco Ferroni, Aljoša Ošep, and Deva Ramanan. Pix2map: Cross-modal retrieval for inferring street maps from images. In Proceedings of the IEEE/CVF Conference on Computer Vision and Pattern Recognition, pages 17514–17523, 2023.
- Zhang et al. [2023] Zhixin Zhang, Yiyuan Zhang, Xiaohan Ding, Fusheng Jin, and Xiangyu Yue. Online vectorized hd map construction using geometry. arXiv preprint arXiv:2312.03341, 2023.
- Zhao et al. [2024] Tianhao Zhao, Yongcan Chen, Yu Wu, Tianyang Liu, Bo Du, Peilun Xiao, Shi Qiu, Hongda Yang, Guozhen Li, Yi Yang, and Yutian Lin. Improving bird’s eye view semantic segmentation by task decomposition. arXiv, 2024. doi: 10.48550/ARXIV.2404.01925.
- Zhu et al. [2020] Sijie Zhu, Taojiannan Yang, and Chen Chen. Vigor: Cross-view image geo-localization beyond one-to-one retrieval. 2021 IEEE/CVF Conference on Computer Vision and Pattern Recognition (CVPR), pages 5316–5325, 2020. URL https://api.semanticscholar.org/CorpusID:227151840.
- Zhu et al. [2023] Xiyue Zhu, Vlas Zyrianov, Zhijian Liu, and Shenlong Wang. Mapprior: Bird’s-eye view map layout estimation with generative models. In Proceedings of the IEEE/CVF International Conference on Computer Vision, pages 8228–8239, 2023.
Appendix A Appendix
A.1 Filtering Pipeline Yields
Table 3 shows the yield of data samples from the different stages of the MIA curation pipeline. Table 4 presents a statistics breakdown on the locations.
| Curation Stage | Boundaries | Recency | Camera Model | Angle Discrip | Loc Discrip | Spatial |
| # Images | 15.93M | 12.21M | 3.049M | 2.606M | 1.353M | 1.204M |
| % Images | 100.00% | 76.67% | 19.15% | 16.36% | 8.50% | 7.56% |
| Stage | PT | NY | CG | LA | SF | HS | ALL |
| Boundaries | 914.1K | 3.161M | 1.422M | 4.150M | 2.825M | 3451961 | 15.93M |
| Recency | 867.0K | 2.999M | 1.281M | 4.055M | 2.100M | 908.5K | 12.21M |
| Camera Model | 31.0K | 270.5K | 478.5K | 1.917M | 294.9K | 57.3K | 3.049M |
| Angle Discrip | 25.7K | 177.6K | 433.6K | 1.758M | 156.9K | 54.0K | 2.606M |
| Loc Discrip | 18.0K | 89.8K | 196.6K | 958.6K | 59.2K | 31.1K | 1.353M |
| Spatial | 15.9K | 79.2K | 162.4K | 879.4K | 37.7K | 29.4K | 1.204M |
A.2 Dataset Split Visualization
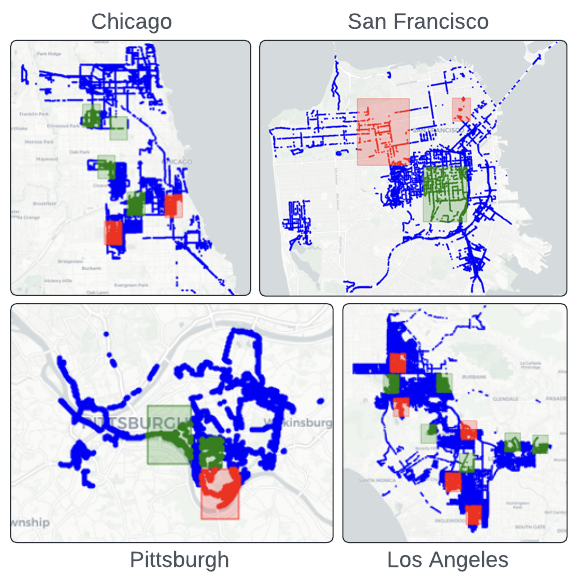
MIA dataset is split into train, validation, and test partitions based on the location. We ensure that the samples in the three partitions are geographically non-overlapping, as shown in Fig. 8.
A.3 Intra-Dataset Class Mappings
As different dataset captures different map elements, we map the classes from NuScenes and KITTI360-BEV carefully to MIA, as shown in Table 5.
A.4 Hyperparameters
We release our pipeline hyperparameters in this section. We use Table 6 in our data engine; Table 7 for pretraining Mapper using MIA dataset; and Table 8, Table 9 for NuScenes and KITTI-360 fine-tuning.
| Parameter | Value | ||
| 224 | |||
| 50 | |||
| 0.5 | |||
| Recency Filter | 2017 | ||
| Location Discrepancy | 3m | ||
| Angle Discrepancy | 20° | ||
| Sparsity Filter | 4m | ||
| Camera Models |
|
| Data | Model | ||
| Parameter | Value | Parameter | Value |
| Resize Image | 512 | Backbone Model | DINOv2 ViT-B/14 w/ registers |
| Batch Size | 128 | Latent Dimension | 128 |
| Gravity Alignment | Yes | Dropout Rate | 0.2 |
| Pad To Square | Yes | Learning Rate | 1.00E-03 |
| Rectify Pitch | Yes | LR Scheduler | Cosine Annealing LR |
| Scenes | Chicago, New York, Los Angeles, San Francisco | Losses | Dice Loss + Binary Cross Entropy Loss |
| Augmentations | Brightness, Contrast, Saturation, Random Flip, Hue | Loss Mask | Frustum |
| Class Weights | [1.00351229, 4.34782609, 1.00110121, 1.03124678, 6.69792364, 7.55857899] | ||
| Data | Model | ||
| Parameter | Value | Parameter | Value |
| Resize Image | 512 | Backbone Model | DINOv2 ViT-B/14 w/ registers |
| Batch Size | 128 | Latent Dimension | 128 |
| Gravity Alignment | Yes | Dropout Rate | 0 |
| Pad To Square | Yes | Learning Rate | 1.00E-04 |
| Rectify Pitch | Yes | LR Scheduler | Cosine Annealing LR |
| Scenes | All (Only Front Camera) | Losses | Dice Loss + Binary Cross Entropy Loss |
| Augmentations | Brightness, Contrast, Saturation, Random Flip, Hue | Loss Mask | Frustum |
| Class Weights | [1.00060036, 1.85908161, 1.0249052, 2.57267816] | ||
| Data | Model | ||
| Parameter | Value | Parameter | Value |
| Target Focal Length | 256 | Backbone Model | DINOv2 ViT-B/14 w/ registers |
| Batch Size | 32 | Latent Dimension | 128 |
| Gravity Alignment | No | Dropout Rate | 0.1 |
| Pad To Square | Yes | Learning Rate | 1.00E-04 |
| Rectify Pitch | Yes | LR Scheduler | Cosine Annealing LR |
| Scenes | All (Only Front Camera) | Losses | Dice Loss + Binary Cross Entropy Loss |
| Augmentations | Brightness, Contrast, Saturation, Random Flip, Hue | Loss Mask | Frustum + Visibility |
| Class Weights | [2.5539, 3.8968, 1.9405, 5.6612] | ||
A.5 Dataset Privacy and Consent
Our First-Person-View data source, Mapillary [7], employs measures to ensure privacy by blurring faces and license plates, thereby removing personally identifiable information. Detailed information on their privacy policy is available here. When users contribute images to Mapillary, these images are shared under the CC-BY-SA license. Further details on this licensing can be found here.
Our Bird’s Eye Map (BEV) data source, OpenStreetMap [8] provides guidance to limit mapping private information. Details can be found here.
More licensing information can be found in Table 10.
| Projects | License |
| Mapillary* [7] | CC BY-SA 4.0 |
| Open Street Map* [8] | ODbL |
| MapMachine* [34] | MIT License |
| Nuscenes† [4] | CC BY-NC-SA 4.0 |
| KITTI-360† [20] | CC BY-NC-SA 3.0 |
| KITTI-360-BEV† [13] | Non Commercial Use Only |
| OrienterNet* [30] | CC-BY-SA 4.0 |
Appendix B Additional MIA data samples
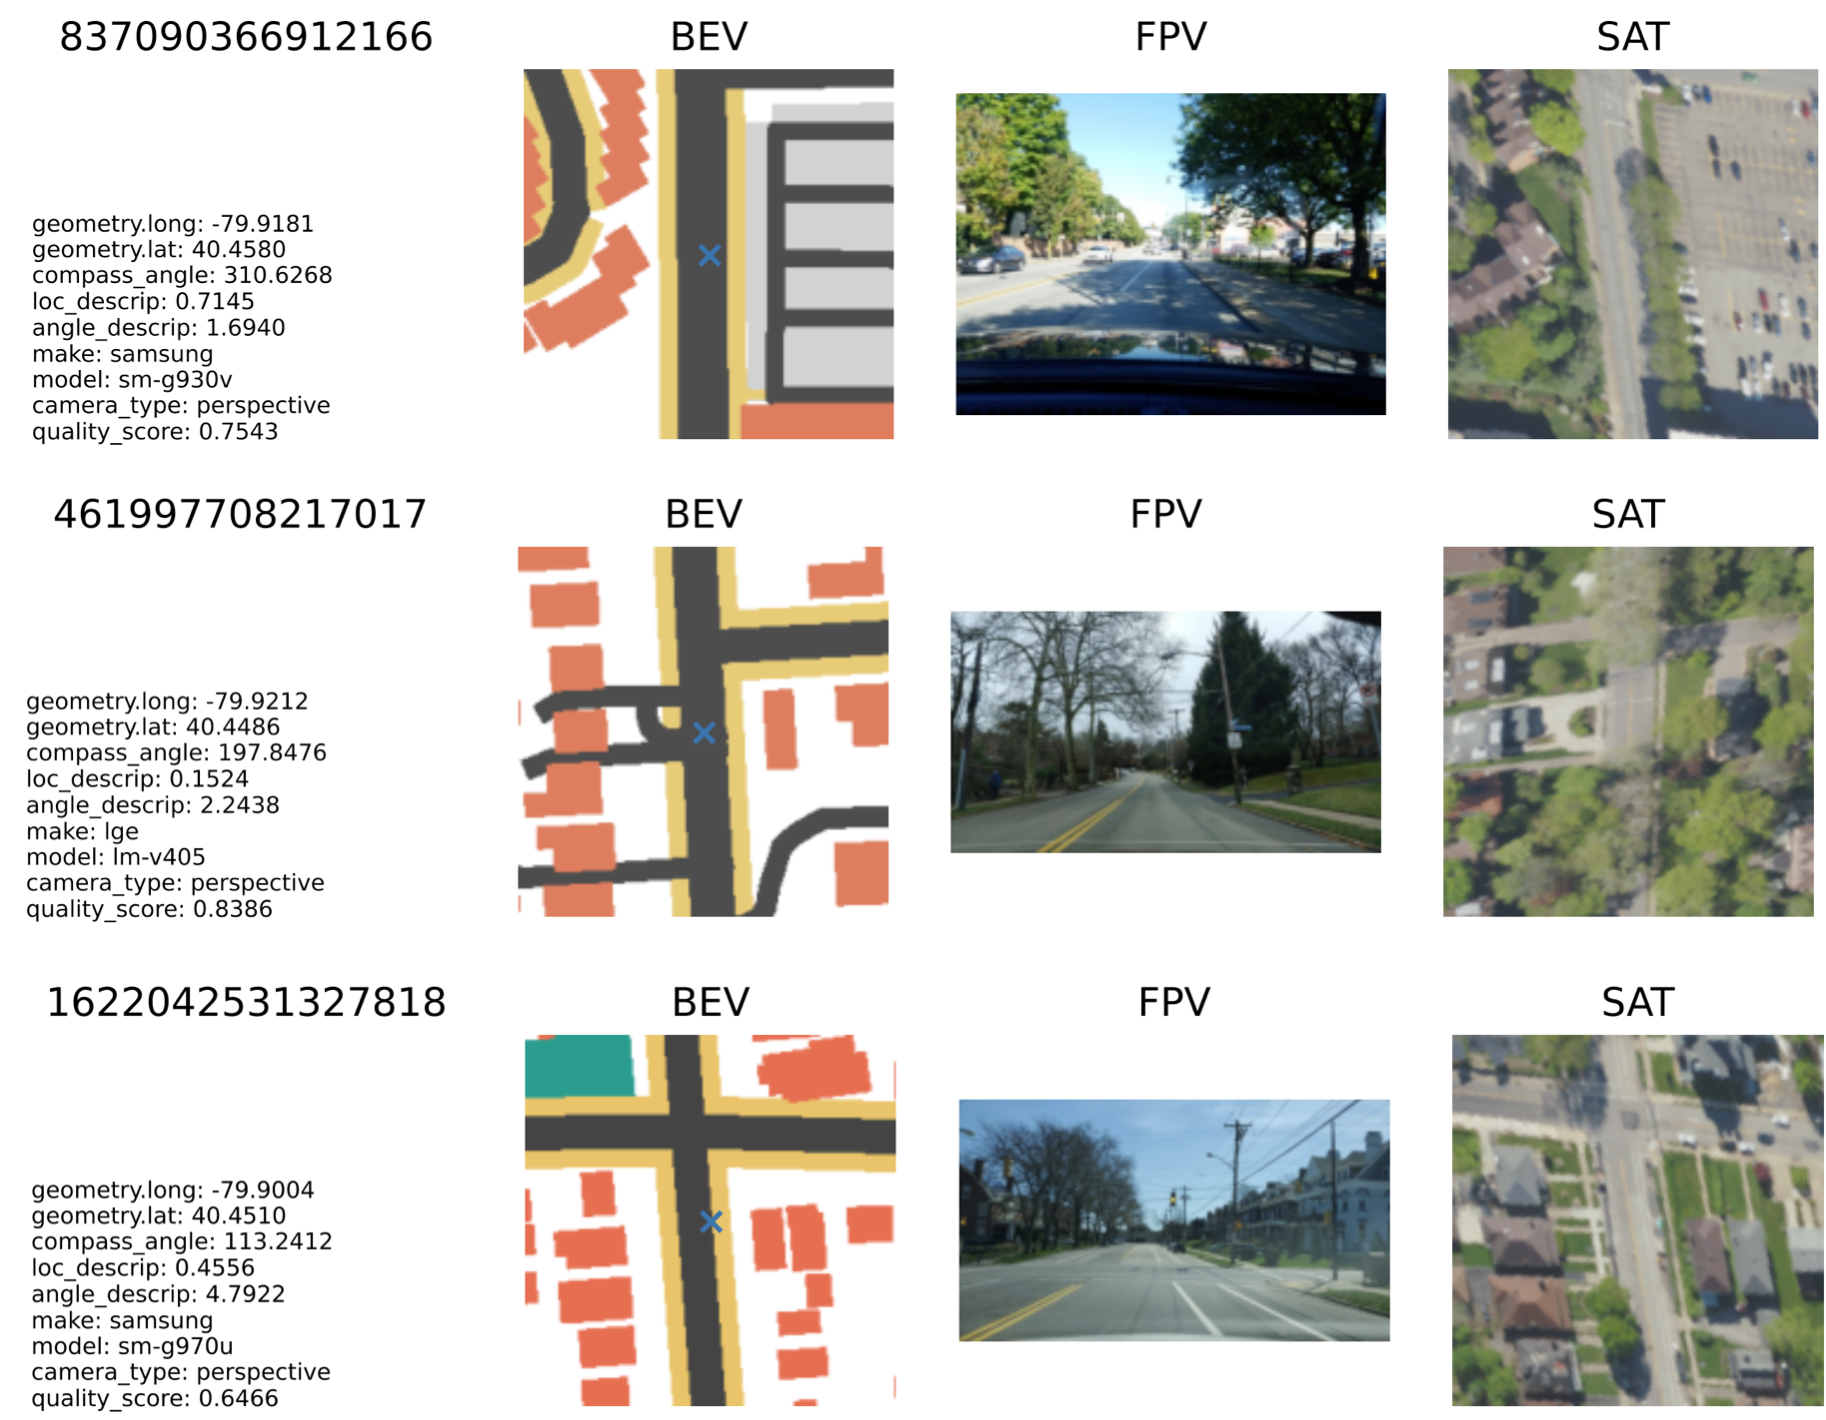
Additional data samples from MIA dataset and associated Mapillary metadata are shown in Figure 9.
Appendix C Mapper Model Architecture
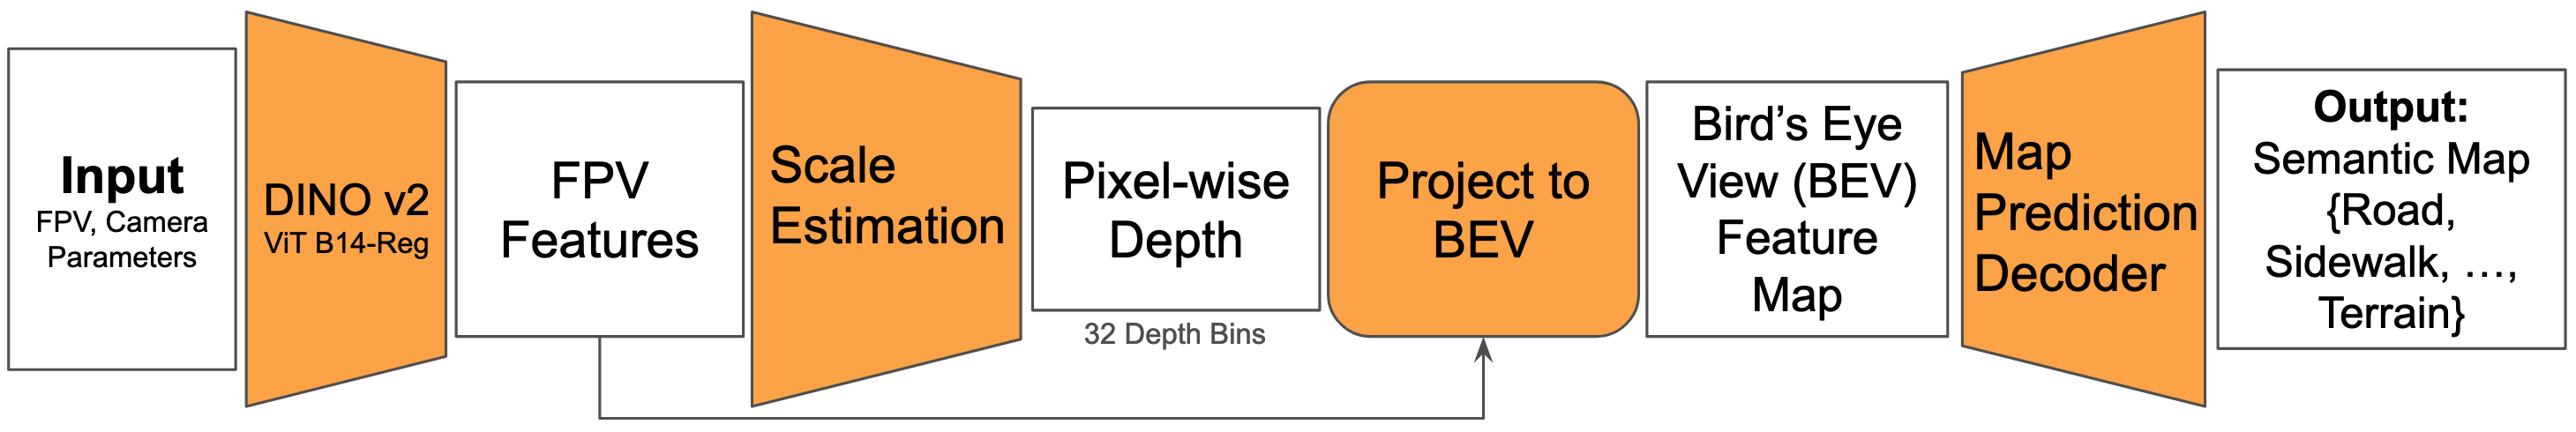
We design a simple model architecture Mapper that can leverage the diverse characteristics of the MIA dataset. As discussed in the main paper, our model builds on OrienterNet [30] as the front-end architecture. This choice is made because OrienterNet accommodates different camera characteristics (e.g. focal lengths and image size) and poses information, thereby leveraging the full information available from Mapillary.
To incorporate pose information, we adopt OrienterNet’s approach of gravity-aligning the image, ensuring that each column aligns with a gravity-aligned vertical plane in 3D [30]. Gravity alignment is essential for matching with OpenStreetMap data, as many Mapillary images are captured from vehicles on slopes, or from bicycles and hand-held cameras with varying tilt. After gravity alignment, the image is resized and padded to 512 x 512 pixels.
The processed, gravity-aligned image is then passed through an image encoder to obtain first-person view (FPV) features. Unlike OrienterNet [30], we replace its ResNet encoder with a DINOv2 ViT-B/14 [25] with registers [9] as the image encoder for improved generalizability. The FPV features are then fed into a linear layer to estimate pixel-wise scores for one of 32 scale (depth normalized by focal length) bins. These scale scores are then mapped to metric depth scores based on the focal length. The depth scores are used to project FPV features to generate a bird’s eye view feature map through polar and Cartesian projections. To adapt OrienterNet [30] to the map prediction task, we add a decoder head to the BEV features to predict the semantic map.